Article

Chitosan-Coated Nanostructured Lipid Carriers (NLCs) Incorporating Esters of Ferulic Acid with Photoprotective Activity

by
Ioanna Pitterou
1,†,
Ioanna Kostopoulou
1,†,
Maria-Anna Karadendrou
1,
Marianna Fanouria Mitsioni
1,
Christina Fountzoula
2,
Anastasios Kriebardis
3,
Marianthi Miliaronikolaki
4,
Nikolaos Paraskevopoulos
4,
Andromachi Tzani
1 and
Anastasia Detsi
1,*
1
Laboratory of Organic Chemistry, School of Chemical Engineering, National Technical University of Athens, Zografou Campus, 15780 Athens, Greece
2
Laboratory of Chemistry, Biochemistry and Cosmetic Science, Department of Biomedical Sciences, School of Health and Caring Sciences, University of West Attica, 12243 Athens, Greece
3
Laboratory of Reliability and Quality Control in Laboratory Hematology, Department of Biomedical Sciences, University of West Attica, Ag. Spyridonos, 12243 Athens, Greece
4
Cellco Chemicals SA, Terma Odou Makrygianni, 19600 Mandra, Greece
*
Author to whom correspondence should be addressed.
These authors contributed equally to this work.
Macromol 2025, 5(4), 50; https://doi.org/10.3390/macromol5040050
Submission received: 15 July 2025 / Revised: 23 September 2025 / Accepted: 10 October 2025 / Published: 16 October 2025
(This article belongs to the Special Issue Recent Trends in Carbohydrate-Based Therapeutics)

Abstract

UV radiation is responsible for acute and chronic adverse effects on the skin. In recent years, it has been shown that various phenolic acids, particularly cinnamic acid derivatives, prevent some of these effects. In the present study, the design and synthesis of three esters of ferulic acid, analogues of the octyl methoxycinnamate (OMC), one of the most commercially used filters, are presented. The esters were evaluated for their photoprotective activity against UVA and UVB radiation. The ester 3b exhibited an SPF of 9.22 and a λc value of 343.9, higher than the values of OMC (SPF value: 8.19, λc value: 337.7). The development and optimization of a novel encapsulation process of the synthesized esters in nanostructured lipid carriers (NLCs) and coating of the NLCs with chitosan was also performed. The optimization of the coating processes was performed using a Box–Behnken experimental design. The optimal nanosystems exhibited a size of 117.0 ± 5 nm, enhanced stability in dispersion, and 78% encapsulation efficiency. The nanoparticles were characterized by ATR/FT–IR, TGA, and TEM. Incorporation of the nanoparticle dispersions in a sunscreen formulation increased the SPF factor of the formulation up to 48%. The esters and nanosystems also showed a satisfactory ability to inhibit the peroxidation of linoleic acid (AAPH induced lipid peroxidation assay) (74–91% inhibition).

1. Introduction

Photoaging is the superposition of chronic damage caused by ultraviolet (UV) radiation on intrinsic aging and accounts for most skin-related changes [1]. To tackle this problem, sunscreen products are employed, containing compounds that absorb, reflect, or scatter UV radiation that reaches the skin, blocking it before it can penetrate the skin and damage essential skin components such as DNA, collagen, elastin, and lipids [2,3]. An inorganic filter sunscreen acts as a barrier reflecting most of the radiation. Chemical filters are synthetic organic molecules capable of absorbing UV radiation and converting it into radiation that is harmless to human skin [4]. Among the organic filters, there are compounds that protect against only UVA or only UVB radiation, however, “broad spectrum” filters have also been developed. These are sunscreen filters that protect against the entire spectrum of UV radiation that reaches the Earth’s surface [5].
Recently, it was proven that various phenolic acids, and mainly hydroxycinnamic acid derivatives, such as caffeic and ferulic acid, prevent erythema caused by UVB radiation in vivo and in vitro and reduce the oxidative damage caused by UV radiation [6,7]. A derivative of cinnamic acid that is widely used in industry as a UV filter in cosmetic products is the 2-ethyl-hexyl ester of 4-methoxy-cinnamic acid (known as octinoxate or octylmethoxycinnamate—OMC) (Figure 1) [8,9]. However, the use of OMC in large quantities involves some risks such as photostability problems and strong undesirable transdermal permeability [10,11].
Lipid bilayer vesicles such as liposomes have long been investigated for dermal delivery due to their biocompatibility and ability to encapsulate both hydrophilic and lipophilic molecules. However, their clinical and cosmetic application is often limited by poor physical stability including aggregation, fusion, and leakage of the encapsulated cargo over time. In contrast, nanostructured lipid carriers (NLCs), composed of a mixture of solid and liquid lipids, exhibit a less-ordered lipid matrix that provides a higher loading capacity, improved stability, and reduced risk of premature drug expulsion. These properties make NLCs particularly advantageous for the sustained dermal delivery of sunscreen agents and other cosmetic actives [12,13].
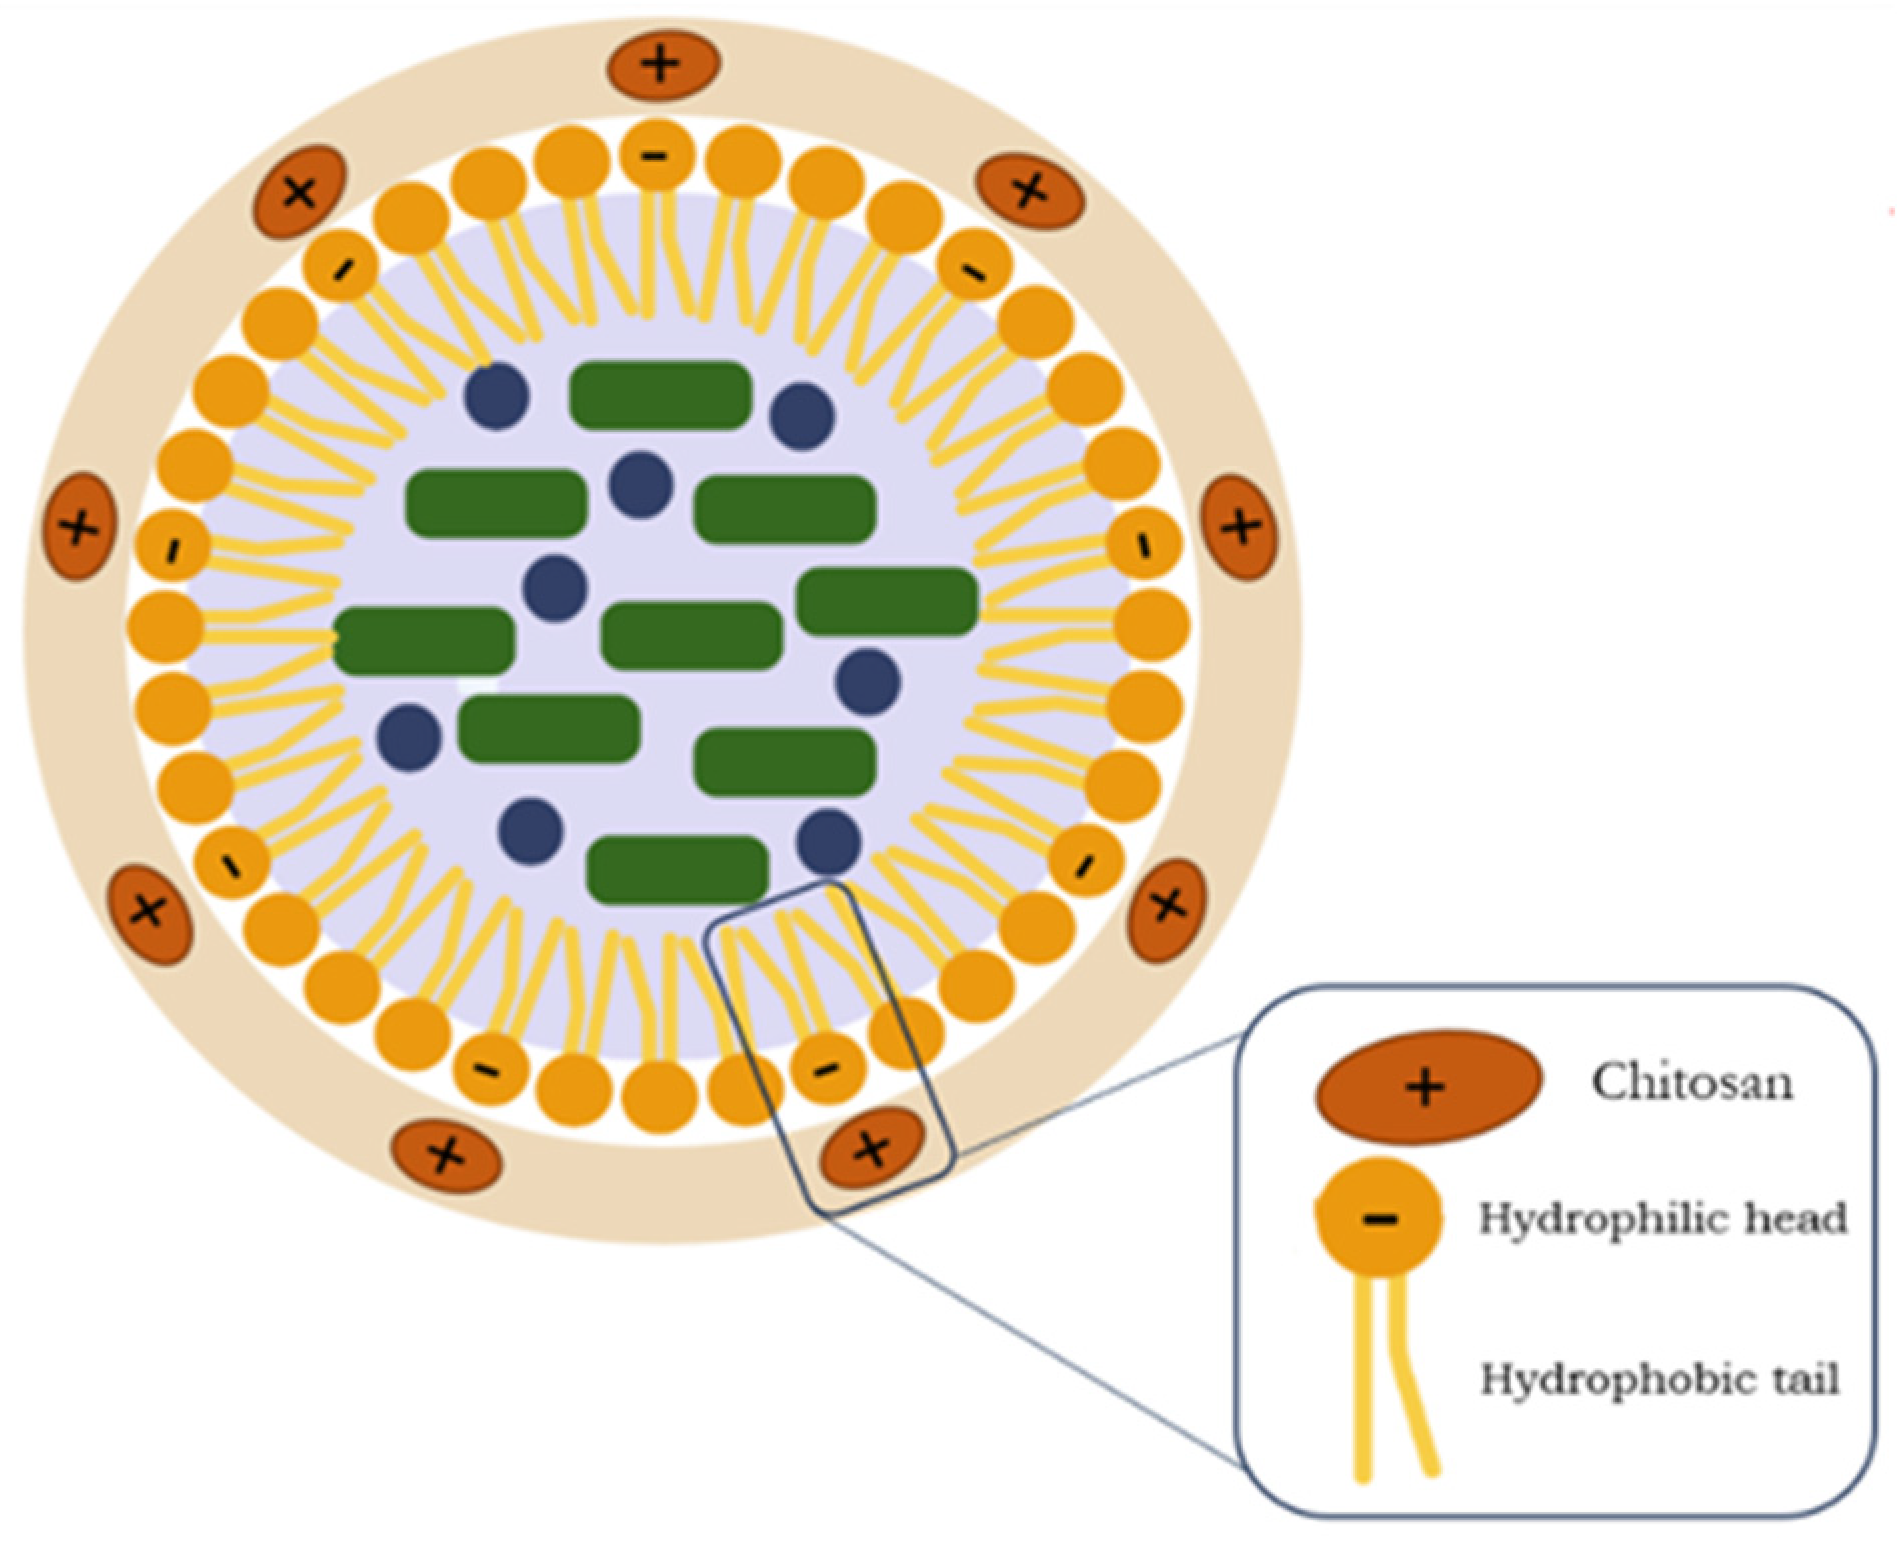
Encapsulating bioactive compounds in nanocarriers has emerged as a cutting-edge strategy to enhance solubility, stability, targeted delivery, and medicinal activity. Nanostructured lipid carriers (NLCs) are novel pharmaceutical formulations composed of natural, biodegradable, and biocompatible lipids and surfactants and are widely used for the transdermal delivery of bioactive compounds [14,15,16]. NLCs are gradually emerging as the second generation of lipid nanoparticles to overcome the disadvantages of the first generation (i.e., solid lipid nanoparticles—SLNs) [17]. The incorporation of liquid lipids (oils) into the structure causes structural defects in the original arrangement of solid lipids. This leads to a less ordered crystal structure, which prevents leakage and provides high encapsulation efficiencies (Figure 2) [18,19].
Numerous studies have investigated the encapsulation of sunscreen agents within nanostructured lipid carriers (NLCs) to enhance their photoprotective efficacy, photostability, and overall performance. For example, Nikolić et al. (2011) [20] demonstrated a synergistic interaction between lipid nanoparticles and organic UV filters, significantly improving skin photoprotection compared with conventional formulations. Similarly, Niculae et al. (2013) [21] co-encapsulated butyl methoxydibenzoylmethane (avobenzone) and octocrylene into lipid-based nanocarriers, resulting in enhanced UV performance, improved photostability, and controlled in vitro release. In another study, Prado et al. (2020) [22] developed nanostructured lipid carriers for the encapsulation of OMC, achieving an increased sun protection factor (SPF) and prolonged protective activity due to reduced photodegradation.
Εncapsulation in NLCs offers improved skin adherence and a more sustained release of active compounds, thereby reducing the frequency of reapplication and minimizing potential skin irritation [23,24]. The lipid matrix forms a protective microenvironment around the UV filters, shielding them from external stressors such as light and oxygen. This is further supported by Wang et al. (2017) [25], who emphasized that the structural composition of the solid lipid core plays a critical role in enhancing the photo-stability and release profile of the encapsulated filters. Another key advantage of NLC-based encapsulation, particularly for synthetic UV filters, is related to their poor water solubility. Lipophilic molecules, such as OMC and avobenzone, often present formulation challenges due to their low aqueous solubility. Encapsulation within lipid nanocarriers improves their dispersibility and facilitates their incorporation into aqueous-based sunscreen formulations. This strategy is not only applicable to sunscreen filters, but has also been successfully employed for other hydrophobic bioactive compounds, enhancing both their solubility and bioavailability.
Overall, compared with traditional formulations, NLC-based delivery systems exhibit superior physical and chemical stability under a range of environmental conditions, making them a promising approach in the development of more effective and safer sunscreen products.
A surface coating (i.e., the process of coating the core of the nanoparticle with a biocompatible material) is perhaps the most important process in the production of nanosystems for biomedical applications. The natural polymer chitosan (CS) is used as a material for the surface coating of nanosystems. Chitosan-coated NLCs (CS-NLCs) have been introduced to the industry as a promising multifunctional cosmetic ingredient for skin and hair care, and can even be used as an agent that helps drugs and cosmetic components penetrate through the skin [26,27]. However, there are some limitations in the conventional coating process using CS, which is soluble in an acidic environment (commonly a solution of acetic acid is used for this purpose). In the case of sunscreen filters, removal of the acetic acid is required after the formation of nanoparticles, since acetic acid is incompatible with the final application.
The present work aims at the design and synthesis of three esters of ferulic acid to be tested as potential sunscreen filters, and the encapsulation of the synthesized compounds in CS-NLCs. To our knowledge, this is the first report in the literature that describes the encapsulation of these esters in CS-coated NLCs. Moreover, in order to address the disadvantages of acetic acid utilization in the surface coating process and in accordance with green nanotechnology principles, a greener alternative was explored using a solution of a natural deep eutectic solvent (NADES) composed of betaine (Bet), lactic acid (LA), and water (W) in a 1:2:2.5 molar ratio to dissolve CS. NADESs, composed of natural metabolites, offer tunable properties and are widely used in various applications. This approach represents the first report of NADES being employed as a sustainable medium for nanoparticle surface functionalization in sunscreen formulations, offering both eco-friendly processing and added cosmetic compatibility since the components of the NADES are natural metabolites commonly used in skincare.

2. Materials and Methods

2.1. Reagents

The chemicals used for the synthesis, characterization, and evaluation of the NADES and the NLCs were purchased from Thermo Fisher Scientific (Waltham, MA, USA), Alfa Aesar (Haverhill, MA, USA), Sigma-Aldrich (Burlington, MA, USA), Glentham Life Sciences (Corsham, UK), and Fluka (Buchs, Switzerland) and used without further purification. Trimyristin was isolated from commercially available nutmeg, while ultra-low molecular weight chitosan (<5 cps, MW: ~20,000 Da; Glentham Life Sciences, Corsham, UK) was employed for the surface coating of the nanoparticles. For all experiments, ultrapure or deionized water was used.

2.2. Synthesis of the Esters

The synthesized compounds were structurally elucidated using a Varian 300 MHz and a Varian 600 MHz NMR spectrometer (Palo Alto, CA, USA) at the Institute of Chemical Biology, National Hellenic Research Foundation, using DMSO-d6 and CDCl3 (99.9% D). Coupling constants (J) are expressed in hertz (Hz). Chemical shifts (δ) are reported in parts per million (ppm) relative to the reference (TMS). Melting points were determined on a Gallenkamp MFB-595 melting point apparatus (Cambridge, UK) and are uncorrected.
Synthesis of (E)-3-(4-acetoxy-3-methoxyphenyl)acrylic acid (1):
For the synthesis of acetylated ferulic acid, 5.15 mmol (1 g) of trans-4-hydroxy-3-methoxy-cinnamic acid (ferulic acid) was dissolved in 10.3 mL of pyridine in a round-bottom flask and then 10.30 mmol (970 μL) of acetic anhydride was added. The reaction mixture was heated for 24 h at 80 °C (reflux) and under an inert nitrogen atmosphere. The course of the reaction was monitored by means of thin-layer chromatography (TLC). After the end of the reaction, the mixture was acidified under cooling, with a dilute aqueous solution of HCl (10% v/v), followed by vacuum filtration of the solid precipitate formed. The final product (1) was obtained as a white solid and used in the next reaction without any purification process. Yield: 97%; m.p. 195–196 °C [28]; 1H NMR (300 MHz, DMSO-d6) δ (ppm) 12.39 (s, 1H, -OH), 7.58 (d, J = 16.0 Hz, 1H, H-7), 7.48 (s, 1H, Ar-H), 7.26 (d, J = 8.2 Hz, 1H, Ar-H), 7.12 (d, J = 8.1 Hz, 1H, Ar-H), 6.58 (d, J = 16.0 Hz, 1H, H-8), 3.82 (s, 3H, Ar-OCH3), 2.26 (s, 3H, Ar-OCO-CH3).
General Procedure A: Synthesis of Esters 2a2c
For the synthesis of the ester of ferulic acid via a Steglich esterification reaction, in a round-bottomed flask containing an appropriate amount of dry dichloromethane (DCM) as a solvent, 1.1 eq of 1 and 1.0 eq. of the desired alcohol were added. Then, in a conical flask, a solution was prepared containing the same amount of dry DCM, 1.2 eq. of N,N′-dicyclohexylcarbodiimide (DCC), and a catalytic amount of dimethyl-amino-pyridine (DMAP). This solution was added dropwise to the round-bottomed flask and the final reaction mixture was stirred for 48 h at ambient temperature under inert nitrogen conditions. After the end of the reaction, the mixture was refrigerated for 24 h in order for the by-product dicyclohexylurea (DCU) to precipitate. DCU was removed from the mixture by vacuum filtration, and then the filtrate was extracted twice with aqueous hydrochloric acid (HCl 10%) and once with a saturated aqueous solution of sodium bicarbonate (NaHCO3). The organic phase was dried with anhydrous sodium sulfate (Na2SO4), and the solvent was evaporated under reduced pressure. The final product was purified via flash column chromatography using PE/EtOAC 80:20 as the eluent.
(E)-octyl 3-(4-acetoxy-3-methoxyphenyl)acrylate (2a):
The synthesis of compound 2a was based on General Methodology A. A total of 2.12 mmol (500 mg) of 1 and 1.90 mmol (0.3 mL) of n-octanol were added to a round-bottomed flask containing 14.0 mL of dry DCM. A solution containing 14.0 mL dry DCM, 2.30 mmol (474.6 mg) DCC, and 23.0 mg DMAP was then added dropwise. After the work-up procedure, the product (2a) was subjected to further purification via column chromatography and was finally obtained in the form of a white solid and in high purity. Yield: 65%; m.p. 85–88.9 °C; 1H-NMR (300 MHz, CDCl3) δ 7.62 (d, J = 16.2 Hz, 1H, H-7), 7.10 (m, 2H, Ar-H), 7.04 (d, J = 7.8 Hz, 1H, Ar-H), 6.37 (d, J = 15.6 Hz, 1H, H-8), 4.19 (t, J = 6.6 Hz, 2H, H-11), 3.85 (s, 3 H, Ar-OCH3), 2.31 (s, 3 H, Ar-OCO-CH3), 1.69 (quint, J = 6.6 Hz, 2H, H-12), 1.39 (quint, J = 6.6 Hz, 2H, H-13), 1.30 (m, 8H, H-14/H-15/H-16/H-17), 0.87 (t, J = 6.6 Hz, 3H, H-18)
4-Methoxybenzyl (E)-3-(4-acetoxy-3-methoxyphenyl)acrylate (2b):
The synthesis of compound 2b was based on General Method A. A total of 2.12 mmol (500 mg) of 1 and 1.92 mmol (239.0 μL) of 4-methoxy-benzyl alcohol were added to a round-bottomed flask containing 14.0 mL of dry DCM. A solution containing 14.0 mL dry DCM, 2.31 mmol (476.6 mg) DCC, and 23.0 mg DMAP was then added dropwise. After the work-up procedure, the final product (2b) was subjected to further purification via column chromatography and was finally obtained as a pale yellow oil and in high purity. Yield: 57%; 1H-NMR (300 MHz, CDCl3) δ (ppm) 7.66 (d, J = 15.0 Hz, 1H, H-7), 7.36 (d, J = 9.0 Hz, 2H, H-2′/H-6′), 7.11-7.02 (m, 3H, Ar-H), 6.92 (d, J = 9.0 Hz, 2H, H-3′/H-5′), 6.41 (d, J = 15.0 Hz, 1H, H-8), 5.18 (s, 2H, H-11), 3.84-3.82 (br, 6H, 2xAr-O-CH3), 2.31 (s, 3H, Ar-OCO-CH3)
4-(tert-butyl)benzyl (E)-3-(4-acetoxy-3-methoxyphenyl)acrylate (2c):
The synthesis of compound 2c was based on General Method B. To a round-bottomed flask containing 16.0 mL of dry DCM was added 2.54 mmol (600.0 mg) of 2 and 2.31 mmol (408.7 μL) of 4-(tert-butyl)-benzyl alcohol. A solution containing 16.0 mL dry DCM, 2.77 mmol (571.7 mg) DCC, and 27.6 mg DMAP was then added dropwise. After the work-up procedure, the final product (2c) was subjected to further purification via column chromatography and was finally obtained as a pale yellow oil and in high purity. Yield: 40%; m.p. 88-92 °C; 1H-NMR (300 MHz, CDCl3) δ (ppm) 7.68 (d, J = 15.9 Hz, 1H, H-7), 7.44-7.34 (m, 4H, Ar-H), 7.13-7.03 (m, 3H, Ar-H), 6.43 (d, J = 16.2Hz, 1H, H-8), 5.22 (s, 2H, H-11), 3.85 (s, 3H, Ar-O-CH3), 2.32 (s, 3H, Ar-OCO-CH3), 1.33 (br, 9H, 3xCH3); 13C NMR (75 MHz, CDCl3) δ (ppm) 168.9, 166.8, 151.6, 151.5, 144.5, 141.6, 133.5, 133.1, 128.4, 125.7, 123.4, 121.4, 118.4, 111.3, 66.5, 56.0, 34.8, 31.5, 20.8.
General Procedure B: Synthesis of esters 3a3c
In a round-bottomed flask containing an appropriate amount of tetrahydrofuran (THF), 1 eq of the acetyloxy-ester 2a, 2b, or 2c and then 5.4 eq. of sodium borohydride (NaBH4) for each acetyloxy group to be removed were initially added. The reaction mixture was stirred for 24 h at 45 °C (reflux) and under inert nitrogen conditions, while the course of the reaction was monitored by means of TLC. After completion of the reaction, the mixture was cooled and a small amount of saturated aqueous solution of ammonium chloride (NH4Cl) was added. The mixture was then extracted with diethyl ether. The organic phase was washed twice with aqueous NH4Cl and twice with saturated aqueous sodium chloride (NaCl). The organic phase was dried with anhydrous sodium sulfate (Na2SO4), and the solvent was evaporated under reduced pressure to give a pale yellow oily product. The final product was purified via flash column chromatography using PE/EtOAc 80:20.
(E)-octyl 3-(4-hydroxy-3-methoxyphenyl)acrylate (n-octyl ferulate-3a):
The synthesis of compound 3a was based on General Methodology B. In a round-bottomed flask containing 1.54 mL of THF was added 0.30 mmol (107.0 mg) of 2a followed by the addition of 1.60 mmol (62.7 mg) of NaBH4. After completion of the reaction and appropriate work-up of the mixture, the final product (3a) was subjected to further purification via column chromatography and was finally obtained in the form of a pale yellow oil [29]. Yield 54%; 1H-NMR (600 MHz, CDCl3) δ (ppm) 7.59 (d, J = 15.6 Hz, 1H, H-7), 7.06 (dd, J = 8.4, 1.8 Hz, 1H, H-6), 7.02 (d, J = 1.8Hz, H-2), 6.90 (d, J = 7.8 Hz, 1H, H-5), 6.28 (d, J = 15.6 Hz, 1H, H-8), 5.90 (s, 1H, Ar-OH), 4.17 (t, J = 7.2 Hz, 2H, H-11), 3.91 (s, 3H, Ar-OCH3), 1.68 (quint, J = 7.2 Hz, 2H, H-12), 1.38 (quint, J = 6.6 Hz, 2H, H-13), 1.29 (m, 8H, H-14/H-15/H-16/H-17), 0.87 (t, J = 6.6 Hz, 3H, H-18) [30].
4-methoxybenzyl (E)-3-(4-hydroxy-3-methoxyphenyl)acrylate (3b):
The synthesis of compound 3b was based on general method C. In a round-bottomed flask containing 4.93 mL of THF was added 0.96 mmol (341.7 mg) of ester 2b followed by 5.20 mmol (195.9 mg) of NaBH4. After completion of the reaction and appropriate work-up of the mixture, the final product (3b) was subjected to further purification via column chromatography and was finally obtained as a pale yellow oil. Yield: 38%; 1H-NMR (300 MHz, CDCl3) δ (ppm) 7.64 (d, J = 15.0 Hz, 1H, H-7), 7.37-7.31 (m, 2H, H-2′/H-6′), 7.07-7.01 (m, 2H, H-3′/H-5′), 6.91 (d, J = 9.0 Hz, 3H, Ar-H), 6.32 (d, J = 15.0 Hz, 1H, H-8), 5.91 (s, 1H, Ar-OH), 5.17 (s, 2H, H-11), 3.90 (s, 3H, Ar-O-CH3), 3.81 (s, 3H, Ar-O-CH3).
4-(tert-butyl)benzyl (E)-3-(4-hydroxy-3-methoxyphenyl)acrylate (3c):
The synthesis of compound 3c was based on General Method B. In a round-bottomed flask containing 1.80 mL of THF was added 0.35 mmol (132.8 mg) of acetyloxy ester 2c followed by 1.88 mmol (71.0 mg) of NaBH4. After completion of the reaction and appropriate work-up of the mixture, the final product (3c) was subjected to further purification via column chromatography and was finally obtained as a pale yellow oil. Yield: 45%; 1H-NMR (300 MHz, CDCl3) δ (ppm) 7.65 (d, J = 15.9 Hz, 1H, H-7), 7.43-7.34 (m, 4H, Ar-H), 7.06 (d, J = 8.4 Hz, 1H, H-6), 7.02 (br, 1H, H-2), 6.91 (d, J = 9.0 Hz, 1H, H-5), 6.33 (d, J = 14.4 Hz, 1H, H-8), 5.88 (s, 1H, Ar-OH), 5.21 (s, 2H, H-11), 3.91 (s, 3H, Ar-O-CH3) 1.33 (br, 9H, 3xCH3); 13C NMR (75 MHz, CDCl3) δ (ppm) 167.28, 151.45, 148.11, 146.88, 145.26, 133.26, 128.36, 127.12, 125.68, 123.28, 115.50, 114.84, 109.40, 66.29, 56.06, 34.76, 31.46.

2.3. Synthesis of NADES

The synthesis of the natural deep eutectic solvent betaine–lactic acid–water in a molar ratio of 1:2:2.5 (NADES Bet-LA-W (1:2:2.5)) was carried out by heating and stirring the three components as previously described in our earlier study [31].

2.4. Isolation of Trimyristin from Nutmeg

Trimyristin, the solid lipid used for the formation of NLCs, is a constituent of nutmeg and is isolated via extraction, as previously described in our earlier study [32].

2.5. Preparation of NLCs

For the preparation of NLCs, 100 mg of trimyristin was added to a round-bottomed flask and stirred at 70 °C until the trimyristin melted. Then, 50 mg of phosphatidylcholine, dissolved in ethanol, and 100 mg of the liquid lipid and the ester were added. Once the components were completely dissolved, the aqueous phase (10 mL), which contained 1% w/v Polysorbate 80 and had been preheated to 70 °C, was added. After the addition of the aqueous phase, the mixture was left under vigorous stirring for 1 h.
The resulting aqueous dispersion was sonicated for 10 min, according to the results of the model, at 120 W (The Vibra-Cell probe sonicator (400 W) was manufactured by Sonics & Materials, Inc., located in Newtown, CT, USA) and then left under agitation for 24 h at 80 rpm and 25 °C in a shaker (The Temperature Controlled Shaker was manufactured by Gallenkamp, located in Loughborough, UK) until the organic solvent was evaporated. Then, the emulsion was centrifuged at 4 °C, at 4000 rpm for 20 min, and the supernatant liquid was collected.
For the preparation of the NLCs without bioactive compounds (NLC-Blank), the same procedure was followed without the addition of the ester.

2.6. NLC Coating Process

The coating of NLCs was carried out in a solution of CS in the NADES Bet–LA–W (1:2:2.5) through the mechanism of surface adsorption due to electrostatic interaction. This mechanism was exploited due to the different surface charge of NLCs compared with the charge of CS. The content of CS (viscosity: 5 cps; average MW: 20,000) in the coating solution was kept constant in all experiments and equal to 0.3% w/v.
For the preparation of the coating solution (0.3% w/v chitosan in 4% v/v NADES), 20 mL of ultrapure water and 400 μL of NADES were added into a glass vial. Subsequently, 60 mg of low-molecular-weight chitosan (viscosity: 5 cps; average MW: 20,000) was added, and the solution was magnetically stirred overnight until complete dissolution. The resulting solution was then filtered using syringe filters with a pore size of 0.45 μm.
For the coating of nanoparticles with chitosan, a defined volume of the NLC dispersion was mixed with twice the volume of the coating solution in an Erlenmeyer flask. The dispersion was incubated overnight at 25 °C under gentle agitation (80 rpm).

2.7. Characterization of the NLCs

2.7.1. Nanoparticle Tracking Analysis

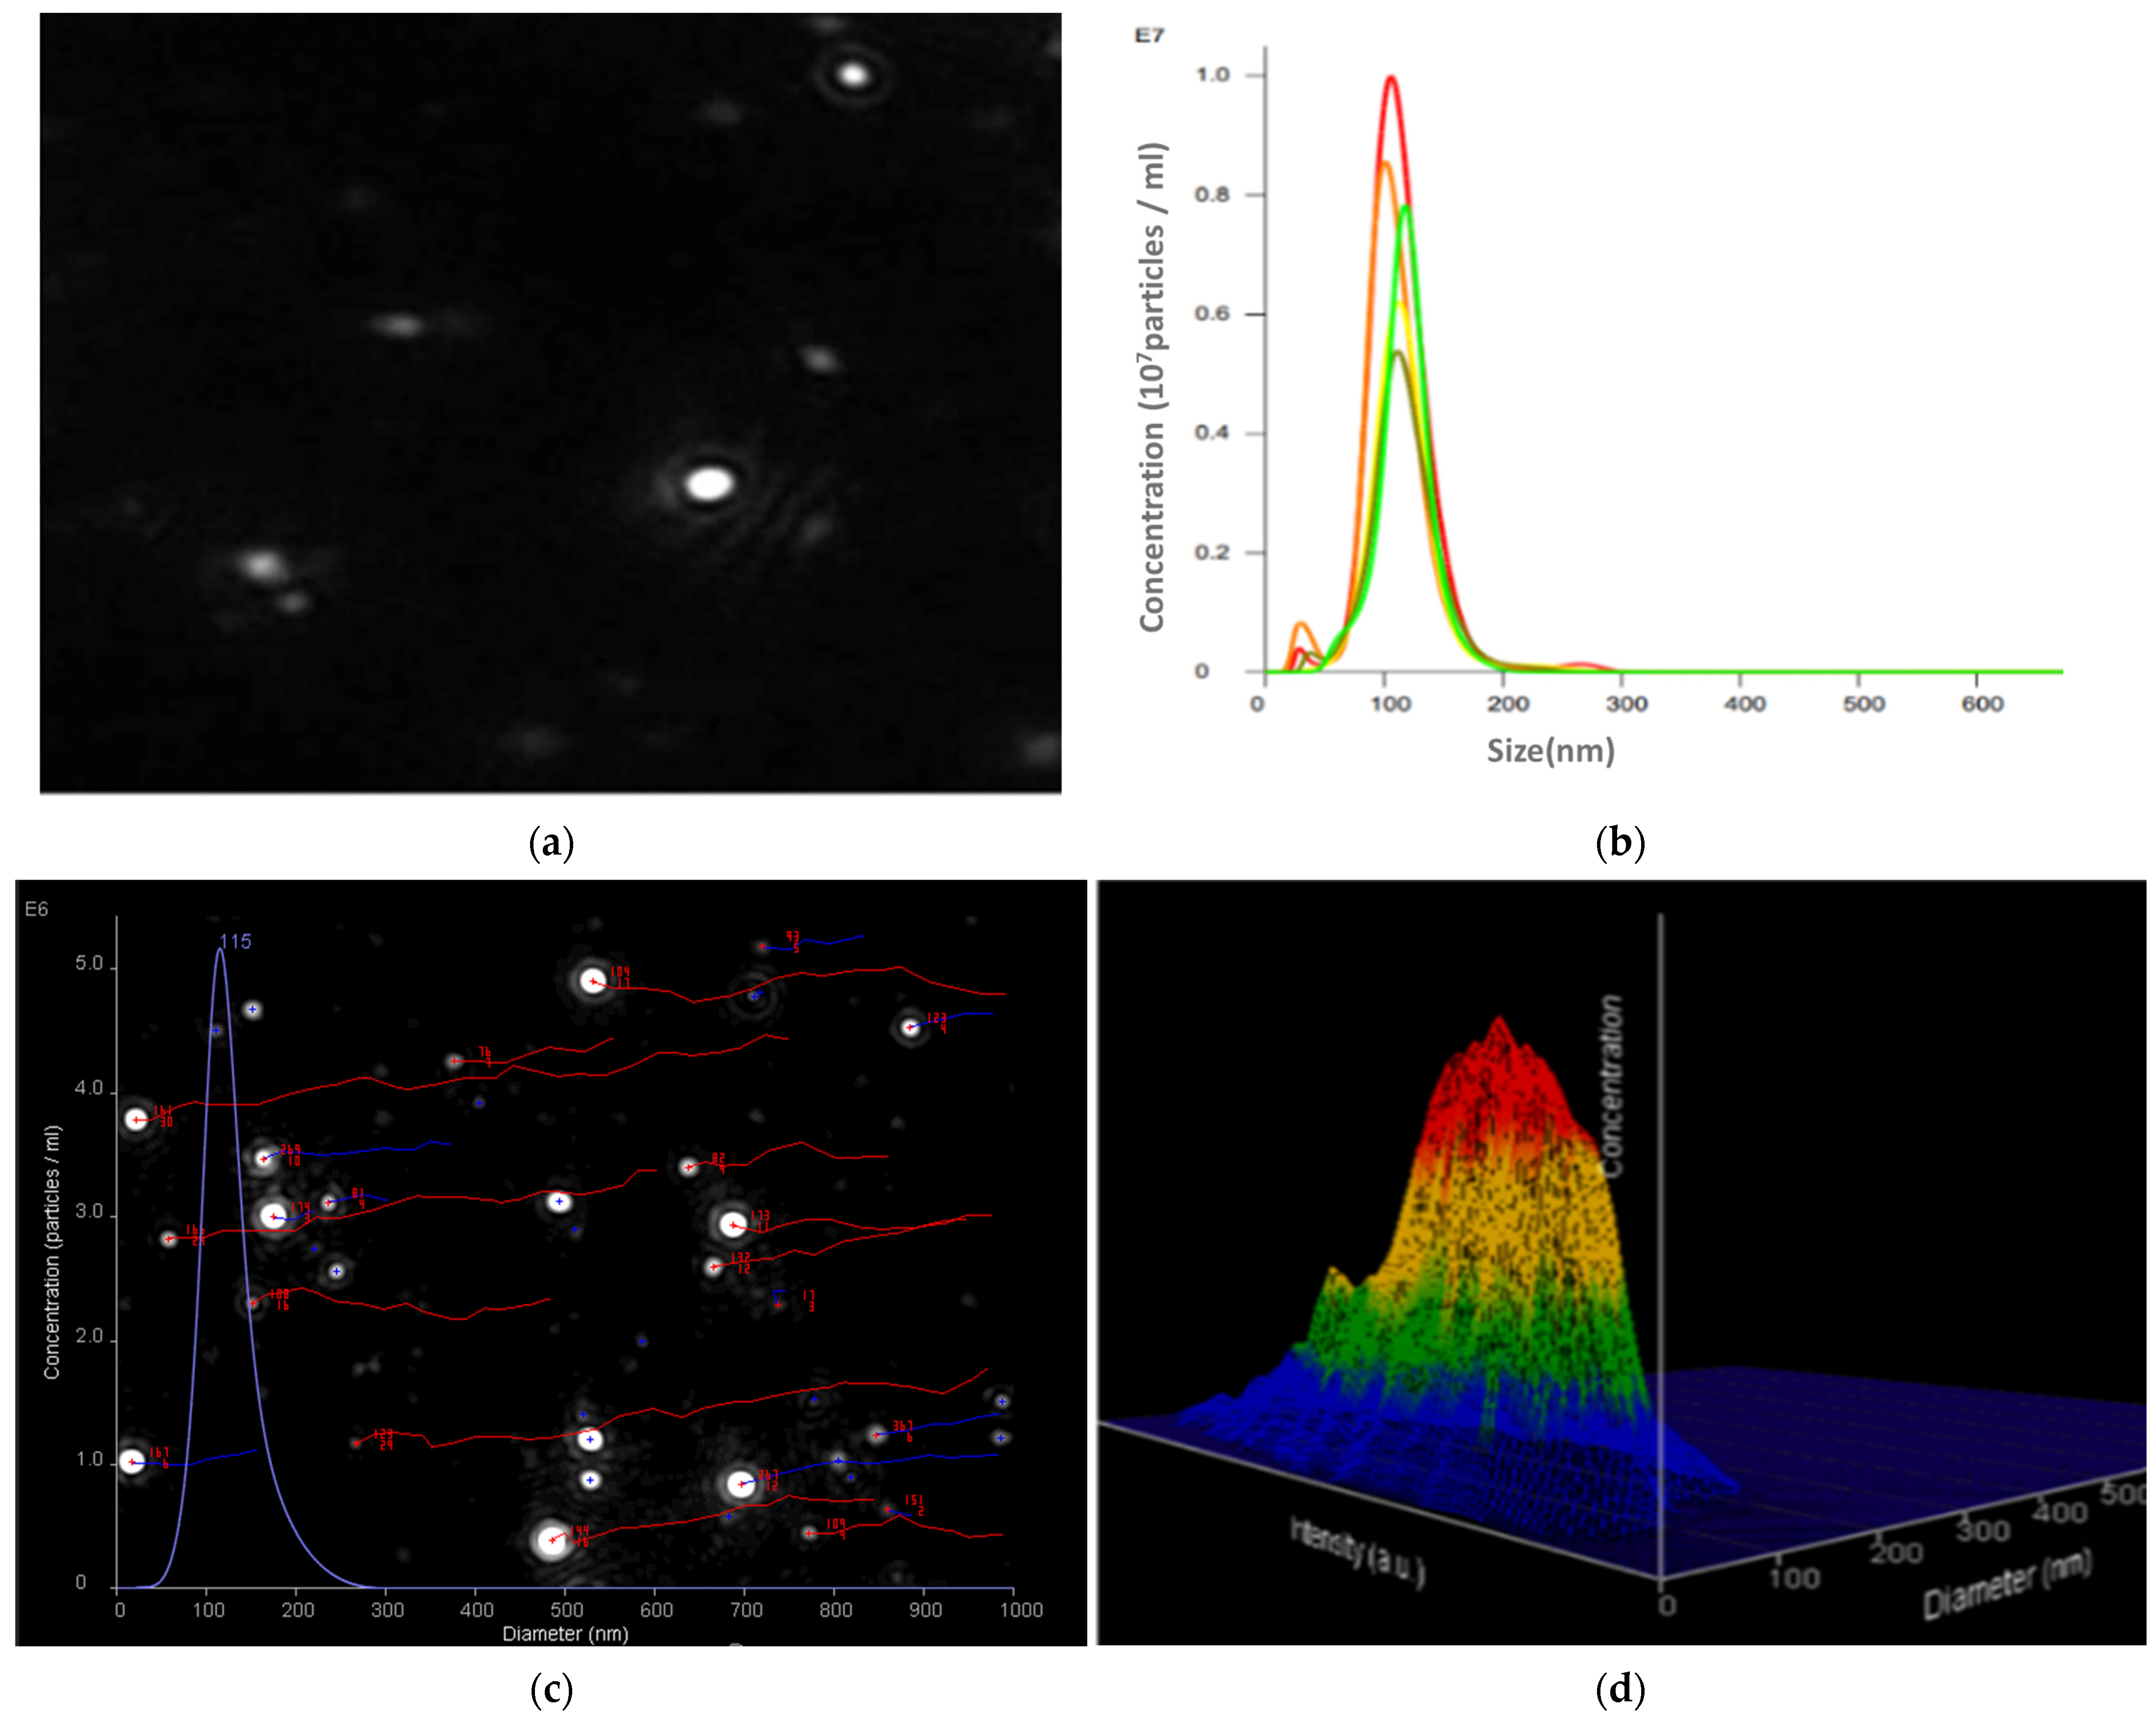
The mean hydrodynamic diameter of the NLCs in every sample was determined by nanoparticle tracking analysis using a NanoSight NS300 instrument (Malvern Instruments, Worcestershire, UK). During this measurement, a diluted sample of nanoparticles passes through a special chamber, which is penetrated by a laser beam. The nanoparticles of the sample scatter the light, and the Brownian motion they perform becomes visible through a camera. Through the corresponding software, measurements are taken for the size (from 10 nm to 1000 nm) of each nanoparticle separately, but information is also provided about the entire population of nanoparticles such as the average hydrodynamic diameter and the standard deviation. In addition, information is provided on the concentration of nanoparticles in the sample. The software also processes the above measurements, offering the user nanoparticle size distribution diagrams in two- and three-dimensions. Furthermore, snapshots are taken from the camera as the particles pass through the chamber, and the particle size distribution diagram observed in each snapshot is created.

2.7.2. Hydrodynamic Diameter, Polydispersity Index (PDI), and ζ-Potential

Nanoparticles were characterized for the mean hydrodynamic diameter and polydispersity index (PdI) by dynamic light scattering (DLS), while the ζ-potential was determined by microelectrophoresis using a Zetasizer Nano ZS instrument (Malvern Panalytical, Malvern, UK). For the measurements, 1 mL of the nanoparticle dispersion was diluted in ultrapure water (pH 7.0) and vortexed for 2 min before analysis. Aqueous dispersions were introduced into U-type capillary cells (DTS 1070, Malvern, UK), and measurements were carried out at 25 °C. Each parameter was measured in triplicate, and the mean value was calculated.

2.7.3. Calculation of the Encapsulation Efficiency

UV–Vis spectrophotometry (V-770 UV-Vis spectrophotometer was manufactured by JASCO Corporation, located in Tokyo, Japan.) was used to determine the percentage of the bioactive compound encapsulated in the NLCs. From the resulting absorbance value, which corresponds to the amount of the compound through the standard reference curve of the compound, the encapsulation efficiency (EE) was determined. Two methods, the direct and the indirect method, were used to determine the encapsulation efficiency.
The direct method for the determination of encapsulation efficiency is a destructive method, requiring complete dissolution of the nanoparticles. A total of 20 mL of the CS-[NLC-ester] dispersion was transferred into a 150 mL round-bottom flask, followed by the addition of 40 mL of a dichloromethane (DCM):methanol (MeOH) mixture (1:1 v/v). The flask was placed in an ultrasonic bath for 20 min and then stirred on a magnetic stirrer for 24 h. The mixture was allowed to settle until phase separation occurred, with a clear lower layer and a turbid upper layer. The lower layer was carefully collected using a 1 mL syringe, filtered through a 0.2 μm Branchia filter, and diluted 1:20 in dichloromethane. The absorbance of the diluted solution was measured by UV–Vis spectrophotometry over 250–400 nm, and the encapsulation efficiency was calculated using the equation:
E n c a p s u l a t i o n   E f f i c i e n c y   % =   M a s s   o f   e n c a p u l a t e d   c o m p o u n d I n i t i a l   m a s s   o f   c o m p o u n d   t o   b e   e n c a p u l a t e d × 100 %
The indirect method for the determination of encapsulation efficiency involves measuring the amount of compound not encapsulated in the NLCs. After centrifugation of the NLC dispersion prior to coating (centrifuged at 4000 rpm and 4 °C for 20 min), the precipitate, containing unincorporated reagents, was collected and dissolved in excess high-purity ethanol. The solution was transferred to a 50 mL round-bottom flask, and the ethanol was completely evaporated under reduced pressure. The resulting residue was re-dissolved in 10 mL of a dichloromethane:methanol mixture (1:1 v/v) and vortexed until complete dissolution of the lipids and unencapsulated compound. The solution was then filtered through a 0.2 μm Branchia filter and analyzed by UV–Vis spectrophotometry over a wavelength range of 250–400 nm. Absorbance at the specific wavelength corresponding to the compound was recorded, and the encapsulation efficiency was calculated using the equation:
E n c a p s u l a t i o n   E f f i c i e n c y   % =   1   M a s s   o f n o t   e n c a p s u l a t e d   c o m p o u n d I n i t i a l   m a s s   o f   c o m p o u n d   t o   b e   e n c a p s u l a t e d × 100 %

2.7.4. Fourier-Transform Infrared Spectroscopy (FTIR)

The nanostructured lipid carriers (NLC-Blank and CS[NLC-blank]) were structurally characterized using infrared spectroscopy (FTIR). FTIR measurements were performed using an FT/IR-4200 spectrometer manufactured by JASCO Corporation (Tokyo, Japan) in attenuated total reflection (ATR) mode, over the range of 4000–400 cm−1.

2.7.5. Thermogravimetric Analysis (TGA)

Analysis was performed using the TGA/DSC 1 STARe system thermobalance (Mettler Toledo, Columbus, OH, USA). The samples were heated from 25 °C to 600 °C, following a heating rate of 10 °C/min under N2 flow (10 mL/min).

2.7.6. Transmission Electron Microscopy (TEM)

The study of the morphology of the resulting NLCs was performed with a JEOL JEM-2100 LaB6 high-resolution transmission electron microscope (HRTEM), operating at 200 kV. The samples under investigation were suspended in deionized water and sonicated to break up agglomerated particles. A drop of the suspension was then placed on a 300 mesh carbon-coated copper grid and air-dried overnight.

2.8. Experimental Design for the Optimization of the Encapsulation-Coating Process

The present study aimed to optimize the size of the nanoparticles and the encapsulation efficiency of the nanosystems after coating the nanoparticles with chitosan. The experimental design and optimization of the encapsulation and of the coating processes were carried out based on n-octyl ferulate (3a). The hydrodynamic diameter, which is a direct indication of nanoparticle size as well as the encapsulation efficiency, calculated by the direct method, were studied as dependent variables (responses), while the independent variables (factors) were the time of ultrasound application (sonication time, ST), the concentration of NADES in the coating solution, and the amount of n-octyl ferulate (3a) loaded to the nanoparticles (drug loading, DL). The independent and dependent variables of the experimental design are shown in Table 1.
Design-Expert 12.0 software was used to calculate the values of the independent variables and determine the experiments to be performed, and a Box–Behnken experimental design was implemented. After determining the values of the upper and lower limits of the independent variables, the software indicated 15 experiments (Table 2) including three middle points to be performed, and then ANOVA statistical analysis was used to optimize the encapsulation process of octyl ferulate (3a) in NLCs.

2.9. Assessment of Inhibition to Lipid Peroxidation (AAPH)

The antioxidant activity of the synthesized esters, after their release from the NLCs, was calculated through the study of the inhibition of the oxidation of linoleic acid, which was induced by AAPH (2,2′-azodis-(2-amidinopropane)-dihydrochloride). The method followed is the one described in our previous work [33]. A total of 1302 µL of 0.05 M pH 7.4 phosphate buffer (prewarmed to 37 °C), 14 µL of sodium salt of linoleic acid (16 mM), and 14 µL of ester (100 µM) or NLC dispersion (in DMSO or H2O, respectively) were added to a quartz cell. Control samples contained solvent instead of the bioactive compound. This was followed by the addition of the inducer, 70 µL of AAPH (40 mM), and immediately measuring the absorbance at 234 nm (t = 0 min) as well as after one minute (t = 1 min), and the inhibition of lipid peroxidation (LP) was calculated by the equation:
I n h i b i t i o n = 1 A s a m p l e t = 1 m i n A s a m p l e t = 0 m i n A c o n t r o l t = 1 m i n A c o n t r o l t = 0 m i n ×   100 %

2.10. SPF Measurement

The determination of the photoprotective activity of the synthesized compounds was carried out through an in vitro study with an SPF 290S spectrophotometer was sourced from Optometrics LLC, Littleton, MA, USA. The aim of the measurements was to determine the rate of increase in the SPF in an already existing sunscreen formulation after the addition of the chemically synthesized esters that were encapsulated in NLCs. The formulation used was in the form of a cream and initially had an SPF of 15.
For this method, suitable plates of PMMA (Plexiglas, methyl polymethyl methacrylate) with one rough side were used as the substrate. The substrate must be permeable to UV radiation, non-fluorescent, photostable, and inert to all compounds that will be applied to the plate.
For the calibration of the instrument, glycerin was used as a reference sample, which was placed at different points on the tracheal surface of the plate without being affected by the distribution. The amount of glycerin used must be able to cover the entire surface (approximately 15 μL for a 50 × 50 mm plate). For the study of each sample, 500 µL of the dispersion of each sample was added to 5 g of the commercial sunscreen formulation. Initially, 0.3 g of each sample was placed with the help of a syringe in the form of dots of equal volume over the entire surface of the plate. After application, the sample was spread as quickly as possible over the entire surface of the plate with the tip of a finger in specific movements. First, the sunscreen was spread over the entire area for 30 s with large circular movements, without applying pressure. Then, the sample was smeared on the tracheal surface using pressure and making linear movements for another 30 s. The sample was left to rest for at least 15 min in the dark at room temperature to facilitate the formation of a standard fixed film.
After the sample preparation, the plate was placed in the lighted part of the device. During the measurement, which takes 5–7 min, the plate moves, and the device scans nine different areas on its surface from 290 to 400 nm with a step of 1 nm, displaying a diagram with ten different curves. These curves on the horizontal axis have the critical wavelength, while on the vertical is the MPF (monochromatic protection factor) index. Nine of the curves corresponded to the nine different scans, while the tenth was the average of them, eliminating noise in the measurement.

3. Results

The aim of this work was the design, synthesis, and evaluation of photoprotective activity of ferulic acid esters (3a3c) in an effort to produce new UV filters with improved stability and bioactivity. As previously noted, the derivatives of cinnamic acid are efficient as filters of the UVA and UVB radiation, so these esters were synthesized as analogues of a widely used commercial sunscreen agent known as octyl methoxycinnamate (OMC). Their low water solubility and the requirement of the controlled release of these compounds warranted their encapsulation in nanostructured lipid carriers (NLCs) to enhance their effectiveness and modify their physicochemical properties. The esters were loaded into nanostructured lipid carriers (NLCs) and afterward coated with chitosan dissolved in an aqueous solution of the NADES betaine/lactic acid/water (bet-LA-W, 1:2:2.5).

3.1. Synthesis of Esters 3a3c

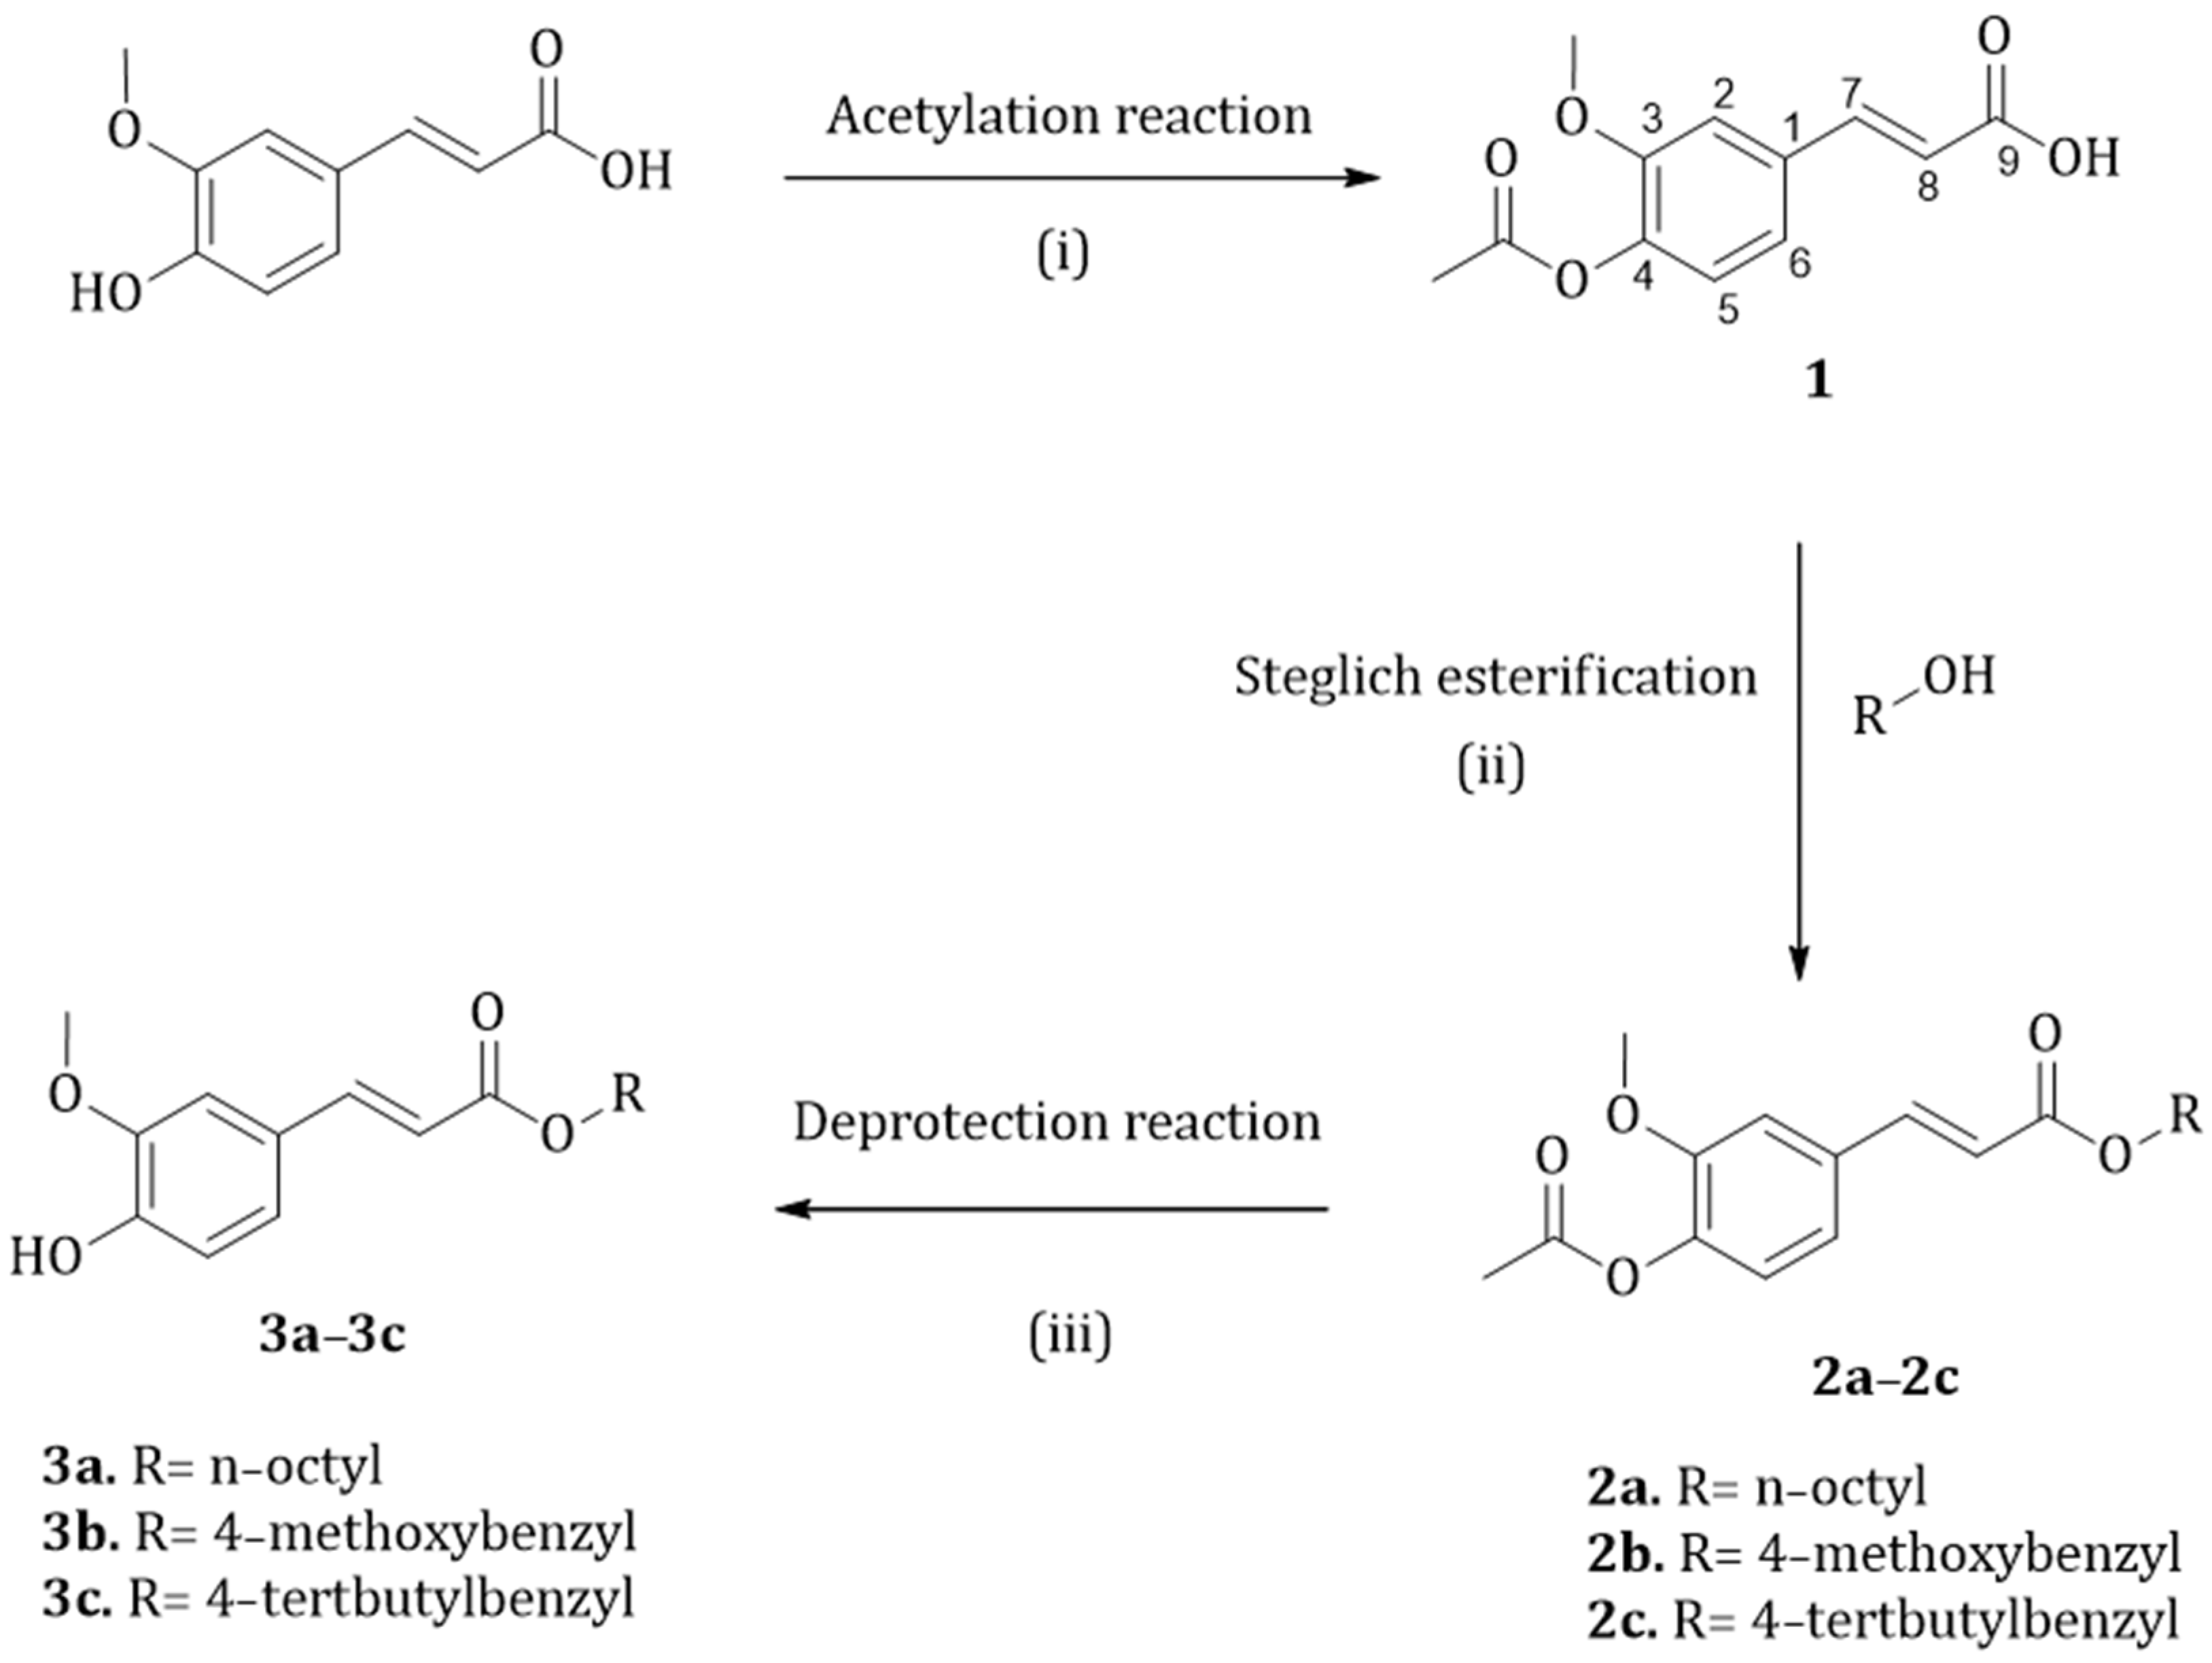
For the synthesis of the desired esters, first, an acetylation reaction of the hydroxyl group of ferulic acid was carried out (Figure 3). Then, the Steglich esterification reaction was conducted between the acetylated ferulic acid (1) and different alcohols (one aliphatic and two benzyl ones), resulting in the acetylated esters (2a2c). Steglich esterification was the method of choice due to its very mild experimental conditions and its irreversible character [29], using dichloromethane (DCM) as a solvent, dicyclohexylcarbodiimide (DCC) as the coupling agent, and dimethylaminopyridine (DMAP) as the catalyst. This reaction takes place at room temperature, under an inert nitrogen atmosphere for about 48 h.
Finally, a deprotection reaction to remove the acetyl group took place for 24 h at 45 °C in the presence of sodium borohydride (NaBH4) and tetrahydrofuran (THF) as a solvent, resulting in esters (3a3c). The advantage of the methodology is that NaBH4 can act selectively at the acetyl group and preserves the ester functionality.
In Table 3, the structures of the synthesized esters, along with the yield of their synthesis, are presented.
The 1H-NMR spectra of esters 3a3c were characterized by a signal at ≈5.9 ppm attributed to the proton of the aromatic -OH, and the pair of doublets of the vinyl protons H7 (≈7.6 ppm) and H8 (≈6.3 ppm) with characteristic J values of 14.4–15.9 Hz, indicating the E-geometry of the double bond. In addition, equally important were the protons H11, whose signal confirmed the synthesis of the ester and appeared as a triplet at 4.2 ppm in the case of ester 3a and as singlets at 5.2 ppm in the case of esters 3b and 3c due to the adjacent aromatic ring.

3.2. Preliminary Experiments for the Encapsulation Process

Following the synthesis of the compounds, we proceeded with the encapsulation of the esters and the coating of the nanoparticles using a chitosan solution in NADES, aiming to optimize the process for nanostructured lipid carriers (NLCs).

3.2.1. Study of ζ-Potential Before and After the Coating of the NLCs

ζ-Potential is an indication of the stability of nanosystems and its determination contributes to their physicochemical characterization. The mechanism by which the nanostructured lipid carriers are coated is physical adsorption. The nanostructured lipid carriers are expected to present a negative ζ-potential value, and as chitosan is a positively charged biopolymer, it is adsorbed on their surface and creates a coating layer when added to the dispersion of the NLCs.
To verify this hypothesis, a dispersion of nanostructured lipid carriers was formed, and the ζ-potential value of the nanoparticles was determined with the microelectrophoresis method before and after coating with a solution of NADES 4% v/v and CS 0.3% w/v.
The CS-[NLC-ester] that was not coated with chitosan presented a negative ζ-potential with an indicative value of −26.9 mV. On the contrary, the CS-[NLC-ester] coated with chitosan had a positive ζ-potential with an indicative value of +25.8 mV. This value approached +30 mV, which indicates that the coating was successful, and the nanoparticles were stable in the aqueous dispersion.

3.2.2. Selection of Solid and Liquid Lipid

A widely used solid lipid for the preparation of NLCs is trimyristin (C45H86O6), a triglyceride obtained by the acylation of the three hydroxy groups of glycerol with myristic (tetradecanoic) acid. Trimyristin exhibits a phase transition temperature of approximately 56–58 °C, which is an important parameter influencing the stability and crystallinity of lipid nanoparticles. As a natural and biocompatible product, trimyristin is also employed as a carrier of active pharmaceutical substances in lipid nanoparticles or nanostructured lipid carriers as well as a moisturizing agent in cosmetic formulations. Regarding the liquid lipids used for the preparation of NLCs, a variety of oils derived from natural sources, such as vegetable oils, have been tested [26,27].
Two liquid lipids commonly used for NLC production are olive oil and almond oil. It has been estimated that olive oil includes more than 30 chemical substances belonging to different categories such as esters, acids, and volatile compounds. In the pharmaceutical industry, it has been used as a vehicle for injectable suspensions and topically as a soothing and emollient in creams or ointments, so it is also considered as suitable for the creation of nanoparticles intended for dermal use [34]. Almonds and their oil present many benefits including anti-inflammatory and immune-boosting properties. Almond oil is extremely popular, mainly for its rich concentration of essential fatty acids such as oleic and linoleic acid, while it is also used in the cosmetics industry for its penetrating, moisturizing, and regenerative effects [35].
Preliminary experiments were performed for each of the tested liquid lipids, (olive oil and almond oil) (Table 4). The compound that was encapsulated was n-octyl ferulate (3a). Drug loading (DL) varied from 0 to 3% w/w. The time in which the particle dispersions were subjected to ultrasound irradiation (ST) was constant and equal to 7.5 min, whereas the % v/v concentration of NADES in the CS solution used to coat the nanoparticles ranged from 4 to 6% v/v.
Although the results for both olive oil and almond oil were quite similar, olive oil was selected as the liquid lipid for the experimental design due to some slight but important advantages. The nanoparticles with olive oil had a smaller average size, which can help improve stability and skin absorption. In addition, the encapsulation efficiency was slightly higher with olive oil, suggesting better compatibility with the ester. Combined with its known stability and biocompatibility, olive oil appeared to be the more suitable choice for this formulation.

3.3. Box–Behnken Experimental Design

The independent variables for the optimization of the encapsulation process of ester 3a in NLCs were determined based on the fourteen preliminary experiments performed. More specifically, the time that the dispersions were exposed to ultrasounds during nanoparticle formation ranged from 5 to 10 min to break up potential aggregates but not affect the entrapment efficiency [36]. The percentage of NADES in the CS solutions used for the coating ranged from 2 to 6% v/v, because this concentration of NADES is sufficient to both dissolve CS and carry out the coating. Finally, the % w/w drug loading ranged from 1 to 5%, as larger differences in the encapsulation efficiency than those obtained in the preliminary experiments would be achieved.
The 15 experiments indicated by the software Design-Expert were implemented, and the results of the size and encapsulation efficiency of the obtained nanoparticles are presented in Table 5:

3.3.1. Results of DLS Method for Size and Size Distribution of [NLC-3a] and Comparison with the NΤA Method

Although the hydrodynamic diameter of the nanoparticles obtained with the NTA method is noted in the responses of the experimental design, a measurement of the hydrodynamic diameter of the nanoparticles with the DLS method was also performed. In addition, data on the polydispersity index (PDI), which is indicative of the size distribution of the nanoparticles, was also obtained with the DLS method (Table 6).
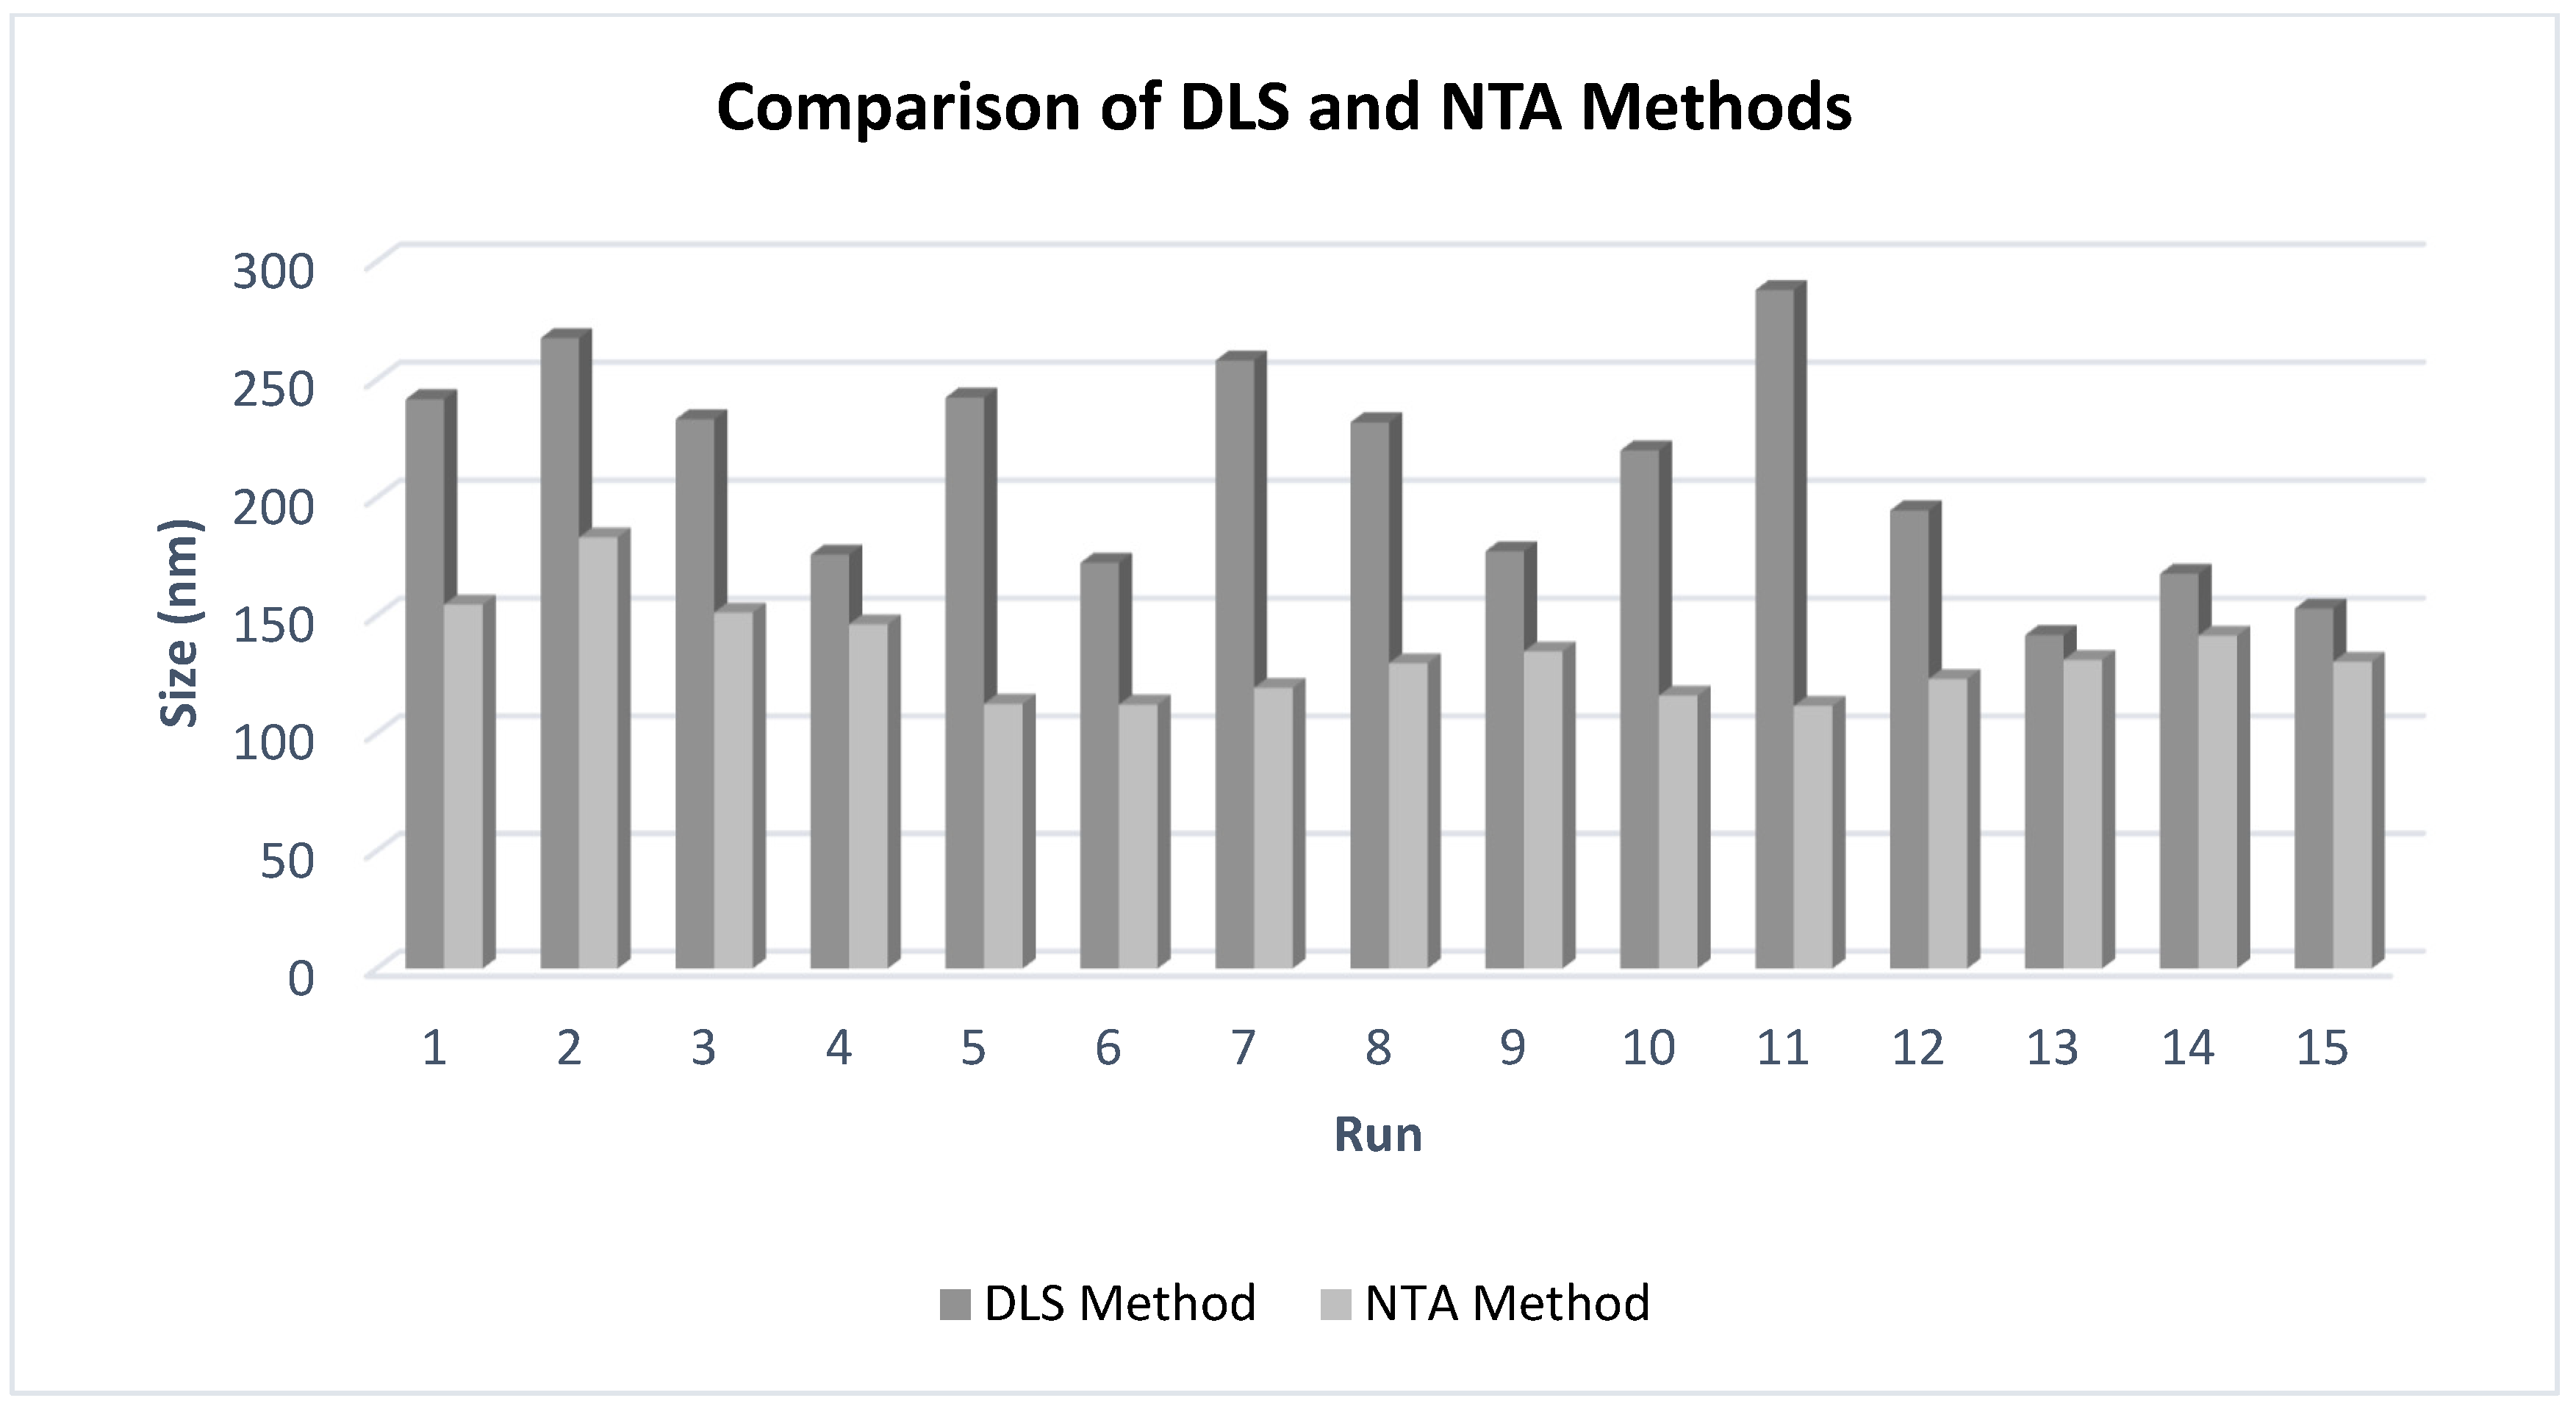
The size of the nanoparticles determined using the DLS method differed significantly from that obtained when the dispersions were analyzed with the NTA method (Figure 4). The results of the two techniques are compared in Figure 4. Notably, the hydrodynamic diameter of the particles appeared consistently larger with the DLS method, an observation that we have also encountered in our previous work [37]. On average, the hydrodynamic diameter calculated via the NTA method was 130.4 ± 19.8 nm, whereas for DLS, it was 220 ± 45.1 nm. This difference can be attributed to the distinct principles underlying the two methods: DLS calculates the particle size based on the intensity of scattered light, which is disproportionately influenced by larger particles, leading to broader distributions. In contrast, NTA tracks and measures individual nanoparticles, providing a more accurate and representative size distribution. Given the higher resolution and particle-by-particle analysis offered by NTA, process optimization was based on the results obtained from the NTA measurements [38] (Figure 5).

3.3.2. Size of NLCs

The results obtained from the fifteen experiments performed (Table 7) were statistically analyzed to determine the most important factors regarding the size of the nanoparticles. The used model was the reduced quadratic model, in which some variables were not taken into consideration, since according to the results, they do not truly affect the model. Calculated values of the regression coefficients for the size of the NLCs are given in Table 7, while the statistical analysis revealed that the size was best described by the following actual and coded equations (Equations (4) and (5), respectively).
S i z e = 5.8 + 30.2   S T + 8.0   %   N A D E S + 10.0   %   D L + 2.1   S T × %   N a D E S                              + 1.3   %   N a D E S × %   D L 2.5   S T 2 2.2   %   N a D E S 2 1.7   ( %   D L ) 2
S i z e = 147.43 + 1.45   A + 3.17   B 10.80   C + 10.33   A B 5.27   B C 15.80   A 2 8.95   B 2 6.75   C 2
The actual equation can be used for the predictions of the size of NLCs, while the coded equation is useful for identifying the relative impact of the factors by comparing the factor coefficients.
The size prediction of NLCs for a specific loading percentage of the bioactive compound (DL = 3% w/w) is possible through Figure 6. For example, the point (ST = 7.5 min, NADES = 4% v/v) is expected to generate particles with a size of 147.4 nm against the values found: 154.7, 151.3, 146.3 nm, deviating from the average by 2.9%.

3.3.3. Encapsulation Efficiency of Octyl Ferulate (3a) in CS-NLCs

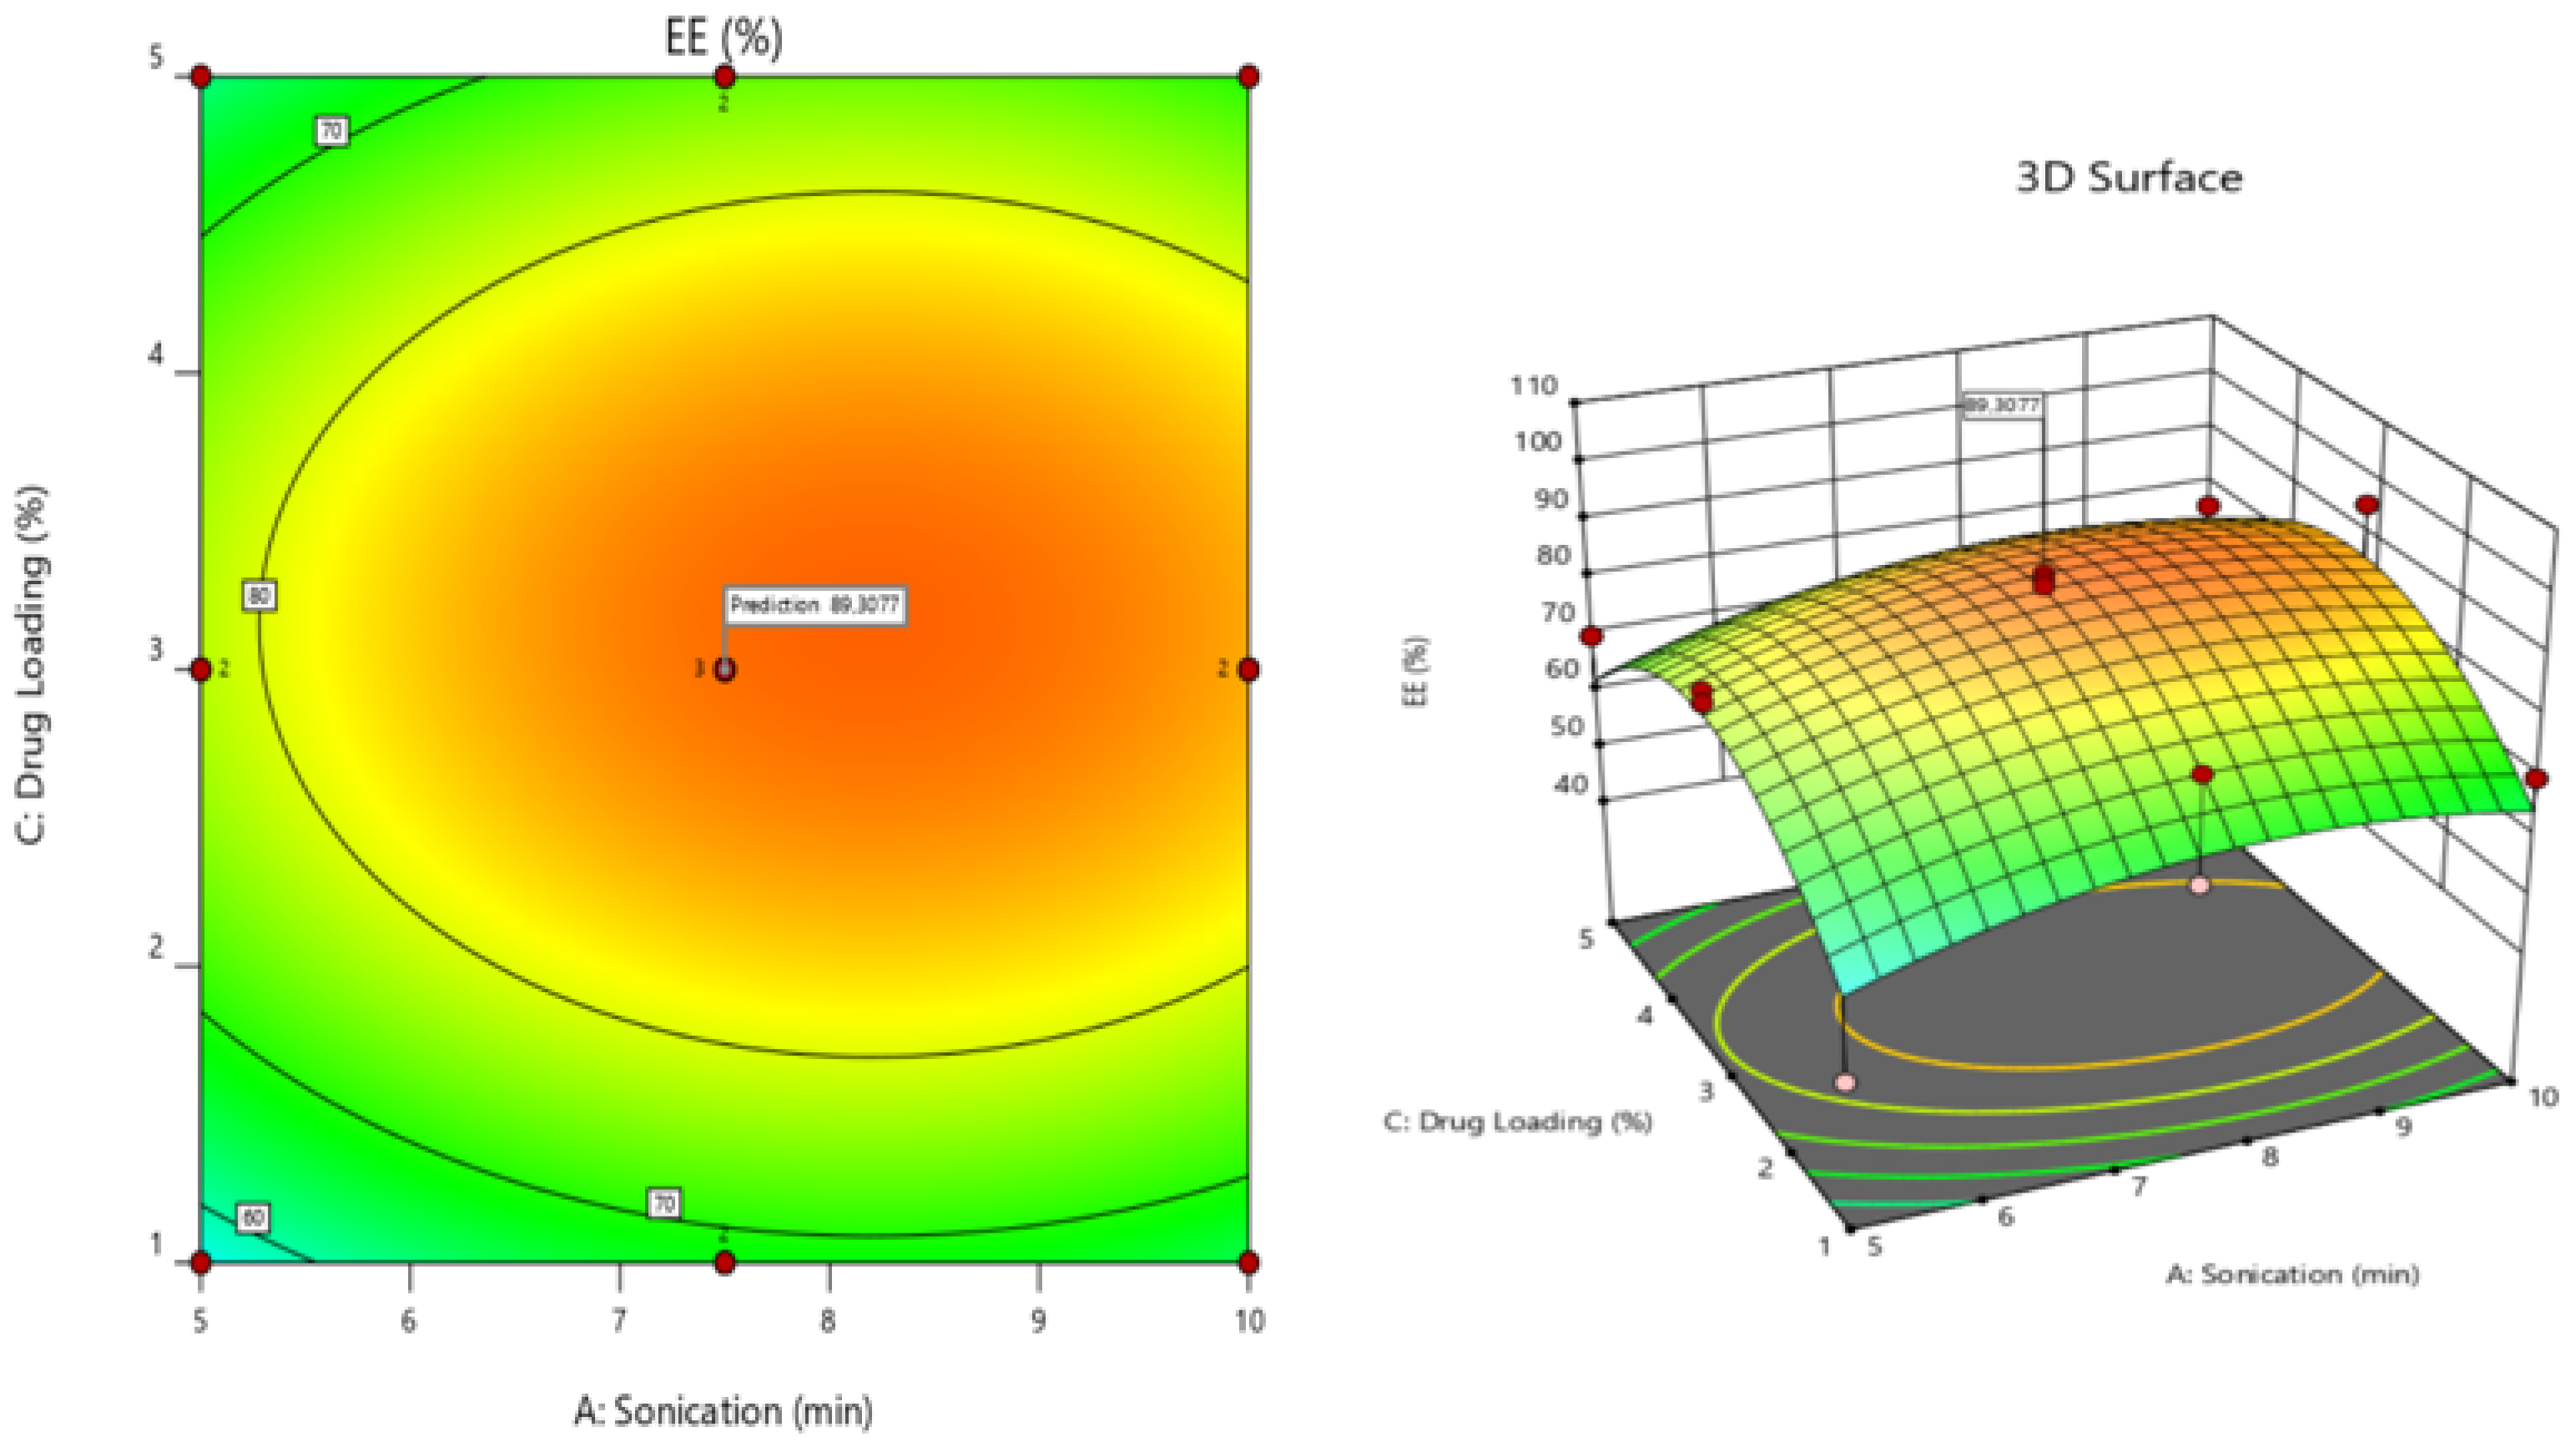
The experimental results of the encapsulation efficiency of octyl ferulate (3a in NLCs (Table 8) were statistically analyzed, and the most important parameters were determined. Some variables were not taken into consideration, since according to the results, they do not truly affect the model. According to the ANOVA statistical analysis, the quadratic model was selected as the most appropriate, and the response was best described by the following actual and coded equations (Equations (6) and (7), respectively).
%   E n c a p s u l a t i o n   E f f i c i e n c y = 35.3 + 19.14   ( S T ) + 29.62   ( D L ) 1.17   S T 2 4.70   ( D L ) 2
%   E n c a p s u l a t i o n   E f f i c i e n c y = 89.31 + 4.12   A + 2.88   C 7.29   A 2 18.79   C 2
The calculation of the encapsulation efficiency for a specific NADES concentration = (4% v/v) is possible based on Figure 7. For example, for the point (ST = 7.5 min, DL= 3% w/w), the encapsulation efficiency was expected to be 89.3% against the values found: 91%, 90%, 92%, deviating from the average by 1.7%. With the values of 90% and 91%, it presented a relatively good prediction, while with the value of 92%, it deviated more.

3.3.4. Validation of the Model—Optimization of the Encapsulation Process

The optimization criteria of this study were set to be the minimization of the size of CS-[NLCs] and the maximization of the encapsulation efficiency of octyl ferulate (3a) in NLCs. The criteria can be summarized in Table 9.
The optimization results identified 10 min of ultrasound application, 4% v/v NADES concentration, and 4.22% w/w loading of octyl ferulate (3a) as the most favorable encapsulation conditions. The improved performance under prolonged sonication can be attributed to enhanced cavitation effects, which promote more efficient droplet disruption, reduced particle size, and uniform coating of the active compound within the carrier matrix, as also emphasized by Matarazzo et al. in their optimization of nanostructured lipid carriers [39]. Likewise, the use of an intermediate NADES concentration (4% v/v) reflects a critical balance—ensuring sufficient solubilization capacity while avoiding the excessive viscosity or destabilization observed at higher solvent contents. Comparable trends were reported by Taha et al. and Golalipour et al., who highlighted the importance of carefully tuning surfactant/solvent ratios to maximize entrapment efficiency and maintain nanoparticle stability [40,41]. Finally, maintaining a drug loading of 4.22% w/w ensured high encapsulation efficiency while avoiding system oversaturation, thereby minimizing the risk of reduced entrapment and structural instability. Overall, these outcomes are in accordance with established formulation principles, where the interplay between sonication energy, solvent microenvironment, and drug-to-lipid ratio governs nanoparticle homogeneity, encapsulation efficiency, and long-term performance.
Under these experimental conditions, the size of the nanoparticles was expected to be 118.4 nm, while the encapsulation efficiency was expected to be 77.5%.
The verification of the model includes the comparison of the predicted values of the responses with the resulting values of the independent variables after the optimization of the process. To perform the confirmation of the optimal values, three new nanoparticle dispersions were formed under optimal conditions. The results of the evaluation of the dispersions prepared using the optimal conditions revealed that the studied parameters’ values were very close to those predicted by the model.
From Table 10, it can be concluded that the confirmation of the model was successful, since the average values of the responses of the three performed experiments according to the optimal experimental conditions of the independent variables were within the limits of their predicted values for a 95% confidence interval.

3.3.5. Testing the Model with Esters 3b and 3c

After confirmation of the model, the encapsulation of the esters 3b and 3c in NLCs was carried out based on the optimal conditions of the model (10 min of ultrasound application (ST), 4% v/v NADES in the coating solution, and 4.22% w/w loading of ester (DL). The aim of this study was to investigate whether the model resulting from the optimization of the encapsulation process of n-octyl ferulate (3a) could be accurate for the encapsulation of other esters with a similar structure. Four new nanoparticle dispersions were produced, two of which contained 3b, while the other two contained 3c. The dispersions were evaluated for nanoparticle size and sunscreen encapsulation efficiency. The results are presented in Table 11.
The experimental results for the particle size and encapsulation efficiency (EE) of esters 3a, 3b, and 3c were compared with the values predicted by the model. The nanoparticles encapsulating ester 3b had an average hydrodynamic diameter of 105.3 nm, showing only a 10% deviation from the optimal size predicted for ester 3a, while the nanoparticles with ester 3c had a larger hydrodynamic diameter of 138.7 nm, corresponding to an 18% deviation. Regarding EE, the nanoparticles with ester 3b had an average value of 75.5%, closely matching the model’s prediction for octyl ferulate (3a), indicating good compatibility with the formulation. In contrast, the nanoparticles with ester 3c showed significantly lower EE (38%), which deviated notably from the predicted value. This suggests possible incompatibility or formulation issues and highlights the need for further optimization in the encapsulation of this synthetic ester.

3.4. FTIR Analysis of NLC-Blank and CS[NLC-Blank] Nanosystems

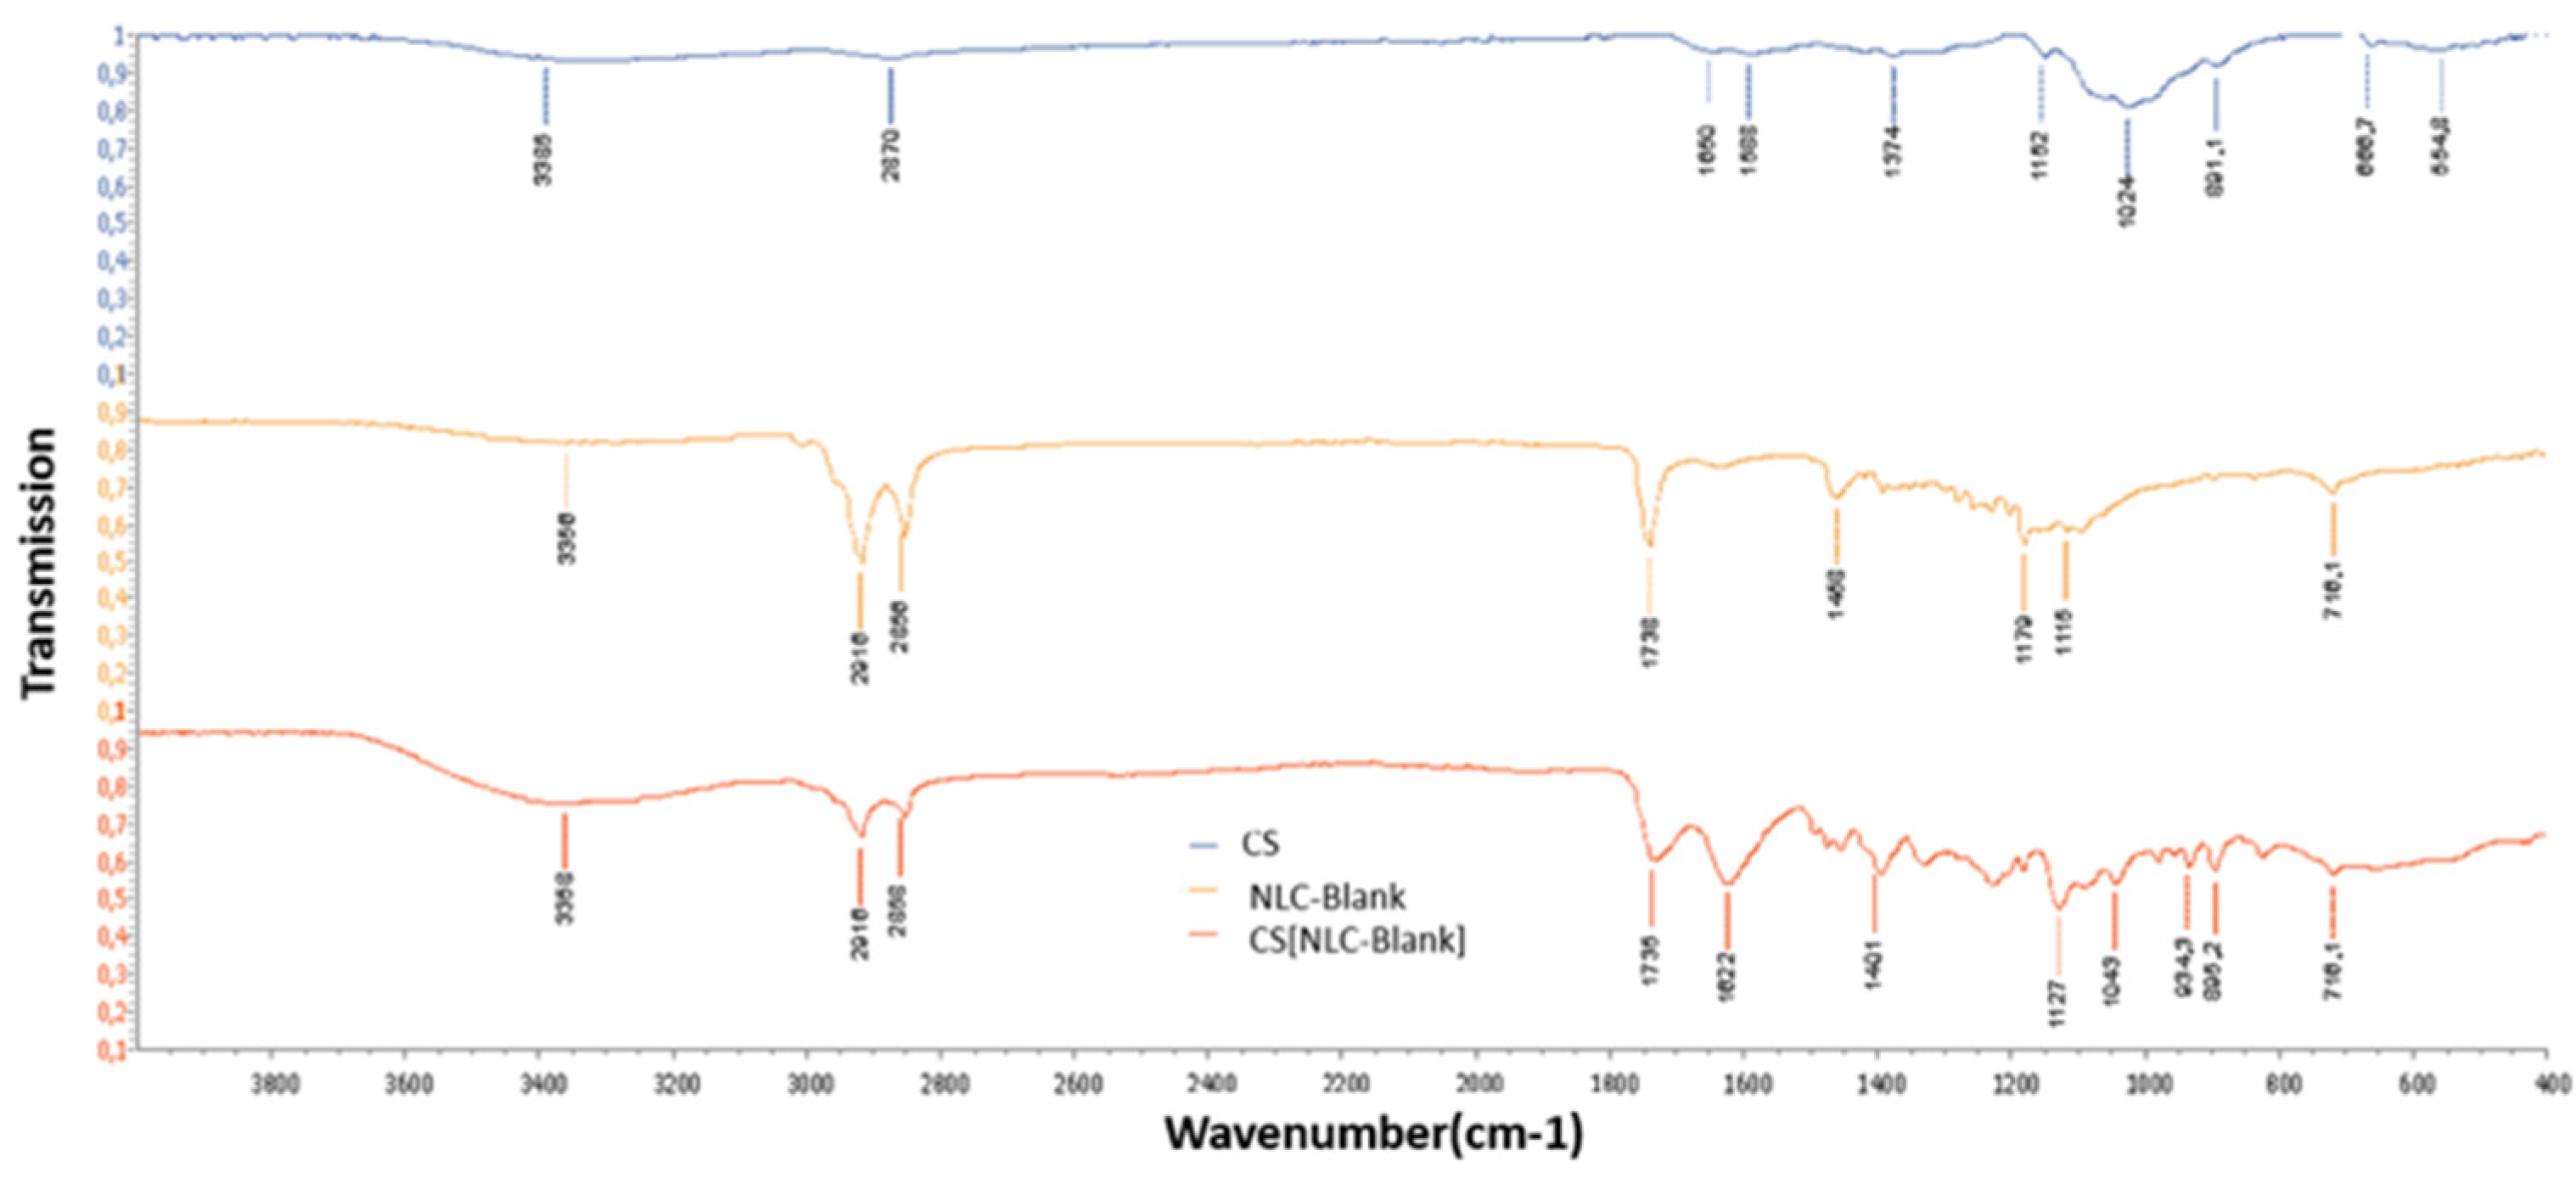
In the FTIR spectrum of chitosan (Figure 8), the absorbance at 3385 cm−1 was attributed to the stretching vibrations of the -O-H and -N-H bonds, and the one at 2870 cm−1 was due to the asymmetric stretching vibration of the -C-H bonds. The presence of the primary amide group (-NHCOCH3), residual from chitin deacetylation, was confirmed by the following absorption bands: 1650 cm−1 attributed to the C=O stretching vibration in amides (amide I band), 1588 cm−1 due to the N-H bending vibration in primary amides (amide II band), and 1374 cm−1 corresponding to the C-N stretching vibration in amides. The band at 1152 cm−1 was due to the asymmetric stretching vibration of the C-O-C bonds in polysaccharides, whereas the band at 1024 cm−1 was attributed to the C-O stretching vibration. In the FTIR spectrum of the NLC-Blank, the main absorption bands were due to trimyristin, as expected, since it was the most abundant component of the formulation: at 2918 and 2858 cm−1, the bands were due to the C-H stretching vibration, at 1738 cm−1, the band was attributed to the C=O stretching vibration of the ester moiety of trimyristin, at 1458 cm−1, the band was due to the symmetric and asymmetric C-H bending, whereas at 1179 cm−1 and at 1115 cm−1, the absorbances were due to the C-O stretching vibration of the ester group.
The FTIR spectrum of the chitosan-coated nanostructured lipid carriers (CS[NLC-blank], Figure 8) had two distinct absorption bands: one at 1735 and one at 1622 cm−1, which can be attributed to the C=O stretching vibration of the ester moiety of trimyristin and to the C=O stretching vibration of the amide moiety of chitosan, respectively. The absorption wavenumbers of both bands shifted in relation to the corresponding FTIR spectra of pure chitosan and the NLC-blank nanoparticles: the band at 1735 cm−1 shifted by 3 cm−1, whereas the band at 1622 cm−1 shifted by 28 cm−1. These shifts indicate a strong interaction between trimyristin (the main component of the NLC-Blank nanoparticles) with chitosan used as the coating and confirm the success of the coating process.

3.5. Thermogravimetric Analysis (TGA)

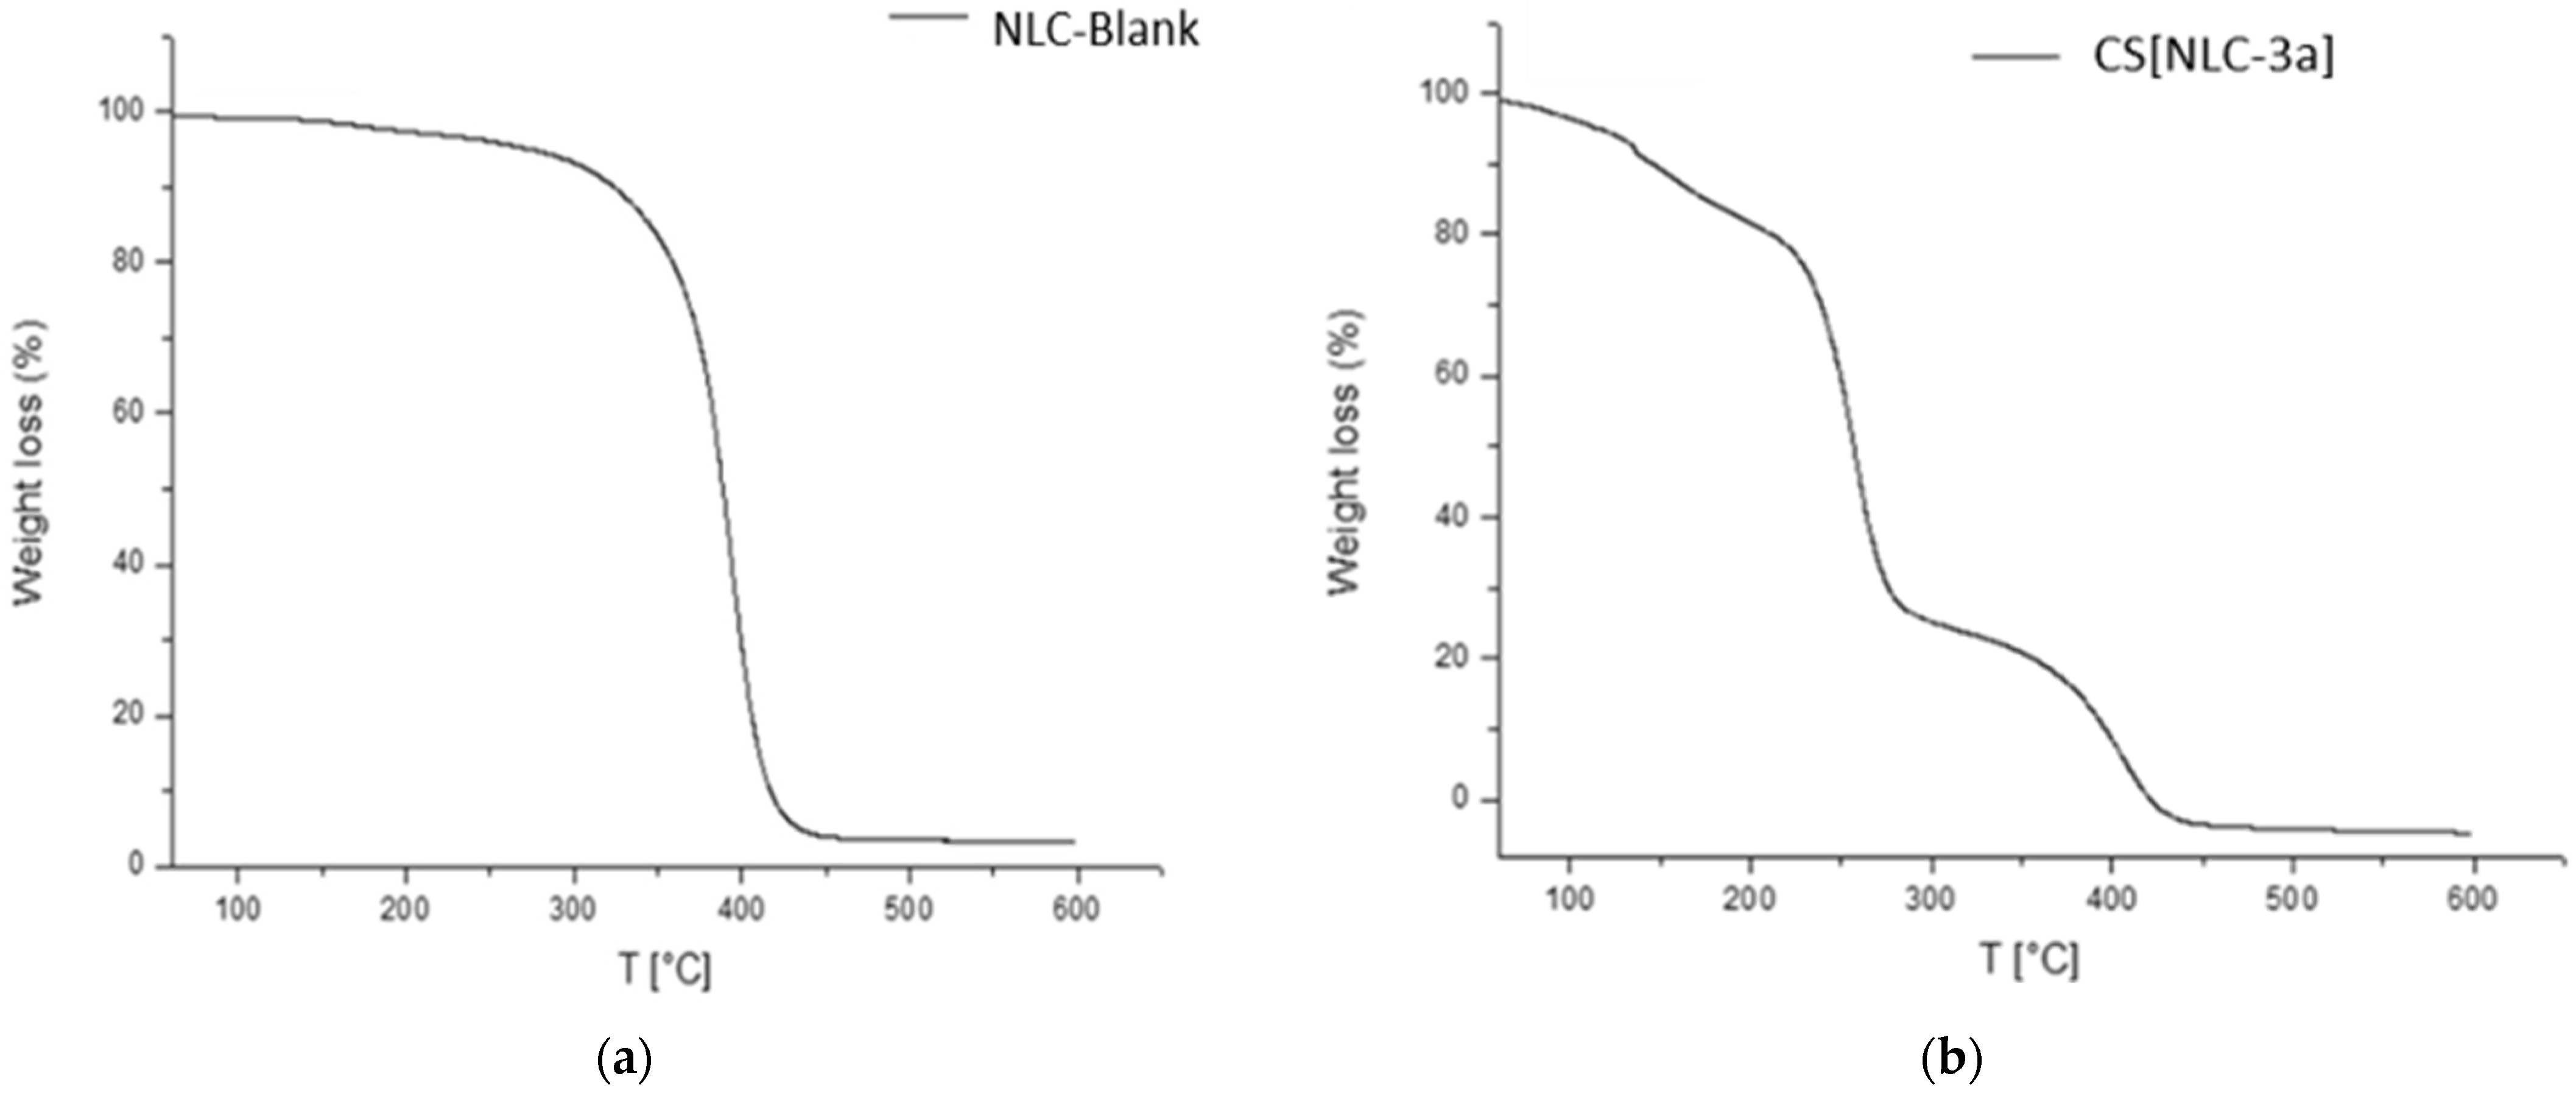
The study of the thermal properties of the NLCs and the change in the thermal properties of octyl ferulate (3a) after the encapsulation in the NLCs were carried out using the thermogravimetric analysis (TGA) method (Figure 9). The NLC-Blank sample presented only one stage of thermal degradation in the temperature range of 350–430 °C. The maximum degradation rate occurred at 393 °C. Since this sample consisted mainly of lipids (trimyristin and olive oil), the thermal degradation of the lipids involved in the formation of NLCs took place at this temperature.
In the TGA curve of CS[NLC-3a], a first stage of mass loss (approximately 17%) was observed in the temperature range of 100–150 °C (maximum rate of loss at 137.5 °C), which was attributed to water evaporation. A second stage was observed in the temperature range of 210–290 °C, with the maximum rate of sample degradation occurring at 260 °C. The weight loss in this decomposition step was 59%. The large percentage of mass loss in this thermal range is likely due to the degradation of chitosan. Additionally, a third stage of mass loss was evident in the temperature range of 350–450 °C, with the maximum rate of decomposition at 404 °C. This particular decomposition stage is similar to that of the NLC-Blank sample, with the difference being that the maximum rate of decomposition occurred at a temperature 10 °C higher. Therefore, it can be concluded that coating the nanoparticles with chitosan led to the thermal stabilization of the NLCs.

3.6. Morphology—Transmission Electron Microscopy (TEM)

The study of the morphology of NLCs was conducted using transmission electron microscopy (TEM) (Figure 10).
The TEM image of the nanostructured lipid carriers without the encapsulated compound (NLC-Blank) revealed that the particles exhibited a relatively uniform spherical morphology, with sizes ranging from 20 to 100 nm and minimal aggregation (Figure 10a). In the TEM image of the NLCs without chitosan coating, in which ester 3a was encapsulated (NLC-3a), it is evident that the nanoparticles maintained a spherical shape post-encapsulation, with sizes varying from 100 nm to 1 µm (Figure 10b). The TEM image of the chitosan-coated loaded-NLCs (CS[NLC-3a]) demonstrated that the nanoparticles retained their spherical shape and smooth surface following the coating process (Figure 10c). Additionally, the CS[NLC-3a]) nanosystem exhibited a more pronounced outline and larger sizes, which can likely be attributed to their coating with chitosan via surface adsorption due to electrostatic interaction. Furthermore, the TEM images revealed a heterogeneity in particle sizes, with smaller particles exhibiting diameters of approximately 200 nm and a spherical shape, alongside larger aggregates with diameters reaching up to 2 µm. This observation aligns with reports in the literature for similar nanosystems [42,43].

3.7. Antioxidant Activity

The antioxidant activity of the synthesized molecules, both in their free and their encapsulated forms, was investigated by evaluating their ability to inhibit the lipid peroxidation of linoleic acid induced by the free radical initiator 2,2′-azobis(2-amidinopropane) dihydrochloride (AAPH). The inhibition was measured at a concentration of 100 µM of the tested compound (Table 12).
Among the tested esters 3a3c, the most potent was n-octyl-ferulate (3a) with an 83.7% inhibition of lipid peroxidation, which was slightly higher than the inhibitory activity of the reference compound Trolox (81%). The ability of alkyl ferulates to inhibit the lipid peroxidation of linoleic acid has been reported by Fang et al. [44], whereas recently, Chen et al. reported that n-octyl ferulate and other alkyl-ferulates exhibited antioxidant activity in soybean oil under frying conditions [45]. Cantele et al. also showed that n-octyl-ferulate enhanced the oxidative stability of 1.0% vegetable oil-in-water (O/W) emulsions [46].
The esters 3b and 3c, possessing a substituted benzyl moiety, showed a 73% inhibition of lipid peroxidation.
Comparing ester 3a and the CS[NLC-3a] nanosystem, a similar lipid peroxidation ability as observed (83.7 and 81.6%, respectively). The nanosystem CS[NLC-3b]) showed an increased lipid peroxidation inhibition compared with the free 3b (88.7 and 73.6%, respectively). The most significant increase in lipid peroxidation inhibition was observed by the nanosystem CS[NLC-3c], which exhibited a 90.7% inhibitory activity and was the most active among all of the tested compounds and nanosystems in this study.

3.8. Evaluation of Photoprotective Activity

The photoprotective activity of the compounds was studied in terms of the Sun Protection Factor (SPF), the UVA/UVB absorption ratio, and the critical wavelength, λc. Initially, the measurement of these parameters was carried out for esters 3a, 3b, and 3c as free compounds, each at a fixed concentration of 2.5% w/w. Before measuring the SPF of the esters, their solubility was tested in a range of solvents widely used in the cosmetics industry, and dibutyl adipate (Saboderm DBA) was selected as the suitable common solvent for all molecules. Subsequently, the photoprotective activity of the aqueous dispersions of nanoparticles, in which the esters were encapsulated, was also evaluated. The measurement was performed by incorporating 500 μL of the NLC dispersions into 5 g of the reference sunscreen formulation (Table 13).
The composition of the reference sunscreen formulation is shown in Table 13, while the results of the evaluation of the photoprotective activity of esters 3a3c are presented in Table 14.
From the results presented in Table 14, it is evident that the UVA/UVB ratio of the esters 3a, 3b, and 3c was below 0.410. Thus, the esters were classified in the “moderate UVA protection” category, but were very close to the “good UVA protection” category [47]. The critical wavelength of esters 3a, 3b, and 3c was 349.8, 343.9, and 342.4 nm, respectively, higher than the λc of OMC (337.7 nm), indicating a broader spectrum of absorbance. Regarding the SPF, the highest value (9.22) was presented by ester 3b, higher than the SPF of OMC (8.19) while esters 3a and 3c exhibited lower SPF values of 4.81 and 5.05, respectively.
Based on these results, the nanosystems encapsulating the most potent photoprotective compound (ester 3b) were incorporated in the reference sunscreen formulation and the activity of the final formulation was evaluated (Table 15).
The results indicate that incorporation of the blank nanosystems (NLC-Blank) without the chitosan coating did not significantly affect the SPF of the formulation (SPF boost 0.23). Incorporation of the chitosan-coated nanosystems (CS[NLC-Blank]) led to a slightly higher SPF boost of 0.35 (2.3%). The incorporation of the dispersion of the NLC-3b nanosystem in the reference sunscreen formulation resulted in an SPF boost of 0.54 (3.6%), however, the incorporation of the dispersion of CS[NLC-3b] led to an impressive SPF boost of 7.35 (49%). It is obvious that the coating with chitosan is crucial for the enhancement in SPF of the nanosystems. This is in accordance with the study of Battistin et al., who used chitosan to coat ZnO nanoparticles and observed a significant increase in the SPF [48]. Moreover, the encapsulation of annatto and saffron in chitosan nanoparticles and their incorporation in sunscreen emulsions has been reported to enhance the SPF value [49].

3.9. Evaluation of the Effect of the Coating on the Stability over Time

Nanostructured lipid carriers in dispersion exhibit a spontaneous tendency to aggregate over time. The rate of increase in nanoparticle aggregation appears to vary depending on their composition and the loading rate of the bioactive compound [50]. The ability of coated nanostructured lipid carriers (NLC-Blank) to resist aggregation compared with uncoated nanostructured lipid carriers (CS[NLC-Blank]) was studied in the present work (Figure 11).
For the above purpose, two NLCs dispersions were synthesized according to the optimal experimental conditions as dictated by the model (ultrasound application time during the formation of the nanoparticles was ST = 10 min). The difference between the two dispersions lies in the fact that one was coated with CS and NADES solution Bet–LA–W (1:2:2.5) with a content of 4% v/v NADES and 0.3% w/v CS. The two dispersions were measured in terms of the hydrodynamic diameter and the distribution of the nanoparticles’ size with the NTA method within one day after their formation and within 60 days after their formation. The results are presented in Table 16.
It was observed that the average hydrodynamic diameter of the nanoparticles increased significantly in both cases after two months. More specifically, a 24% increase in mean hydrodynamic diameter was observed for the uncoated particles. On the contrary, the corresponding increase was 14% in the case of coated nanoparticles. There was a greater tendency for aggregation in the case of uncoated nanoparticles, which can be attributed to the positive charge that the NLCs acquire after being coated with chitosan, and by extension, the intense repulsive forces developing between them.

4. Conclusions

In this work, three esters of ferulic acid were successfully synthesized and evaluated for their photoprotective and antioxidant properties. Among them, ester 3b, obtained from p-methoxybenzyl alcohol, showed the highest SPF value, while n-octyl ferulate (3a) was the most effective inhibitor of lipid peroxidation. To enhance their stability and functionality, all three esters were encapsulated in nanostructured lipid carriers (NLCs), and a novel coating process with chitosan dissolved in a green NADES medium was developed. The coating improved the physicochemical stability of the nanosystems by reducing nanoparticle aggregation and imparting a positive surface charge, as confirmed by the ζ-potential measurements.
Importantly, chitosan-coated NLCs containing ester 3b not only maintained a high stability, but also displayed superior antioxidant and photoprotective performance compared with the free ester and uncoated systems. The incorporation of the nanosystems in a sunscreen formulation led to a significant SPF enhancement, highlighting the synergistic effect of encapsulation and coating. These results suggest that the developed approach could serve as a promising strategy to improve the efficacy of sunscreen boosters or other lipophilic bioactive compounds that face formulation challenges.
Future research should focus on scaling up the encapsulation process, assessing the long-term stability under real storage and application conditions, and exploring the applicability of this nanosystem to a broader range of sunscreen agents or multifunctional cosmetic ingredients. Such advancements could contribute to the development of next-generation formulations with improved safety, efficiency, and consumer acceptance.

Author Contributions

I.P.: Methodology, data curation, writing—original draft preparation, and writing—review and editing. I.K.: Methodology, data curation, and writing—original draft preparation. M.-A.K.: Methodology, data curation, and writing—original draft preparation. M.F.M.: Methodology, data curation, and writing—original draft preparation. C.F.: Resources. A.K.: resources. M.M.: Methodology, resources. N.P.: Methodology, resources. A.T.: Methodology, writing—original draft preparation, and writing—review and editing. A.D.: Conceptualization, supervision, resources, writing—review and editing, and project administration. All authors have read and agreed to the published version of the manuscript.

Funding

This research received no external funding.

Data Availability Statement

The original contributions presented in this study are included in the article. Further inquiries can be directed to the corresponding author.

Acknowledgments

I.P. gratefully acknowledges the State Scholarships Foundation (IKΥ). This research was co-financed by Greece and the European Union (ESF) through the Operational Program (Human Resources Development, Education, and Lifelong Learning) in the context of the project “Strengthening Human Resources Research Potential via Doctorate Research” (MIS-5113934), implemented by the State Scholarships Foundation (IKY).

Conflicts of Interest

The authors declare no conflict of interest.

References

  1. Yaar, M.; Gilchrest, B.A. Photoageing: Mechanism, Prevention and Therapy. Br. J. Dermatol. 2007, 157, 874–887. [Google Scholar] [CrossRef]
  2. Ma, Y.; Yoo, J. History of Sunscreen: An Updated View. J. Cosmet. Dermatol. 2021, 20, 1044–1049. [Google Scholar] [CrossRef]
  3. Tanner, P.R. Sunscreen Product Formulation. Dermatol. Clin. 2006, 24, 53–62. [Google Scholar] [CrossRef]
  4. Schalka, S.; Ravelli, N.; Perim, N.; Vasconcelos, R. Chemical and Physical Sunscreens. In Daily Routine in Cosmetic Dermatology; Clinical Approaches and Procedures in Cosmetic Dermatology; Springer: Cham, Switzerland, 2017. [Google Scholar] [CrossRef]
  5. López-García, R.; Ganem-Rondero, A. Solid Lipid Nanoparticles (SLN) and Nanostructured Lipid Carriers (NLC): Occlusive Effect and Penetration Enhancement Ability. J. Cosmet. Dermatol. Sci. Appl. 2015, 5, 62–72. [Google Scholar] [CrossRef]
  6. Oresajo, C.; Stephens, T.; Hino, P.D.; Law, R.M.; Yatskayer, M.; Foltis, P.; Pillai, S.; Pinnell, S.R. Protective Effects of a Topical Antioxidant Mixture Containing Vitamin C, Ferulic Acid, and Phloretin against Ultraviolet-Induced Photodamage in Human Skin. J. Cosmet. Dermatol. 2008, 7, 290–297. [Google Scholar] [CrossRef] [PubMed]
  7. Saija, A.; Tomaino, A.; Trombetta, D.; De Pasquale, A.; Uccella, N.; Barbuzzi, T.; Paolino, D.; Bonina, F. In Vitro and in Vivo Evaluation of Caffeic and Ferulic Acids as Topical Photoprotective Agents. Int. J. Pharm. 2000, 199, 39–47. [Google Scholar] [CrossRef]
  8. Gasparro, F.P.; Mitchnick, M.; Nash, J.F. A Review of Sunscreen Safety and Efficacy. Photochem. Photobiol. 1998, 68, 243–256. [Google Scholar] [CrossRef] [PubMed]
  9. Xu, C.; Zeng, X.; Yang, Z.; Ji, H. Sunscreen Enhancement of Octyl Methoxycinnamate Microcapsules by Using Two Biopolymers as Wall Materials. Polymers 2021, 13, 866. [Google Scholar] [CrossRef]
  10. Cahova, J.; Blahova, J.; Marsalek, P.; Doubkova, V.; Franc, A.; Garajová, M.; Tichy, F.; Mares, J.; Svobodova, Z. The Biological Activity of the Organic UV Filter Ethylhexyl Methoxycinnamate in Rainbow Trout (Oncorhynchus mykiss). Sci. Total Environ. 2021, 774, 145570. [Google Scholar] [CrossRef]
  11. Yamada, M.; Mohammed, Y.; Prow, T.W. Advances and Controversies in Studying Sunscreen Delivery and Toxicity. Adv. Drug Deliv. Rev. 2020, 153, 72–86. [Google Scholar] [CrossRef]
  12. Mall, J.; Naseem, N.; Haider, M.F.; Rahman, M.A.; Khan, S.; Siddiqui, S.N. Nanostructured Lipid Carriers as a Drug Delivery System: A Comprehensive Review with Therapeutic Applications. Intell. Pharm. 2025, 3, 243–255. [Google Scholar] [CrossRef]
  13. Naseri, N.; Valizadeh, H.; Zakeri-Milani, P. Solid Lipid Nanoparticles and Nanostructured Lipid Carriers: Structure, Preparation and Application. Adv. Pharm. Bull. 2015, 5, 305. [Google Scholar] [CrossRef] [PubMed]
  14. Beloqui, A.; Solinís, M.Á.; Rodríguez-Gascón, A.; Almeida, A.J.; Préat, V. Nanostructured Lipid Carriers: Promising Drug Delivery Systems for Future Clinics. Nanomedicine 2016, 12, 143–161. [Google Scholar] [CrossRef]
  15. Garcês, A.; Amaral, M.H.; Sousa Lobo, J.M.; Silva, A.C. Formulations Based on Solid Lipid Nanoparticles (SLN) and Nanostructured Lipid Carriers (NLC) for Cutaneous Use: A Review. Eur. J. Pharm. Sci. 2018, 112, 159–167. [Google Scholar] [CrossRef]
  16. Chauhan, I.; Yasir, M.; Verma, M.; Singh, A.P. Nanostructured Lipid Carriers: A Groundbreaking Approach for Transdermal Drug Delivery. Adv. Pharm. Bull. 2020, 10, 150–165. [Google Scholar] [CrossRef]
  17. Elmowafy, M.; Al-Sanea, M.M. Nanostructured Lipid Carriers (NLCs) as Drug Delivery Platform: Advances in Formulation and Delivery Strategies. Saudi Pharm. J. 2021, 29, 999–1012. [Google Scholar] [CrossRef]
  18. Jaiswal, P.; Gidwani, B.; Vyas, A. Nanostructured Lipid Carriers and Their Current Application in Targeted Drug Delivery. Artif. Cells Nanomed. Biotechnol. 2016, 44, 27–40. [Google Scholar] [CrossRef]
  19. Li, Q.; Cai, T.; Huang, Y.; Xia, X.; Cole, S.P.C.; Cai, Y. A Review of the Structure, Preparation, and Application of NLCs, PNPs, and PLNs. Nanomaterials 2017, 7, 122. [Google Scholar] [CrossRef] [PubMed]
  20. Nikolić, S.; Keck, C.M.; Anselmi, C.; Müller, R.H. Skin Photoprotection Improvement: Synergistic Interaction between Lipid Nanoparticles and Organic UV Filters. Int. J. Pharm. 2011, 414, 276–284. [Google Scholar] [CrossRef] [PubMed]
  21. Niculae, G.; Lacatusu, I.; Bors, A.; Stan, R. Photostability Enhancement by Encapsulation of α-Tocopherol into Lipid-Based Nanoparticles Loaded with a UV Filter. Comptes Rendus Chim. 2014, 17, 1028–1033. [Google Scholar] [CrossRef]
  22. Prado, A.H.D.; Araújo, V.H.S.; Eloy, J.O.; Fonseca-Santos, B.; Pereira-Da-Silva, M.A.; Peccinini, R.G.; Chorilli, M. Synthesis and Characterization of Nanostructured Lipid Nanocarriers for Enhanced Sun Protection Factor of Octyl P-Methoxycinnamate. AAPS PharmSciTech 2020, 21, 125. [Google Scholar] [CrossRef]
  23. Damiani, E.; Puglia, C. Nanocarriers and Microcarriers for Enhancing the UV Protection of Sunscreens: An Overview. J. Pharm. Sci. 2019, 108, 3769–3780. [Google Scholar] [CrossRef]
  24. Santos, A.C.; Marto, J.; Chá-Chá, R.; Martins, A.M.; Pereira-Silva, M.; Ribeiro, H.M.; Veiga, F. Nanotechnology-Based Sunscreens—A Review. Mater. Today Chem. 2022, 23, 100709. [Google Scholar] [CrossRef]
  25. Wang, K.; Zhang, Q.J.; Miao, Y.L.; Luo, S.Q.; Wang, H.C.; Zhang, W.P. Effect of Solid Lipid’s Structure on Nanostructured Lipid Carriers Encapsulated with Sun Filter: Characterisation, Photo-Stability and in Vitro Release. J. Microencapsul. 2017, 34, 104–110. [Google Scholar] [CrossRef] [PubMed]
  26. Chu, C.C.; Tan, C.P.; Nyam, K.L. Development of Nanostructured Lipid Carriers (NLCs) Using Pumpkin and Kenaf Seed Oils with Potential Photoprotective and Antioxidative Properties. Eur. J. Lipid Sci. Technol. 2019, 121, 1900082. [Google Scholar] [CrossRef]
  27. Badea, G.; Lăcătuşu, I.; Badea, N.; Ott, C.; Meghea, A. Use of Various Vegetable Oils in Designing Photoprotective Nanostructured Formulations for UV Protection and Antioxidant Activity. Ind. Crops Prod. 2015, 67, 18–24. [Google Scholar] [CrossRef]
  28. Mazzotta, S.; Baron, G.; Fumagalli, L. Stable Isotopic Labelling of β-Sitosteryl Ferulate for Use as Analytical Tool. Food Chem. X 2022, 13, 100227. [Google Scholar] [CrossRef]
  29. Gilles, V.; Vieira, M.A.; Lacerda, V.; Castro, E.V.R.; Santos, R.B.; Orestes, E.; Carneiro, J.W.M.; Greco, S.J. A New, Simple and Efficient Method of Steglich Esterification of Juglone with Long-Chain Fatty Acids: Synthesis of a New Class of Non-Polymeric Wax Deposition Inhibitors for Crude Oil. J. Braz. Chem. Soc. 2015, 26, 74–83. [Google Scholar] [CrossRef]
  30. Bashiri, S.; Ghanbarzadeh, B.; Ayaseh, A.; Dehghannya, J.; Ehsani, A. Preparation and Characterization of Chitosan-Coated Nanostructured Lipid Carriers (CH-NLC) Containing Cinnamon Essential Oil for Enriching Milk and Anti-Oxidant Activity. LWT 2020, 119, 108836. [Google Scholar] [CrossRef]
  31. Tzani, A.; Kalafateli, S.; Tatsis, G.; Bairaktari, M.; Kostopoulou, I.; Pontillo, A.R.N.; Detsi, A. Natural Deep Eutectic Solvents (NaDESs) as Alternative Green Extraction Media for Ginger (Zingiber officinale Roscoe). Sustain. Chem. 2021, 2, 576–598. [Google Scholar] [CrossRef]
  32. Katopodi, A.; Safari, K.; Kalospyros, A.; Politopoulos, K.; Alexandratou, E.; Detsi, A. Preparation and Characterization of Solid Lipid Nanoparticles Incorporating Bioactive Coumarin Analogues as Photosensitizing Agents. Colloids Surf. B Biointerfaces 2023, 229, 113439. [Google Scholar] [CrossRef]
  33. Tzani, A.; Pitterou, I.; Divani, F.; Tsiaka, T.; Sotiroudis, G.; Zoumpoulakis, P.; Detsi, A. Green Extraction of Greek Propolis Using Natural Deep Eutectic Solvents (NADES) and Incorporation of the NADES-Extracts in Cosmetic Formulation. Sustain. Chem. 2022, 4, 8–25. [Google Scholar] [CrossRef]
  34. Qosa, H.; Mohamed, L.A.; Batarseh, Y.S.; Alqahtani, S.; Ibrahim, B.; LeVine, H.; Keller, J.N.; Kaddoumi, A. Extra-Virgin Olive Oil Attenuates Amyloid-β and Tau Pathologies in the Brains of TgSwDI Mice. J. Nutr. Biochem. 2015, 26, 1479–1490. [Google Scholar] [CrossRef]
  35. Jenkins, D.J.A.; Kendall, C.W.C.; Marchie, A.; Parker, T.L.; Connelly, P.W.; Qian, W.; Haight, J.S.; Faulkner, D.; Vidgen, E.; Lapsley, K.G.; et al. Dose Response of Almonds on Coronary Heart Disease Risk Factors: Blood Lipids, Oxidized Low-Density Lipoproteins, Lipoprotein(a), Homocysteine, and Pulmonary Nitric Oxide: A Randomized, Controlled, Crossover Trial. Circulation 2002, 106, 1327–1332. [Google Scholar] [CrossRef]
  36. Zafar, A.; Imam, S.S.; Yasir, M.; Alruwaili, N.K.; Alsaidan, O.A.; Warsi, M.H.; Ullah, S.N.M.N.; Alshehri, S.; Ghoneim, M.M. Preparation of NLCs-Based Topical Erythromycin Gel: In Vitro Characterization and Antibacterial Assessment. Gels 2022, 8, 116. [Google Scholar] [CrossRef]
  37. Pitterou, I.; Kalogeropoulou, F.; Tzani, A.; Tsiantas, K.; Gatou, M.A.; Pavlatou, E.; Batrinou, A.; Fountzoula, C.; Kriebardis, A.; Zoumpoulakis, P.; et al. Development of Alginate Hydrogels Incorporating Essential Oils Loaded in Chitosan Nanoparticles for Biomedical Applications. Molecules 2024, 29, 5318. [Google Scholar] [CrossRef] [PubMed]
  38. McComiskey, K.P.M.; Tajber, L. Comparison of Particle Size Methodology and Assessment of Nanoparticle Tracking Analysis (NTA) as a Tool for Live Monitoring of Crystallisation Pathways. Eur. J. Pharm. Biopharm. 2018, 130, 314–326. [Google Scholar] [CrossRef] [PubMed]
  39. Matarazzo, A.P.; Rios, C.A.; Gerônimo, G.; Ondei, R.; de Paula, E.; Breitkreitz, M.C. Development of a Versatile Nanostructured Lipid Carrier (NLC) Using Design of Experiments (DoE)—Part II: Incorporation and Stability of Butamben with Different Surfactants. Pharmaceutics 2024, 16, 863. [Google Scholar] [CrossRef] [PubMed]
  40. Golalipour, A.; Mohammadi, A.; Hosseinzadeh, S.; Soltani, A.; Erfani-Moghadam, V. Synergistic Cytotoxicity of Olive Leaf Extract-Loaded Lipid Nanocarriers Combined with Newcastle Disease Virus against Cervical Cancer Cells. PLoS ONE 2024, 19, e0308599. [Google Scholar] [CrossRef]
  41. Taha, E.; Nour, S.A.; Mamdouh, W.; Selim, A.A.; Swidan, M.M.; Ibrahim, A.B.; Naguib, M.J. Cod Liver Oil Nano-Structured Lipid Carriers (Cod-NLCs) as a Promising Platform for Nose to Brain Delivery: Preparation, in Vitro Optimization, Ex Vivo Cytotoxicity & in Vivo Biodistribution Utilizing Radioiodinated Zopiclone. Int. J. Pharm. X 2023, 5, 100160. [Google Scholar] [CrossRef]
  42. Zewail, M.; Nafee, N.; Helmy, M.W.; Boraie, N. Coated Nanostructured Lipid Carriers Targeting the Joints—An Effective and Safe Approach for the Oral Management of Rheumatoid Arthritis. Int. J. Pharm. 2019, 567, 118447. [Google Scholar] [CrossRef]
  43. Lee, S.A.; Joung, H.J.; Park, H.J.; Shin, G.H. Preparation of Chitosan-Coated Nanostructured Lipid Carriers (CH-NLCs) to Control Iron Delivery and Their Potential Application to Food Beverage System. J. Food Sci. 2017, 82, 904–912. [Google Scholar] [CrossRef]
  44. Fang, X.; Shima, M.; Kadota, M.; Tsuno, T.; Adachi, S. Suppressive Effect of Alkyl Ferulate on the Oxidation of Linoleic Acid. Biosci. Biotechnol. Biochem. 2006, 70, 457–461. [Google Scholar] [CrossRef]
  45. Chen, J.; Zhang, L.; Zhao, P.; Ma, G.; Li, Q.; Yu, X. Synthesized Alkyl Ferulates with Different Chain Lengths Inhibited the Formation of Lipid Oxidation Products in Soybean Oil during Deep Frying. Food Chem. 2023, 410, 135458. [Google Scholar] [CrossRef] [PubMed]
  46. Cantele, C.; Martina, K.; Potenziani, G.; Rossi, A.M.; Cardenia, V.; Bertolino, M. Antioxidant Properties of Ferulic Acid-Based Lipophenols in Oil-in-Water (O/W) Emulsions. LWT 2023, 189, 115505. [Google Scholar] [CrossRef]
  47. Garoli, D.; Pelizzo, M.G.; Bernardini, B.; Nicolosi, P.; Alaibac, M. Sunscreen Tests: Correspondence between in Vitro Data and Values Reported by the Manufacturers. J. Dermatol. Sci. 2008, 52, 193–204. [Google Scholar] [CrossRef]
  48. Battistin, M.; Bonetto, A.; Nicoli, F.; Torreggiani, E.; Brunetta, A.; Cesa, E.; Manfredini, S.; Baldisserotto, A.; Vertuani, S. Synthesis and Evaluation of a ZnO-Chitosan Adduct for Safe and Sustainable Enhanced Ultra-Violet (UV) Sunscreens Protection. Molecules 2024, 29, 5204. [Google Scholar] [CrossRef] [PubMed]
  49. Ntohogian, S.; Gavriliadou, V.; Christodoulou, E.; Nanaki, S.; Lykidou, S.; Naidis, P.; Mischopoulou, L.; Barmpalexis, P.; Nikolaidis, N.; Bikiaris, D.N. Chitosan Nanoparticles with Encapsulated Natural and Uf-Purified Annatto and Saffron for the Preparation of UV Protective Cosmetic Emulsions. Molecules 2018, 23, 2107. [Google Scholar] [CrossRef]
  50. Rabelo, R.S.; Oliveira, I.F.; da Silva, V.M.; Prata, A.S.; Hubinger, M.D. Chitosan Coated Nanostructured Lipid Carriers (NLCs) for Loading Vitamin D: A Physical Stability Study. Int. J. Biol. Macromol. 2018, 119, 902–912. [Google Scholar] [CrossRef]
Figure 1. Chemical structure of the commercially used sunscreen filter octylmethoxycinnamate (OMC).
Macromol 05 00050 g001
Figure 2. The difference in the structure of 1st- and 2nd-generation lipid nanoparticles.
Macromol 05 00050 g002
Figure 3. Synthetic methodology of the final esters. Reagents and conditions: (i) acetic anhydride, pyridine, 24 h, 80 °C; (ii) alcohol, DCM, DCC, DMAP, 48 h, r.t.; (iii) NaBH4, THF, 24 h, 45 °C.
Macromol 05 00050 g003
Figure 4. Comparison of the DLS and NTA methods according to the hydrodynamic diameter of CS[NLC-3a].
Macromol 05 00050 g004
Figure 5. (a) Image from the camera of the NTA method instrument as a dispersion of [NLC-3a] passes through the chamber. (b) Nanoparticle size and concentration distribution measured by NTA (size in nm, concentration in 107 particles/mL). (c) Image from the camera of the NTA method instrument and the size distribution of the nanoparticles shown in this image. (d) 3D visualization of the sample nanoparticle size distribution.
Macromol 05 00050 g005
Figure 6. Plots of nanoparticle size response illustrating the correlation of nanoparticle size(nm)with sonication time (ST, min) and NADES concentration (% v/v) in 2D and 3D.
Macromol 05 00050 g006
Figure 7. Plots of encapsulation efficiency response illustrating the correlation of encapsulation efficiency (EE,%) with sonication time (ST, min) and drug loading (DL,%) in 2D and 3D.
Macromol 05 00050 g007
Figure 8. ATR/FTIR spectrum of chitosan and nanostructured lipid carriers (NLCs) with or without coating. Blue: chitosan; Orange: NLC-Blank; Red: CS[NLC-Blank].
Macromol 05 00050 g008
Figure 9. TGA graphs for (a) NLC-Blank and (b) CS[NLC-3a].
Macromol 05 00050 g009
Figure 10. TEM images of the nanostructured lipid carriers (NLCs) (a) without the encapsulated compound (NLC-Blank), (b) with encapsulated ester 3a without coating (NLC-3a), and (c) with encapsulated ester 3a and coated with chitosan (CS[NLC-3a]).
Macromol 05 00050 g010
Figure 11. Illustration of the coating mechanism of NLCs with CS.
Macromol 05 00050 g011
Table 1. Dependent and independent variables of the experimental design.
FactorsResponses
Sonication time (ST, min)Size of NLCs (size, nm)
NADES (% v/v)Encapsulation efficiency (%EE)
Drug loading (DL % w/w)
Table 2. Raw and coded values of independent variables of the experimental design.
Independent Variables
RunSonication Time (ST) (min)NADES (% v/v)DL (% w/w)
17.504030
27.506+11−1
37.504030
47.504030
55−16+130
610+12–130
77.502−15+1
87.502–11−1
95−12–130
1010+1405+1
115–1405+1
127.506+15+1
1310+16+130
1410+1401−1
155−1401−1
Table 3. Structures of the synthesized esters 2a2c and 3a3c.
CompoundStructureYield (%)CompoundStructureYield (%)
2aMacromol 05 00050 i001653aMacromol 05 00050 i00254
2bMacromol 05 00050 i003573bMacromol 05 00050 i00438
2cMacromol 05 00050 i005403cMacromol 05 00050 i00645
Table 4. Conditions and results of the preliminary experiments for CS[NLC-3a] prepared using almond oil and olive oil as liquid lipids.
ConditionsResults
Almond OilOlive Oil
Sonication Time (min)ΝADES
(% v/v)
DL
(% w/w)
Hydrodynamic Diameter (nm)ζ-Potential (mV)EE (%)Hydrodynamic Diameter (nm)ζ-Potential (mV)EE (%)
7.540126.4 ± 1.721.9 ± 1.2-109.9 ± 0.621.6 ± 1.5-
7.561155.0 ± 9.530.7 ± 0.598183.2 ± 17.124.3 ± 8.896
7.543188.7 ± 19.420.1 ± 3.990154.7 ± 28.824.5 ± 5.796
7.563205.5 ± 3.736.3 ± 4.691112.5 ± 4.421.1 ± 1.997
Table 5. Response values for the fifteen performed experiments as indicated by the experimental design.
ConditionsResults
RunSonication Time (ST) (min)NADES (% v/v)DL (% w/w)Hydrodynamic Diameter NTA (nm)ΕΕ (%)
17.504030154.7 ± 28.890
27.506+11−1183.2 ± 17.181
37.504030151.3 ± 4.591
47.504030146.3 ± 5.092
55−16+130112.5 ± 4.480
610+12–130112.2 ± 5.395
77.502−15+1119.3 ± 0.867
87.502–11−1129.8 ± 1.363
95−12–130134.8 ± 0.782
1010+1405+1116.0 ± 2.176
115–1405+1111.6 ± 2.070
127.506+15+1123.1 ± 1.366
1310+16+130131.2 ± 2.466
1410+1401−1141.5 ± 4.570
155−1401−1130.4 ± 1.842
Table 6. Results for the size and polydispersity index of the CS [NLC-3a] dispersion obtained with the DLS method.
ConditionsResults
RunSonication Time (ST) (min)NADES (% v/v)DL (% w/w)Hydrodynamic Diameter DLS (nm)PDI
17.504030241.7 ± 7.30.557 ± 0.103
27.506+11−1267.6 ± 3.00.343 ± 0.031
37.504030233.2 ± 2.40.298 ± 0.009
47.504030175.8 ± 7.10.317 ± 0.015
55−16+130242.4 ± 2.90.342 ± 0.026
610+12–130172.4 ± 57.20.426 ± 0.269
77.502−15+1258.1 ± 6.10.315 ± 0.015
87.502–11−1231.9 ± 8.60.298 ± 0.002
95−12–130177.3 ± 1.20.304 ± 0.016
1010+1405+1220.0 ± 10.30.313 ± 0.025
115–1405+1288.0 ± 6.80.149 ± 0.009
127.506+15+1194.6 ± 8.80.284 ± 0.068
1310+16+130141.7 ± 9.20.474 ± 0.056
1410+1401−1167.7 ± 2.10.337 ± 0.033
155−1401−1153.0 ± 2.30.395 ± 0.005
Table 7. Significance of each factor equation model terms for the size of CS[NLC-3a] in dispersion.
ModelLack of FitABCABBCA2B2C2
p-value0.02540.75630.62410.30140.00850.04070.23240.00870.07350.1534
F-value5.560.48740.26661.2814.796.761.7614.624.692.67
(3)
Table 8. Significance of each factor equation model terms for the encapsulation efficiency of octyl ferulate (3a) in CS[NLC-3a].
ModelLack of FitACA2C2
p-value0.0450,33370.30060.46430.21810.0069
F-value3.601.421.190.57891.7311.48
Table 9. Limits of the values of the independent and dependent variables combined with the optimization criteria.
Lower LimitUpper LimitCriteria
A: ST (min)510-
B: NADES (% v/v)26-
C: DL (% w/w)15-
Size (nm)111.6154.7Minimize
EE (%)4295Maximize
Table 10. Confirmation experiments for the optimization process and predicted values of the selected responses.
Hydrodynamic Diameter (nm)ΕΕ (%)
Mean116.7 ± 5.078.7 ± 23.0
Predicted (%)118.40 ± 11.3777.50 ± 10.69
95% PI low99.2261.93
95% PI high139.5899.86
Table 11. Evaluation of CS[NLCs] encapsulating 3b and 3c under the optimal conditions (10 min ST, 4% v/v NADES, and 4.22% w/w DL).
CompoundHydrodynamic Diameter (nm)EE (%)
CS[NLC-3b]105.3 ± 13.475.5 ± 9.1
CS[NLC-3c]138.7 ± 9.338.0 ± 5.6
Predicted (%)118.40 ± 11.3777.50 ± 10.69
Table 12. % Inhibition of lipid peroxidation of esters 3a3c and the corresponding CS[NLC} nanosystems.
Sample(%) Inhibition of Lipid Peroxidation
(100 μM)
Macromol 05 00050 i00783.7 ± 3.6
CS[NLC-3a]81.6 ± 11.8
Macromol 05 00050 i00873.6 ± 10.4
CS[NLC-3b]88.7 ± 7.6
Macromol 05 00050 i00973.6 ± 10.5
CS[NLC-3c]90.7± 5.5
Macromol 05 00050 i010
Trolox
81.0 ± 0.1
Table 13. Composition of the reference sunscreen formulation.
Sunscreen FiltersContent (% w/w)
Diethylamino hydroxybenzoyl hexyl benzoate4.0
Ethylhexyl salicylate5.0
Ethylhexyl triazone1.5
Octocrylene3.0
Tris-biphenyl triazine2.0
Table 14. Photoprotective activity of esters 3a3c.
SampleSPFUVA/UVBλcEster Concentration in DBA
(% w/w)
Macromol 05 00050 i0114.45 ± 0.880.405 ± 0.01349.8 ± 0.412.5
Macromol 05 00050 i0129.22 ± 1.980.381 ± 0.01343.9 ± 0.222.5
Macromol 05 00050 i0135.05 ± 0.540.375 ± 0.01342.4 ± 0.012.5
Macromol 05 00050 i0148.19 ± 0.860.153 ± 0.01337.7 ± 0.192.5
Table 15. Photoprotective activity of nanosystems incorporated in the reference sunscreen formulation.
SampleEster Content in the Formulation (%w/w)SPFSPF BoostUVA/UVBλc
Reference sunscreen formulation015.12 ± 5.43-0.694 ± 0.01375.3 ± 0.54
NLC-Blank015.35 ± 3.960.230.700 ± 0.01375.6 ± 0.70
CS[NLC-Blank]015.47 ± 2.200.350.684 ± 0.01374.9 ± 0.25
NLC-3b0.00715.66 ± 3.070.540.696 ± 0.01375.2 ± 0.38
CS[NLC-3b]0.00722.47± 6.207.350.701 ± 0.01375.7 ± 0.31
Table 16. Change in nanoparticle size over time.
Size (nm)
1 Day60 Days
NLC-Blank131.3 ± 2.2162.4 ± 4.8
CS[NLC-Blank]116.0 ± 2.1132.3 ± 1.7
Disclaimer/Publisher’s Note: The statements, opinions and data contained in all publications are solely those of the individual author(s) and contributor(s) and not of MDPI and/or the editor(s). MDPI and/or the editor(s) disclaim responsibility for any injury to people or property resulting from any ideas, methods, instructions or products referred to in the content.