
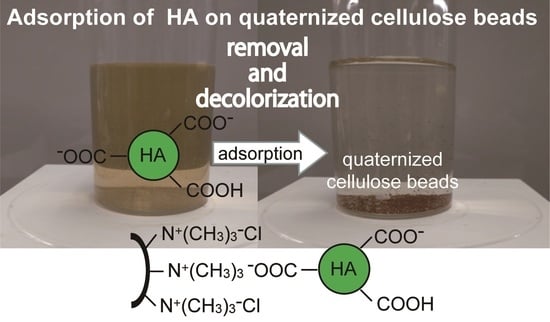
Kinetic, Isothermal, and Thermodynamic Analyses of Adsorption of Humic Acid on Quaternized Porous Cellulose Beads


Abstract
1. Introduction
2. Materials and Methods
2.1. Chemicals
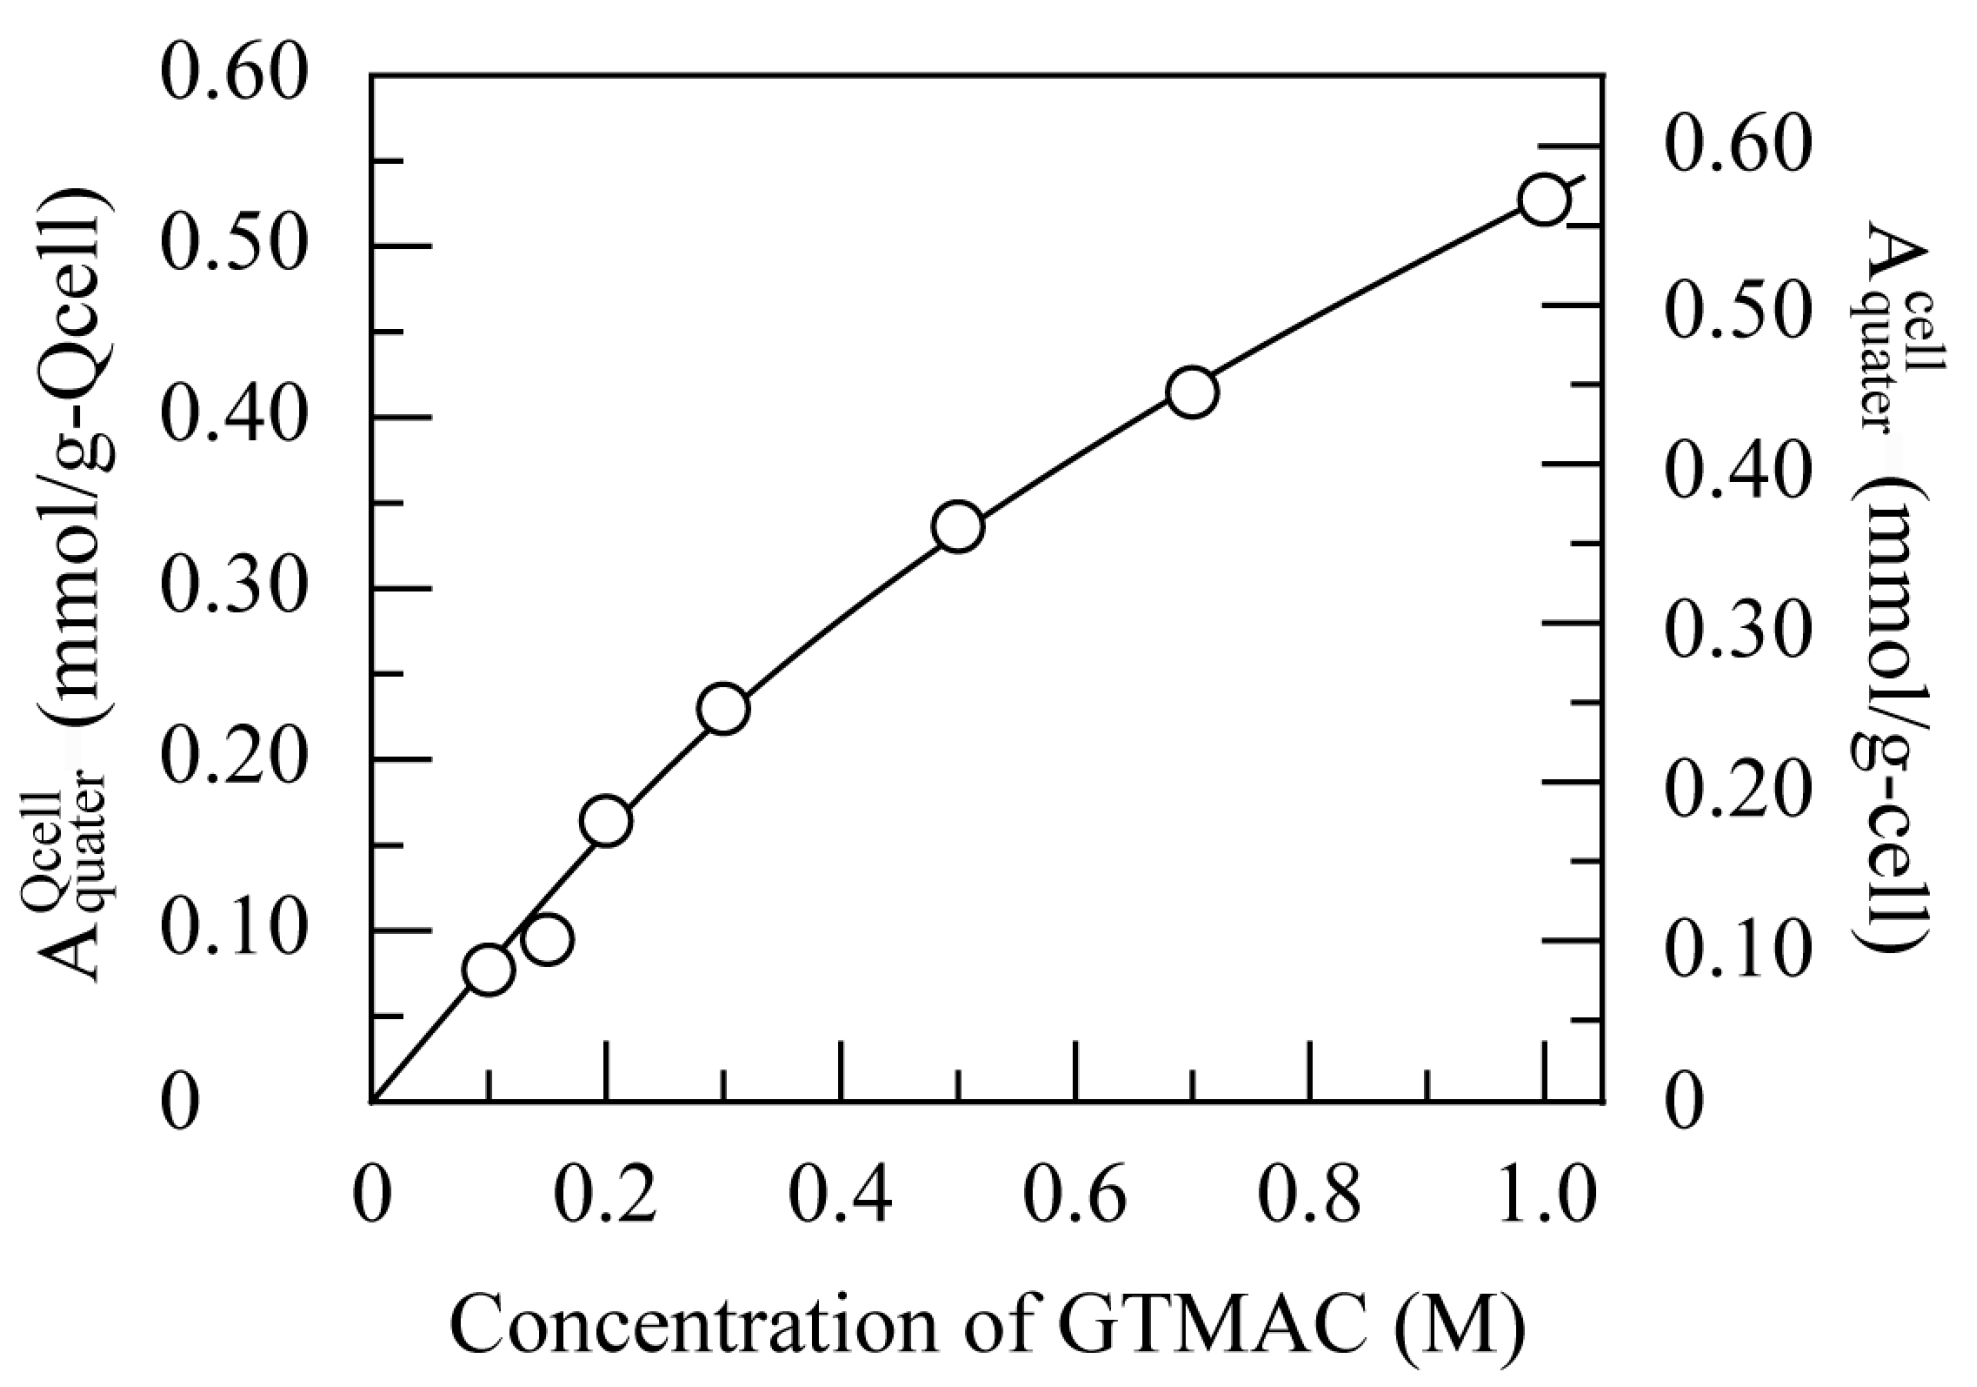
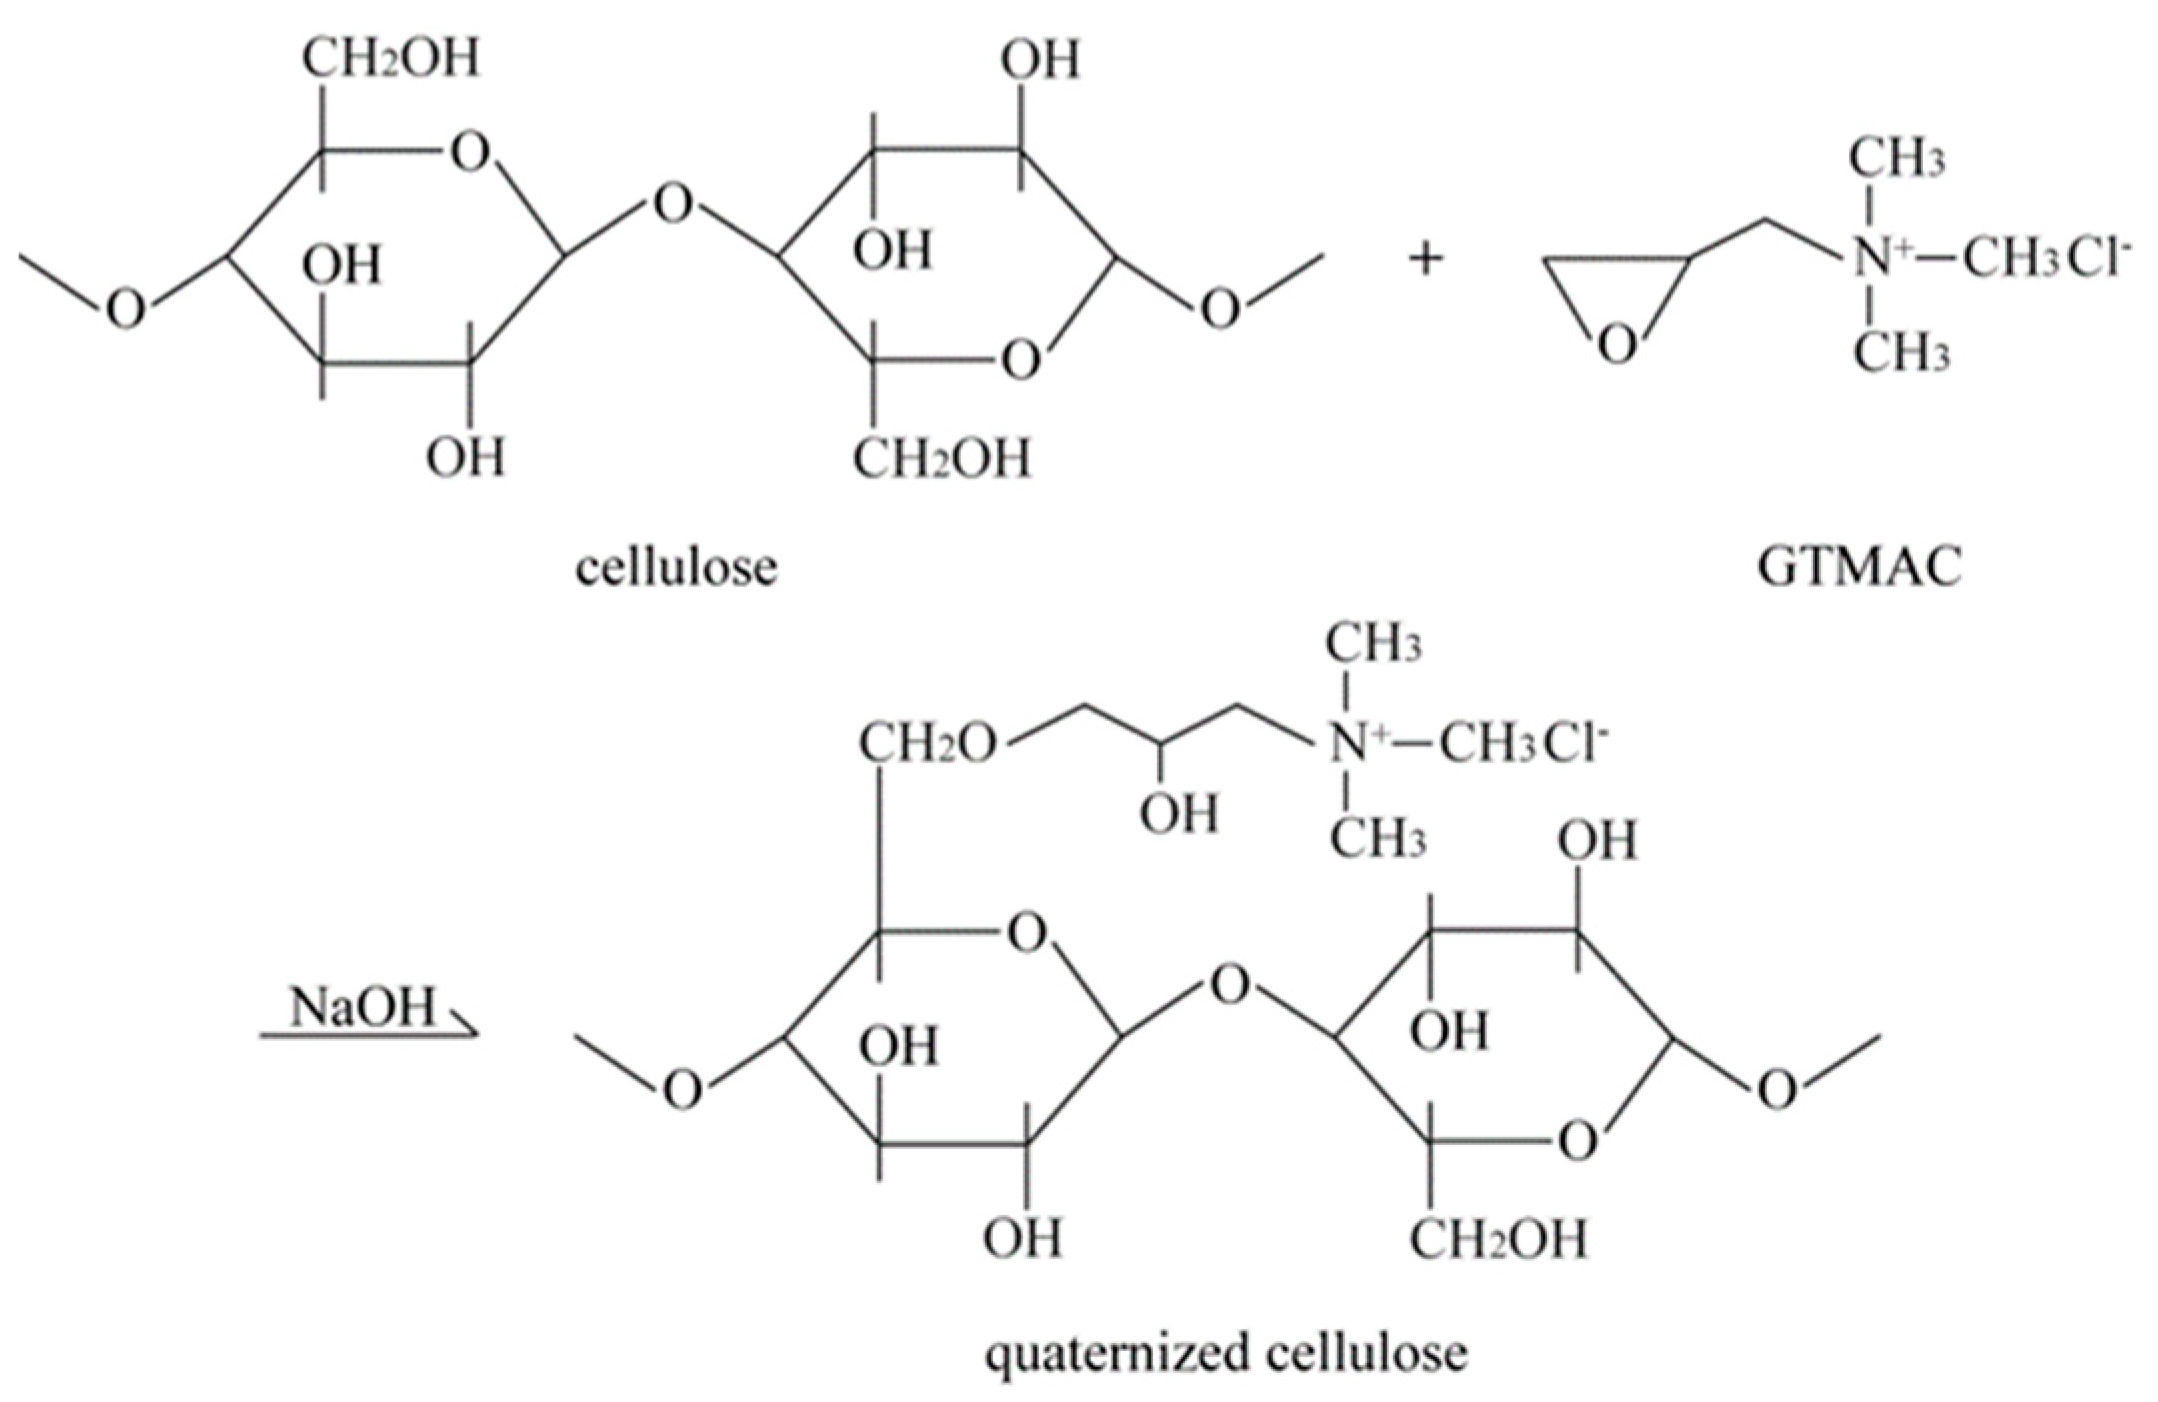
2.2. Quaternization of Cellulose Beads
2.3. Determination of Content of Quaternary Ammonium Groups
2.4. Analysis by FT-IR and XPS
2.5. Particle Distribution
2.6. Water Content
2.7. Preparation of HA Solutions
2.8. HA Adsorption
2.9. Analysis by Kinetics Equations
2.10. Analysis by Adsorption Isotherms
2.11. Desorption
3. Results and Discussion
3.1. Preparation of Quaternized Cellulose
3.2. Characterization of Quaternized Cellulose Beads
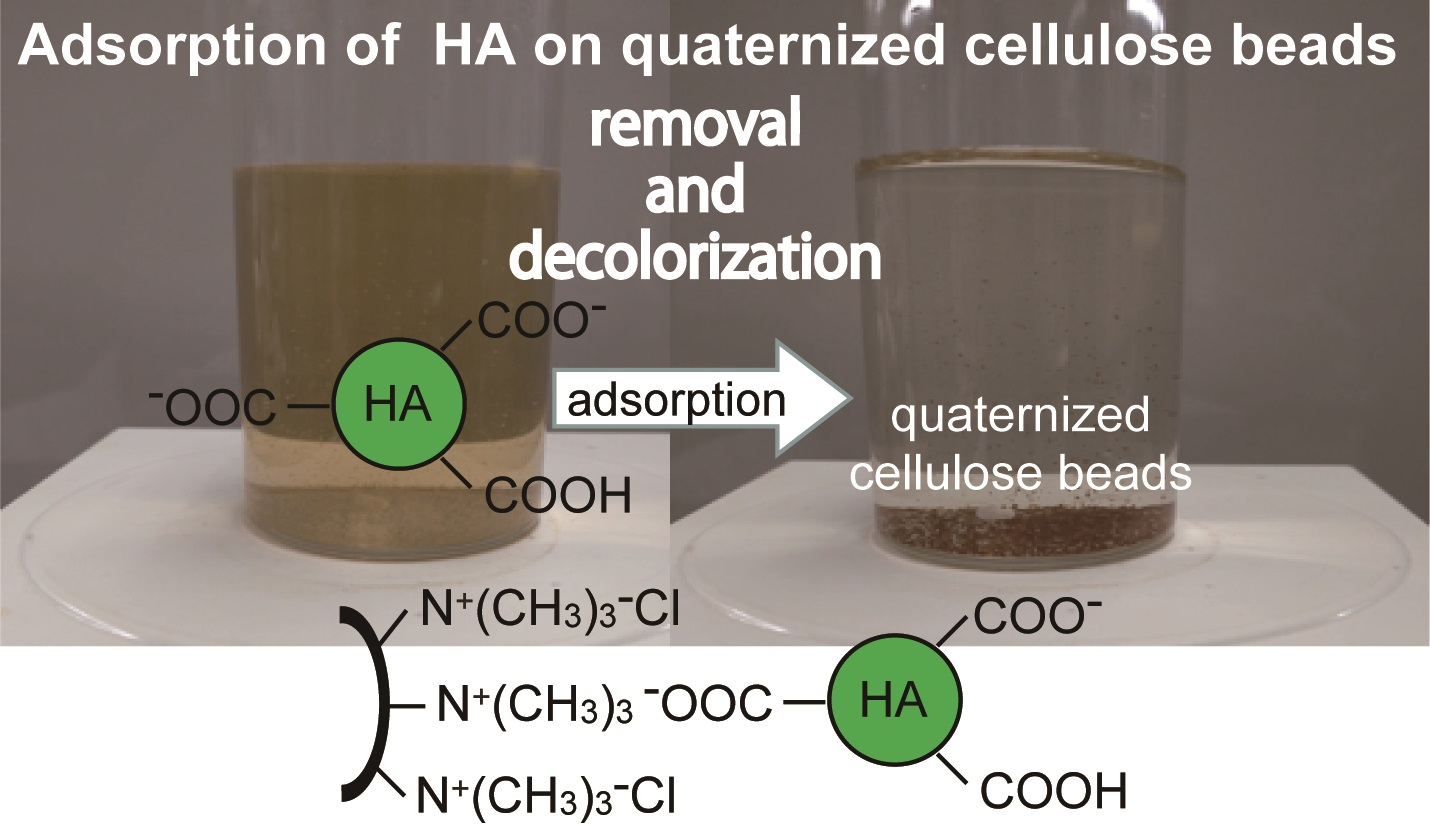
3.3. HA Adsorption
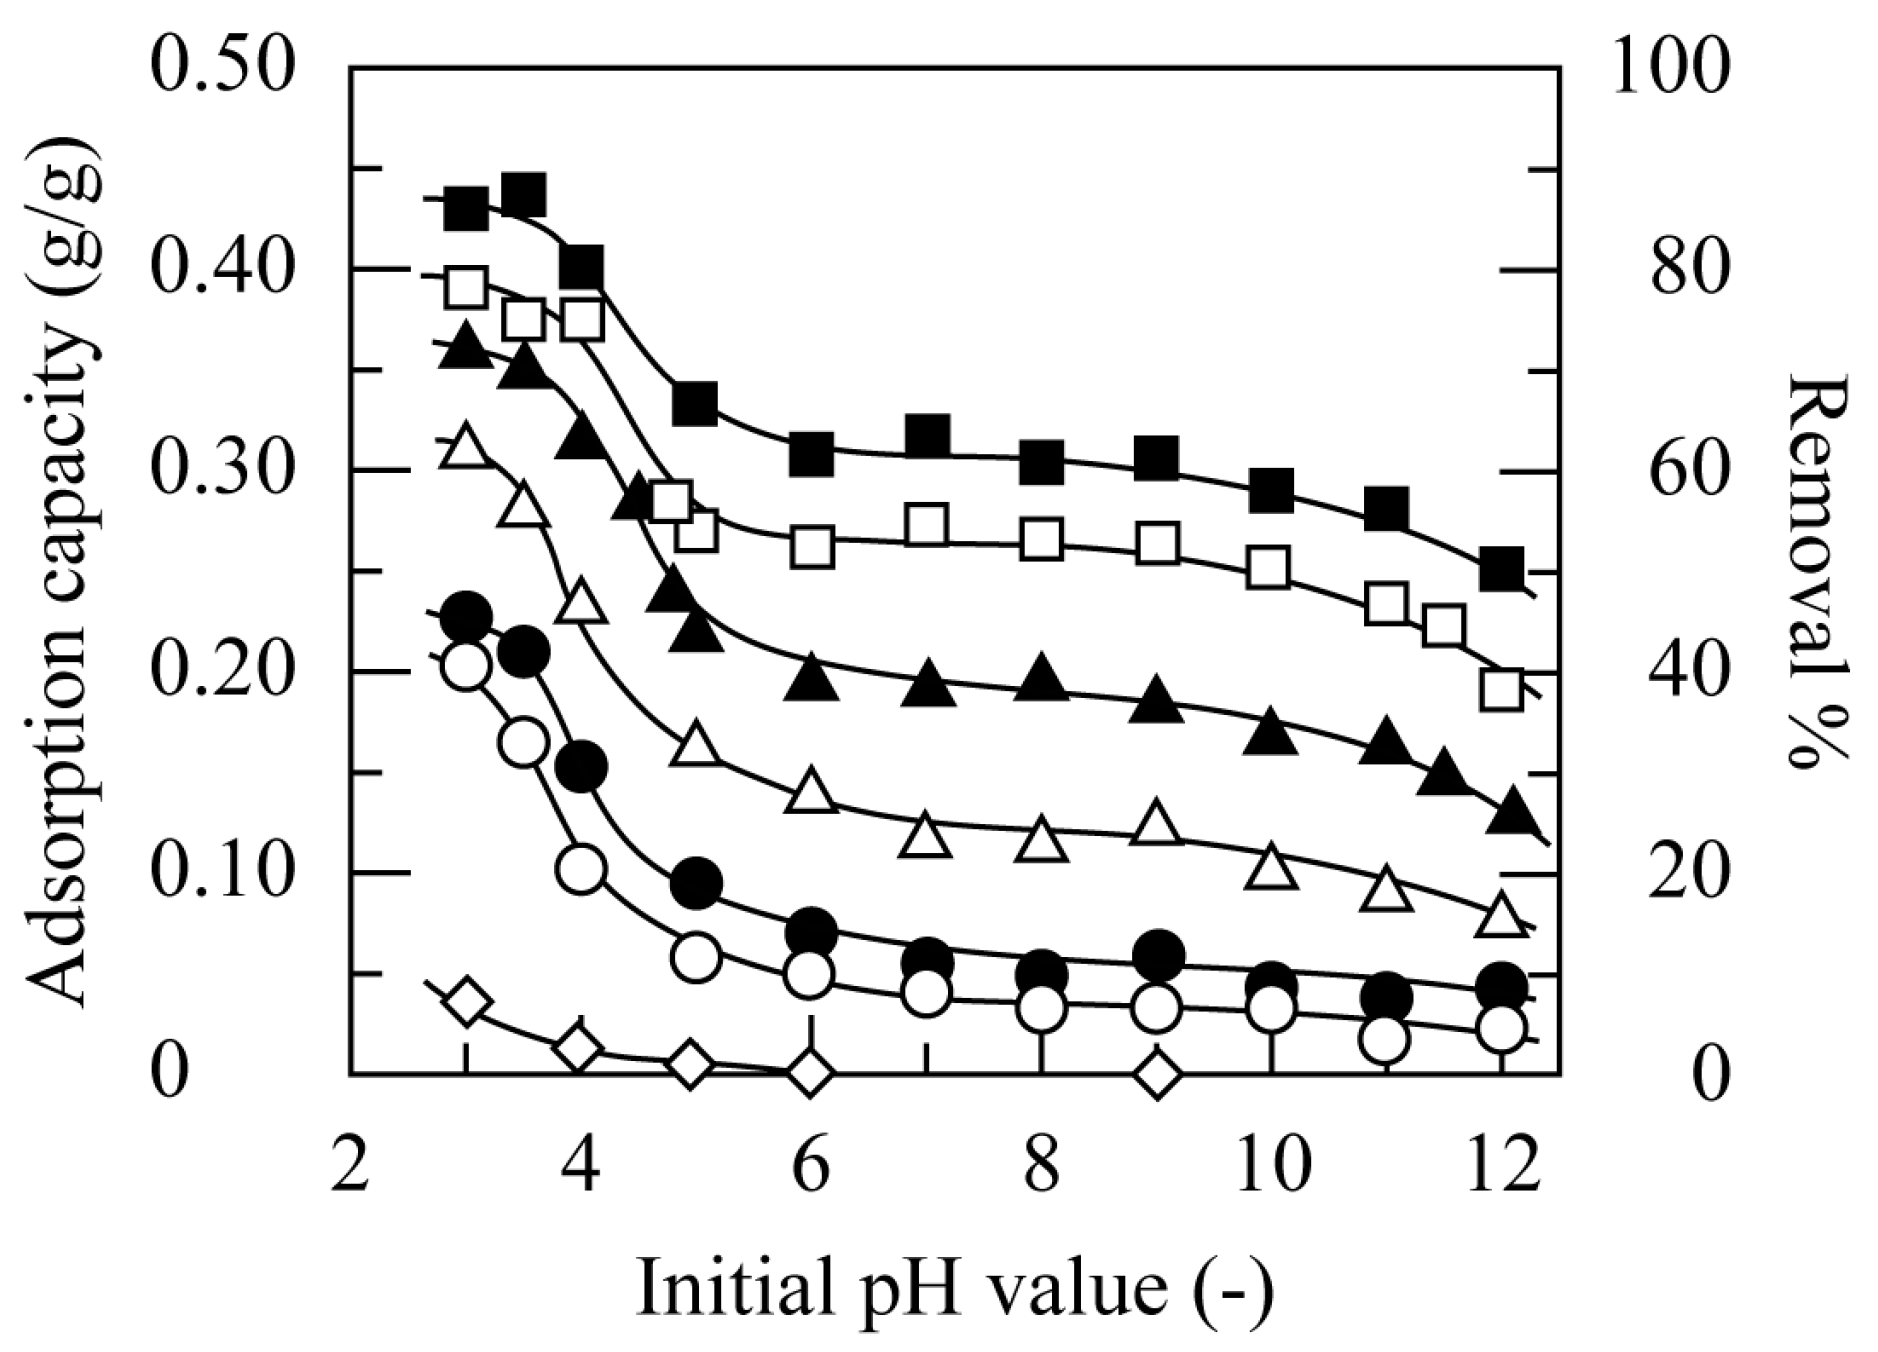
3.3.1. Effect of pH
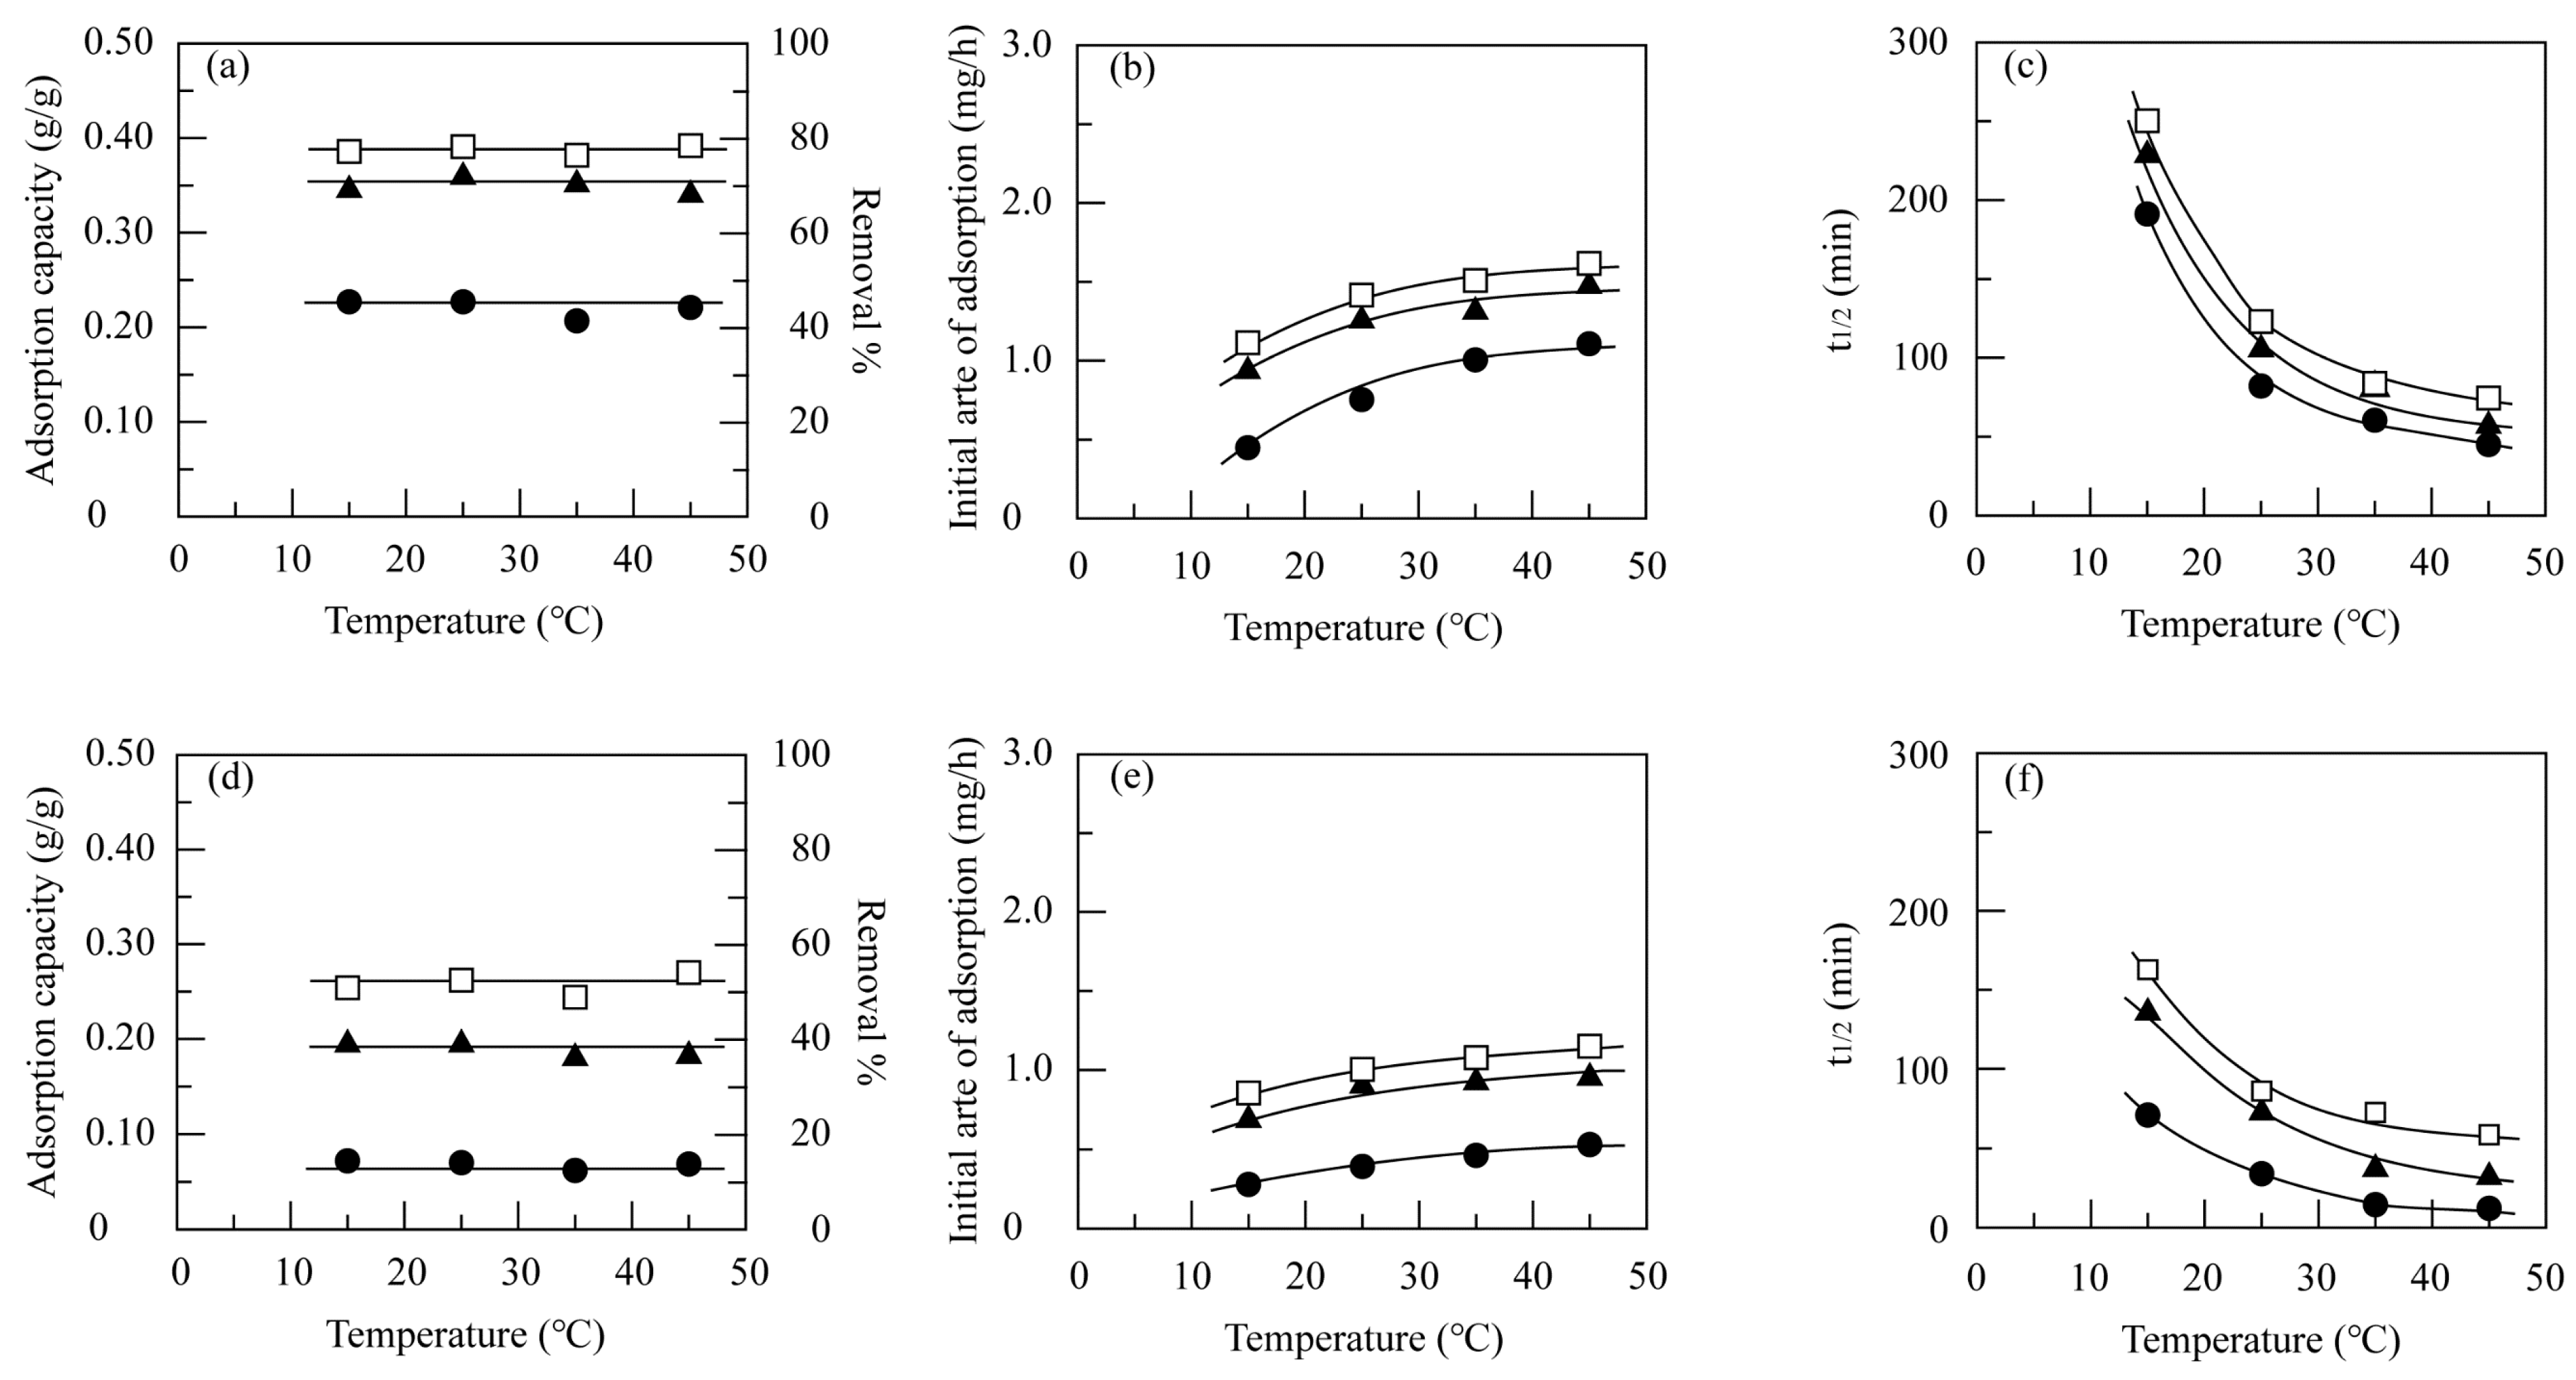
3.3.2. Effect of Temperature
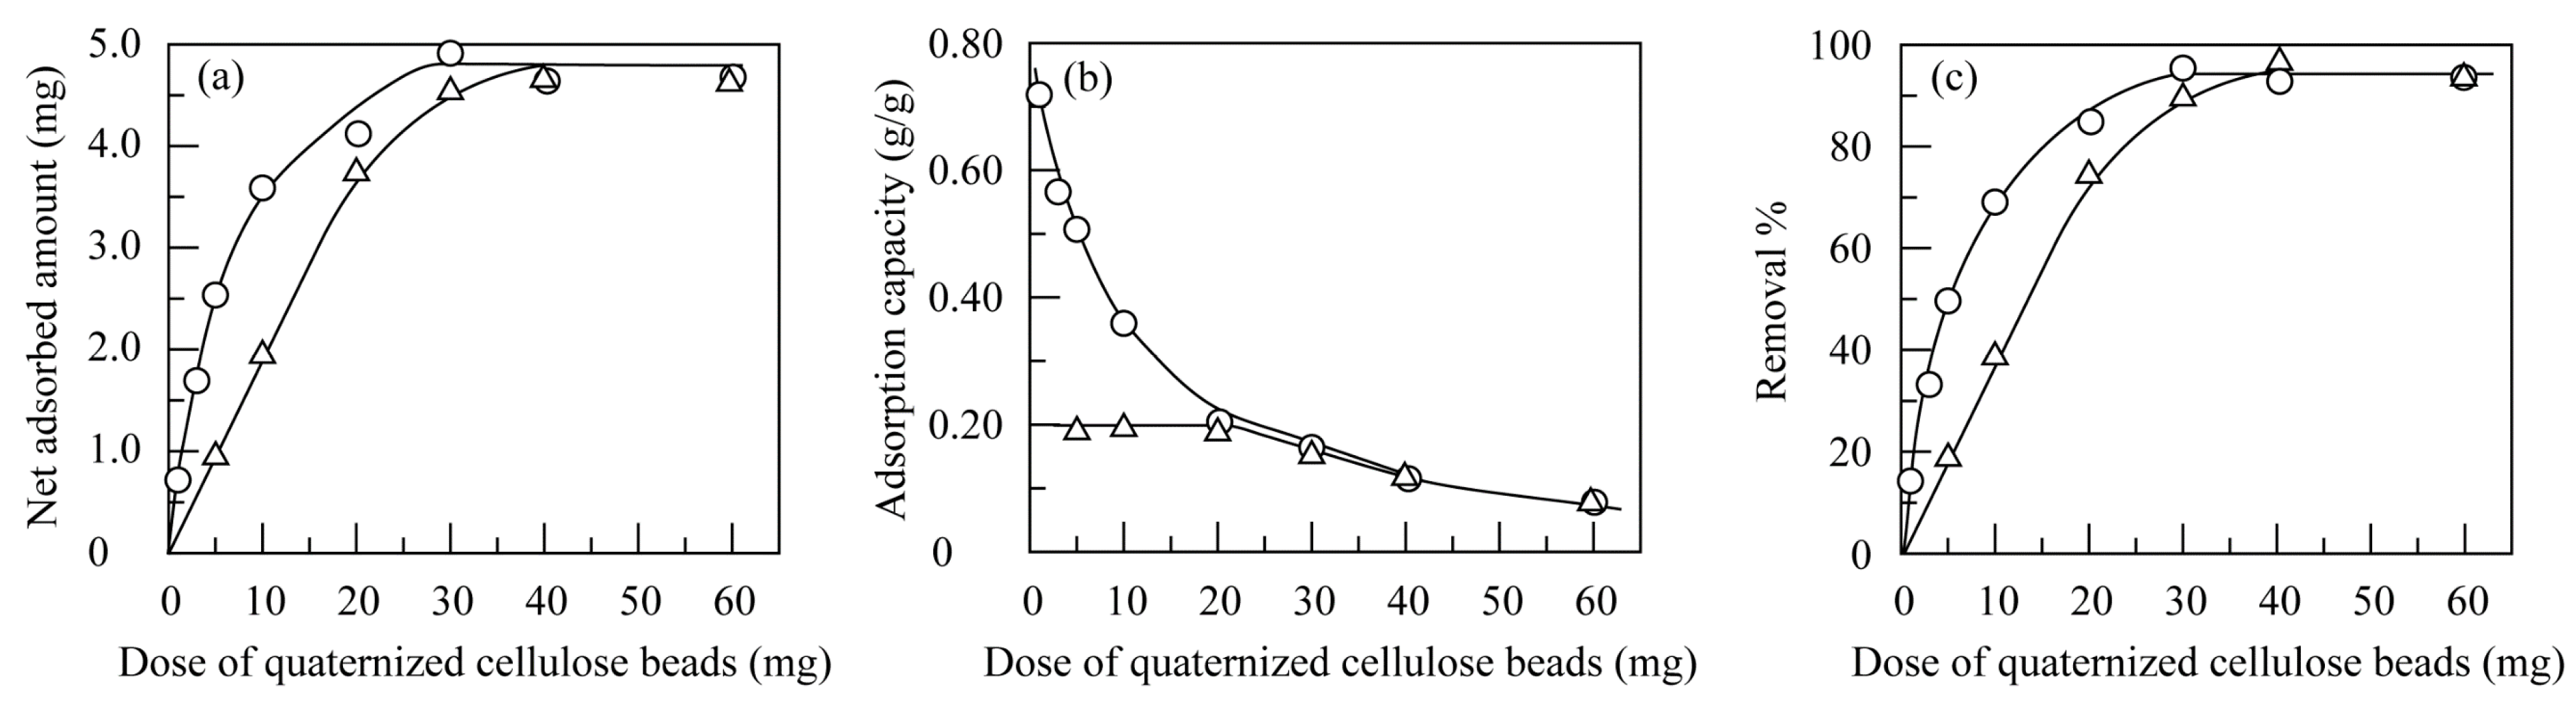
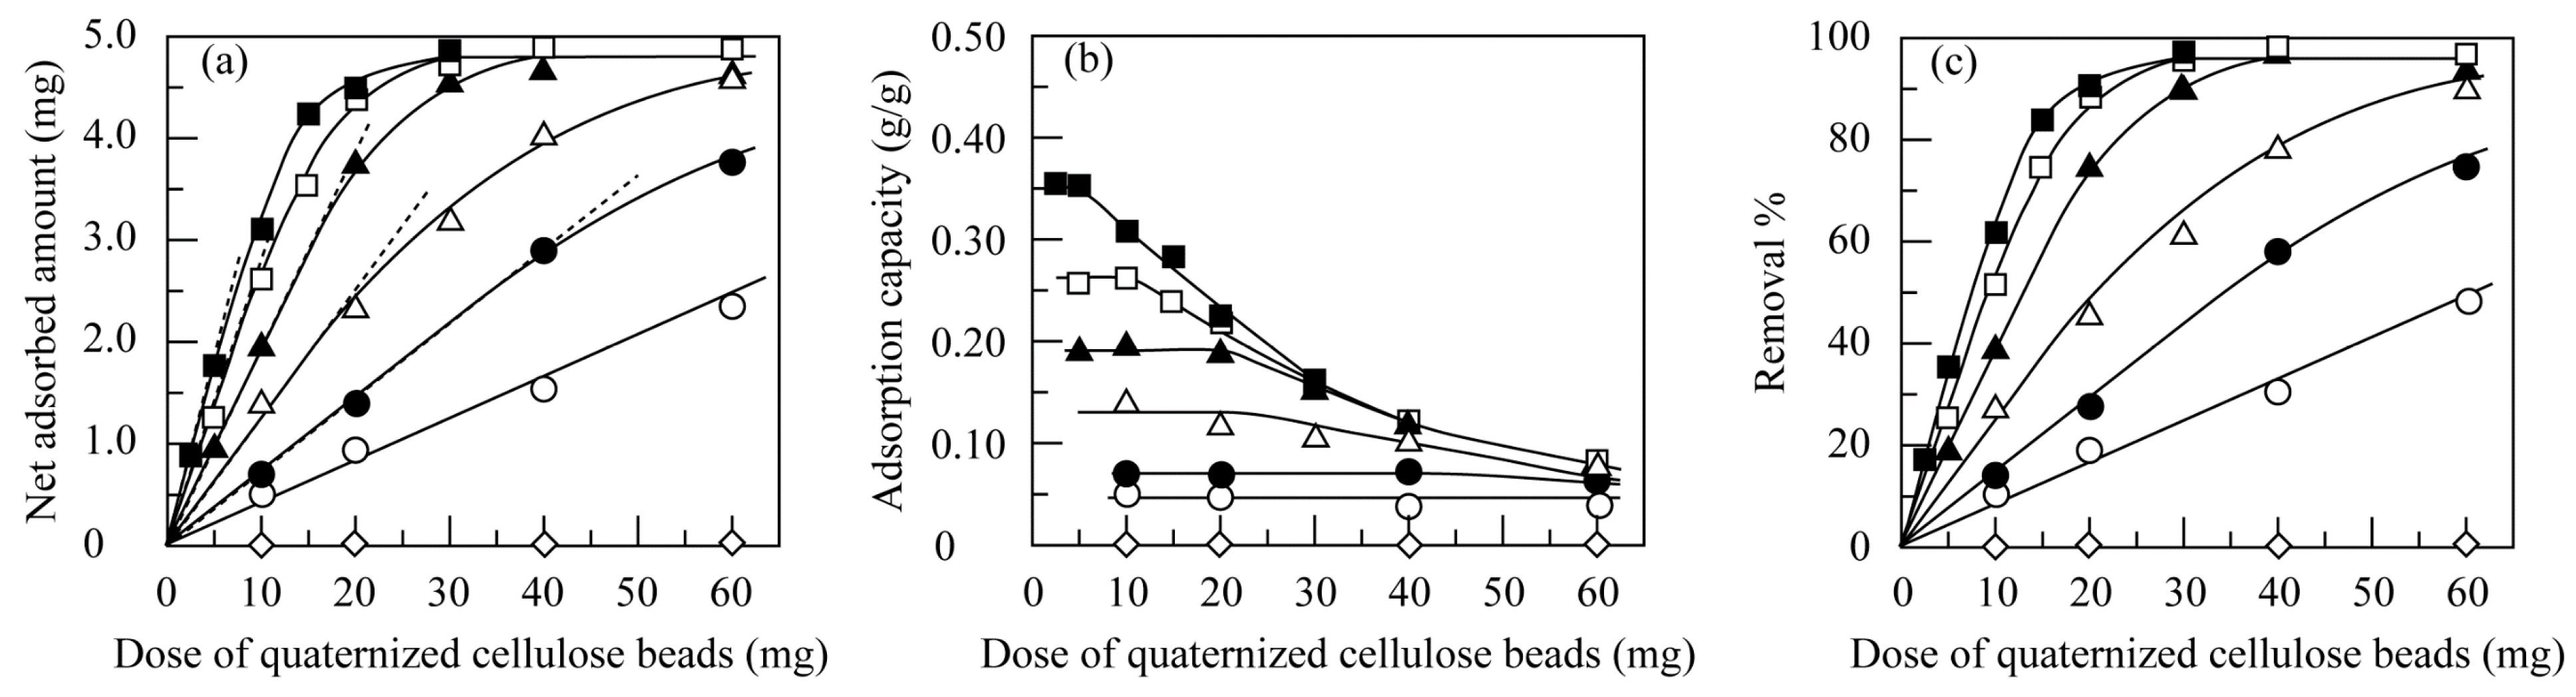
3.3.3. Effect of the Dose of Quaternized Cellulose Beads
3.4. Kinetic Analysis
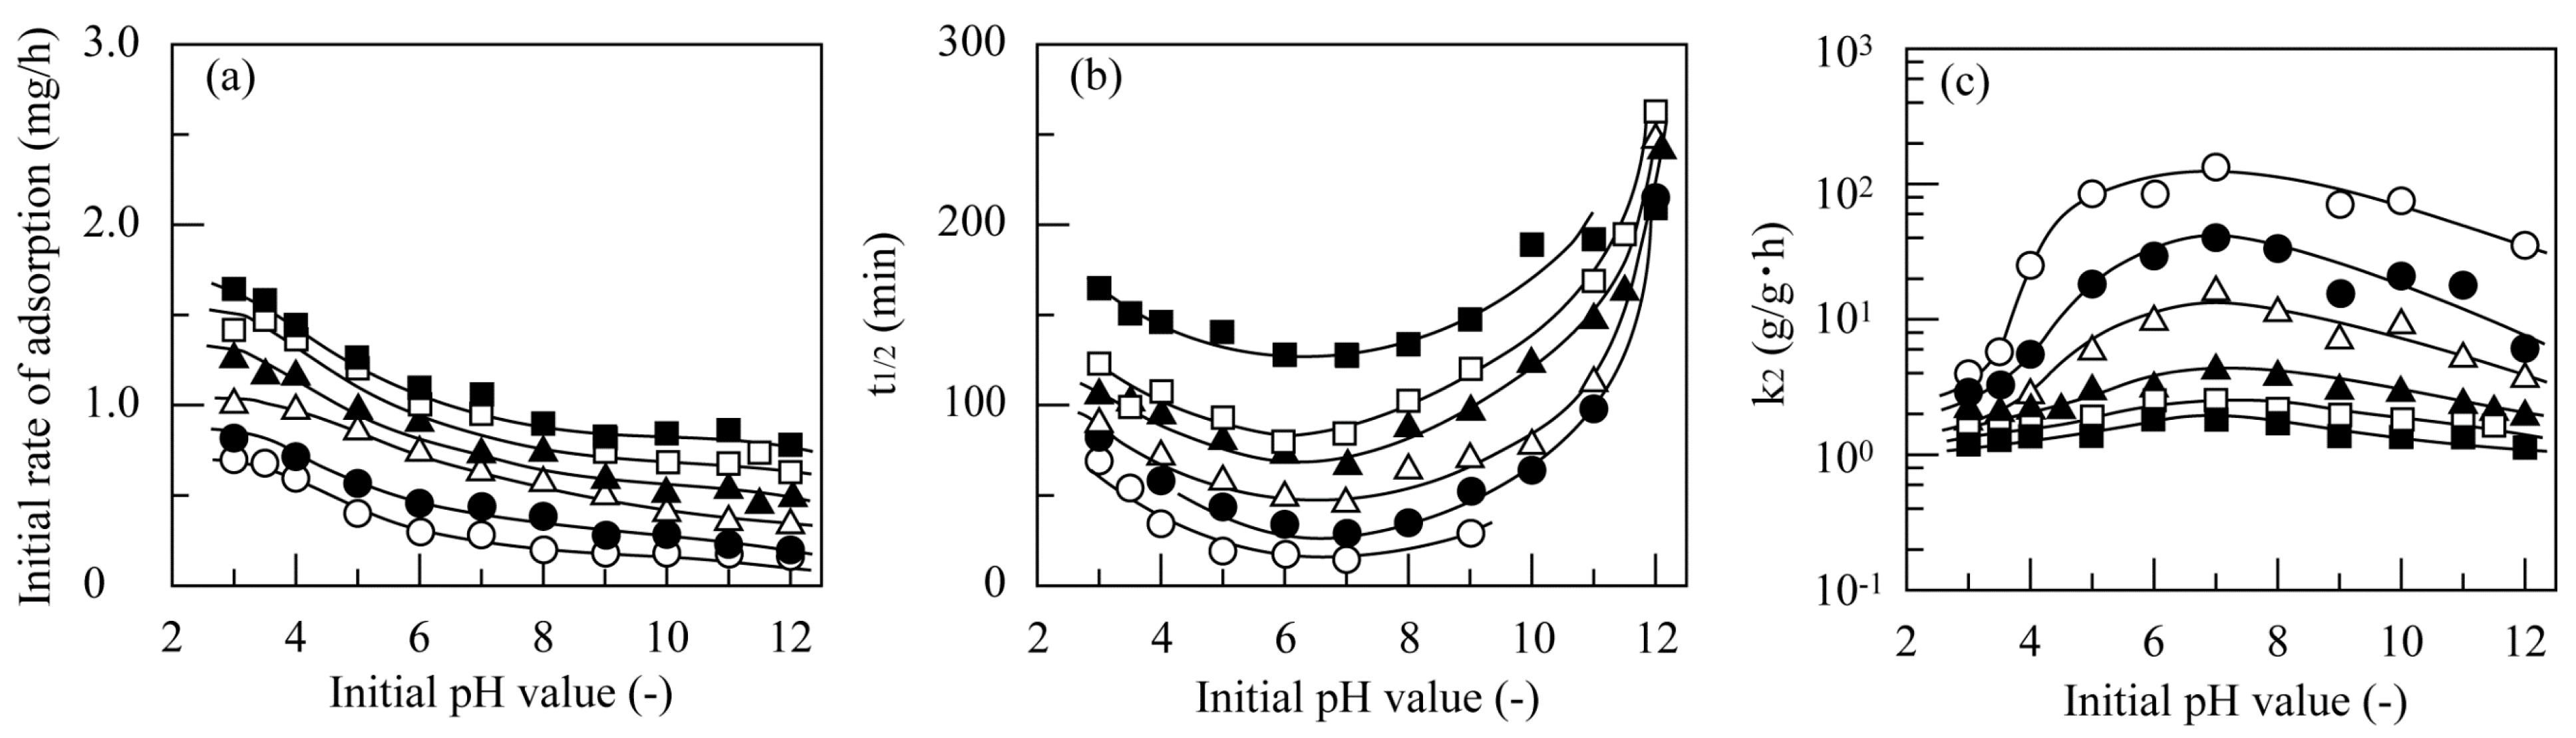
3.4.1. Effect of pH
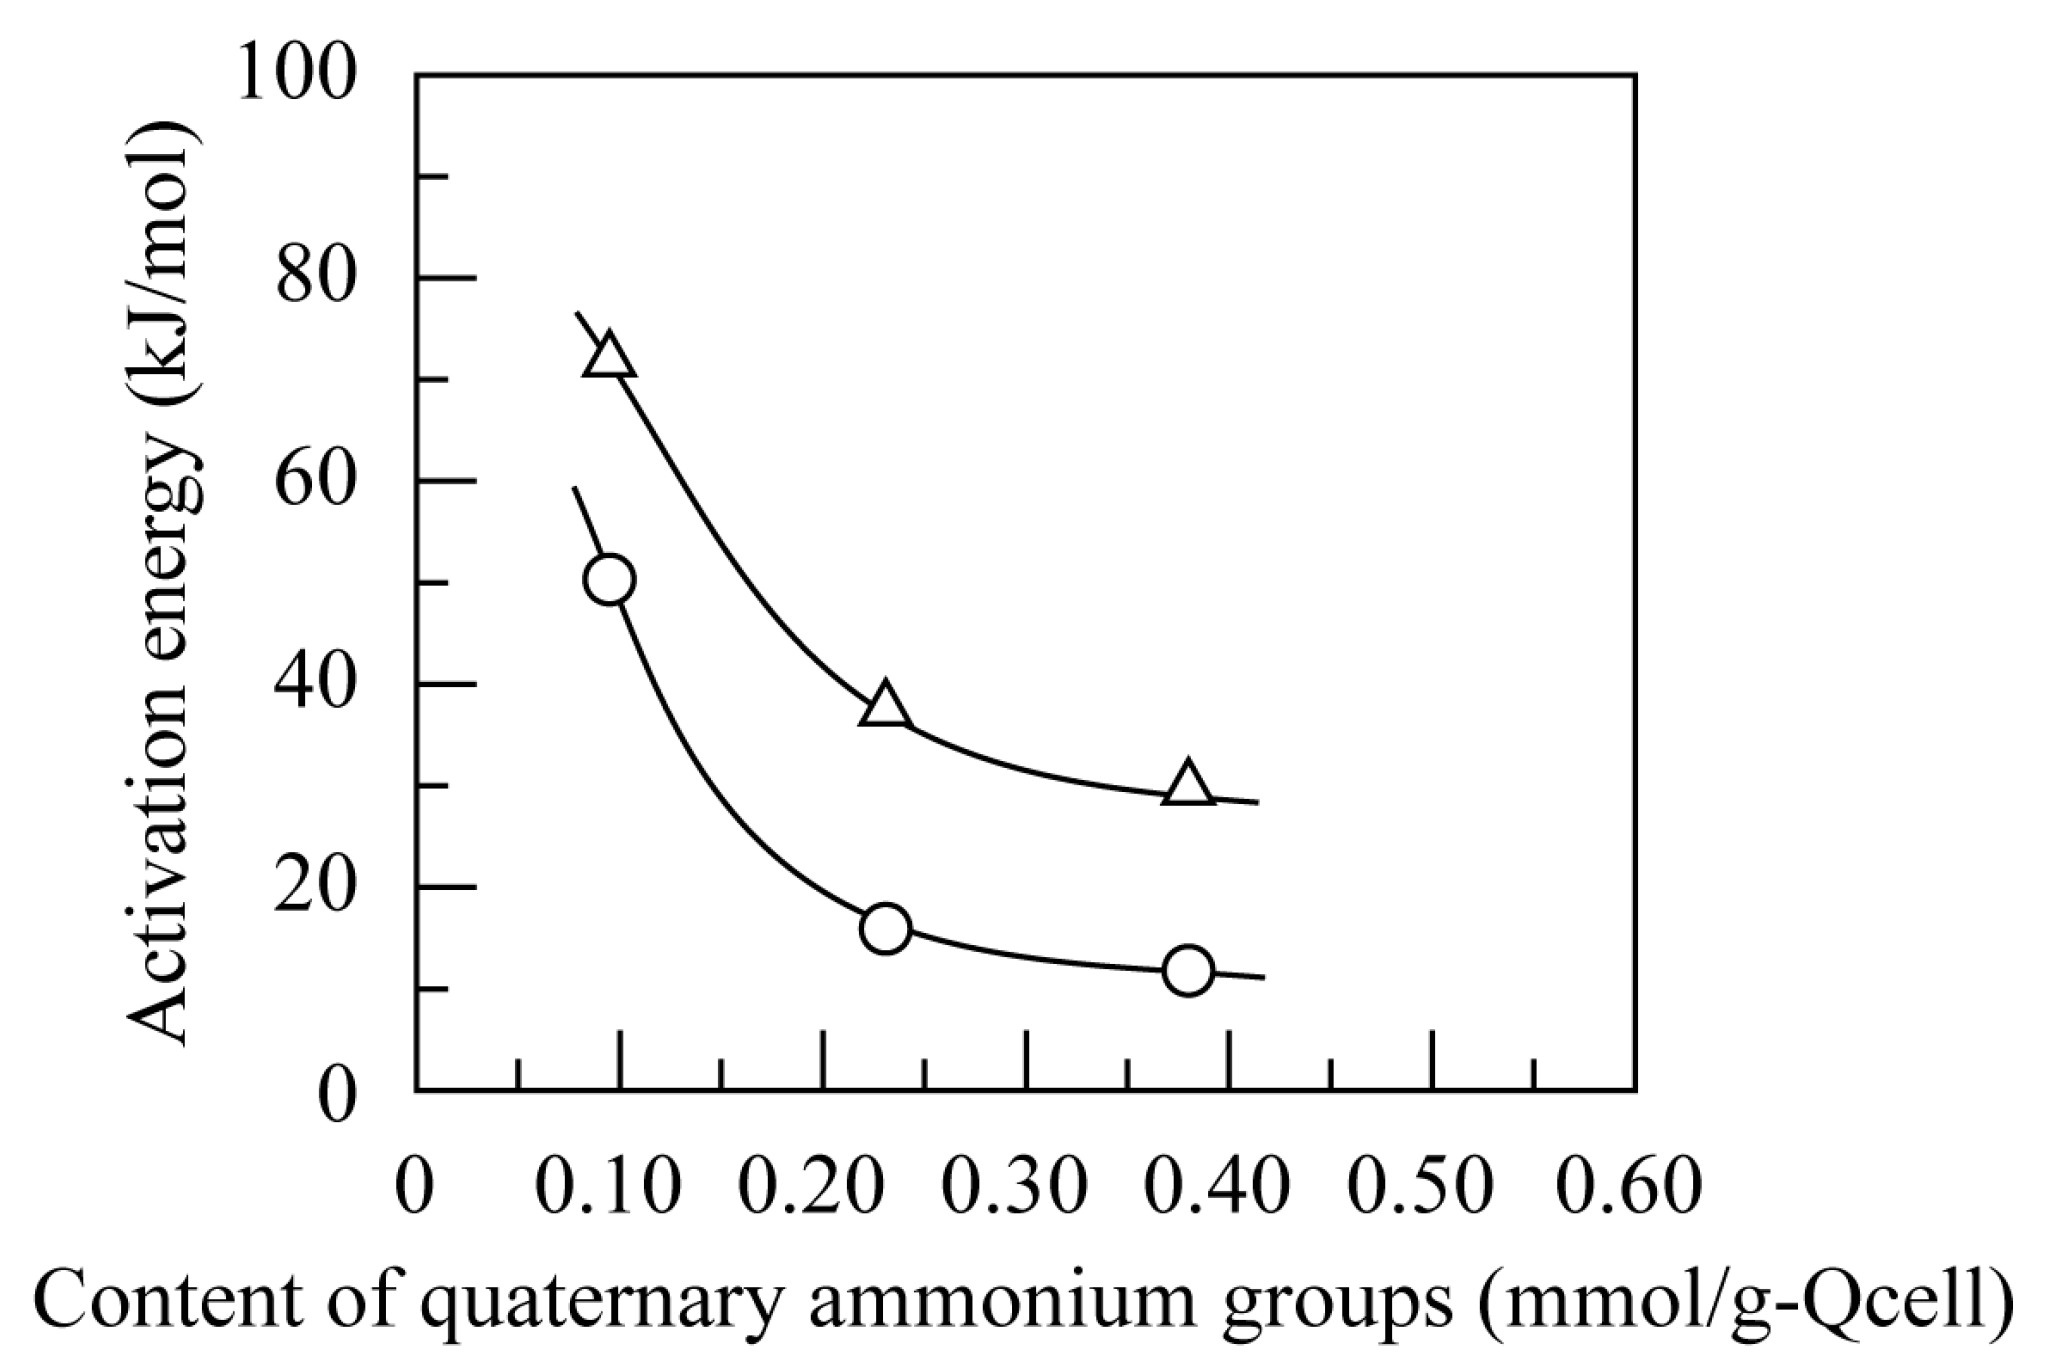
3.4.2. Effect of Temperature
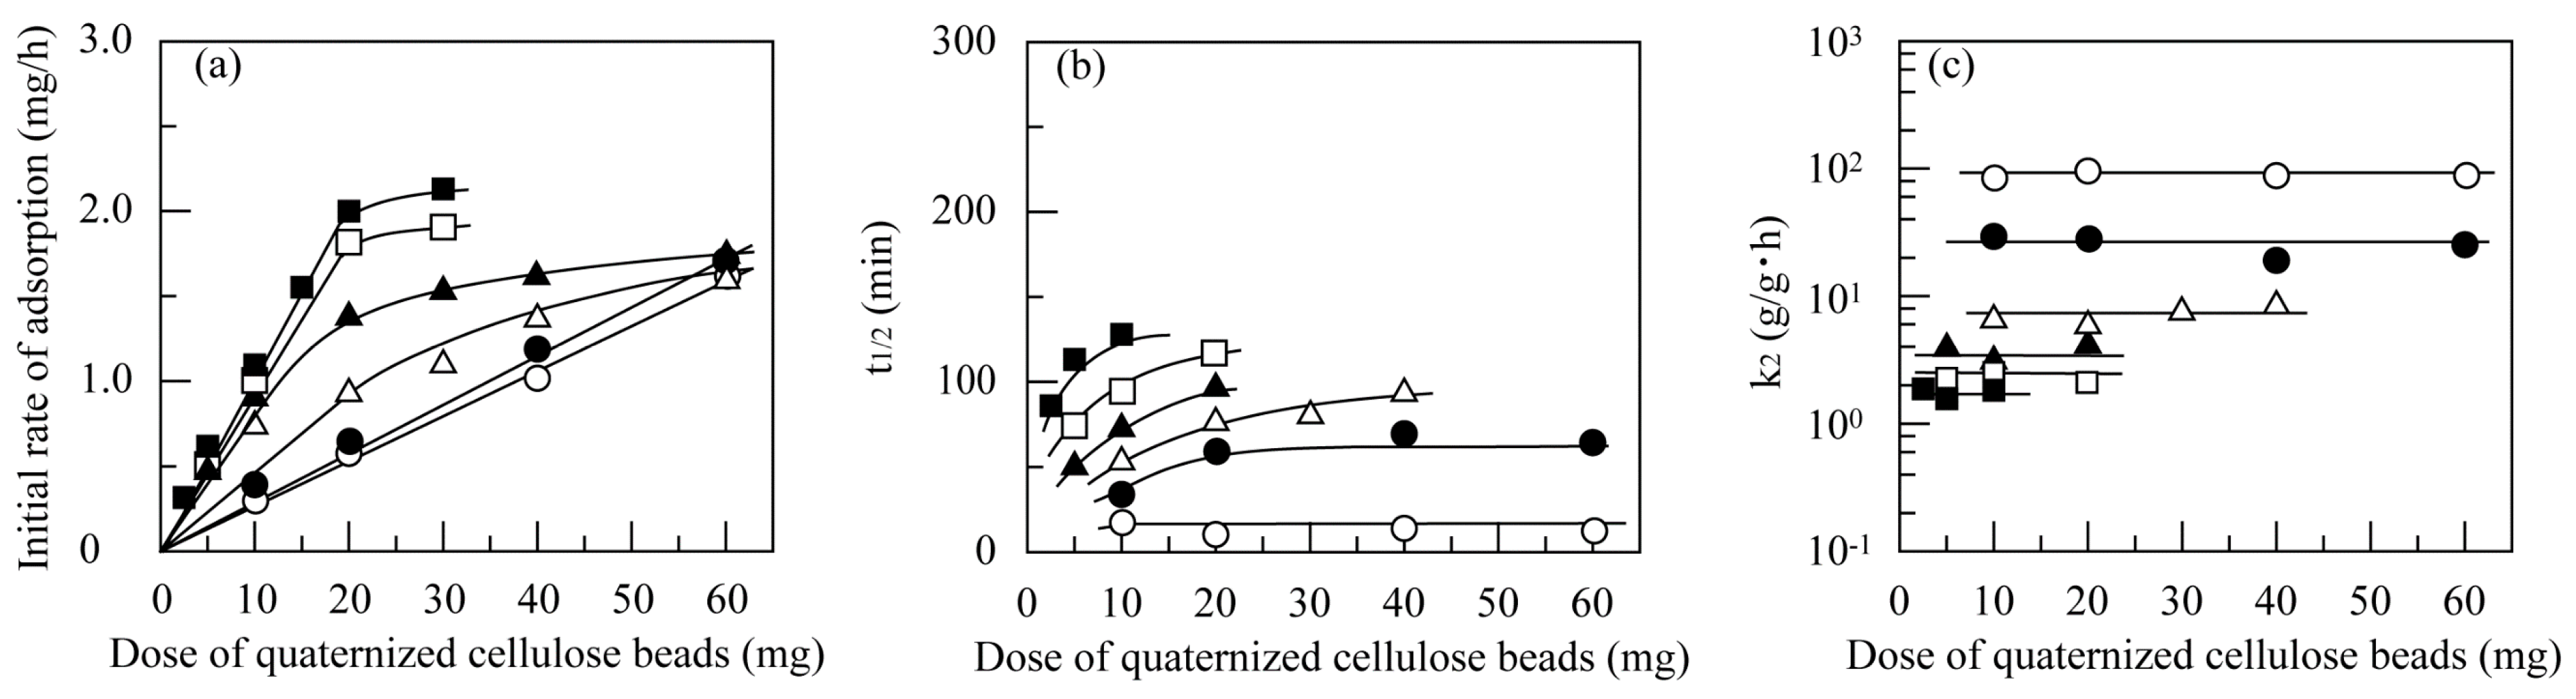
3.4.3. Effect of Dose of Quantized Cellulose Beads
3.5. Isotherm Analysis
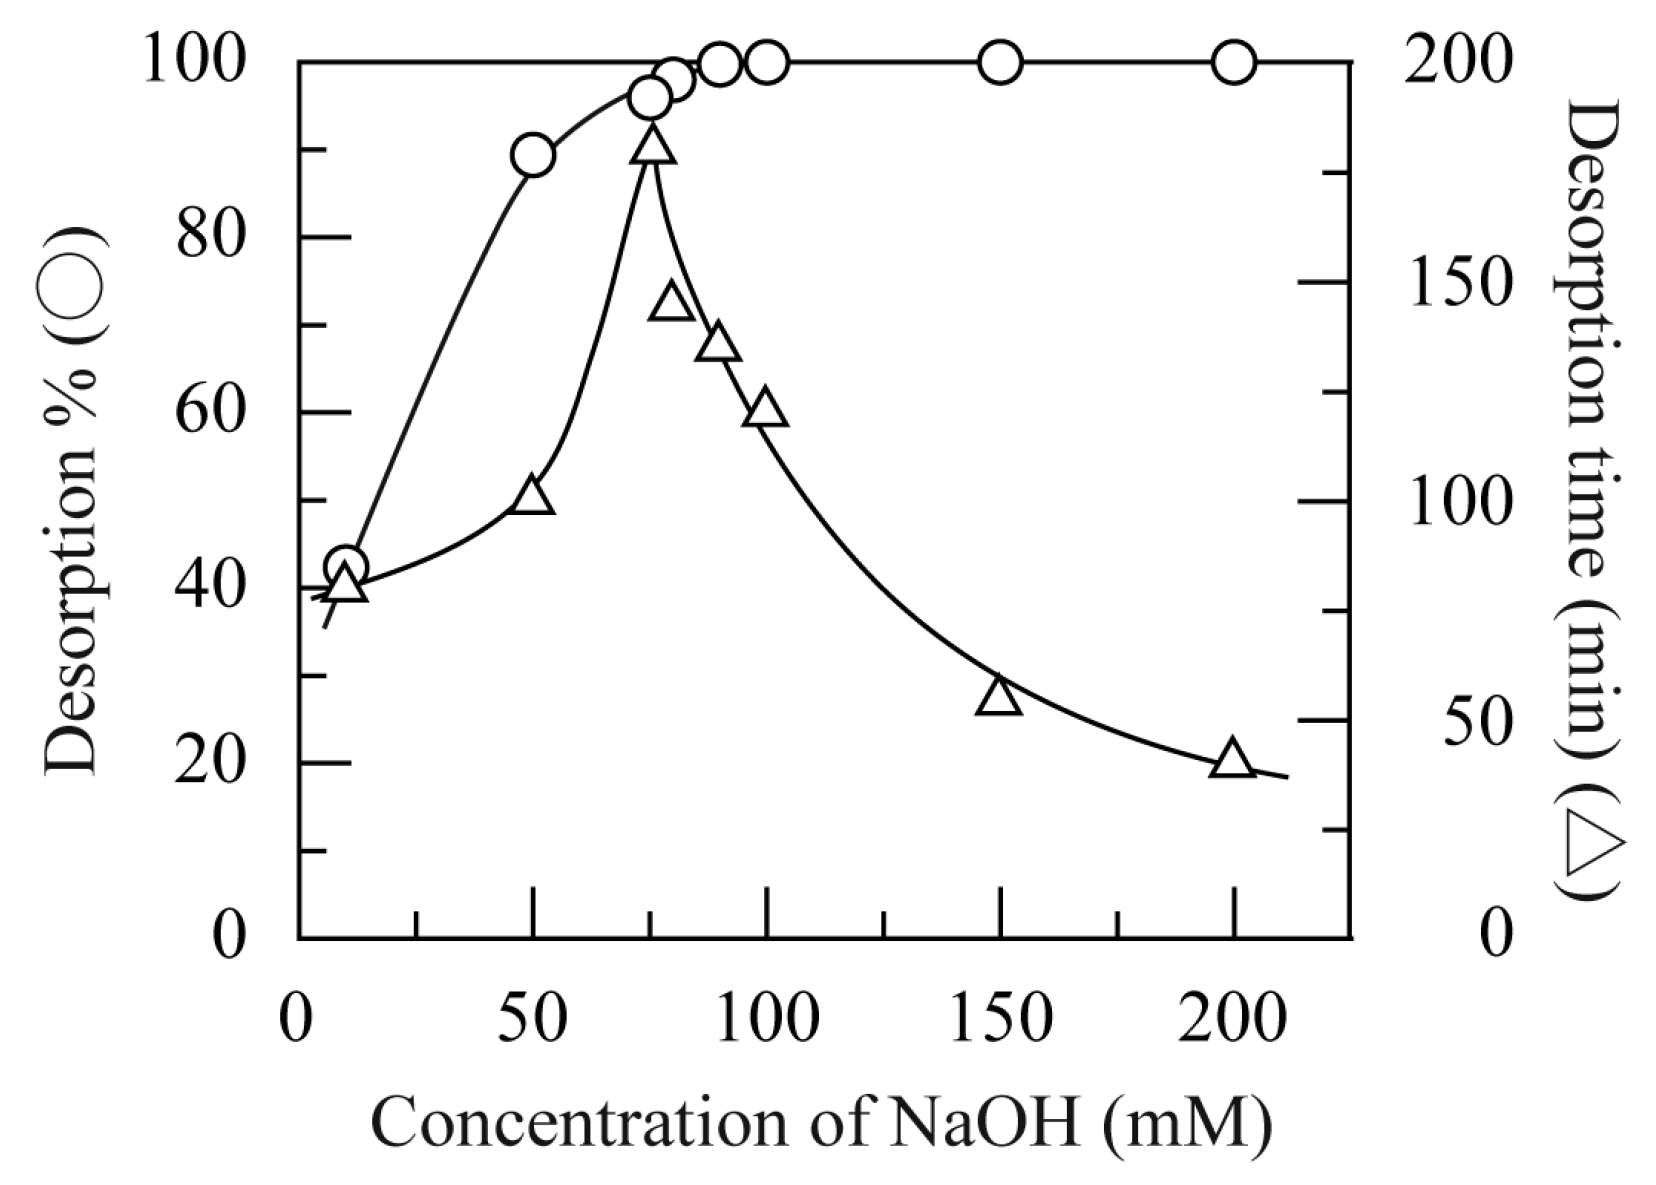
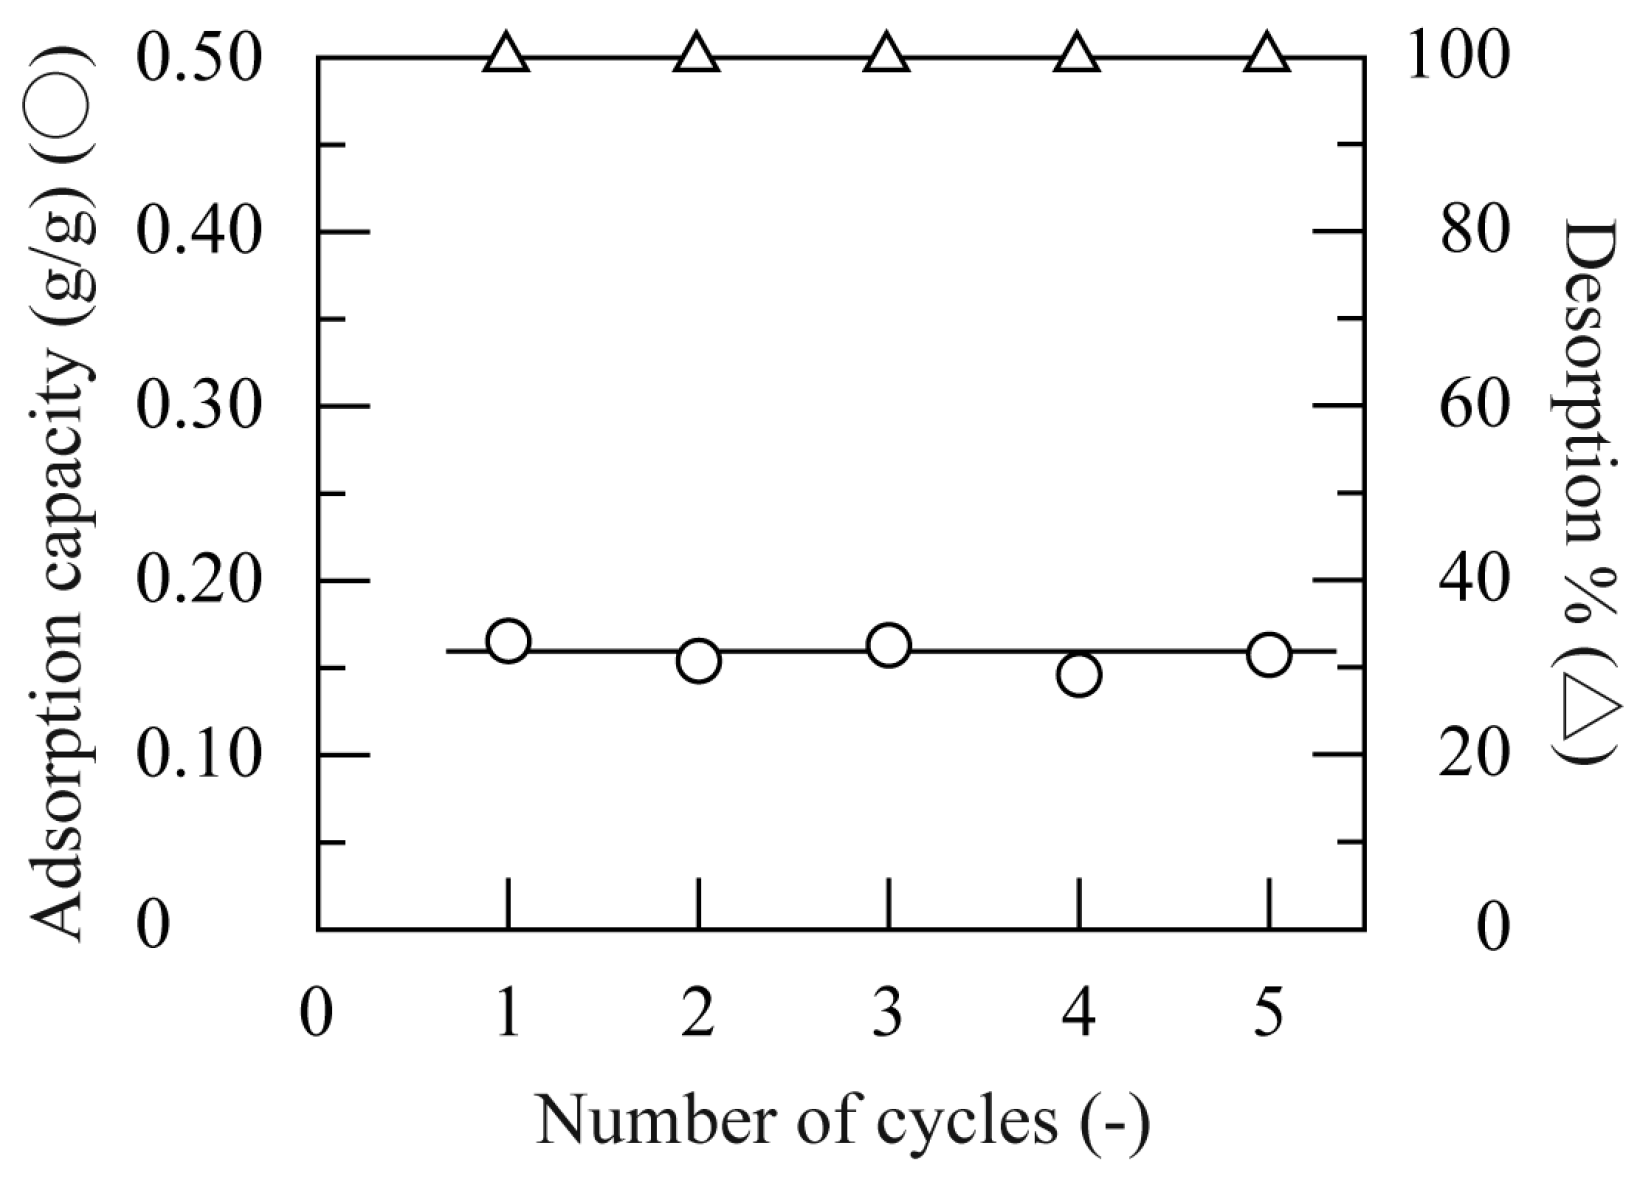
3.6. Desorption of HA
3.7. Comparison with Other Adsorbents
4. Conclusions
Supplementary Materials
Author Contributions
Funding
Institutional Review Board Statement
Informed Consent Statement
Data Availability Statement
Conflicts of Interest
References
- Klučáková, M.; Pelikán, P.; Lapčík, L.; Lapčiková, B.; Kučerík, J.; Kaláb, M. Structure and properties of humic and fulvic acids. 1. Properties and reactivity of humic acids and fulvic acids. J. Polym. Mater. 2000, 17, 337–356. [Google Scholar]
- Jarukas, L.; Ivanauskas, L.; Kasparaviciene, G.; Baranauskaite, J.; Marksa, M.; Bernatoniene, J. Determination of organic compounds, fulvic acid, humic acid, and humin in peat and sapropel alkaline extracts. Molecules 2021, 26, 2995. [Google Scholar] [CrossRef]
- Mirza, M.A.; Agarwal, S.P.; Rahman, M.K.; Rauf, A.; Ahmad, N.; Alam, A.; Iqbal, Z. Role of humic acid on oral drug delivery of an antiepileptic drug. Drug Dev. Ind. Pharm. 2011, 37, 310–319. [Google Scholar] [CrossRef]
- Rupiasih, N.N.; Vidyasagar, P.B. A review: Compositions, structures, properties and applications of humic substances. J. Adv. Sci. Technol. 2005, 8, 16–25. [Google Scholar]
- Noroozisharaf, A.; Kaviani, M. Effect of soil application of humic acid on nutrients uptake, essential oil and chemical compositions of garden thyme (Thymus vulgaris L.) under greenhouse conditions. Physiol. Mol. Biol. Plants 2018, 24, 423–431. [Google Scholar] [CrossRef] [PubMed]
- Almar, T.; Qiblawey, H.; Almomani, F.; Al-Raoush, R.; Han, D.S.; Ahmad, N.M. Recent advances on humic acid removal from wastewater using adsorption process. J. Water Process Eng. 2023, 53, 103679. [Google Scholar] [CrossRef]
- García-Mina, J.M.; Antolín, M.C.; Sanchez-Diaz, M. Metal-humic complexes and plant micronutrient uptake: A study based on different plant species cultivated in diverse soil types. Plant Soil 2004, 258, 57–58. [Google Scholar] [CrossRef]
- Nikolaou, A.D.; Golfinopoulos, S.K.; Lekkas, T.D.; Kostopoulou, M.N. DBP levels in chlorinated drinking water: Effect of humic substances. Environ. Monit. Assess. 2004, 93, 301–319. [Google Scholar] [CrossRef]
- Deborde, M.; von Gunten, U. Reactions of chlorine with inorganic and organic compounds during water treatment-Kinetics and mechanisms: A critical review. Water Res. 2008, 42, 13–51. [Google Scholar] [CrossRef]
- Hakim, A.; Suzuki, T.; Kobayashi, M. Strength of Humic Acid Aggregates: Effects of Divalent Cations and Solution pH. ACS Omega 2019, 4, 8559–8567. [Google Scholar] [CrossRef]
- Zhu, X.; Liu, J.; Li, L.; Zhen, G.; Lu, X.; Zhang, J.; Liu, H.; Zhou, Z.; Wu, Z.; Zhang, X. Prospects for humic acids treatment and recovery in wastewater: A review. Chemosphere 2023, 312, 137193. [Google Scholar] [CrossRef] [PubMed]
- Grace, M.A.; Clifford, E.; Healy, M.G. The potential for the use of waste products from a variety of sectors in water treatment processes. J. Clean. Prod. 2016, 137, 788–802. [Google Scholar] [CrossRef]
- Duran, C.; Ozdes, D.; Gundogdu, A.; Senturk, H.B. Kinetics and isotherm analysis of basic dyes adsorption onto almond shell (Prunus dulcis) as a low cost adsorbent. J. Chem. Eng. Data 2011, 56, 2136–2147. [Google Scholar] [CrossRef]
- Menya, E.; Olupot, P.W.; Storz, H.; Lubwama, M.; Kiros, Y. Synthesis and evaluation of activated carbon from rice husks for removal of humic acid from water. Biomass Conv. Bioref. 2022, 26, 3229–3248. [Google Scholar] [CrossRef]
- Kołodziej, A.; Fuentes, M.; Baigorri, R.; Lorenc-Brabowska, E.; García-Mina, J.M.; Burg, P.; Gryglewicz, G. Mechanism of adsorption of different humic acid fractions on mesoporous activated carbons with basic surface characteristics. Adsorption 2014, 20, 667–675. [Google Scholar] [CrossRef]
- Eustáquio, H.M.B.; Lopes, C.W.; da Rocha, R.S.; Cardoso, B.D.; Pergher, S.B.C. Modification of activated carbon for the adsorption of humic acid. Adsorpt. Sci. Technol. 2015, 33, 117–126. [Google Scholar] [CrossRef]
- Habuta-stanić, M.; Tutić, A.; Grgić, D.K.; Zeko-Pivač, A.; Burilo, A.; Paixão, S.; Teixeira, V.; Pagaimo, M.; Pala, A.; Ravančić, M.E.; et al. Adsorption of humic acid from water using chemically modified bituminous coal-based activated carbons. Chem. Biochem. Eng. Q. 2021, 35, 189–203. [Google Scholar] [CrossRef]
- Hishikawa, Y.; Togawa, E.; Kondo, T. Characterization of individual hydrogen bonds in crystalline regenerated cellulose using resolved polarized FTIR spectra. ACS Omega 2017, 2, 1469–1476. [Google Scholar] [CrossRef]
- Hokkanen, S.; Bhatnagar, A.; Sillanpää, M. A review on modification methods to cellulose-based adsorbents to improve adsorption capacity. Water Res. 2016, 91, 156–173. [Google Scholar] [CrossRef]
- Suhas; Gupta, V.K.; Carrott, P.J.M.; Singh, R.; Chaudhary, M.; Kushwaha, S. Cellulose: A review as natural, modified and activated carbon adsorbent. Bioresour. Technol. 2016, 216, 1066–1076. [Google Scholar] [CrossRef] [PubMed]
- Uchiyama, K.; Asamoto, H.; Minamisawa, H.; Yamada, K. Quaternization of porous cellulose beads and their use for removal of humic acid from aqueous medium. Physchem 2023, 3, 61–76. [Google Scholar] [CrossRef]
- Sehaqui, H.; de Larraya, U.P.; Tingaut, P.; Zimmermann, T. Humic acid adsorption onto cationic cellulose nanofibers for bioinspired removal of copper(II) and a positively charged dye. Soft Matter 2015, 11, 5294–5300. [Google Scholar] [CrossRef]
- Revellame, E.D.; Fortela, D.L.; Sharp, W.; Hernandez, R.; Zappi, M.E. Adsorption kinetic modeling using pseudo-first order and pseudo-second order rate laws: A review. Clean. Eng. Technol. 2020, 1, 100032. [Google Scholar] [CrossRef]
- Tan, K.L.; Hameed, B.H. Insight into the adsorption kinetics models for the removal of contaminants from aqueous solutions. J. Taiwan Inst. Chem. Eng. 2017, 74, 25–48. [Google Scholar] [CrossRef]
- Langmuir, I. The adsorption of gases on plane surfaces of glass, mica and platinum. J. Am. Chem. Soc. 1918, 40, 1361–1403. [Google Scholar] [CrossRef]
- Freundlich, H. Über die Adsorption in Lösungen. Z. Phys. Chem. 1907, 57, 385–470. [Google Scholar] [CrossRef]
- Debord, J.; Chu, K.H.; Salvestrini, S.; Bollinger, J. Yesterday, today, and tomorrow. Evolution of a sleeping beauty: The Freundlich isotherm. Langmuir 2023, 39, 3062–3071. [Google Scholar] [CrossRef]
- Song, Y.; Zhang, L.; Gan, W.; Zhou, J.; Zhang, L. Self-assembled based on hydrophobically modified quaternized cellulose for drug delivery. Colloids Surf. B Biointerfaces 2011, 83, 313–320. [Google Scholar] [CrossRef]
- Roshan, K.R.; Jose, T.; Kathalikkatti, A.C.; Kim, D.W.; Kim, B.; Park, D.W. Microwave synthesized quaternized cellulose for cyclic carbonate synthesis from carbon dioxide and epoxides. Appl. Catal. A Gen. 2013, 467, 17–25. [Google Scholar] [CrossRef]
- Du, J.; Dong, Z.; Pi, Y.; Yang, X.; Zhao, L. Fabrication of cotton linter-based adsorbents by radiation grafting polymerization for humic acid removal from aqueous solution. Polymers 2019, 11, 962. [Google Scholar] [CrossRef]
- Zhang, R.; Leiviskä, T. Surface modification of pine bark with quaternary ammonium groups and its use for vanadium removal. Chem. Eng. J. 2020, 385, 123967. [Google Scholar] [CrossRef]
- de Mero, B.A.G.; Motta, F.L.; Santana, M.H.A. Humic acids: Structural properties and multiple functionalities for novel technological developments. Mater. Sci. Eng. 2016, C62, 967–974. [Google Scholar] [CrossRef]
- Capasso, S.; Chianese, S.; Musmarra, D.; Iovino, P. Macromolecular structure of a commercial humic acid sample. Environments 2020, 7, 32. [Google Scholar] [CrossRef]
- de Aguiar, T.C.; Torchia, D.F.D.; de Castro, T.V.A.; Tavares, O.C.H.; Lopes, S.D.; da Silva, L.D.; Castro, R.N.; Berbara, R.L.L.; Pereira, M.G.; Garcia, A.C. Spectroscopic-chemometric modeling of 80 humic acids confirms the structural pattern identity of humified organic matter despite different formation environments. Sci. Total Environ. 2022, 833, 155133. [Google Scholar] [CrossRef]
- Zhao, H.; Zhou, F.; Bao, X.; Zhou, S.; Wei, Z.; Long, W.; Yi, Z. A review on the humic substances in pelletizing binders: Preparation, interaction mechanism, and process characteristics. ISIJ Int. 2023, 63, 205–215. [Google Scholar] [CrossRef]
- Ahmed, Z.; Yusoff, M.S.; Kamal, N.H.M.; Aziz, H.A.; Roulia, M. Spectroscopic and microscopic analysis of humic acid isolated from stabilized leachate HSs fractionation. Agronomy 2023, 13, 1160. [Google Scholar] [CrossRef]
- Shen, J.; Yang, X.; Schäfer, A.I. Quantification of hormone-humic acid interactions in nanofiltration. Environ. Sci. Technol. 2012, 46, 10597–10604. [Google Scholar] [CrossRef] [PubMed]
- Klučáková, M.; Kolajová, R. Dissociation ability of humic acids: Spectroscopic determination of pKa and comparison with multi-step mechanism. React. Funct. Polym. 2014, 78, 1–6. [Google Scholar] [CrossRef]
- Wang, Y.; Combe, C.; Clark, M.M. The effects of pH and calcium on the diffusion coefficient of humic acid. J. Membr. Sci. 2001, 183, 49–60. [Google Scholar] [CrossRef]
- Deng, S.; Bai, R. Adsorption and desorption of humic acid on aminated polyacrylonitrile fibers. J. Colloid Interface Sci. 2004, 280, 36–43. [Google Scholar] [CrossRef] [PubMed]
- Deng, S.; Yu, G.; Ting, Y.P. Removal of humic acid using PEI-modified fungal biomass. Sep. Sci. Technol. 2006, 41, 2989–3002. [Google Scholar] [CrossRef]
- Illés, E.; Tombácz, E. The effect of humic adsorption on pH-dependent surface charging and aggregation of magnetite nanoparticles. J. Colloid Interface Sci. 2006, 295, 115–123. [Google Scholar] [CrossRef]
- Lin, J.; Zhan, Y. Adsorption of humic acid from aqueous solution onto unmodified and surfactant-modified chitosan/zeolite composites. Chem. Eng. J. 2012, 200–202, 202–213. [Google Scholar] [CrossRef]
- Taktak, F.; İlbay, Z. Synthesis of novel poly[2-(dimethylamino) ethyl methacrylate]/pumice stone hydrogel composite for the rapid adsorption of humic acid in aqueous solution. J. Macromol. Sci. A Pure Appl. Chem. 2015, 52, 307–315. [Google Scholar] [CrossRef]
- Rashtbari, Y.; Américo-Pinheiro, J.H.P.; Bahrami, S.; Fazlzadeh, M.; Arfaeinia, H.; Poureshgh, Y. Efficiency of zeolite coated with zero-valent ion nanoparticles for removal of humic acid from aqueous solutions. Water Air Soil Pollut. 2020, 231, 514. [Google Scholar] [CrossRef]
- Klučáková, M. Size and charge evaluation of standard humic and fulvic acids as crucial factors to determine their environmental behavior and impact. Front. Chem. 2018, 6, 235. [Google Scholar] [CrossRef] [PubMed]
- Hubbe, M.A.; Azizian, S.; Douven, S. Implications of apparent pseudo-second-order adsorption kinetics onto cellulose materials: A review. Bioresources 2019, 14, 7582–7626. [Google Scholar] [CrossRef]
- Zhao, X.; Wang, T.; Du, G.; Zheng, M.; Liu, S.; Zhang, Z.; Zhang, Y.; Gao, X.; Gao, Z.J. Effective removal of humic acid from aqueous solution in an Al-based metal–organic framework. Chem. Eng. Data 2019, 64, 3624–3631. [Google Scholar] [CrossRef]
- Petrov, D.; Tunega, D.; Gerzabek, M.H.; Oostenbrink, C. Molecular dynamics simulations of the standard leonardite humic acid: Microscopic analysis of the structure and dynamics. Environ. Sci. Technol. 2017, 51, 5414–5424. [Google Scholar] [CrossRef] [PubMed]
- Ahmad, R.; Haseeb, S. Adsorption of Pb(II) on Mentha piperita carbon (MTC) in single and quaternary systems. Arab. J. Chem. 2014, 10, S412–S421. [Google Scholar] [CrossRef]
- Onursal, N.; Altunkaynak, Y.; Baran, A.; Del, M.C. Adsorption of nickel(II) ions from aqueous solutions using Malatya clay: Equilibrium, kinetic and thermodynamic studies. Environ. Prog. Sustain. Energy 2023, 42, e14150. [Google Scholar] [CrossRef]
- Jankovic, J.; Lukic, J.; Kolarski, D.; Veljović, D.; Radovanović, Ź.; Dímitrijević, S. Isotherm, thermodynamic and kinetic studies of elemental sulfur removal from mineral insulating oils using highly selective adsorbent. Materials 2023, 16, 3522. [Google Scholar] [CrossRef] [PubMed]
- Foo, K.Y.; Hameed, B.H. Insights into the modeling of adsorption isotherm systems. Chem. Eng. J. 2010, 156, 2–10. [Google Scholar] [CrossRef]
- Webber, T.W.; Chakkaravorti, R.K. Pore and solid diffusion models for fixed-bed adsorbers. AIChE J. 1974, 20, 228–238. [Google Scholar] [CrossRef]
- Akpromie, K.G.; Conradie, J.; Adegoke, K.A.; Oyedotun, K.O.; Ighalo, J.O.; Amaku, J.F.; Olisah, C.; Adeola, A.O.; Iwuozor, K.O. Adsorption mechanism and modeling of radionuclides and heavy metals onto ZnO nanoparticles: A review. Appl. Water Sci. 2023, 13, 20. [Google Scholar] [CrossRef]
- Cumming, J.; Hawker, D.W.; Chapman, H.; Nugent, K. Sorption of polymeric quaternary ammonium compounds to humic acid. Water Air Pollut. 2011, 214, 5–11. [Google Scholar] [CrossRef]
- Roba, C.A.; Jimenez, C.; Baciu, C.; Beldean-Galea, S.; Levei, E.; Cordoş, E. Assessment of different sorbents efficiency for solid phase extraction of aquatic humic acids. Cent. Eur. J. Chem. 2011, 9, 598–604. [Google Scholar] [CrossRef]
- Geng, N.; Chen, W.; Xu, H.; Ding, M.; Liu, Z.; Shen, Z. A sono-photocatalyst for humic acid removal water: Operational parameters, kinetics and mechanism. Ultrason. Sonochem. 2019, 57, 242–252. [Google Scholar] [CrossRef]
- Anirudhas, T.S.; Suchithra, P.S.; Rajith, S. Amine-modified polyacrylamide-bentonite composite for the adsorption of humic acid in aqueous solutions. Colloid Surfaces A Physicochem. Eng. Asp. 2008, 326, 147–156. [Google Scholar] [CrossRef]
- Chen, K.; Feng, Q.; Feng, Y.; Ma, D.; Wan, D.; Liu, Z.; Zhu, W.; Li, Z.; Qin, F.; Feng, J. Ultrafast removal of humic acid by amine-modified silica aerogel: Insights from experiments and density functional theory calculation. Chem. Eng. J. 2022, 435, 135171. [Google Scholar] [CrossRef]
- Zhang, J.; Kang, M.; Zhou, Y.; Ma, C.; Ning, F.; Qiu, Z. Facile synthesis of polyethyleneimine modified magnetic graphite: An effective adsorbent for the removal of humic acid from aqueous solution. Mater. Chem. Phys. 2020, 255, 123549. [Google Scholar] [CrossRef]
- Naseem, S.; Aslam, Z.; Abbas, A.; Sumbal, S.; Ali, R.; Usman, M. Synthesis and application of cobalt-based metal-organic framework for adsorption of humic acid from water. Chem. Biochem. Eng. Q. 2022, 36, 39–50. [Google Scholar] [CrossRef]


| Pseudo-First Order | Pseudo-Second Order | ||||||||
|---|---|---|---|---|---|---|---|---|---|
| pH | k1 | R2 | Range | k2 | r2 | Range | |||
| (g/g-Qcell) | (g/g-Qcell) | (1/h) | (min) | (g/g-Qcell) | (g/g·h) | (h) | |||
| 3.0 | 0.359 | 0.350 | 1.67 | 0.9088 | 5 | 0.358 | 2.17 | 0.9961 | 6.58 |
| 4.0 | 0.314 | 0.299 | 0.55 | 0.9973 | 30 | 0.318 | 2.12 | 0.9970 | 6.75 |
| 5.0 | 0.218 | 0.211 | 1.38 | 0.9675 | 20 | 0.220 | 2.94 | 0.9993 | 5.67 |
| 6.0 | 0.194 | 0.191 | 0.50 | 0.9952 | 40 | 0.193 | 3.08 | 0.9996 | 5.93 |
| 7.0 | 0.191 | 0.199 | 0.47 | 0.9817 | 30 | 0.197 | 2.83 | 0.9975 | 6.50 |
| 8.0 | 0.194 | 0.188 | 0.63 | 0.9733 | 25 | 0.191 | 3.76 | 0.9996 | 4.83 |
| 9.0 | 0.183 | 0.190 | 1.23 | 0.9938 | 5 | 0.180 | 2.96 | 0.9976 | 6.33 |
| 10.0 | 0.167 | 0.178 | 0.44 | 0.9786 | 40 | 0.175 | 2.86 | 0.9917 | 6.75 |
| 11.0 | 0.166 | 0.160 | 0.50 | 0.9635 | 30 | 0.169 | 2.83 | 0.9991 | 6.33 |
| 12.0 | 0.128 | 0.137 | 0.44 | 0.9489 | 30 | 0.148 | 1.91 | 0.9952 | 5.67 |
| at pH 3.0 | |||||
| Temp. | k2 | r2 | Range | ||
| (°C) | (g/g-Qcell) | (g/g-Qcell) | (g/g·h) | (h) | |
| 15 | 0.345 | 0.338 | 1.46 | 0.9872 | 5.50 |
| 25 | 0.359 | 0.358 | 2.17 | 0.9961 | 6.58 |
| 35 | 0.344 | 0.342 | 2.29 | 0.9991 | 6.58 |
| 45 | 0.340 | 0.336 | 2.59 | 0.9962 | 6.08 |
| at pH 6.0 | |||||
| Temp. | k2 | r2 | Range | ||
| (°C) | (g/g-Qcell) | (g/g-Qcell) | (g/g·h) | (h) | |
| 15 | 0.194 | 0.194 | 2.01 | 0.9969 | 6.67 |
| 25 | 0.194 | 0.193 | 3.08 | 0.9996 | 5.93 |
| 35 | 0.180 | 0.181 | 5.88 | 0.9994 | 6.83 |
| 45 | 0.182 | 0.179 | 8.77 | 0.9932 | 6.98 |
| pH | C0 | Qmax | KL | r2 | RL | |
|---|---|---|---|---|---|---|
| (mmol/g-Qcell) | (mg/L) | (g/g-Qcell) | (L/mg) | (-) | ||
| 0.095 | 3.0 | 55.2–148.8 | 0.431 | 0.0196 | 0.9877 | 0.255–0.480 |
| 6.0 | 50.8–146.6 | 0.119 | 0.0188 | 0.9916 | 0.266–0.512 | |
| 0.231 | 3.0 | 65.4–153.3 | 0.770 | 0.0279 | 0.9851 | 0.189–0.354 |
| 6.0 | 77.8–149.8 | 0.354 | 0.0196 | 0.9970 | 0.254–0.396 | |
| 0.380 | 3.0 | 82.7–175.9 | 0.861 | 0.0308 | 0.9977 | 0.156–0.282 |
| 6.0 | 80.3–177.6 | 0.487 | 0.0151 | 0.9937 | 0.184–0.332 |
| Adsorbent | pH | Temp. | HA Conc. | Dose | Qexp | Qmax | Ref. |
|---|---|---|---|---|---|---|---|
| (°C) | (mg/L) | (g/L) | (mg/g) | (mg/g) | |||
| Quaternized cellulose beads | 3.0 | 25 | 100 | 0.20 | 430 | this study | |
| with 0.524 mmol/g-Qcell | 6.0 | 25 | 100 | 0.20 | 312 | ||
| Quaternized cellulose beads | 3.0 | 25 | 175 | 0.20 | 575 | 861 | |
| with 0.524 mmol/g-Qcell | 6.0 | 25 | 100 | 0.20 | 365 | 487 | |
| Zeolite-coated zero-valent iron particles | 3 | 25 | 100 | 0.10 | 42.1 | 36.23 | [6] |
| Activated carbon from rice husks | 6.5 | 25 | 10 | 1.0 | 27.4 | 30.4 | [14] |
| Aminated polyacrylonitrile fibers | 6 | 22–23 | 50 | 2.0 | 9.7 | 16.22 | [40] |
| Surfactant-modified chitosan/zeolite | 7 | 30 | 90 | 0.50 | 164 | [43] | |
| PDMAEMA/pumice composite hydrogel | 4.0 | 20 | 50 | 0.50 | 59.72 | [44] | |
| Al3+-based metal organic framework | natural | 30 | 25 | 0.50 | 33.67 | 115.5 | [48] |
| PEI modified magnetic graphite | 6.5 | 20 | 21 | 0.25 | 39.76 | 50.68 | [60] |
| Amine-modified silica aerogel | 5.0 | 5 | 250 | 1 | 235.5 | [61] | |
| Cobalt-based metal–organic framework | 6 | 32 | 50 | 0.50 | 89.72 | [62] |
Disclaimer/Publisher’s Note: The statements, opinions and data contained in all publications are solely those of the individual author(s) and contributor(s) and not of MDPI and/or the editor(s). MDPI and/or the editor(s) disclaim responsibility for any injury to people or property resulting from any ideas, methods, instructions or products referred to in the content. |
© 2024 by the authors. Licensee MDPI, Basel, Switzerland. This article is an open access article distributed under the terms and conditions of the Creative Commons Attribution (CC BY) license (https://creativecommons.org/licenses/by/4.0/).
Share and Cite
Uchiyama, K.; Asamoto, H.; Minamisawa, H.; Yamada, K. Kinetic, Isothermal, and Thermodynamic Analyses of Adsorption of Humic Acid on Quaternized Porous Cellulose Beads. Macromol 2024, 4, 117-134. https://doi.org/10.3390/macromol4010006
Uchiyama K, Asamoto H, Minamisawa H, Yamada K. Kinetic, Isothermal, and Thermodynamic Analyses of Adsorption of Humic Acid on Quaternized Porous Cellulose Beads. Macromol. 2024; 4(1):117-134. https://doi.org/10.3390/macromol4010006
Chicago/Turabian StyleUchiyama, Kana, Hiromichi Asamoto, Hiroaki Minamisawa, and Kazunori Yamada. 2024. "Kinetic, Isothermal, and Thermodynamic Analyses of Adsorption of Humic Acid on Quaternized Porous Cellulose Beads" Macromol 4, no. 1: 117-134. https://doi.org/10.3390/macromol4010006
APA StyleUchiyama, K., Asamoto, H., Minamisawa, H., & Yamada, K. (2024). Kinetic, Isothermal, and Thermodynamic Analyses of Adsorption of Humic Acid on Quaternized Porous Cellulose Beads. Macromol, 4(1), 117-134. https://doi.org/10.3390/macromol4010006