Article

Establishing an Electron FLASH Platform for Preclinical Research in Low-Resource Settings

1
Biomedical Imaging and Radiation Technology Laboratory (BIRTLab), Department of Radiation Oncology, The University of Texas Southwestern Medical Center, Dallas, TX 75235, USA
2
Department of Radiation Oncology, The University of Texas Southwestern Medical Center, Dallas, TX 75235, USA
3
New York Proton Center, New York, NY 10035, USA
4
Department of Radiation Oncology, University of Missouri, Columbia, MO 65211, USA
5
Department of Physics, College of Science, The University of Texas at Arlington, Arlington, TX 76019, USA
*
Authors to whom correspondence should be addressed.
These authors contributed equally to this work.
Radiation 2025, 5(4), 33; https://doi.org/10.3390/radiation5040033
Submission received: 10 October 2025 / Revised: 5 November 2025 / Accepted: 7 November 2025 / Published: 11 November 2025

Simple Summary

Radiation therapy is a cornerstone of cancer treatment, but its effectiveness is often limited by normal tissue toxicity. FLASH radiotherapy, characterized by ultra-high dose rates >40 Gy/s, has the potential to mitigate normal tissue toxicity without compromising tumor control. However, dedicated FLASH platforms are not widely accessible to researchers due to significant financial and personnel constraints, limiting efforts to study its underlying mechanisms. In this work, we show a detailed workflow of using a standard clinical linear accelerator to establish an electron FLASH platform in low-resource settings without requiring vendor-proprietary hardware or software, or vendor-assisted modifications. We also present dose rate optimization and an open-source Monte Carlo dose calculation system, demonstrating the platform’s accuracy and readiness for preclinical studies. We expect that this work will provide the scientific community with a cost-effective approach to accessing a FLASH machine for preclinical research, facilitating clinical translation.

Abstract

Background: FLASH radiotherapy delivers ultra-high dose rates with normal tissue sparing, but mechanisms remain unclear. We present a streamlined workflow for establishing a LINAC-based electron FLASH (eFLASH) platform in low-resource settings without requiring vendor-proprietary hardware or software, or vendor-assisted modifications to broaden accessibility for FLASH studies. Methods: A LINAC was converted to eFLASH with pulse control and monitoring. Automatic frequency control (AFC) was optimized to stabilize dose per pulse (DPP). Beam data were measured with EBT-XD films, and a Monte Carlo (MC) model was commissioned for in vivo dose calculation. We demonstrated in vivo dosimetry in planning studies of mouse whole-brain and rat spinal cord (C1–T2) irradiation. We further assessed the impact of AFC optimization on the FLASH spinal cord study. Results: AFC optimization stabilized DPP at ~0.6 Gy/pulse, reducing large fluctuations under the default setting. MC agreed with measurements within 2% for PDDs and profiles. MC planning showed uniform whole-brain irradiation with 6 MeV FLASH, while the spinal cord study exhibited up to 10% dose fall-off within 1 cm along the cord, suggesting potential dose-volume effects confounding FLASH sparing. Following AFC optimization, 50% of the C1–T2 cord reached >133 Gy/s, a 23% increase versus default. Conclusions: We demonstrated a cost-effective eFLASH platform and verified its accuracy for preclinical studies, expanding the accessibility of FLASH research.

1. Introduction

FLASH radiotherapy (FLASH-RT) is a treatment regimen enabling the delivery of curative dose to tumors at an ultra-high dose rate (UHDR, >40 Gy/s) while mitigating normal tissue toxicity, known as the FLASH effect [1]. Despite its considerable potential for clinical practice, researchers have not fully understood the underlying mechanisms, late toxicities, and optimal fractionation schemes. This has necessitated extensive preclinical investigations, leading institutions to initiate research programs.
Electron FLASH (eFLASH) platforms have been extensively utilized in preclinical studies [1,2,3,4] and human trials [5,6]. Compared to photon [7,8,9,10], proton [11,12,13,14], or heavy ion [15] systems, eFLASH implementation is more accessible due to modifications of existing clinical linear accelerators (LINACs). Several groups have successfully adapted LINACs for eFLASH, demonstrating its feasibility and potential applications.
Lempart et al. [16] modified an Elekta Precise LINAC to enable eFLASH irradiation, while Xie et al. [17] simplified the process on an Elekta Synergy LINAC. Similarly, Varian Clinac LINACs have been adapted for eFLASH mode by researchers [18,19,20,21]. Beyond researcher-led modifications, vendors have introduced FLASH extension packages. Oh et al. [22] and Cetnar et al. [23] reported the conversion and commissioning of Varian Clinac 23EX and iX models using vendor-supported upgrades, which included RF power and electron gun adjustments, custom scattering foils, and Beam Pulse Counters. Varian TrueBeam LINACs have also been adapted for eFLASH using software patches, thinner scattering foils, and beam tuning [24].
Despite these advancements, current eFLASH platforms heavily depend on either vendor support or specialized engineering expertise, posing barriers for many research institutions. Existing systems require custom hardware and software modifications, such as reprogramming printed circuit boards (PCBs) [18], dedicated gating switchboxes [19], integrating proprietary firmware patches [24], vendor-assisted hardware adjustments, or vendor-provided devices [22,23]. These dependencies introduce significant financial and personnel constraints, limiting widespread adoption of eFLASH systems within the research community. To address these limitations, we first adapted the approach from Rahman et al. [19], achieving electron FLASH through conversion from photon mode, which enables UHDR delivery without requiring RF power and electron gun adjustments or custom scattering foils. We further introduced a simplified pulse control system utilizing the customer-defined dosimetry interlock (CDOS), commonly integrated into Varian Clinac LINACs to regulate pulse delivery. Our approach reduces reliance on vendor-proprietary hardware/software and vendor-assisted modifications, improving the accessibility of FLASH research platforms across institutions.
With the high dose per pulse (DPP) commonly encountered in eFLASH studies, it is essential to accurately control pulse delivery and maintain a consistent dose rate. However, in LINAC-based eFLASH, the inconsistent DPP has been reported during the initial ramp-up period [19,21], leading to fluctuations in dose rates. In this work, we provide an approach for optimizing the automatic frequency control (AFC) servo to achieve uniform pulse delivery and a consistent DPP and mean dose rate throughout UHDR studies.
Despite the expansion of FLASH research, most studies rely on phenomenological observations in animal models, and concerns regarding in vivo dose and dose rate inhomogeneities are often overlooked. To complement hardware developments, we present a workflow for commissioning a Monte Carlo (MC) dose engine based on the open-source Geant4 package for our eFLASH platform. MC-based planning studies for mouse whole-brain irradiation and rat spinal cord irradiation are included. The whole-brain model is widely used in FLASH studies [25,26,27,28], while the spinal cord is crucial for assessing FLASH’s potential to spare late-responding organs for clinical translation [29]. These studies highlight electron dosimetry heterogeneity and emphasize the need for accurate dose calculations in in vivo FLASH research.
Using the spinal cord case, we further evaluated the impact of pulse form optimization on animal studies. Following AFC optimization with stable DPP, the spinal cord volume received a significantly higher mean dose rate than under non-optimized conditions, emphasizing the importance of a consistent DPP for study reproducibility.
In summary, we present a low-resource approach for establishing a LINAC-based eFLASH preclinical platform. By leveraging existing clinical LINACs and a simplified pulse control system, we enable UHDR delivery without extensive hardware or software modifications. Our work also addresses key dosimetric challenges by optimizing AFC for stable pulse delivery and commissioning an open-source MC dose engine for accurate in vivo dose calculations. While this study focuses on the 6 MeV beam, the workflow is adaptable to other energy modes. We anticipate that our approach will expand access to FLASH research, support investigations into its biological mechanisms, and facilitate clinical translation.

2. Materials and Methods

2.1. Machine Modification

We converted a Varian 21EX LINAC into eFLASH by configuring it in photon mode and retracting the target and the flattening filter. Removing both components from the beam path maximized electron beam fluence, enabling UHDR irradiation. In conventional LINAC operation, the target, carousel, and energy switch are pneumatically controlled via air valves. To deliver UHDR electron beams in photon mode, we disabled the air drive in the LINAC backstand, allowing for manual adjustment and the secure positioning of these components. The energy switch was mechanically locked at the desired position to prevent shifting during FLASH irradiation.

2.2. Pulse Monitoring and Control

2.2.1. Pulse Form Monitoring

To ensure accurate and reproducible UHDR delivery, it is essential to precisely control the number of pulses delivered and monitor the amplitudes of these pulses in real time. We employed a pulse form monitoring unit (unit 1 in Figure 1), which consists of an HC-120 series photomultiplier tube (PMT, Hamamatsu, Shizuoka Prefecture, Japan) coupled with an optical fiber. This unit, positioned outside the radiation field, detected scattered radiation through radiation-induced Cherenkov and fluorescence emissions. The PMT output was fed into an oscilloscope (70 MHz, PicoScope 3000 series, Pico Technology, Cambridgeshire, UK), allowing us to monitor the pulse amplitudes on a pulse-by-pulse basis.

2.2.2. Monitor Units (MU) and External Pulse Control

LINAC pulse delivery can be controlled via either the MU setting or an external pulse control system. At high DPPs, monitor chambers may experience saturation or reduced ion collection efficiency [30]. Despite this, pulse number control via the MU setting remains feasible, though limited in adjusting pulse count and dose resolution, as shown in later results.
An external pulse control unit (unit 2 in Figure 1) was developed to complement the MU setting, offering greater flexibility. Pulse counting was performed by a remote trigger unit (RTU, DoseOptics LLC, Lebanon, NH, USA) positioned outside the radiation field. This coincidence-based radiation detector features 2 scintillators and corresponding silicon photomultipliers to detect scattered radiation. An Arduino-RTU (Mega 2560, Arduino, Turin, Italy) circuit was designed to count pulses and deactivate a gating reed relay once the desired pulse count was reached. This reed relay was connected across pins 1 and 2 of the J15 jumper on the stand PCB at the back of the Varian 21EX LINAC. Disconnecting these pins triggers the CDOS interlock (unit 3 in Figure 1), immediately terminating radiation.

2.3. Pulse Form Optimization

In our standing wave accelerator, the microwave power is supplied at the resonant frequency of the accelerating guide. This is managed by the AFC system in the LINAC, which adjusts the frequency of the radiofrequency (RF) driver based on the phase relationship between RF forward and reflected power samples from the waveguide [31]. However, the LINAC’s automatic feedback mechanisms were unable to fine-tune the beam within the short span of the initial several pulses in our 6 MeV FLASH mode, resulting in several unstable pulses with varying amplitudes. These variations can lead to inconsistent DPPs and dose rates, further introducing dosimetry uncertainties in UHDR delivery. To address this issue, we presented an optimization strategy to adjust the pulse form by disabling the AFC servo and manually aligning the microwave source frequency from the RF driver with the waveguide’s resonant frequency using the AFC manual mode. We used the PMT signal to monitor the pulse until a stable pulse form was achieved during the adjustment.

2.4. Pulse Form Analysis

Each pulse in the waveform exhibits a ramp-up and decay behavior, lasting approximately 4.5 µs (Supplementary Figure S1a). The area under the curve (AUC) of pulses was found to correlate with the delivered dose. We observed that the total AUC of all pulses during irradiation, after subtracting the background signal, exhibited a linear relationship with the total dose measured by film, with a coefficient of determination (R2) close to 1 (Supplementary Figure S1b). This relationship allows us to calculate the DPP using the ratio of AUC per pulse to the total AUC of all pulses, multiplied by the total delivered dose. Using this method, we can analyze the DPP for a given AFC setting based on the waveform. We can then quantify the delivered dose and its corresponding instantaneous dose rates during delivery.

2.5. Beam Data Measurement

We used Gafchromic EBT-XD films (Ashland, Bridgewater, NJ, USA) for beam data measurement and MC engine commissioning, as these films have demonstrated dose rate and energy independence [32,33,34]. The films were scanned 24 hours post-irradiation using a flatbed scanner (Epson Expression 12000XL, Suwa, Nagano, Japan). An in-house film analysis software was employed to extract the dose information from films, utilizing a dual-channel method (green and blue) [35].
The film dosimetry was validated using optically stimulated luminescence dosimeters (OSLDs) due to their dose-rate independence [32,36,37,38]. The OSLDs (nanoDot, Landauer, Glenwood, IL, USA) and films were placed at the depth of maximum dose (dmax, 1.3 cm) in solid water with a 10 cm × 10 cm field size and 100 cm source-to-surface distance (SSD). The dose from each OSLD was determined by averaging 3 readings using the microStar reader (Landauer, Glenwood, IL, USA). OSLDs were read out at least 10 minutes after irradiation [39], and routine quality control testing of the reader was performed prior to the readout session. The differences between film and OSLD measurements were within 4%.
Our beam data includes PDD, profiles, dose rates, and output factors. Films were positioned orthogonally to and centered along the beam’s central axis (CAX), either at the surface or at various depths between 30 cm × 30 cm solid water slabs, with a backscatter piece of 6 cm thickness. The measurements were conducted at 100 cm SSD by default. Various field sizes, including open field, 10 cm × 10 cm, 6 cm× 6 cm, and the circular fields with diameters of 3, 2, 1.5, and 1 cm within the 6 cm × 6 cm cone, were included.
For PDDs, depth dose measurements were obtained by averaging the dose within the central area of 2.5 cm × 2.5 cm square films placed at various depths, using a 0.3 cm × 0.3 cm averaging area for 1 and 1.5 cm diameter circular fields and a 0.5 cm × 0.5 cm area for all other fields. The film-measured PDDs were fitted with a Fermi–Dirac distribution multiplied by a 3rd-degree polynomial with R2 ≥ 0.99 to generate continuous PDD curves [40].
Crossline and inline profiles were measured using 25 cm × 2.5 cm films in solid water at depths of 0, 0.8, 1.3, 1.8, and 2.3 cm. The profiles at dmax of 1.3 cm were also measured at other SSDs of 95, 110, and 120 cm. Furthermore, the in-air profiles at 95 cm SSD were also measured by placing the 25 cm × 2.5 cm films on the surface of Styrofoam blocks along crossline and inline directions.
The output factor for a given field size at dmax was determined from film measurements relative to the dose at a 10 cm × 10 cm field. The dose rates, DPP, and instantaneous dose rates were calculated based on the delivered dose, pulse number, pulse repetition frequency (PRF), and pulse width information through our pulse monitoring and control units (Figure 1).

2.6. MC Beam Modeling and Dose Calculation

2.6.1. MC Beam Modeling

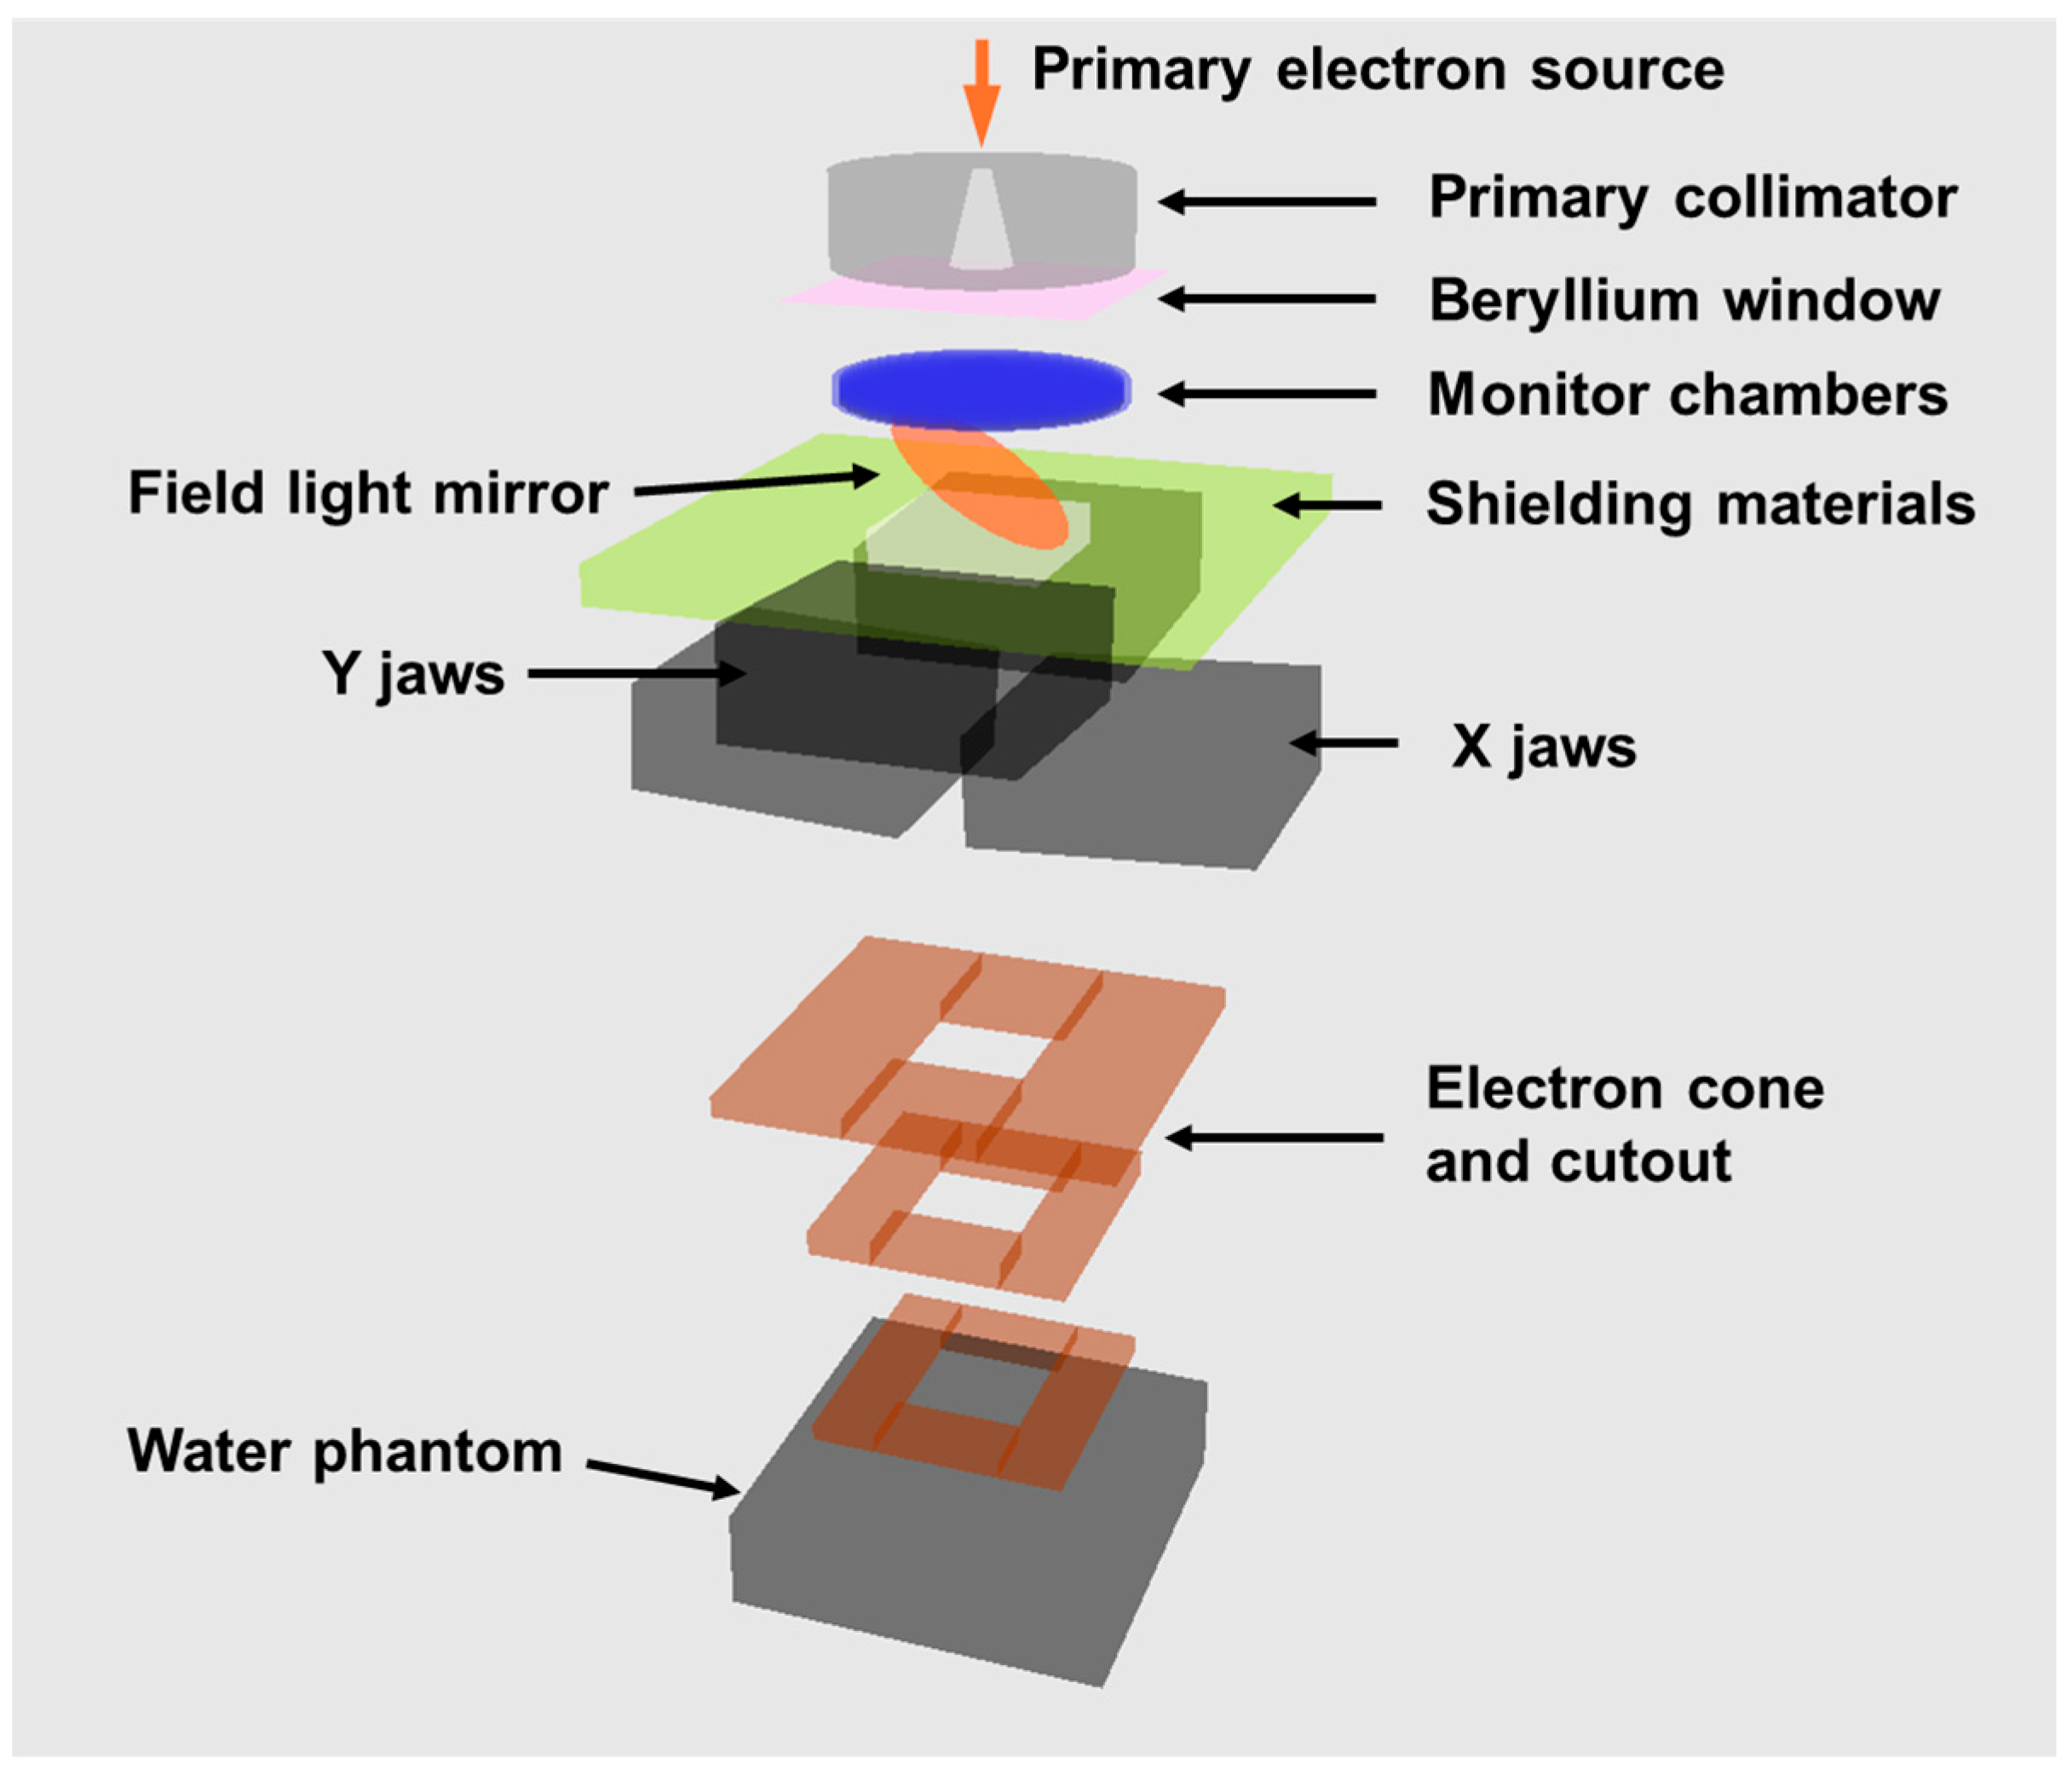
It is widely recognized that accurate dose calculations for electron beams often require the use of MC simulations [41]. Considering this, we have developed a Geant4-based GAMOS [42] MC dose calculation engine tailored for FLASH studies. It is crucial to accurately model all the necessary components in the LINAC head that are traversed by an electron beam [43]. This is because electrons can easily scatter and generate X-rays by interacting with the LINAC head components. We explicitly modeled the LINAC head geometry using the GAMOS package, including the target, primary collimator, flattening filter or scattering foil, beryllium window, monitor chambers, field light mirror, shielding materials, jaws, electron applicators and cutouts. For the eFLASH, the target and flattening filter were removed (Figure 2). Extended from the work of Rahman et al. [44], we modified the representation of the X jaws, modeling them as moving in a linear trajectory instead of simplified arc trajectory. The Y jaws were kept the same as they move along an arc trajectory. Furthermore, we refined the modeling of the electron applicators, representing them with 3 layers, as opposed to a simplistic single bottom layer.
Given the LINAC head geometry (Figure 2), to extract the necessary beam parameters for the FLASH beam, we need to determine the source emission parameters including mean energy (E), mean energy spread (σE), source emittance cone angle (θcone), and spot size (σ) through a commissioning process.
The MC model commissioning was performed using the open-field setting, where the jaws were opened at around 40 cm × 40 cm field size and electron applicators were removed, to extract the source parameters [45,46]. To obtain PDD and profiles, in GAMOS we simulated a 30 cm × 30 cm × 8 cm water phantom composed of 0.1 cm × 0.1 cm × 0.1 cm voxels using the material ICRU water. A total of 2 × 10⁸ particle histories were simulated and the statistical uncertainty per voxel was maintained at <3% for voxels with a dose >50% of the maximum dose. The GAMOS basic electromagnetic physics list GmEMPhysics was applied for all MC simulations in this study.
In the initial step of beam parameter tuning, where PDD fitting was involved, we first varied E from 5.5 to 6.5 MeV and σE from 0.1 to 0.9 MeV. The σ was kept constant at 0.5 mm, a value shown to effectively represent the electron beam [44,47], and θcone was initially assumed to be 0°. The optimal combination of E and σE was determined by achieving the minimum average absolute difference (AAD) <2% between the MC-simulated PDD and the film-measured PDD under the open-field setting. Based on the optimal values of E and σE, we then varied θcone from 0.0 to 8.0° while keeping σ constant at 0.5 mm for profile fitting. Given the open-field setting, the optimized θcone was selected when the AAD <2% between MC-simulated and film-measured profiles can be achieved along both crossline and inline directions at depths of 0, 0.8, 1.3, 1.8 and 2.3 cm. Moreover, the optimal θcone was also confirmed by comparing the simulated in-air profiles at 95 cm SSD and profiles at 1.3 cm depth in solid water at SSDs of 95, 110, and 120 cm to those of measurements, with AAD <2% for each comparison.
Finally, the beam model was validated by the measured PDD and profiles at field sizes commonly used in preclinical settings, including 10 cm × 10 cm, 6 cm × 6 cm, and circular fields with 3, 2, 1.5, and 1 cm diameters. The MC simulation setting used in the validation step was the same as that of the beam modeling process except various electron applicators, cutouts, and corresponding jaw openings were applied. The validation criterion was that the AAD between MC simulations and film measurements should be <2% for all the cases considered.

2.6.2. MC Dose Calculation

After establishing the FLASH beam model, we developed an MC dose engine for preclinical studies. Phase-space (PS) files at the plane of 96 cm SSD, beneath the electron cones, were generated for the aforementioned field sizes and utilized for dose calculations at 100 cm SSD. For animal dose calculations, computed tomography (CT) or cone beam CT (CBCT) scans of the animals were imported into Eclipse (Varian, Palo Alto, CA, USA) for tissue segmentation and then exported to the GAMOS MC package. Material types based on the segmentation were assigned to the corresponding voxels of the CT/CBCT images for the simulation.

2.7. FLASH Preclinical Planning Studies

2.7.1. Mouse Whole-Brain Irradiation

Following the process described above, we performed planning studies of in vivo cases with the 6 MeV FLASH MC model. The statistical uncertainty per voxel of the MC dose calculations was maintained at <3% for voxels with a dose >50% of the maximum dose. To mimic the experimental setup described in Montay-Gruel et al. [25], we design a mouse whole-brain irradiation planning study using a single 6 MeV posterior–anterior (PA) beam with a 1.7 cm diameter circular graphite aperture at 100 cm SSD. An 8-week-old C57BL/6J albino mouse’s CBCT scan acquired by the small animal radiation research platform (SARRP, Xstrahl, Surrey, UK) was used. The dose distribution was normalized to the point dose at a depth of 0.25 cm along the beam CAX, around the center of the brain.

2.7.2. Rat Spinal Cord Irradiation

In the second case, we investigated rat C1–T2 spinal cord irradiation, a common site for studying late toxicities at CONV dose rates. A single PA beam with a 2 cm × 1 cm field size at 100 cm SSD was designed for the spinal cord irradiation. A 9-week-old CD IGS rat’s CT scan from a small animal PET/CT system (Inveon, Siemens, Munich, Germany) was used. The dose normalization point was at the transverse center of the spinal cord, 1 cm cranial to T2 longitudinally.

2.8. Assess the Impact of AFC Optimization on FLASH Animal Studies

To assess the impact of AFC setting on mean dose rate uniformity in animal studies, we used the rat spinal cord case to illustrate in vivo dose rate distributions via a dose rate-volume histogram (DRVH). The dose distributions resulting from 26 and 32 pulses, which provided the same point dose of 10.7 Gy at the normalization point under both the default and AFC-optimized settings with a PRF of 360 Hz, were used to calculate the dose-rate distributions and generate the DRVH. The analyzed volume was the segmented C1–T2 spinal cord on CBCT data with voxel size of 0.1 mm × 0.1 mm × 0.1 mm, and the DRVH was computed directly from sorted voxel-wise dose rate values.

3. Results

3.1. Pulse Control and Optimization

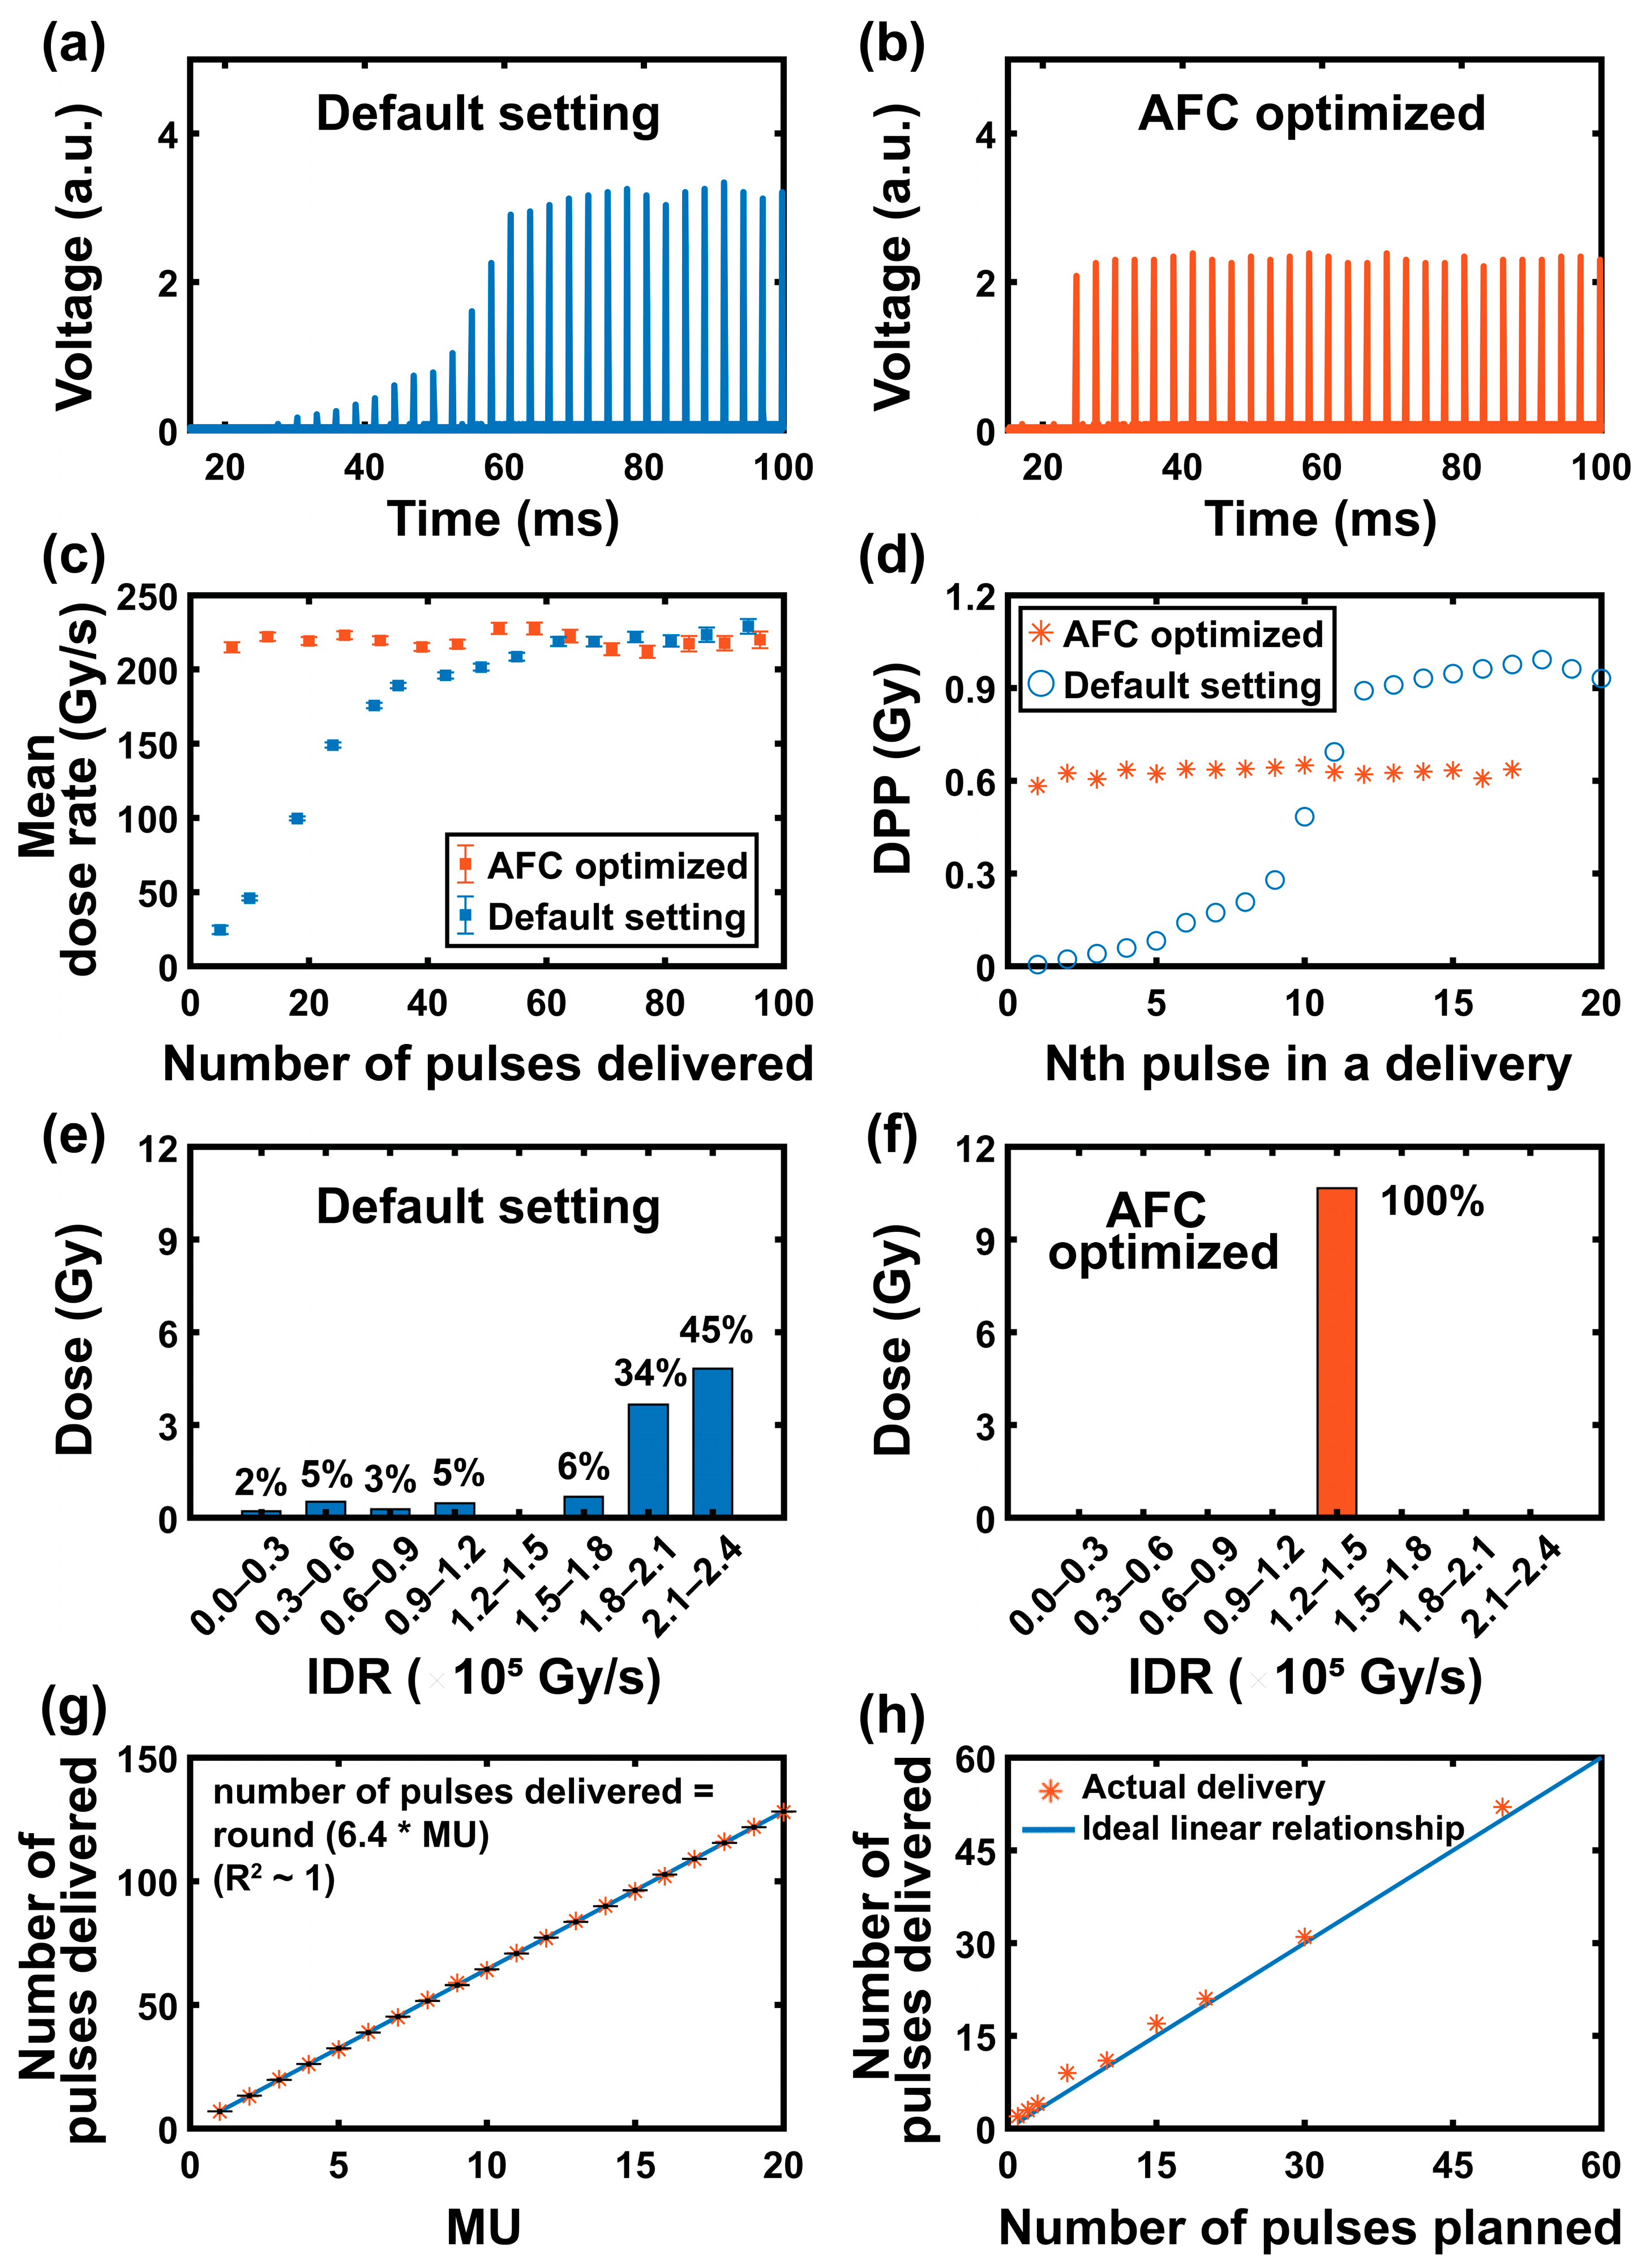
The 6 MeV FLASH beam operates at a fixed PRF of 360 Hz with a pulse width of 4.5 μs. As shown in Figure 3a, the LINAC default AFC setting results in an approximately 13-pulse ramp-up period with varying pulse amplitudes, indicating inconsistent DPP and instantaneous dose rate. Across the 28 pulses shown in Figure 3a, the coefficient of variation (CV) of pulse amplitude is 59.6%. In contrast, after AFC optimization (Figure 3b), the pulse amplitudes remain stable, with a CV of 2.2%.
Figure 3c illustrates the mean dose rate as a function of the number of pulses delivered at solid water surface with a 10 cm × 10 cm field and 100 cm SSD, under default and AFC-optimized settings. Under the default setting, the mean dose rate varied from 25 to 219 Gy/s for deliveries of 5 to 62 pulses. After AFC optimization, the mean dose rate remained stable at 219 ± 5 Gy/s even with 96 pulses. These results indicate that AFC optimization enhances the reproducibility of the mean dose rate across multiple pulse deliveries.
If one were to deliver a fixed dose, e.g., 10.7 Gy, around the 10 Gy threshold where the FLASH effect starts to emerge [48], the DPPs of each pulse for both default setting and AFC optimization are shown in Figure 3d. Under the default setting, the DPP increased from 0.005 to 0.9 Gy/pulse over the first 13 pulses before reaching a stable phase (Figure 3d). These results translate to a total dose of 10.7 Gy delivered at instantaneous dose rate (IDR) of (1.2 ± 0.9) × 105 Gy/s, compared to the AFC-optimized setting of (1.40 ± 0.03) × 105 Gy/s. This corresponds to a large non-uniform dose delivered at various IDRs, whereas 100% of the dose was delivered at an average of 1.4 × 10⁵ Gy/s with a small deviation after AFC optimization (Figure 3e,f).
Figure 3g shows a linear correlation between the number of delivered pulses and MU, with each MU corresponding to 6 or 7 pulses. Although it offers limited options in terms of pulse numbers, the MU setting allows us to deliver selected doses. As a complementary method, the external control unit (unit 2 in Figure 1) occasionally misses 1–3 pulses beyond the set pulse number (Figure 3h), corresponding to ~0.6–1.8 Gy dose deviation after AFC optimization at isocenter with a 10 cm × 10 cm cutout and 100 cm SSD. This discrepancy likely stems from phase mismatch between RTU counting and the LINAC’s independent pulse clock, compounded by the variable delay between an RTU pulse and the Arduino’s stop signal, and by the reed relay’s electromechanical release and contact bounce. As future improvements, we will optimize the Arduino code to reduce variable delay and replace the reed relay with a fast solid-state gate. In practice, we record the delivered pulse number alongside delivered dose, rather than the planned pulse number, thereby avoiding dosimetric errors due to external control unit uncertainty.

3.2. Beam Data

Figure 4a presents the film-measured and Fermi–Dirac fitted PDD curves for the 6 MeV FLASH beam, alongside the 6 MeV CONV beam for comparison. The FLASH beam exhibited a lower energy than the CONV beam but maintained a similar dmax around 1.3 cm. Additionally, their in-air profiles are compared in Supplementary Figure S2.
Figure 4b,c show the FLASH PDDs and corresponding depth dose rates at 100 cm SSD for each field size. The surface dose rate under 10 cm × 10 cm can reach 218 ± 3 Gy/s at 100 cm SSD, corresponding to 0.60 ± 0.01 Gy/pulse and an IDR of (1.34 ± 0.02) × 105 Gy/s. The detailed beam characteristics at 100 cm SSD for each field size are shown in Supplementary Table S1. As the field size decreased from 10 cm × 10 cm to a 1 cm diameter circular field, dmax shifted from 1.3 to 0.4 cm (Figure 4b), while the dose rate at dmax decreased from 320 to 171 Gy/s (Figure 4c). The dmax, corresponding dose rates, and output factors for all the field sizes are provided in Supplementary Table S2.
Figure 4d and Figure 4e depict crossline relative dose and dose rate profiles for the 10 cm × 10 cm field, respectively. The 90% dose can be maintained within the central 8 cm × 8 cm, and the dose rate can be sustained at >40 Gy/s within the entire 10 cm ×10 cm at 2.3 cm depth. Figure 4f shows crossline dose rate profiles for the 1 cm circular field, where the dose rate remains >40 Gy/s up to 1.8 cm depth.

3.3. MC Beam Modeling

Through PDD modeling, we determined the optimal parameters E = 5.53 MeV and σE = 0.3 MeV, resulting in 1.23% AAD between the MC-simulated and film-measured PDDs in the open-field scenario (Figure 5a). These parameters were further validated for other field sizes, each maintaining AAD < 2%. For instance, Figure 5b demonstrates the validation case for a 1 cm circular field with 1.31% AAD, a field size commonly used in preclinical studies. PDD comparisons for other field sizes are provided in Supplementary Figure S3.
Given E = 5.53 MeV and σE = 0.3 MeV, taking σ as 0.5 mm, we determined the optimal θcone as 6.0° in the open-field setting. This value led to AAD <2% between calculated and measured profiles at depths 0–2.3 cm along both crossline and inline directions in the open-field setting (Figure S4). Figure 5c presents a representative comparison at 1.3 cm dmax with 0.84% AAD. Additionally, calculated profiles at dmax for SSDs of 95, 110, and 120 cm, as well as in-air profiles at 95 cm SSD, matched film measurements with AAD <2% (Figure S5).
We further validated the beam model by comparing the calculated and measured profiles across various depths and field sizes. Figure 5d shows the calculated crossline profile at 1.3 cm depth for a 1 cm circular field, achieving an AAD of 1.49%. Comparisons for depths 0–2.3 cm in both crossline and inline directions for 10 cm × 10 cm, 6 cm × 6 cm, and circular fields with diameters 3, 2, 1.5, and 1 cm are provided in Figures S6–S11, all maintaining AAD < 2%.

3.4. FLASH Preclinical Planning Studies

3.4.1. Mouse Whole-Brain Irradiation

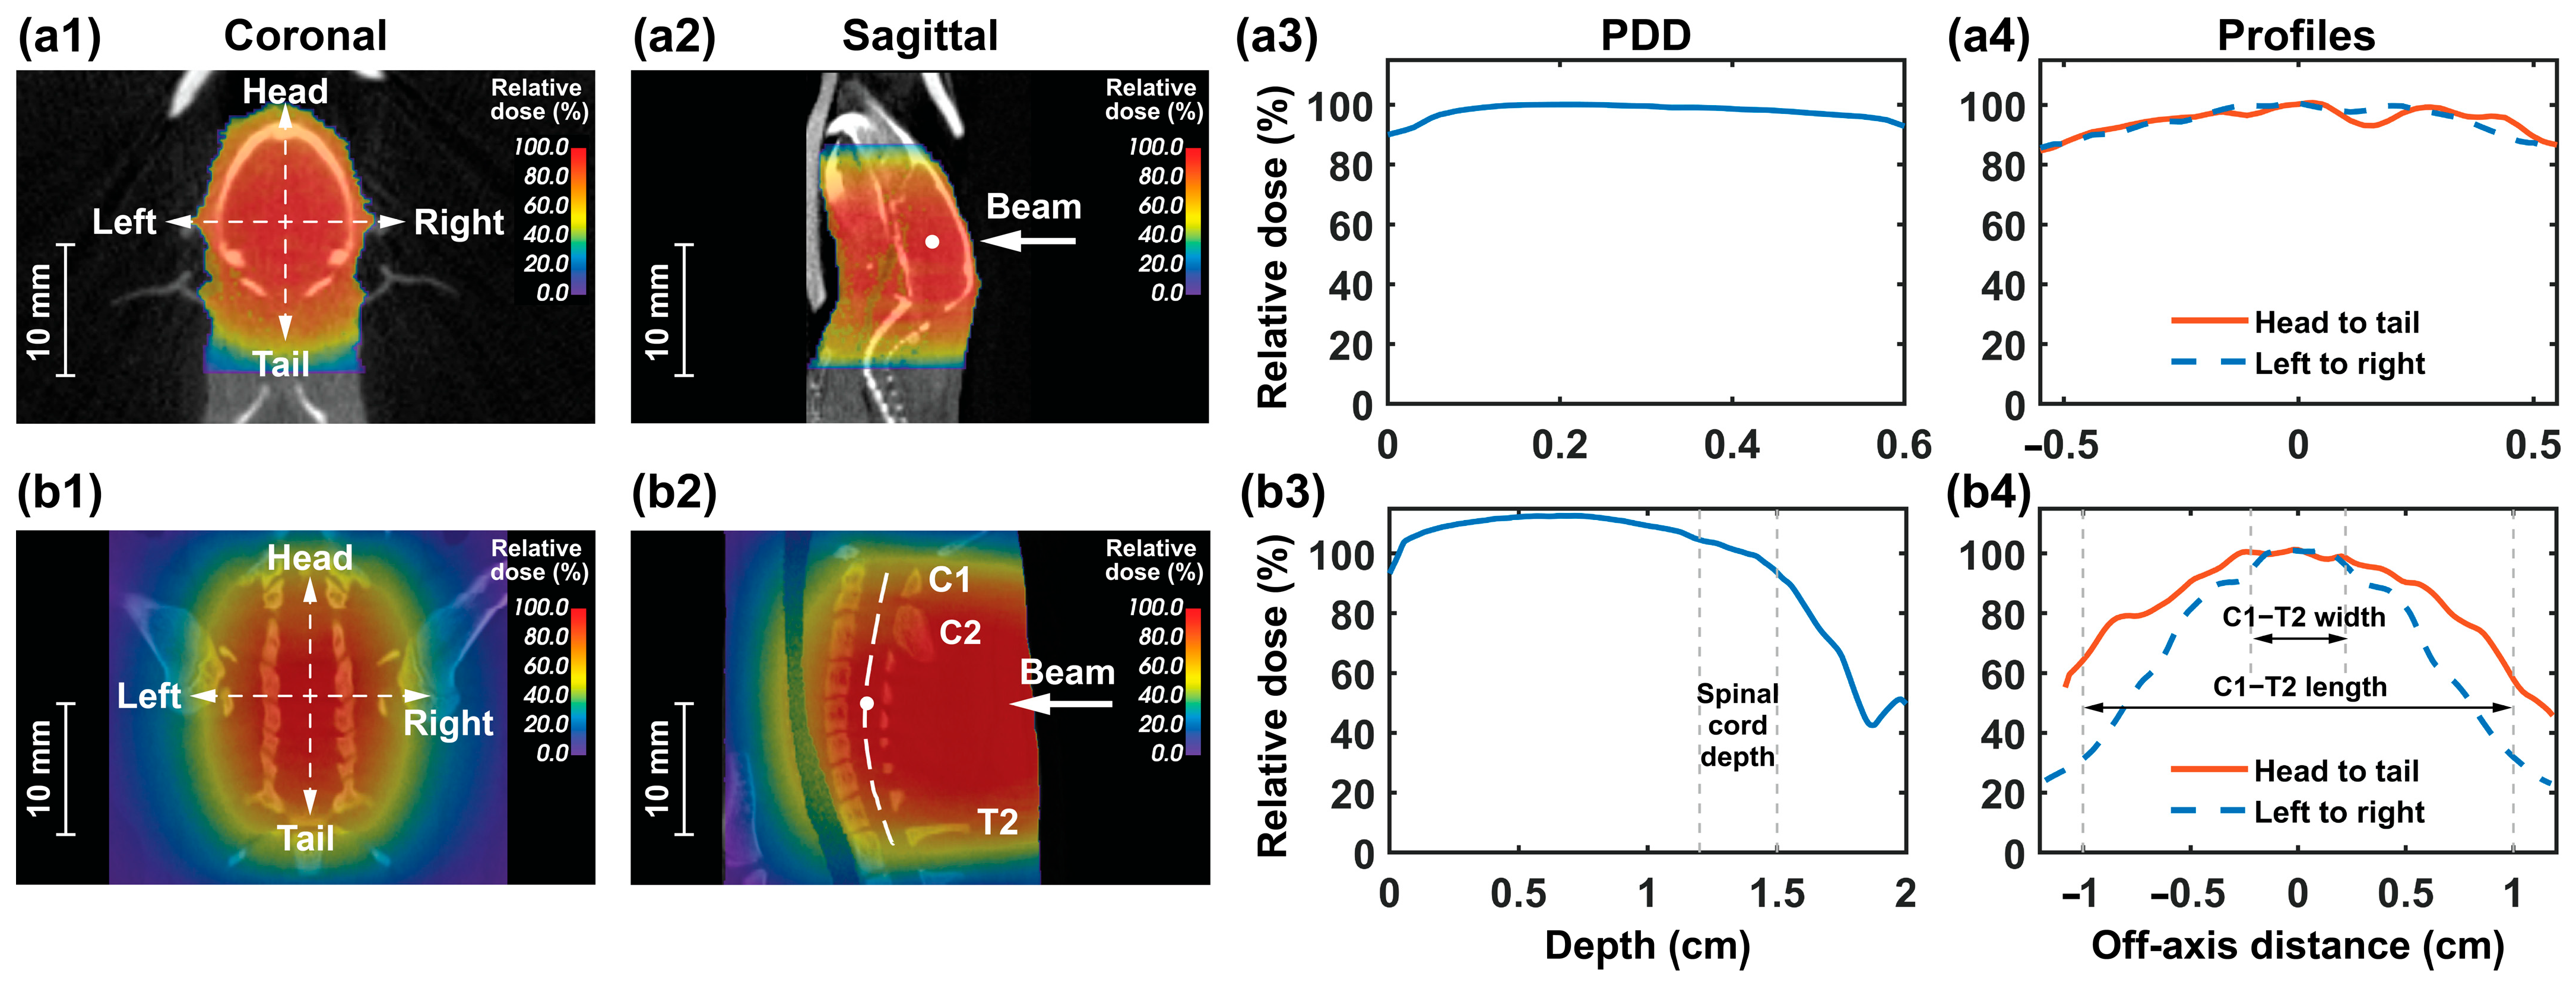
The dose distribution for the mouse whole-brain irradiation is shown in Figure 6(a1,a2). Within 0.6 cm depth, covering the thickness of the mouse brain, the PDD ranged from 90 to 100% (Figure 6(a3)). At 0.25 cm depth along the beam CAX, the middle of the brain, dose profiles maintained >87% along both left-to-right and head-to-tail directions within an off-axis distance (OAD) of −0.5 to 0.5 cm within the brain region (Figure 6(a4)). These results indicate that the 6 MeV FLASH beam with a 1.7 cm diameter circular cutout provides a uniform dose distribution for mouse whole-brain irradiation.

3.4.2. Rat Spinal Cord Irradiation

Figure 6(b1) and Figure 6(b2) show the dose distribution for rat C1−T2 spinal cord irradiation in coronal and sagittal views, respectively. The 6 MeV FLASH beam achieved a PDD > 93% within the 1.2 to 1.5 cm spinal cord depth, but the dose decreased rapidly beyond 1.5 cm (Figure 6(b3)). Across the 0.44 cm spinal cord width, the left-to-right dose profile maintained > 94%. However, the profile along the C1−T2 spinal cord (the white dashed curve in Figure 6(b2)) in the head-to-tail direction exhibited ~10% fall-off from the center to ± 0.5 cm OAD (Figure 6(b4)). This 10% fall-off along the 1 cm length may lead to a longitudinal dose-volume effect [49], which could increase the median effective dose (ED50, the dose causing paresis in 50% of rats) and potentially confound the assessment of the FLASH effect in sparing spinal cord toxicity.

3.5. Impact of AFC Optimization on FLASH Animal Studies

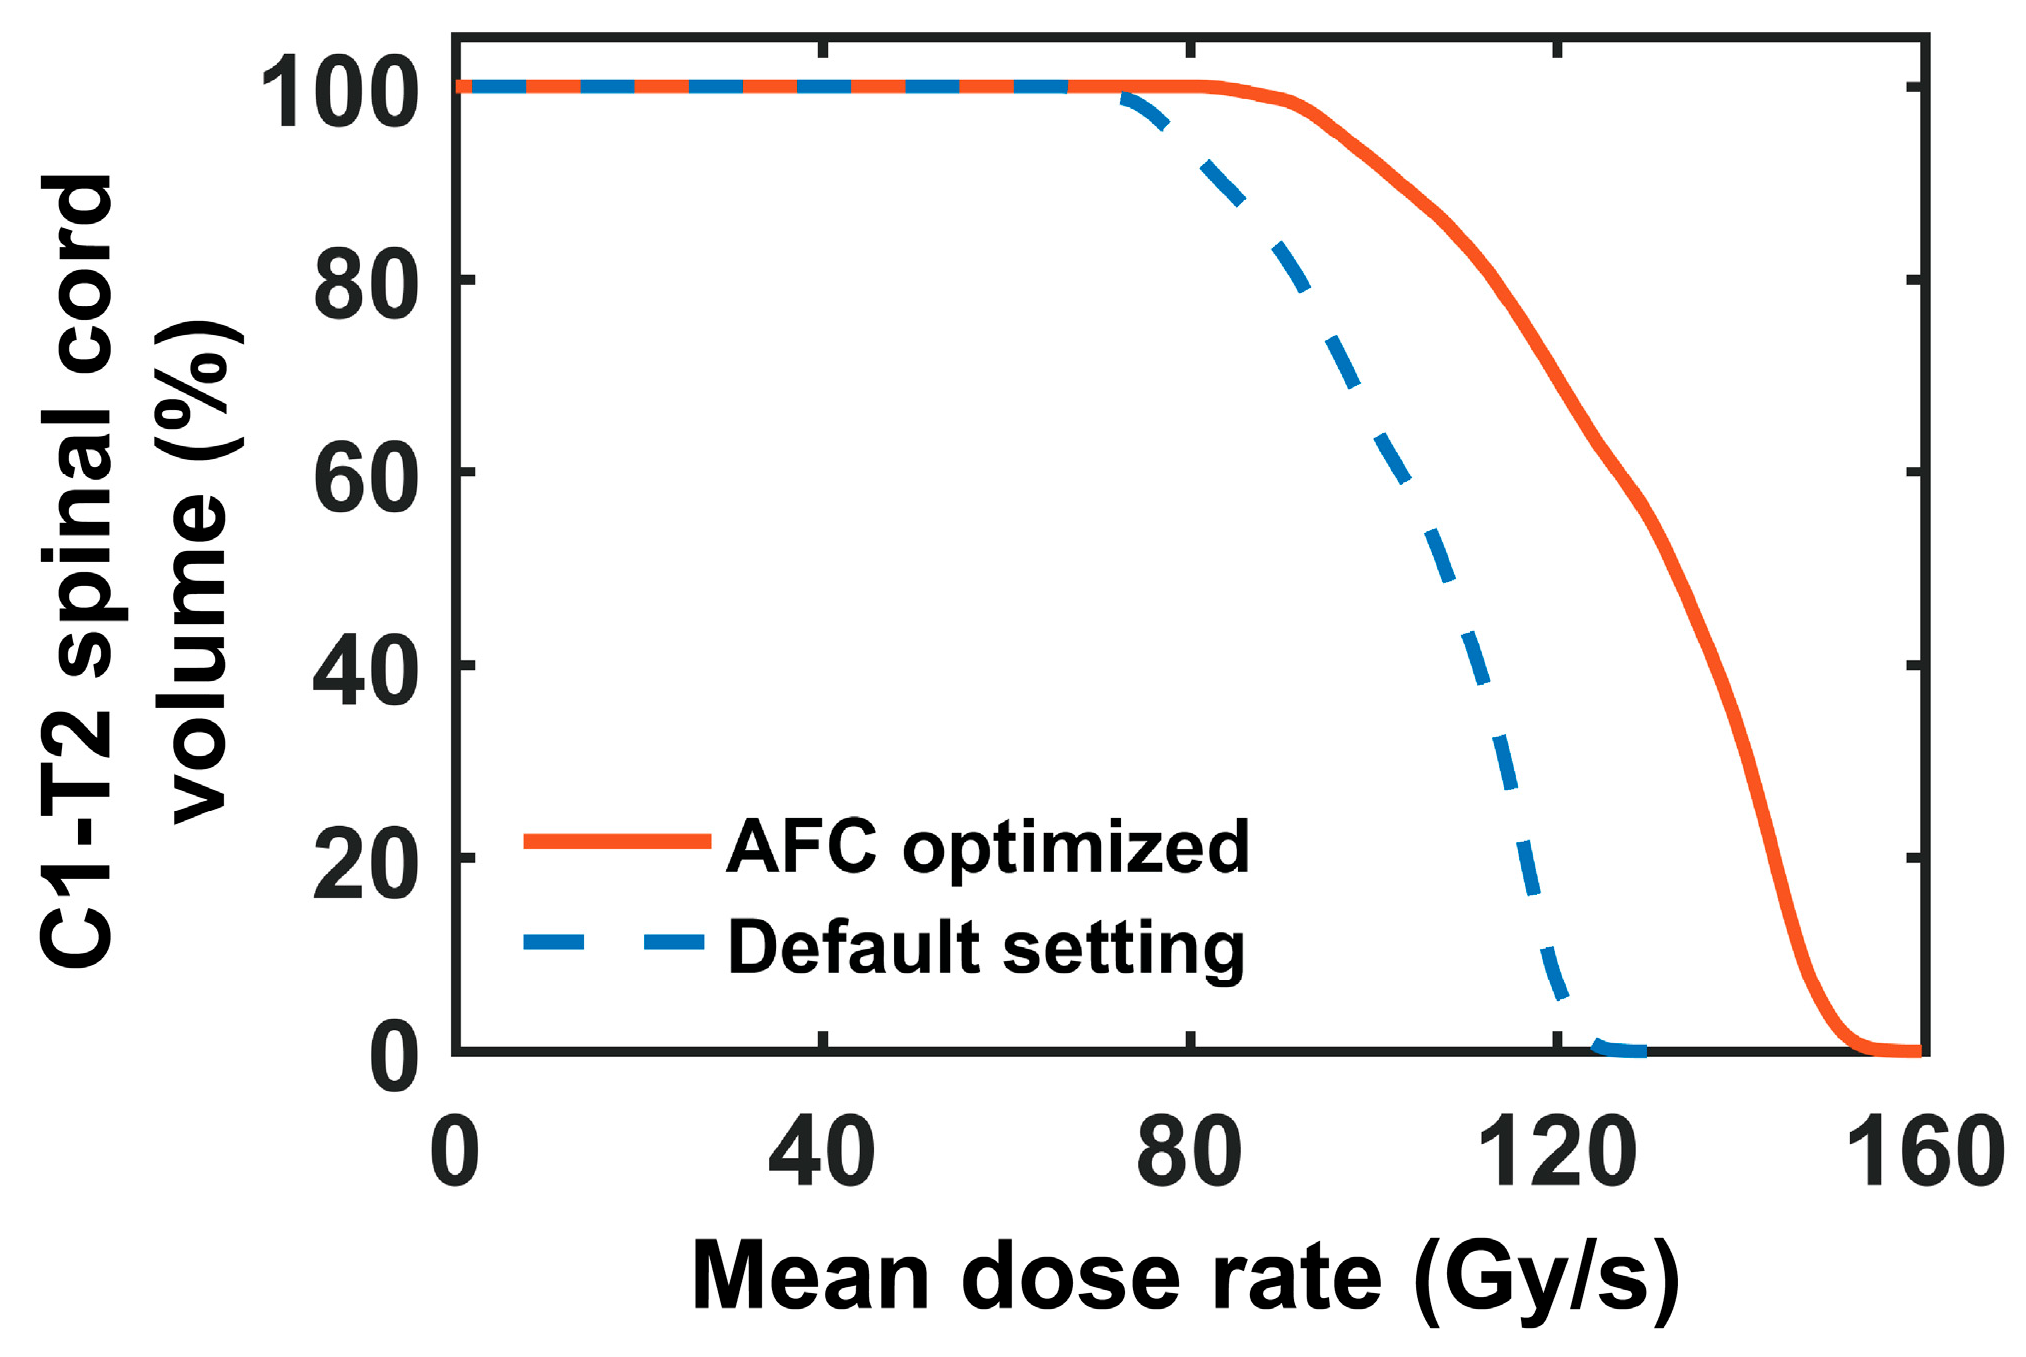
Figure 7 presents the DRVH within the C1−T2 spinal cord under AFC-optimized and default settings. Given the same prescribed dose, following AFC optimization, 50% of the C1−T2 volume received a mean dose rate of >133 Gy/s, which is 23% higher compared to the default setting. From Figure 3d, AFC optimization keeps DPP constant, while the default setting has 13 ramp-up pulses with lower DPP. To deliver the same dose, AFC optimization with constant DPP requires fewer pulses and therefore yields a higher mean dose rate. Our DRVH results further illustrate greater high dose-rate coverage with AFC optimization in the rat spinal cord, underscoring the value of AFC optimization for maintaining constant DPP and increasing mean dose rate in preclinical studies.

4. Discussion

Despite the growing interest in FLASH-RT, its underlying mechanisms remain unclear, underscoring the need for comprehensive preclinical research. LINAC-based eFLASH systems have been used for preclinical studies [1,2,3,4] and also suggested for clinical trial use [5,6,50]. However, current eFLASH platforms heavily rely on vendor support or specialized engineering expertise [18,19,22,23,24], requiring substantial funding and creating barriers for many institutions to conduct FLASH studies. The significance of this work lies in providing a detailed workflow for developing a cost-effective eFLASH platform without extensive hardware or software modifications, expanding access to FLASH research for more institutions. Taking advantage of the approach from Rahman et al. [19], our LINAC modification avoids RF power and electron gun adjustments or custom scattering foils. Pulse delivery at UHDR can be easily controlled by LINAC MU setting (Figure 3g). To complement the MU setting and offer greater flexibility, we further introduced a simplified pulse control system using the CDOS interlock pre-integrated into the LINAC. This innovation reduces the need for additional complex equipment, such as a gating switch box [18], a Beam Pulse Counter [22,23], or a proprietary firmware patch [24] from vendors. Based on the initial results, pulse control can be achieved with this approach, though occasional discrepancies of 1–3 pulses were observed (Figure 3h). To improve its accuracy, we plan to optimize the Arduino code to reduce variable delay and replace the reed relay with a fast solid-state gate.
Using the LINAC’s default AFC setting, a ramp-up period of pulse delivery was observed (Figure 3a), similar to those reported by Rahman et al. [19] and Sloop et al. [21] This resulted in unstable DPP (Figure 3d), causing mean dose rates to depend on the number of pulses (Figure 3c) and, consequently, the total dose delivered. This issue could introduce dose rate discrepancies across delivered doses, complicating the interpretation of biological outcomes. Sloop et al. [21] discussed DPP stabilization via AFC manipulation but reported a sudden DPP drop (~1.2 to 0.1 Gy/pulse) at the 16th pulse. Dal Bello et al. [24] achieved reproducible DPP using a Varian-proprietary firmware patch that automatically adjusted AFC servo operation. However, this approach may not be widely accessible due to cost and proprietary restrictions. Our method instead relies on fine-tuning AFC servo with oscilloscope, enabling straightforward in-house implementation without reliance on additional external modifications. We can maintain consistent mean dose rates and DPP (Figure 3c,d) throughout multiple pulse deliveries or dose levels. We have tested up to 96 pulses and achieved a stable DPP, delivering a total of ~58.7 Gy (Supplementary Figure S12), which is sufficient for FLASH radiation studies.
To further illustrate the impact of AFC optimization on animal studies, we assessed the DRVH for rat spinal cord irradiation. Given the same prescribed dose, AFC optimization increased the mean dose rate by 23% (Figure 7) for 50% of the C1−T2 volume. These results indicate that with AFC optimization, we can achieve the dose rate exceeding the 40 Gy/s FLASH threshold at greater depths and larger OADs. Moreover, this dose rate increase is more pronounced in low-pulse-number deliveries, where ramp-up pulses constitute a larger proportion of the total pulse count and thus, total dose. Our results highlight the importance of AFC optimization in maintaining a consistent DPP and mean dose rate, which is essential for study reproducibility.
In vivo dose and dose rate inhomogeneities are not addressed enough in FLASH studies. It has been recommended to report dose distributions and DRVHs to support FLASH research reproducibility [51]. This highlights the importance of utilizing an MC dose engine for the eFLASH platform to generate accurate treatment plans. The pulse optimization study using the spinal cord demonstrates (Figure 7) the need for an accurate treatment planning system to assess in vivo dose rate distributions.
We further demonstrated the capabilities of the MC engine in assessing in vivo dose distribution for FLASH studies. Mouse whole-brain irradiation has been commonly utilized to study the FLASH effect on spatial memory [25], microvasculature integrity [26], reactive gliosis [27] and neuroprotection [28]. Our results demonstrated that the 6 MeV FLASH beam, using a setup similar to Montay-Gruel et al. [25], provides a uniform dose distribution to the mouse brain.
Most preclinical evidence supporting the FLASH effect focuses on acute toxicity, with limited data on late-responding tissues. Understanding whether FLASH can mitigate late toxicity is essential for clinical translation. The spinal cord, a critical organ at risk in RT, has a steep dose–response relationship, making it an ideal model to assess whether FLASH increases its dose tolerance and mitigates late toxicity [29]. Rats are widely used in spinal cord toxicity studies at CONV dose rates and exhibit radiation-induced paresis similar to humans [52], making the rat spinal cord suitable for the study. Bijl et al. [49] showed that when the irradiated spinal cord length was <0.8 cm, ED50 for paresis increased dramatically with decreasing length, known as the dose-volume effect. In our study, 6 MeV FLASH irradiation resulted in a 10% dose fall-off across the central 1 cm spinal cord segment (Figure 6(b4)). This could introduce longitudinal dose-volume effects, potentially confounding the FLASH effect interpretation. To achieve enhanced dose uniformity, higher-energy electrons can be employed (e.g., 18 MeV, Supplementary Figure S13), which can be readily implemented following our presented workflow. This planning study underscores the need for an accurate dose engine to inform in vivo dose inhomogeneities in eFLASH studies, supporting both study design and outcome interpretation.
One limitation of the current MC dose engine is its relatively long calculation time, which can take hours compared to the minutes achieved by commercial treatment planning systems. Computational speed can be further improved by implementing multithreading calculation or GPU acceleration. However, computational time is not a critical concern for preclinical studies, as individualized treatment planning for each animal is generally unnecessary due to similar size and age of animals are commonly used.
Our work provides a detailed workflow for establishing a LINAC-based 6 MeV eFLASH platform without requiring proprietary hardware or software. This configuration directly supports superficial UHDR irradiation, consistent with human trials that have employed 5.6 MeV beams for cutaneous malignancies [5,6]. Importantly, the same workflow can readily extend to higher energies, which increases penetration for deeper targets and satisfy larger-animal studies. For example, 18 MeV can be implemented with minimal adjustments of the energy switch position, as shown by preliminary commissioning data in Supplementary Figure S13. We have investigated the feasibility of using our 18 MeV beam for rat spinal cord irradiation to assess whether FLASH spare late-responding tissues, a critical step toward clinical translation [53,54]. By lowering the proprietary barrier to establishing eFLASH with minimal hardware or software changes, this work enables broader access to FLASH platforms and accelerate future preclinical studies of mechanisms, fractionation, and late toxicities to determine clinical applicability of FLASH-RT.

5. Conclusions

We present a cost-effective approach to developing a LINAC-based eFLASH platform, without extensive hardware or software modifications, while ensuring accurate dose delivery. By optimizing AFC settings, we achieved stable pulse delivery and consistent mean dose rates, addressing key challenges in FLASH research. The MC dose engine demonstrated its capability in assessing in vivo dose distributions, supporting study reproducibility and planning accuracy. We thus provide a scalable framework for expanding access to high-precision FLASH studies.

Supplementary Materials

The following supporting information can be downloaded at: https://www.mdpi.com/article/10.3390/radiation5040033/s1, Table S1. Beam characteristics of the 6 MeV FLASH measured on solid water surface at 100 cm SSD for various field sizes; Table S2. The dmax, corresponding dose rate, and output factor of the 6 MeV FLASH beam for a given field size. Figure S1. (a) The waveform of a single pulse measured by the PMT-fiber monitoring unit. (b) Total AUC of all pulses vs. total delivered dose for two types of AUC calculation. Figure S2. In-air profiles at 95 cm SSD of the 6 MeV CONV and FLASH beams. Figure S3. MC-simulated PDD vs. film-measured PDD at 100 cm SSD for the field sizes of (a) 10 cm × 10 cm, (b) 6 cm × 6 cm, as well as circular fields with diameters of (c) 3 cm (d) 2 cm, and (e) 1.5 cm. Figure S4. MC-computed profiles compared to those of film measurements in the open-field setting at 100 cm SSD at surface, and depths of 0.8, 1.3, 1.8, and 2.3 cm in (a) crossline and (b) inline directions. Figure S5. MC-computed crossline and inline profiles compared to those of film measurements in the open-field setting for (a) in-air profiles at 95 cm SSD, and profiles at 1.3 cm depth at SSDs of (b) 95, (c) 110, and (d) 120 cm. Figures S6−S11. MC-computed profiles compared to those of film measurements at 100 cm SSD at surface, and depths of 0.8, 1.3, 1.8, and 2.3 cm in (a) crossline and (b) inline directions under field sizes of 10 cm × 10 cm, 6 cm × 6 cm, and circular fields with diameters of 3, 2, 1.5, and 1 cm, respectively. Figure S12. DPP of each pulse in a 96-pulse delivery with AFC optimization. Figure S13. Representative beam data of the 18 MeV FLASH beam in solid water at 100 cm SSD: (a) shows the Fermi–Dirac fitted PDDs for field sizes of 10 cm × 10 cm, 6 cm × 6 cm, and 2 cm × 1 cm; (b) shows the crossline and inline profiles at 1 cm depth for the 2 cm × 1 cm field size.

Author Contributions

Conceptualization, B.Z., L.G., and K.K.-H.W.; methodology, B.Z., L.G., M.R., W.L., R.Z., V.A.C., Y.K.P., S.S., M.G. and K.K.-H.W.; software and data acquisition, B.Z. and L.G.; writing—original draft preparation, B.Z.; writing—review and editing, B.Z., L.G., W.L., S.S. and K.K.-H.W. All authors have read and agreed to the published version of the manuscript.

Funding

This research was funded by Cancer Prevention and Research Institute of Texas, RR200042.

Institutional Review Board Statement

Not applicable.

Informed Consent Statement

Not applicable.

Data Availability Statement

The data presented in this study are available on request from the corresponding author.

Acknowledgments

We would like to thank our previous engineer Richard Lamphier for his technical support for LINAC.

Conflicts of Interest

The authors declare no conflicts of interest.

Abbreviations

AFCautomatic frequency control
AUCarea under the curve
AADaverage absolute difference
CDOScustomer-defined dosimetry interlock
CAXcentral axis
CTcomputed tomography
CBCTcone beam computed tomography
CONVconventional
CVcoefficient of variation
C1-T2cervical 1 to thoracic 2
dmaxthe depth of maximum dose
DPPdose per pulse
DRVHdose-rate volume histogram
eFLASHelectron FLASH
ED50 median effective dose
FLASH-RTFLASH radiotherapy
GAMOS Geant4-based architecture for medicine-oriented simulations
IDRinstantaneous dose rate
LINAClinear accelerators
MCMonte Carlo
MUmonitor unit
OSLDoptically stimulated luminescence dosimeters
OADoff-axis distance
PAposterior–anterior
PETpositron emission tomography
PCBprinted circuit board
PDDpercentage depth dose
PSphase-space
PMTphotomultiplier tube
PRFpulse repetition frequency
RTUremote trigger unit
RFradiofrequency
SSDsource-to-surface distance
SARRPsmall animal radiation research platform
UHDRultra-high dose rate

References

  1. Favaudon, V.; Caplier, L.; Monceau, V.; Pouzoulet, F.; Sayarath, M.; Fouillade, C.; Poupon, M.-F.; Brito, I.; Hupé, P.; Bourhis, J.; et al. Ultrahigh dose-rate FLASH irradiation increases the differential response between normal and tumor tissue in mice. Sci. Transl. Med. 2014, 6, 245ra93. [Google Scholar] [CrossRef]
  2. Schüler, E.; Acharya, M.; Montay-Gruel, P.; Loo, B.W.; Vozenin, M.; Maxim, P.G. Ultra-high dose rate electron beams and the FLASH effect: From preclinical evidence to a new radiotherapy paradigm. Med. Phys. 2022, 49, 2082–2095. [Google Scholar] [CrossRef]
  3. Gao, Y.; Liu, R.; Chang, C.; Charyyev, S.; Zhou, J.; Bradley, J.D.; Liu, T.; Yang, X. A potential revolution in cancer treatment: A topical review of FLASH radiotherapy. J. Appl. Clin. Med. Phys. 2022, 23, e13790. [Google Scholar] [CrossRef]
  4. Giannini, N.; Gadducci, G.; Fuentes, T.; Gonnelli, A.; Di Martino, F.; Puccini, P.; Naso, M.; Pasqualetti, F.; Capaccioli, S.; Paiar, F. Electron FLASH radiotherapy in vivo studies. A systematic review. Front. Oncol. 2024, 14, 1373453. [Google Scholar] [CrossRef]
  5. Bourhis, J.; Sozzi, W.J.; Jorge, P.G.; Gaide, O.; Bailat, C.; Duclos, F.; Patin, D.; Ozsahin, M.; Bochud, F.; Germond, J.-F.; et al. Treatment of a first patient with FLASH-radiotherapy. Radiother. Oncol. 2019, 139, 18–22. [Google Scholar] [CrossRef] [PubMed]
  6. Gaide, O.; Herrera, F.; Sozzi, W.J.; Jorge, P.G.; Kinj, R.; Bailat, C.; Duclos, F.; Bochud, F.; Germond, J.-F.; Gondré, M.; et al. Comparison of ultra-high versus conventional dose rate radiotherapy in a patient with cutaneous lymphoma. Radiother. Oncol. 2022, 174, 87–91. [Google Scholar] [CrossRef] [PubMed]
  7. Cecchi, D.D.; Therriault-Proulx, F.; Lambert-Girard, S.; Hart, A.; Macdonald, A.; Pfleger, M.; Lenckowski, M.; Bazalova-Carter, M. Characterization of an x-ray tube-based ultrahigh dose-rate system for in vitro irradiations. Med. Phys. 2021, 48, 7399–7409. [Google Scholar] [CrossRef] [PubMed]
  8. Rezaee, M.; Iordachita, I.; Wong, J.W. Ultrahigh dose-rate (FLASH) x-ray irradiator for pre-clinical laboratory research. Phys. Med. Biol. 2021, 66, 095006. [Google Scholar] [CrossRef]
  9. Miles, D.; Sforza, D.; Wong, J.; Rezaee, M. Dosimetric characterization of a rotating anode x-ray tube for FLASH radiotherapy research. Med. Phys. 2023, 51, 1474–1483. [Google Scholar] [CrossRef]
  10. Gao, F.; Yang, Y.; Zhu, H.; Wang, J.; Xiao, D.; Zhou, Z.; Dai, T.; Zhang, Y.; Feng, G.; Li, J.; et al. First demonstration of the FLASH effect with ultrahigh dose rate high-energy X-rays. Radiother. Oncol. 2022, 166, 44–50. [Google Scholar] [CrossRef]
  11. Patriarca, A.; Fouillade, C.; Auger, M.; Martin, F.; Pouzoulet, F.; Nauraye, C.; Heinrich, S.; Favaudon, V.; Meyroneinc, S.; Dendale, R.; et al. Experimental Set-up for FLASH Proton Irradiation of Small Animals Using a Clinical System. Int. J. Radiat. Oncol. 2018, 102, 619–626. [Google Scholar] [CrossRef]
  12. Darafsheh, A.; Hao, Y.; Zwart, T.; Wagner, M.; Catanzano, D.; Williamson, J.F.; Knutson, N.; Sun, B.; Mutic, S.; Zhao, T. Feasibility of proton FLASH irradiation using a synchrocyclotron for preclinical studies. Med. Phys. 2020, 47, 4348–4355. [Google Scholar] [CrossRef]
  13. Diffenderfer, E.S.; Verginadis, I.I.; Kim, M.M.; Shoniyozov, K.; Velalopoulou, A.; Goia, D.; Putt, M.; Hagan, S.; Avery, S.; Teo, K.; et al. Design, Implementation, and in Vivo Validation of a Novel Proton FLASH Radiation Therapy System. Int. J. Radiat. Oncol. 2020, 106, 440–448. [Google Scholar] [CrossRef]
  14. Zhang, Q.; Cascio, E.; Li, C.; Yang, Q.; Gerweck, L.E.; Huang, P.; Gottschalk, B.; Flanz, J.; Schuemann, J. FLASH Investigations Using Protons: Design of Delivery System, Preclinical Setup and Confirmation of FLASH Effect with Protons in Animal Systems. Radiat. Res. 2020, 194, 656–664. [Google Scholar] [CrossRef]
  15. Weber, U.A.; Scifoni, E.; Durante, M. FLASH radiotherapy with carbon ion beams. Med. Phys. 2021, 49, 1974–1992. [Google Scholar] [CrossRef]
  16. Lempart, M.; Blad, B.; Adrian, G.; Bäck, S.; Knöös, T.; Ceberg, C.; Petersson, K. Modifying a clinical linear accelerator for delivery of ultra-high dose rate irradiation. Radiother. Oncol. 2019, 139, 40–45. [Google Scholar] [CrossRef] [PubMed]
  17. Xie, D.; Li, Y.; Ma, S.; Yang, X.; Lan, R.; Chen, A.; Zhu, H.; Mei, Y.; Peng, L.; Li, Z.; et al. Electron ultra-high dose rate FLASH irradiation study using a clinical linac: Linac modification, dosimetry, and radiobiological outcome. Med. Phys. 2022, 49, 6728–6738. [Google Scholar] [CrossRef] [PubMed]
  18. Schüler, E.; Trovati, S.; King, G.; Lartey, F.; Rafat, M.; Villegas, M.; Praxel, A.J.; Loo, B.W.; Maxim, P.G. Experimental Platform for Ultra-high Dose Rate FLASH Irradiation of Small Animals Using a Clinical Linear Accelerator. Int. J. Radiat. Oncol. 2017, 97, 195–203. [Google Scholar] [CrossRef] [PubMed]
  19. Rahman, M.; Ashraf, M.R.; Zhang, R.; Bruza, P.; Dexter, C.A.; Thompson, L.; Cao, X.; Williams, B.B.; Hoopes, P.J.; Pogue, B.W.; et al. Electron FLASH Delivery at Treatment Room Isocenter for Efficient Reversible Conversion of a Clinical LINAC. Int. J. Radiat. Oncol. 2021, 110, 872–882. [Google Scholar] [CrossRef]
  20. Byrne, K.E.; Poirier, Y.; Xu, J.; Gerry, A.; Foley, M.J.; Jackson, I.L.; Sawant, A.; Jiang, K. Technical note: A small animal irradiation platform for investigating the dependence of the FLASH effect on electron beam parameters. Med. Phys. 2024, 51, 1421–1432. [Google Scholar] [CrossRef]
  21. Sloop, A.; Ashraf, M.R.; Rahman, M.; Sunnerberg, J.; Dexter, C.A.; Thompson, L.; Gladstone, D.J.; Pogue, B.W.; Bruza, P.; Zhang, R. Rapid Switching of a C-Series Linear Accelerator Between Conventional and Ultrahigh-Dose-Rate Research Mode With Beamline Modifications and Output Stabilization. Int. J. Radiat. Oncol. 2024, 119, 1317–1325. [Google Scholar] [CrossRef]
  22. Oh, K.; Gallagher, K.J.; Hyun, M.; Schott, D.; Wisnoskie, S.; Lei, Y.; Hendley, S.; Wong, J.; Wang, S.; Graff, B.; et al. Initial experience with an electron FLASH research extension (FLEX) for the Clinac system. J. Appl. Clin. Med. Phys. 2023, 25, e14159. [Google Scholar] [CrossRef]
  23. Cetnar, A.J.; Jain, S.; Gupta, N.; Chakravarti, A. Technical note: Commissioning of a linear accelerator producing ultra-high dose rate electrons. Med. Phys. 2023, 51, 1415–1420. [Google Scholar] [CrossRef] [PubMed]
  24. Bello, R.D.; von der Grün, J.; Fabiano, S.; Rudolf, T.; Saltybaeva, N.; Stark, L.S.; Ahmed; Bathula, M.; Dogan, S.K.; McNeur, J.; et al. Enabling ultra-high dose rate electron beams at a clinical linear accelerator for isocentric treatments. Radiother. Oncol. 2023, 187, 109822. [Google Scholar] [CrossRef]
  25. Montay-Gruel, P.; Petersson, K.; Jaccard, M.; Boivin, G.; Germond, J.-F.; Petit, B.; Doenlen, R.; Favaudon, V.; Bochud, F.; Bailat, C.; et al. Irradiation in a flash: Unique sparing of memory in mice after whole brain irradiation with dose rates above 100 Gy/s. Radiother. Oncol. 2017, 124, 365–369. [Google Scholar] [CrossRef]
  26. Allen, B.D.; Acharya, M.M.; Montay-Gruel, P.; Jorge, P.G.; Bailat, C.; Petit, B.; Vozenin, M.-C.; Limoli, C. Maintenance of Tight Junction Integrity in the Absence of Vascular Dilation in the Brain of Mice Exposed to Ultra-High-Dose-Rate FLASH Irradiation. Radiat. Res. 2020, 194, 625–635. [Google Scholar] [CrossRef]
  27. Montay-Gruel, P.; Markarian, M.; Allen, B.D.; Baddour, J.D.; Giedzinski, E.; Jorge, P.G.; Petit, B.; Bailat, C.; Vozenin, M.-C.; Limoli, C.; et al. Ultra-High-Dose-Rate FLASH Irradiation Limits Reactive Gliosis in the Brain. Radiat. Res. 2020, 194, 636–645. [Google Scholar] [CrossRef]
  28. Alaghband, Y.; Cheeks, S.N.; Allen, B.D.; Montay-Gruel, P.; Doan, N.-L.; Petit, B.; Jorge, P.G.; Giedzinski, E.; Acharya, M.M.; Vozenin, M.-C.; et al. Neuroprotection of Radiosensitive Juvenile Mice by Ultra-High Dose Rate FLASH Irradiation. Cancers 2020, 12, 1671. [Google Scholar] [CrossRef]
  29. Ursino, S.; Gadducci, G.; Giannini, N.; Gonnelli, A.; Fuentes, T.; Di Martino, F.; Paiar, F. New insights on clinical perspectives of FLASH radiotherapy: From low- to very high electron energy. Front. Oncol. 2023, 13, 1254601. [Google Scholar] [CrossRef] [PubMed]
  30. Ashraf, M.R.; Rahman, M.; Zhang, R.; Williams, B.B.; Gladstone, D.J.; Pogue, B.W.; Bruza, P. Dosimetry for FLASH Radiotherapy: A Review of Tools and the Role of Radioluminescence and Cherenkov Emission. Front. Phys. 2020, 8, 328. [Google Scholar] [CrossRef]
  31. Greene, D.; Williams, P. Linear Accelerators for Radiation Therapy; Taylor & Francis: London, UK, 2017. [Google Scholar]
  32. Karsch, L.; Beyreuther, E.; Burris-Mog, T.; Kraft, S.; Richter, C.; Zeil, K.; Pawelke, J. Dose rate dependence for different dosimeters and detectors: TLD, OSL, EBT films, and diamond detectors. Med. Phys. 2012, 39, 2447–2455. [Google Scholar] [CrossRef]
  33. Jaccard, M.; Petersson, K.; Buchillier, T.; Germond, J.; Durán, M.T.; Vozenin, M.; Bourhis, J.; Bochud, F.O.; Bailat, C. High dose-per-pulse electron beam dosimetry: Usability and dose-rate independence of EBT3 Gafchromic films. Med. Phys. 2017, 44, 725–735. [Google Scholar] [CrossRef] [PubMed]
  34. Villoing, D.; Koumeir, C.; Bongrand, A.; Guertin, A.; Haddad, F.; Métivier, V.; Poirier, F.; Potiron, V.; Servagent, N.; Supiot, S.; et al. Technical note: Proton beam dosimetry at ultra-high dose rates (FLASH): Evaluation of GAFchromic™ (EBT3, EBT-XD) and OrthoChromic (OC-1) film performances. Med. Phys. 2022, 49, 2732–2745. [Google Scholar] [CrossRef]
  35. Micke, A.; Lewis, D.F.; Yu, X. Multichannel film dosimetry with nonuniformity correction. Med. Phys. 2011, 38, 2523–2534. [Google Scholar] [CrossRef]
  36. Christensen, J.B.; Togno, M.; Nesteruk, K.P.; Psoroulas, S.; Meer, D.; Weber, D.C.; Lomax, A.J.; Yukihara, E.G.; Safai, S. Al2O3:C optically stimulated luminescence dosimeters (OSLDs) for ultra-high dose rate proton dosimetry. Phys. Med. Biol. 2021, 66, 085003. [Google Scholar] [CrossRef]
  37. Liu, K.; Velasquez, B.; Schüler, E. Technical note: High-dose and ultra-high dose rate (UHDR) evaluation of Al2O3:C optically stimulated luminescent dosimeter nanoDots and powdered LiF:Mg,Ti thermoluminescent dosimeters for radiation therapy applications. Med. Phys. 2023, 51, 2311–2319. [Google Scholar] [CrossRef]
  38. Motta, S.; Bello, R.D.; Christensen, J.B.; Bossin, L.; Yukihara, E.G. Dosimetry of ultra-high dose rate electron beams using thermoluminescence and optically stimulated luminescence detectors. Phys. Med. Biol. 2024, 69, 035022. [Google Scholar] [CrossRef] [PubMed]
  39. Kry, S.F.; Alvarez, P.; Cygler, J.E.; DeWerd, L.A.; Howell, R.M.; Meeks, S.; O’Daniel, J.; Reft, C.; Sawakuchi, G.; Yukihara, E.G.; et al. AAPM TG 191: Clinical use of luminescent dosimeters: TLDs and OSLDs. Med. Phys. 2019, 47, E19–E51. [Google Scholar] [CrossRef] [PubMed]
  40. Meigooni, A.S.; Das, I.J. Parametrisation of depth dose for electron beams. Phys. Med. Biol. 1987, 32, 761–768. [Google Scholar] [CrossRef]
  41. Jiang, S.B.; Kapur, A.; Ma, C. Electron beam modeling and commissioning for Monte Carlo treatment planning. Med. Phys. 2000, 27, 180–191. [Google Scholar] [CrossRef]
  42. Arce, P.; Lagares, J.I.; Harkness, L.; Pérez-Astudillo, D.; Cañadas, M.; Rato, P.; de Prado, M.; Abreu, Y.; de Lorenzo, G.; Kolstein, M.; et al. Gamos: A framework to do Geant4 simulations in different physics fields with an user-friendly interface. Nucl. Instruments Methods Phys. Res. Sect. A Accel. Spectrometers Detect. Assoc. Equip. 2014, 735, 304–313. [Google Scholar] [CrossRef]
  43. Ma, C.M.C.; Chetty, I.J.; Deng, J.; Faddegon, B.; Jiang, S.B.; Li, J.; Seuntjens, J.; Siebers, J.V.; Traneus, E. Beam modeling and beam model commissioning for Monte Carlo dose calculation-based radiation therapy treatment planning: Report of AAPM Task Group 157. Med. Phys. 2019, 47, E1–E18. [Google Scholar] [CrossRef]
  44. Rahman, M.; Ashraf, M.R.; Gladstone, D.J.; Bruza, P.; Jarvis, L.A.; Schaner, P.E.; Cao, X.; Pogue, B.W.; Hoopes, P.J.; Zhang, R. Treatment Planning System for Electron FLASH Radiation Therapy: Open-Source for Clinical Implementation. Int. J. Radiat. Oncol. 2022, 112, 1023–1032. [Google Scholar] [CrossRef] [PubMed]
  45. Schreiber, E.C.; A Faddegon, B. Sensitivity of large-field electron beams to variations in a Monte Carlo accelerator model. Phys. Med. Biol. 2005, 50, 769–778. [Google Scholar] [CrossRef]
  46. A Faddegon, B.; Perl, J.; Asai, M. Monte Carlo simulation of large electron fields. Phys. Med. Biol. 2008, 53, 1497–1510. [Google Scholar] [CrossRef]
  47. EL Bakkali, J.; EL Bardouni, T. Validation of Monte Carlo Geant4 code for a 6 MV Varian linac. J. King Saud Univ.-Sci. 2017, 29, 106–113. [Google Scholar] [CrossRef]
  48. Böhlen, T.T.; Germond, J.-F.; Bourhis, J.; Vozenin, M.-C.; Ozsahin, E.M.; Bochud, F.; Bailat, C.; Moeckli, R. Normal Tissue Sparing by FLASH as a Function of Single-Fraction Dose: A Quantitative Analysis. Int. J. Radiat. Oncol. 2022, 114, 1032–1044. [Google Scholar] [CrossRef]
  49. Bijl, H.P.; van Luijk, P.; Coppes, R.P.; Schippers, J.M.; Konings, A.W.; van der Kogel, A.J. Dose-volume effects in the rat cervical spinal cord after proton irradiation. Int. J. Radiat. Oncol. 2002, 52, 205–211. [Google Scholar] [CrossRef]
  50. No, H.J.; Wu, Y.; Dworkin, M.L.; Manjappa, R.; Skinner, L.; Ashraf, M.R.; Lau, B.; Melemenidis, S.; Viswanathan, V.; Yu, A.S.-J.; et al. Clinical Linear Accelerator-Based Electron FLASH: Pathway for Practical Translation to FLASH Clinical Trials. Int. J. Radiat. Oncol. 2023, 117, 482–492. [Google Scholar] [CrossRef]
  51. Böhlen, T.T.; Psoroulas, S.; Aylward, J.D.; Beddar, S.; Douralis, A.; Delpon, G.; Garibaldi, C.; Gasparini, A.; Schüler, E.; Stephan, F.; et al. Recording and reporting of ultra-high dose rate “FLASH” delivery for preclinical and clinical settings. Radiother. Oncol. 2024, 200, 110507. [Google Scholar] [CrossRef]
  52. Kjell, J.; Olson, L. Rat models of spinal cord injury: From pathology to potential therapies. Dis. Model. Mech. 2016, 9, 1125–1137. [Google Scholar] [CrossRef] [PubMed]
  53. Zhou, B.; Guo, L.; van der Kogel, A.; Wong, J.W.; Iordachita, I.; Zhang, R.; Chirayath, V.A.; Timmerman, R.; Lu, W.; Ahn, C.; et al. Establish a Flash Research Platform Optimized for Rat Spinal Cord Study. In Proceedings of the AAPM 66th Annual Meeting & Exhibition, AAPM, Los Angeles, CA, USA, 21–25 July 2024. [Google Scholar]
  54. Zhou, B.; Guo, L.; Tsai, Y.-C.; van der Kogel, A.; Wong, J.; Iordachita, I.; Zhang, R.; Chirayath, V.A.; Timmerman, R.; Lu, W.; et al. Abstract 1820: Investigating whether FLASH radiotherapy spares late-responding organs using a rat spinal cord model. Cancer Res. 2025, 85, 1820. [Google Scholar] [CrossRef]
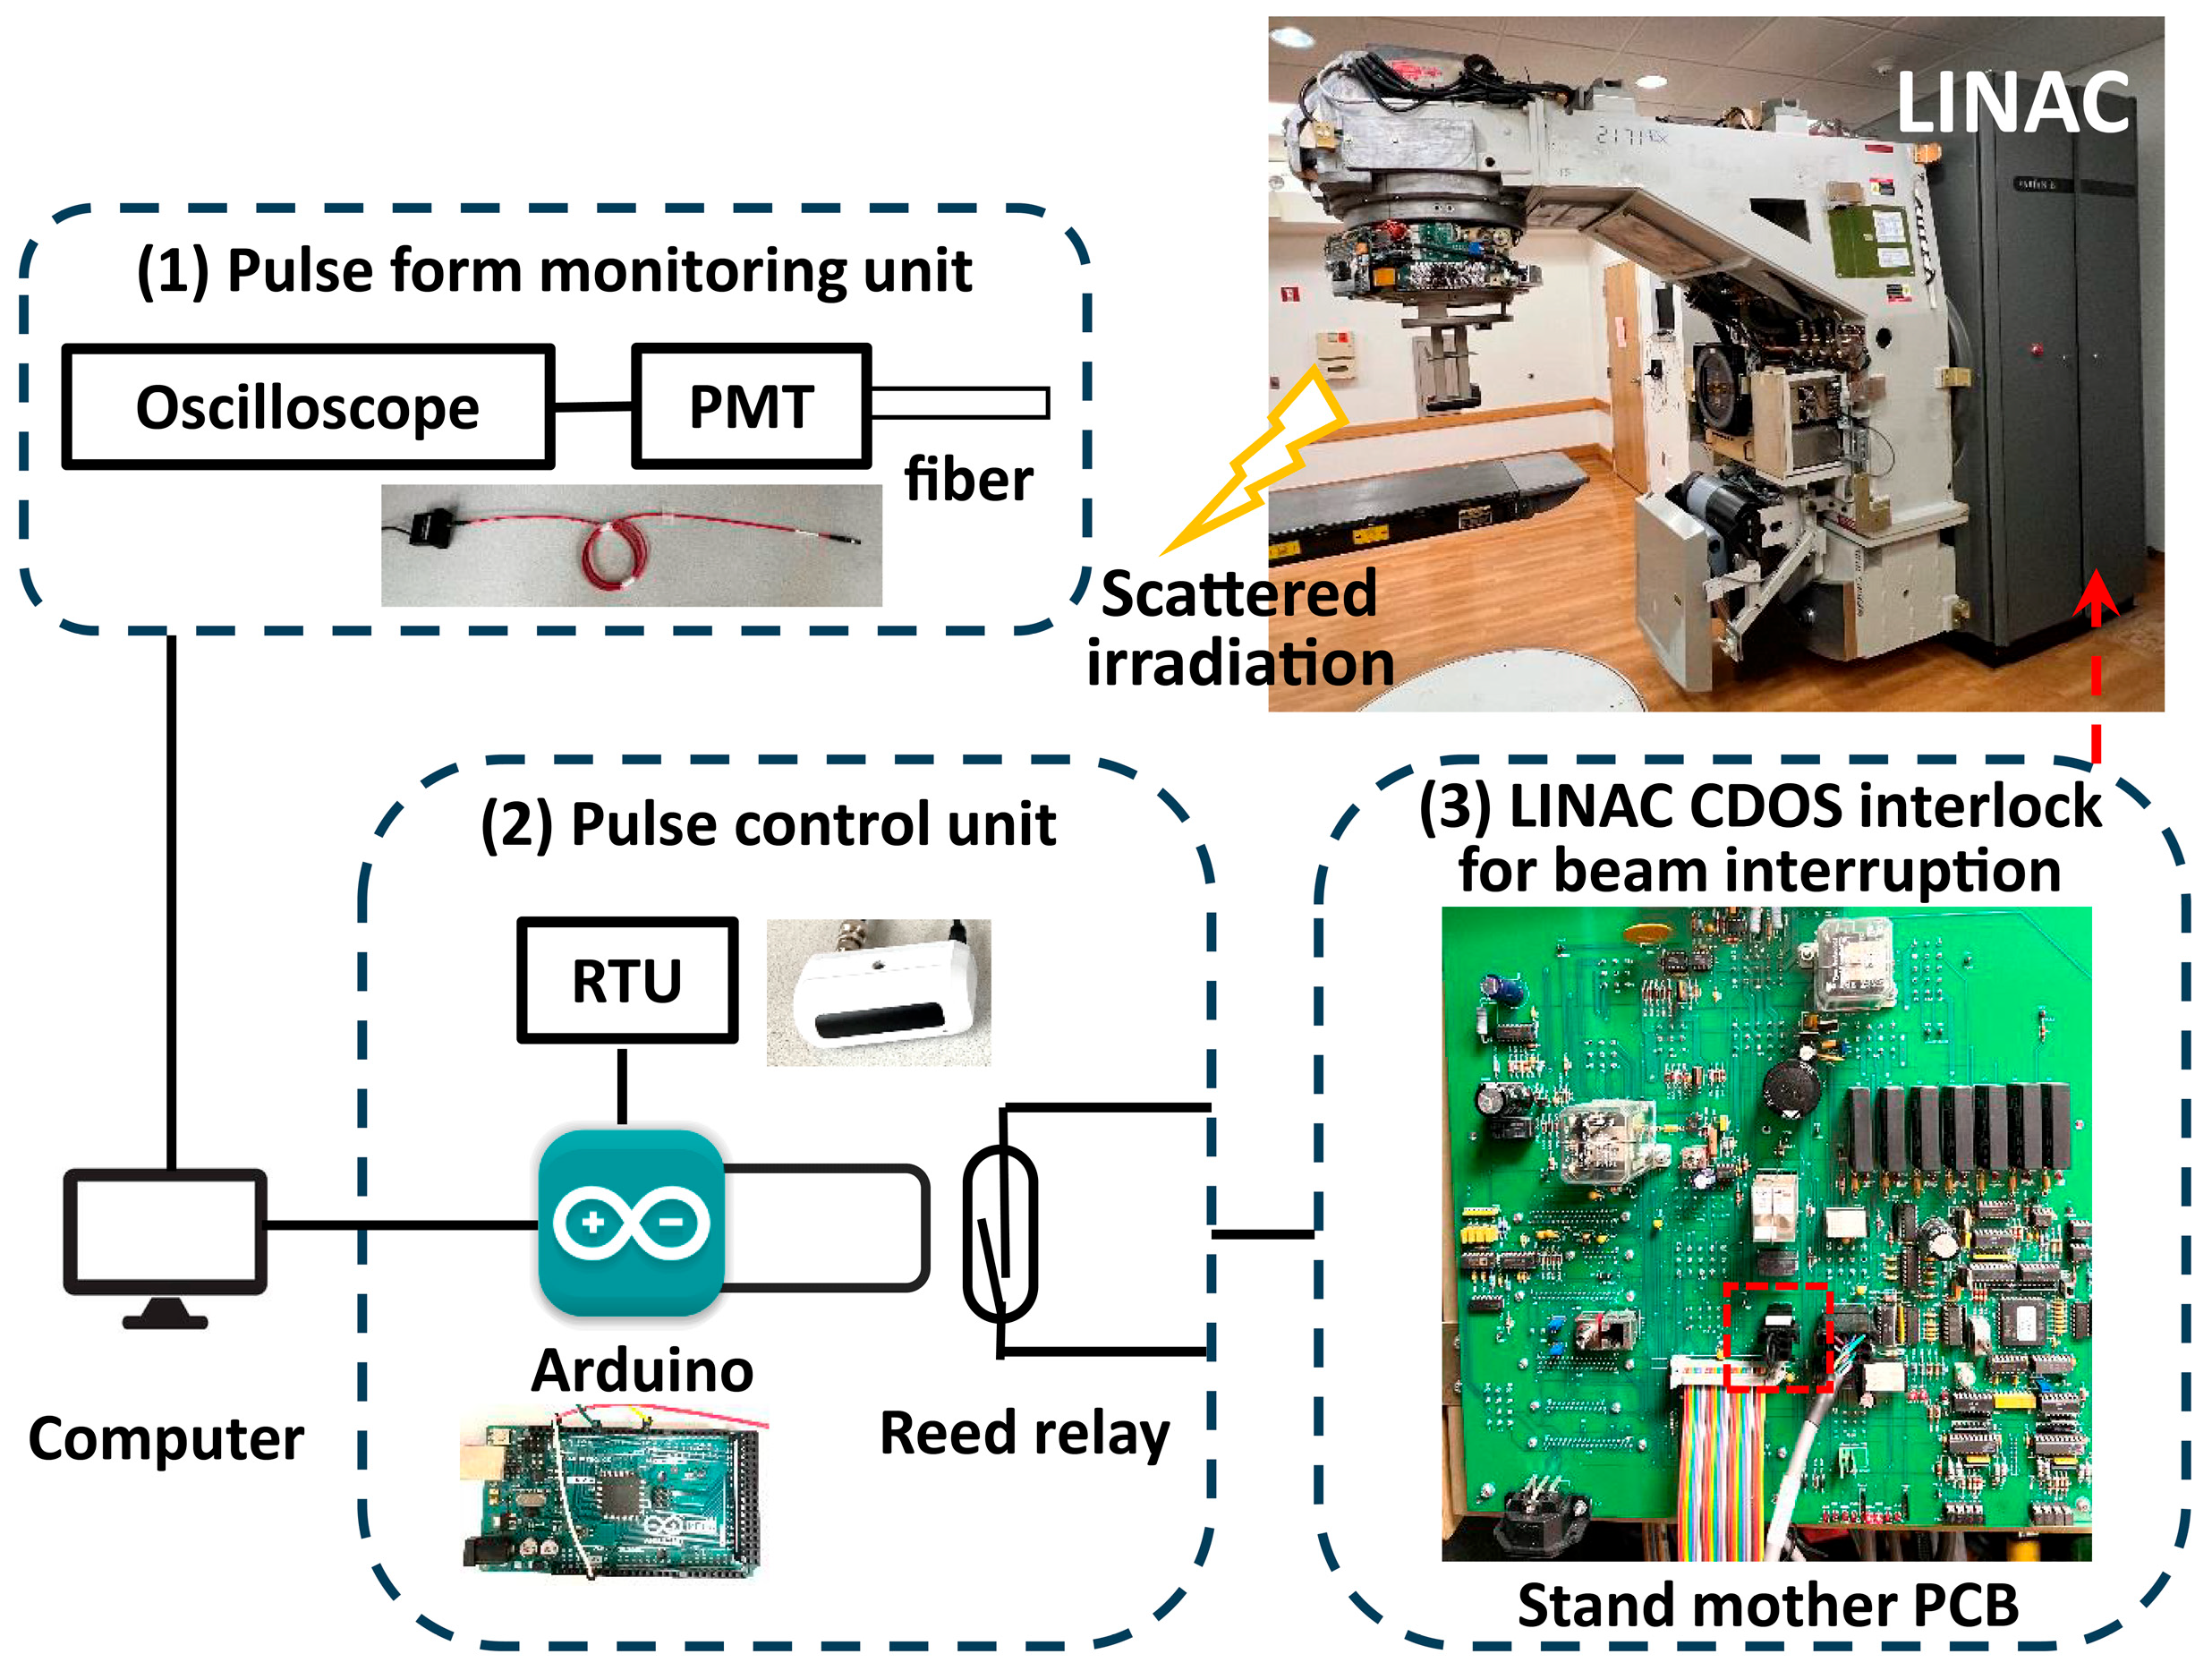
Figure 1. A schematic view shows the eFLASH and the (1) external pulse form monitoring unit and (2) external pulse control unit for monitoring and controlling FLASH pulses through scattered irradiation. The pulse control is achieved through the (3) CDOS jumper (red dashed box in the stand PCB) to trigger LINAC interlock and therefore beam interruption.
Radiation 05 00033 g001
Figure 2. Setup for MC simulations of the eFLASH beam.
Radiation 05 00033 g002
Figure 3. (a) and (b) show representative pulse waveforms versus delivery time for the default AFC setting and AFC-optimized setting, respectively. (c) shows the mean dose rate as a function of the number of pulses for multiple deliveries under both settings. Error bars represent uncertainties derived from film analysis. Relative error is <3% for dose rates ≥40 Gy/s and <10% for dose rates <40 Gy/s. (d) illustrates the DPP of each pulse for a 10.7 Gy delivery under both settings. (e) and (f) illustrate the dose portions delivered at different instantaneous dose rates for the total 10.7 Gy delivery under default setting and AFC optimization, respectively. (g) shows the number of pulses delivered correlates linearly with the MU after AFC optimization. (h) shows the number of pulses delivered versus planned in the external pulse control system.
Radiation 05 00033 g003
Figure 4. Measured 6 MeV FLASH beam characteristics: (a) 6 MeV FLASH vs. CONV PDDs with a 10 cm × 10 cm field. (b) PDDs and (c) depth dose rates along CAX for 10 cm × 10 cm, 6 cm × 6 cm, and 3, 2, 1.5, and 1 cm diameter circular fields based on a 6 cm × 6 cm cone. (d) and (e) are the crossline profiles and dose rate profiles, respectively, for 10 cm × 10 cm field at depths of 0, 0.8, 1.3, 1.8 and 2.3 cm. (f) shows the crossline dose rate profiles of a 1 cm diameter circular field.
Radiation 05 00033 g004
Figure 5. (a) MC-simulated PDD compared to film-measured PDD fitted by the Fermi–Dirac method for the open field. (b) shows the case for the circular field at 1 cm diameter. (c) MC-simulated profile in comparison to film measurement at 1.3 cm depth in the open field. (d) shows the case of the 1 cm circular field. For each case, the difference between MC and measured PDDs or profiles is also shown.
Radiation 05 00033 g005
Figure 6. (a1,a2) are the MC-calculated dose distributions in coronal and sagittal views, respectively, for mouse whole-brain irradiation with a 1.7 cm diameter cutout. (a3,a4) are the corresponding PDD along beam CAX and profiles, respectively. (b1b4) are the case for rat C1−T2 spinal cord irradiation with a 2 cm × 1 cm cutout. The white dots in (a2,b2) are the dose normalization points.
Radiation 05 00033 g006
Figure 7. The mean dose rate-volume histogram of the C1−T2 rat spinal cord based on 6 MeV FLASH irradiation for both default and AFC-optimized settings.
Radiation 05 00033 g007
Disclaimer/Publisher’s Note: The statements, opinions and data contained in all publications are solely those of the individual author(s) and contributor(s) and not of MDPI and/or the editor(s). MDPI and/or the editor(s) disclaim responsibility for any injury to people or property resulting from any ideas, methods, instructions or products referred to in the content.