1. Introduction
Fractionation has been a key method in radiotherapy from the very beginning. The first fractionation schemes were developed at the beginning of the 20th century [
1]. Also, research on the biological effects of radiotherapy, e.g., DNA-double-strand-breaks, began [
1,
2,
3]. The term “fractionation gain” describes the fractionation’s positive effects such as the preservation of normal tissue and increased tumor control [
4]. As the use of fractionation was initially based on clinical experience rather than laboratory testing, further research led to the following question: why do tumors respond differently to different doses of radiation and how can therapy be optimized [
2]?
As early as 1906, Bergonie and Tribondeau formulated the following law: “X-rays are more effective on cells which have a greater reproductive activity; the effectiveness is greater on those cells which have a longer dividing future ahead, on those cells the morphology and the function of which are least fixed” [
5]. This theory is still intuitively accepted and taught today because it is assumed that tumors divide more quickly, and that this is the reason why tumors can be cured by ionizing radiation. The fact that relatively fast-dividing cells, such as skin, mucous membrane, and gland cells, are more sensitive to radiation also seems to support the theory. Nevertheless, there is now much evidence that the correlation between the proliferation rate and radiation sensitivity does not hold [
6,
7].
The feasibility of fractionated radiotherapy is also influenced by other biological, physical, and clinical parameters, including hyperthermia, chemotherapeutic agents, dose, and time [
8]. In terms of biological parameters, the literature describes the “R’s” of radiotherapy: recovery, repopulation, redistribution, and reoxygenation [
9]. A very important influence of some mutations is that they lead to different radiation sensitivities. These could affect the cell cycle, as in Li–Fraumeni syndrome, or repair, as in patients with ataxia-telangiectasia mutated syndrome, where normally slower growing cells are much more sensitive to radiation.
An important development to describe different radiation sensitivities in cell lines and tissues was the linear-quadratic-model [
2]. The model is based on a mathematical function to predict the biological effect of irradiation on certain tissue. This results in the α/β-ratio, which can be defined for every tissue and represents the radiation sensitivity. Cells with a higher α/β-ratio are less sensitive to fractionation gain [
10].
Choosing a fractionation scheme for radiotherapy in HNSCC depends on the individual clinical parameters of the tumor to be treated. Life expectancy, tumor stage, and palliative or curative treatment goals are examples of such parameters. Normofractionation still is the standard fractionation scheme for treatment in HNSCC [
11], but alternative fractionation schemes such as hypofractionation and quad-shot fractionation are being tested and used [
12,
13,
14], especially for the treatment of more advanced tumor stages and palliative treatment. We were interested in how cell survival changes in different radiation-sensitive cell lines with different fractionation schemes and different division rates.
2. Materials and Methods
Three different cell lines were used: Cal33 as an example of HPV− HNSCC, UM-SCC-47 as an example of HPV+ HNSCC, and SBLF24 as an example of normal tissue to compare healthy tissue and tumor cells, as both are relevant for efficacy and tolerability of radiotherapy (
Figure 1 and
Figure 2).
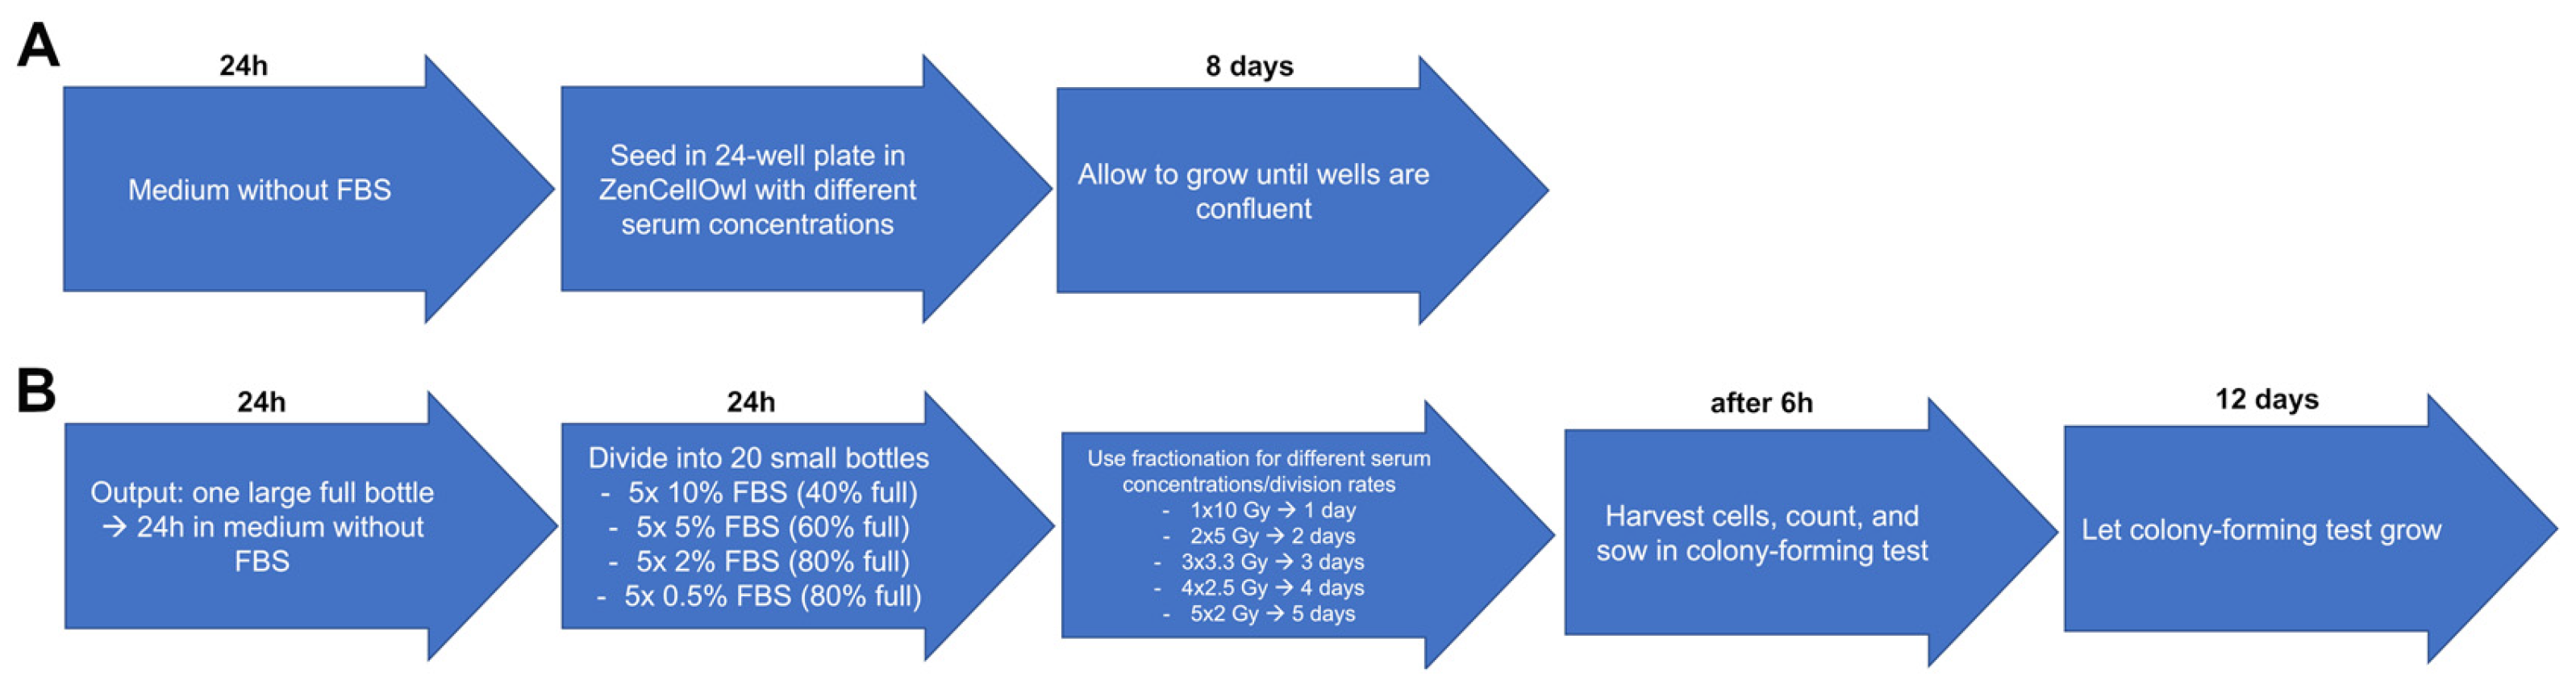
The first aim was to study if we could induce different DTs by increasing or decreasing the amount of FBS available. Therefore, cell cultures grew in medium containing different concentrations of FBS. To arrest the cells in the G0 phase and thus synchronize them, the cells were first incubated for 24 h in a medium without FBS to deprive them of growth factors and to enrich the cells in the G0 phase. Growth rates were determined by evaluating the cell culture DTs, using a ZenCellOwl camera to document and measure cell cultures’ growth curves (
Figure 3A). The cells were then exposed to different concentrations of FBS to observe the different division rates. These were then irradiated with the five different fractionation schemes to determine the fractionation gain/survival rates. The surviving fraction was determined by evaluating clonogenic survival in colony-forming assays (
Figure 3B). The DT was calculated by the growth rate derived from the exponential fit using the following equation:
Cell cycle and proliferation under these conditions were then investigated in more detail by creating videos for the different FBS concentrations and fractionation schemes using a ZenCellOwl camera. The number of mitoses was counted afterwards to evaluate possible cell cycle changes.
Figure 3.
Treatment scheme: procedure how the different DTs were studied as a function of the FBS concentration. (A) Determination of growth rates. (B) Determination of different survival rates at different DTs with different fractionation schemes.
Figure 3.
Treatment scheme: procedure how the different DTs were studied as a function of the FBS concentration. (A) Determination of growth rates. (B) Determination of different survival rates at different DTs with different fractionation schemes.
2.1. Cell Culture
Three cell lines Cal33, UM-SCC-47, and SBLF24 were used for the experiments. Cal33 and UM-SCC-47 were provided by Dr. Thorsten Rieckmann (University Medical Center Hamburg-Eppendorf, Germany). SBLF24 was derived from a healthy donor at the University Hospital Erlangen. The fibroblasts were stored frozen in the third passage. After thawing, they were then used for the experiments in the 5th–7th passage. The cancer cell lines were also expanded and frozen immediately upon receipt. After thawing, they were also used in the experiments after the third to fifth passages. Ethical approval was obtained from the Ethics Committee of the Medical Faculty of the Friedrich-Alexander University of Erlangen-Nuremberg. Cal33 and UM-SCC-47 are both cell cultures extracted from HNSCC, whilst SBLF24 fibroblasts are healthy human primary fibroblasts. Cal33 is HPV−, and UM-SCC-47 is HPV+. All cell lines were cultured in Dulbecco’s Modified Eagle’s Medium (DMEM; Gibco, Waltham, MA, USA), supplemented with 10% FBS (Biochrom, Berlin, Germany) and 1% penicillin-streptomycin (Gibco, Waltham, MA, USA). The FBS serum used is a common serum for eukaryotic cell cultures. It is mycoplasma free, sterile, with a pH-value of 7.0–7.6, and contains a low hemoglobin concentration. Glucose optimum for SBLF24 was adapted to a glucose content of medium for Cal33 and UM-SCC-47 in order to obtain results that are as comparable as possible.
All cell cultures were grown at 37 °C in a 5% CO2 humidified atmosphere incubator.
2.2. ZenCellOwl Doubling Time Measurement
The cells were grown in a T75 flask, plated at regular intervals, and allowed to grow to 80% confluence in order to achieve exponential growth (day 0). The medium was then changed from 10% FBS-supplemented to 0% FBS-supplemented medium for 24 h (h). Next, cells were harvested, counted using a Neubauer chamber, and 30,000 cells were seeded equally in 24-well cell culture plates (Greiner Bio-One, Frickenhausen, Germany). In preliminary tests, 15 different serum concentrations were tested and these 4 FBS concentrations were used, ranging from 10%, 5%, 2% to 0.5% in each well. Finally, the 24-well cell culture plate was placed into a ZenCellOwl camera (OMNI Life Science, Bremen, Germany) for growth measurement and incubated for 8 days at 37 °C in a 5% CO2 humidified atmosphere incubator. For all three cell lines, the conditions were kept the same. The experiments were repeated at least three times with all three cell cultures.
2.3. Colony-Forming Assay Measurement of Clonogenic Survival
The cells were grown in a T75 flask, plated at regular intervals, and allowed to grow to 80% confluence in order to achieve exponential growth (day 0). Then, the medium was changed from 10% FBS-supplemented to 0% FBS-supplemented medium for 24 h (day 1). The cells were then divided into 20 T25 flasks, with 5 flasks each containing 10% FBS, 5% FBS, 2% FBS, and 0.5% FBS to induce different division rates (day 2). The 10% concentration flasks were plated to reach 40% coverage, the 5% concentration flasks to reach 60% coverage, and the 2% and 0.5% concentration flasks to reach 80% coverage. The flasks containing the cells were then divided according to the different fractionation schemes and cultured in an incubator for 24 h. One flask of each concentration was irradiated according to the fractionation schemes 1 × 10 Gy, 2 × 5 Gy, 3 × 3.3 Gy, 4 × 2.5 Gy, and 5 × 2 Gy over the next 1 to 5 days (day 3–7). The irradiation was always carried out 24 h apart using an X-ray tube at 120 kV (General Electrics, Ahrensburg, Germany). All samples were removed from the incubator at each exposure to ensure equal conditions, even if their fractionation was already complete. Cells were harvested, counted, and 3000 cells were seeded into 60 mm dishes 6 h after the last irradiation, according to each fractionation scheme (day 3–7). The dishes were incubated for the next 12 days with the same medium as the cells were grown in before. After that, cells were fixed and stained with trypan blue. Colonies were counted if they consisted of at least 50 cells. Cells were always incubated at 37 °C in an incubator with a 5% CO2 humidified atmosphere. Experiments were repeated at least three times with all three cell cultures.
2.4. ZenCellOwl Cell Cycle Observation Video
Cal33 cells were used as an example for this trial. The cells were grown in a T75 flask, plated at regular intervals, and allowed to grow to 80% confluence in order to achieve exponential growth (day 0). Then, the medium was changed from 10% FBS supplemented to 0% FBS supplemented for 24 h (day 1). Cells were harvested, counted, and 30,000 cells were seeded into a 24-well cell culture plate (day 2). Five wells each were supplemented with 10% FBS, 5% FBS, 2% FBS, and 0.5% FBS. A 24-well cell culture plate was then incubated for 24 h. The cells of one well and of one concentration each were then irradiated according to the fractionation schemes 1 × 10 Gy, 2 × 5 Gy, 3 × 3.3 Gy, 4 × 2.5 Gy, and 5 × 2 Gy over the next 1–5 days (day 3–7). All samples were taken out of the incubator at every irradiation to provide equal conditions, even if their fractionation was already finished. The fractionation interval of 24 h was chosen to match the usual practice in radiotherapy. In addition, it has a high practicability for carrying out the experiments. The cell cycle and division were documented throughout with the ZenCellOwl camera by acquiring an image every hour. Moreover, the 24-well cell culture plate was always incubated with a ZenCellOwl camera at 37 °C in a 5% CO2 humidified atmosphere incubator during the experiment. The images were formatted and edited using an image analysis program (Biomas, Erlangen, Germany).
2.5. Statistics and Evaluation of the Experiments
ZenCellOwl data of the DT measurement experiment were displayed in graphs using scientific software GraphPad Prism 10 (GraphPad Software, San Diego, CA, USA). Statistical comparison was performed using SPSS (IBM, Armonk, NY, USA). The data of the experiments were analyzed by the unpaired, one-tailed Mann–Whitney U test. The experiments were repeated at least three times, and the data presented are the means of three independent experiments. p-values < 0.05 were considered statistically significant.
Colony-forming assays were counted by hand or with Biomas software (Biomas Version 4.1 07/2018, MSAB, Germany). Corresponding graphs were also generated with GraphPad Prism 10 (GraphPad Software, San Diego, CA, USA). Statistical comparison was performed using SPSS (IBM, Armonk, NY, USA, Version 30.0.0.0 (172)). The data of the experiments were analyzed by the unpaired, one-tailed Mann–Whitney U test. The experiments were repeated at least three times, and the data presented are the means of three independent experiments. p-values < 0.05 were considered statistically significant.
ZenCellOwl data for cell cycle observation videos were processed with Biomas software and the video software Pinnacle Studio 26 (Pinnacle, Mountain View, CA, USA). Mitoses were counted by hand and data were also displayed in graphs using GraphPadPrism 10 (GraphPad Software, San Diego, Ca, USA). Cells were defined as mitotic if they had detached in the corresponding image and divided and grew in the following images. The proportion of the mitotic cells of all cells in the respective image was determined, which corresponds to the mitotic index.
4. Discussion
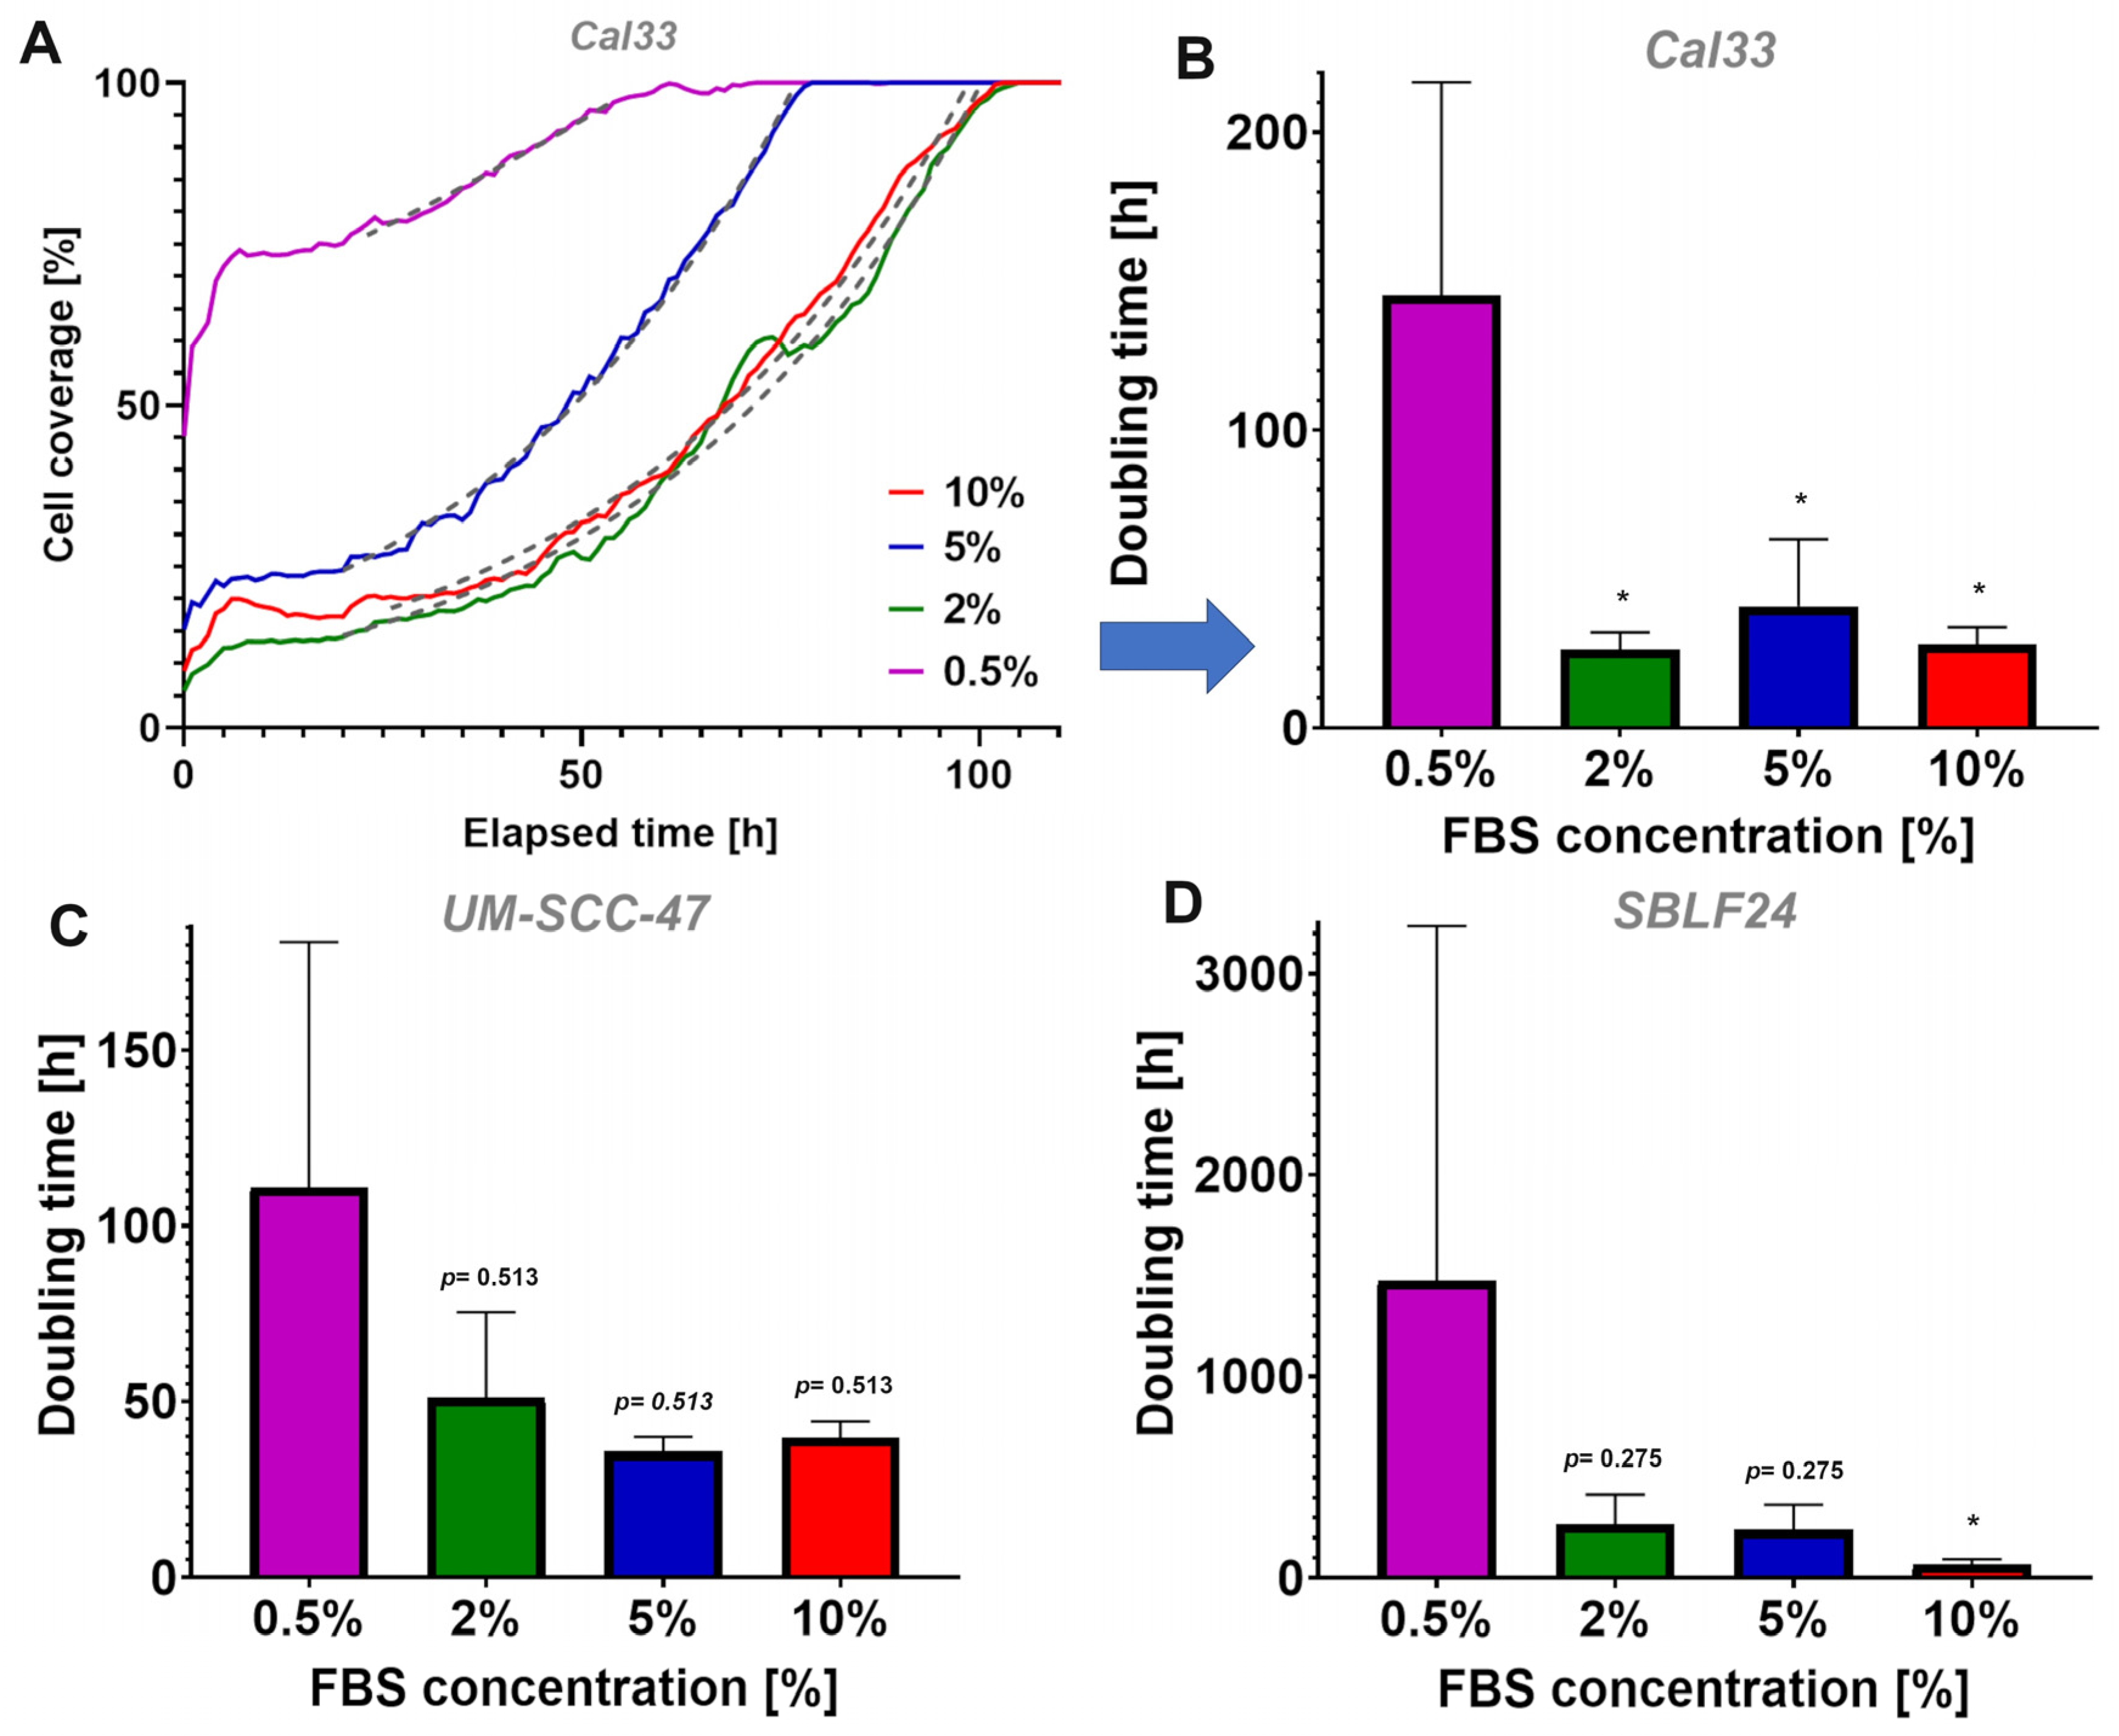
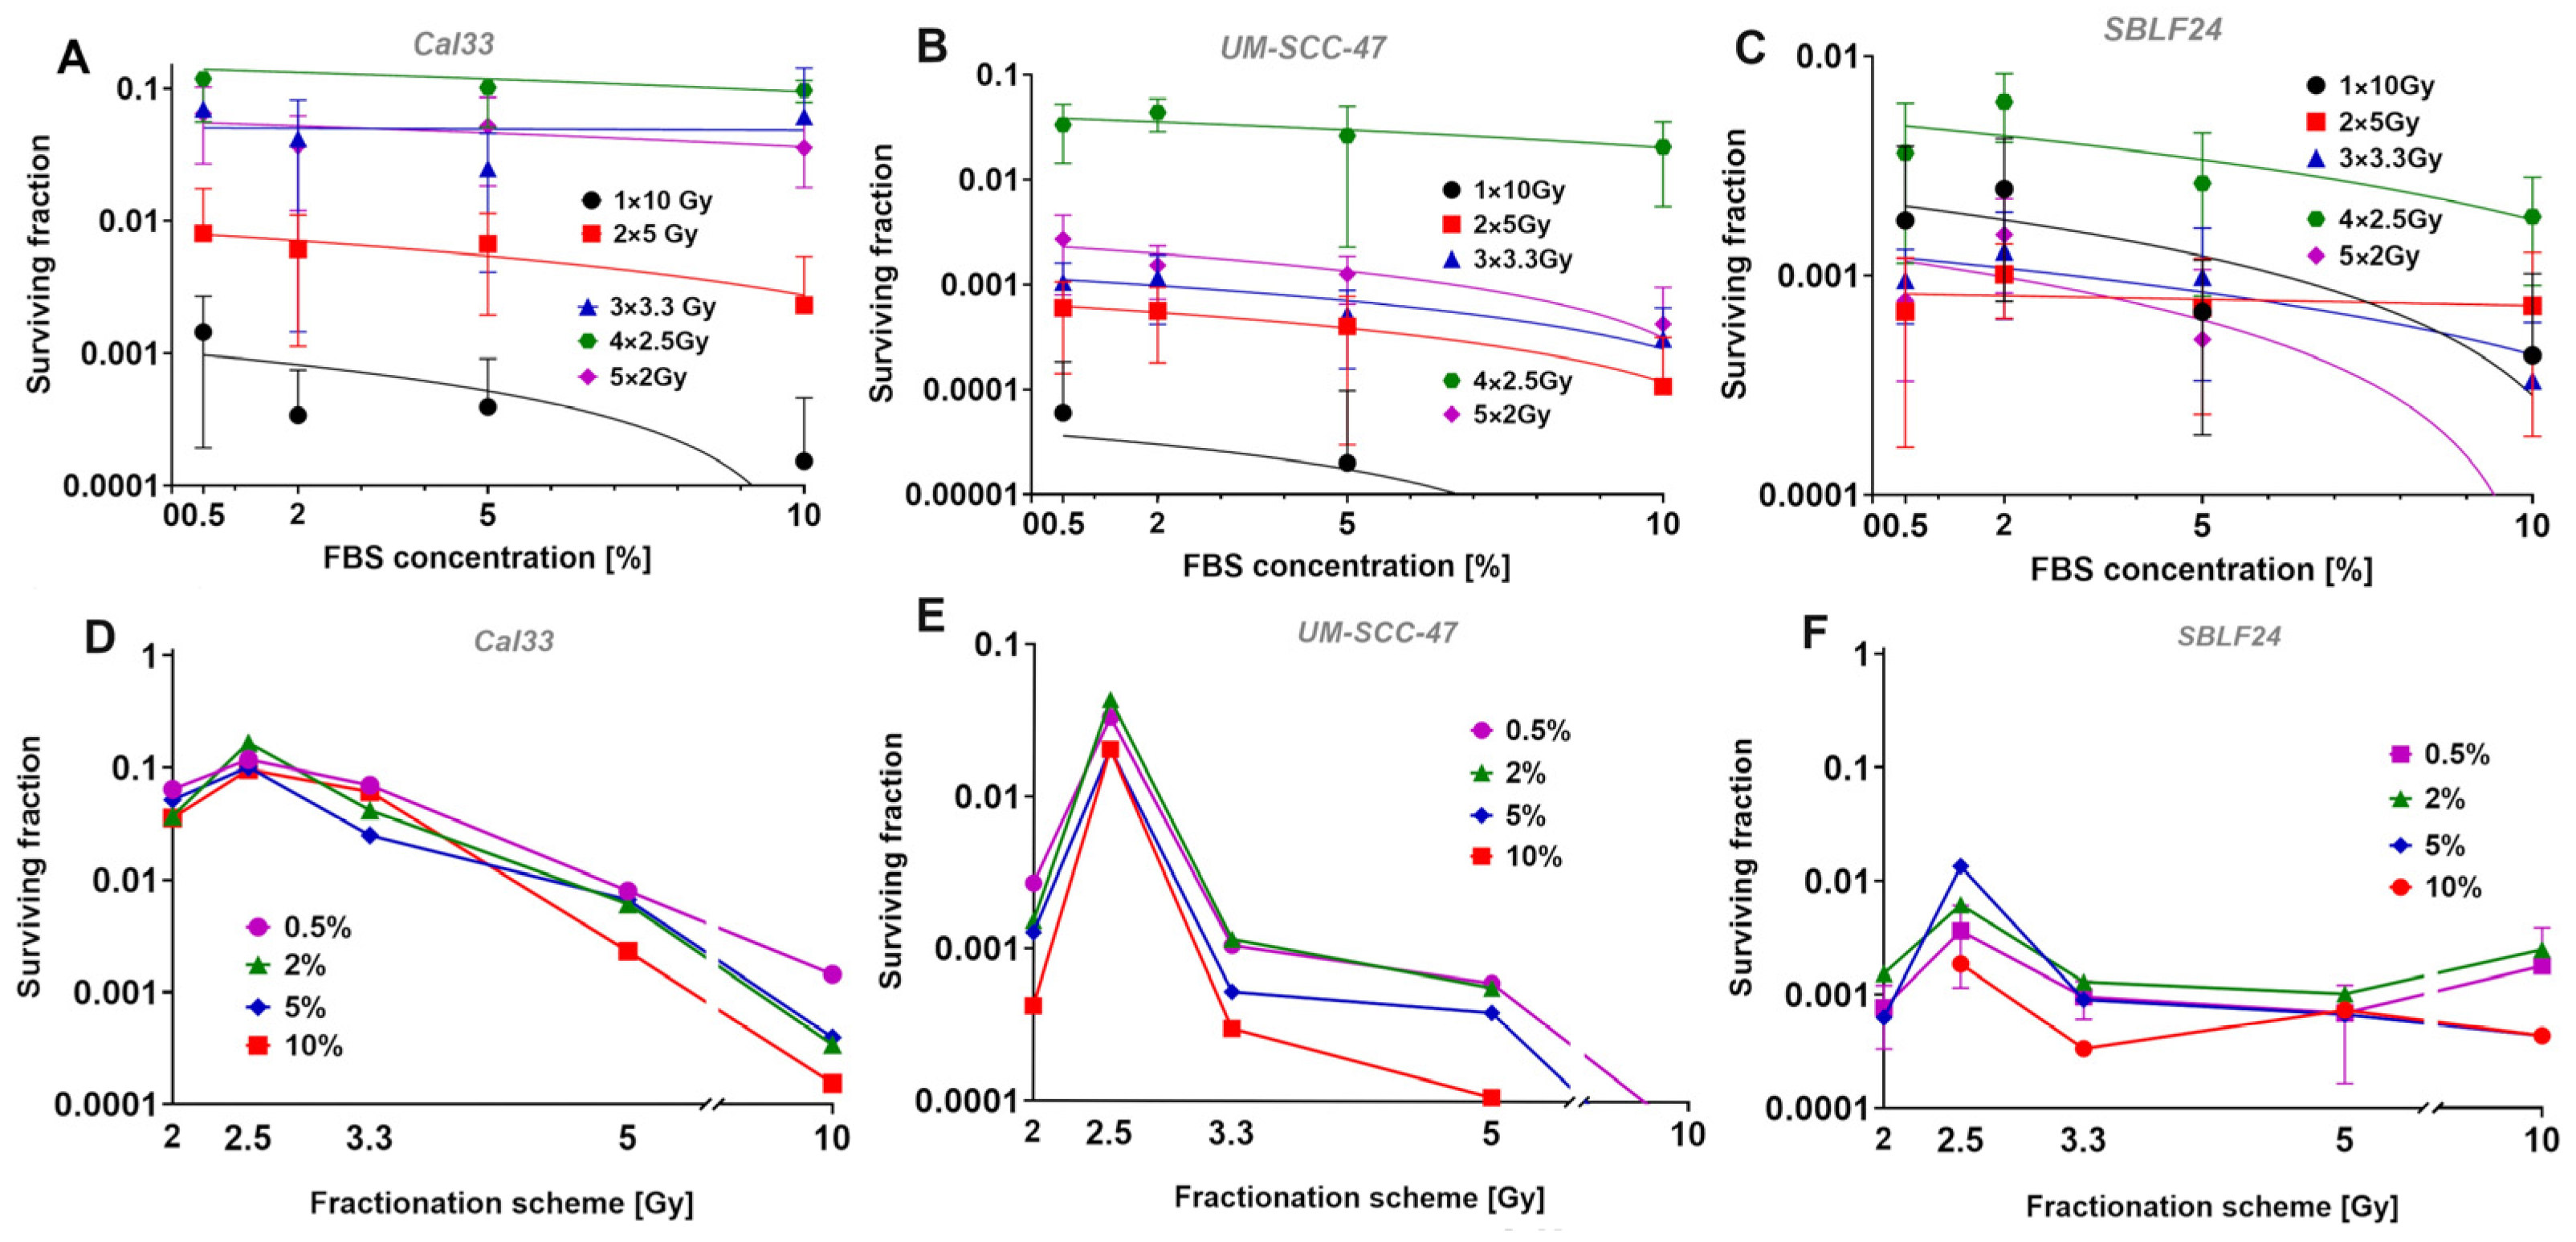
The main objective of our experiments was to evaluate the relationship between the growth rate of tumor cells and their fractionation gain in cell lines varying in their individual radiosensitivity. It was not possible to find a correlation between different growth rates induced by varying the FBS content of the medium and the surviving fractions in three different cell lines. However, we were able to show clearly that different growth rates could be induced by different concentrations of FBS and that the different fractionation schemes produced different surviving fractions.
The most striking and clearest finding was that the survival of the cell lines was independent from different FBS concentrations and the resulting division rates. We were able to induce different growth rates by supplementing the cells’ medium with different FBS concentrations to provide different supplies of growth factors. Similar methods were already used in previous cell culture studies; one study by Monasterio et. al. changed the sphingolipid supply for CLO/LY B-cell growth to affect mammalian cell membranes [
15]. Another study by Kwon et. al. used different FBS concentrations to modulate molecular cell mechanisms in pluripotent stem cells [
16]. As in the named studies, we were also able to influence the cell culture’s proliferation. In our case, we changed the growth factor supply through different FBS concentrations. The growth rate was then determined through cell cultures’ DTs. In general, UM-SCC-47 tended to have a slightly faster growth rate and thus shorter DTs (111.1 h) than Cal33 (0.5%: 145.5 h). SBLF24 clearly showed a slower growth rate and thus higher DTs (1477.5 h) than Cal33 (0.5%:
p = 0.050). For all three cell lines, the different growth rates did not lead to different survival rates in all fractionation schemes. This indicates, as already shown in various studies, that the law of Bergonie and Tribondeau is not generally valid [
17,
18] and does not apply in this case. Of course, it is important to bear in mind that FBS deprivation can trigger other effects that could also lead to a different survival, so this cannot be taken as absolute proof that the law described above does not apply. Moreover, our artificial setting may not reflect clinical experiences properly and the side effects in different tissues of patients may differ from our in vitro results.
Primary fibroblasts had much slower growth rates and longer DTs than both cancer cell cultures. One explanation for the slower proliferation of the fibroblast cell culture could be that the conditions for fibroblasts in conventional cell culture are not ideal. In particular, the problem of insufficient extracellular matrices in conventional two-dimensional cell cultures could be a reason [
19,
20]. All three cell cultures showed a tendency towards an exponential increase in DT with increasing FBS concentration, whilst the biggest difference was shown between 0.5% FBS and 10% FBS (
p < 0.05 in Cal33 and SBLF24). This leads us to the conclusion that providing different concentrations of growth factors has a direct effect on cell cultures’ growth rate, both in tumor cells and normal tissue.
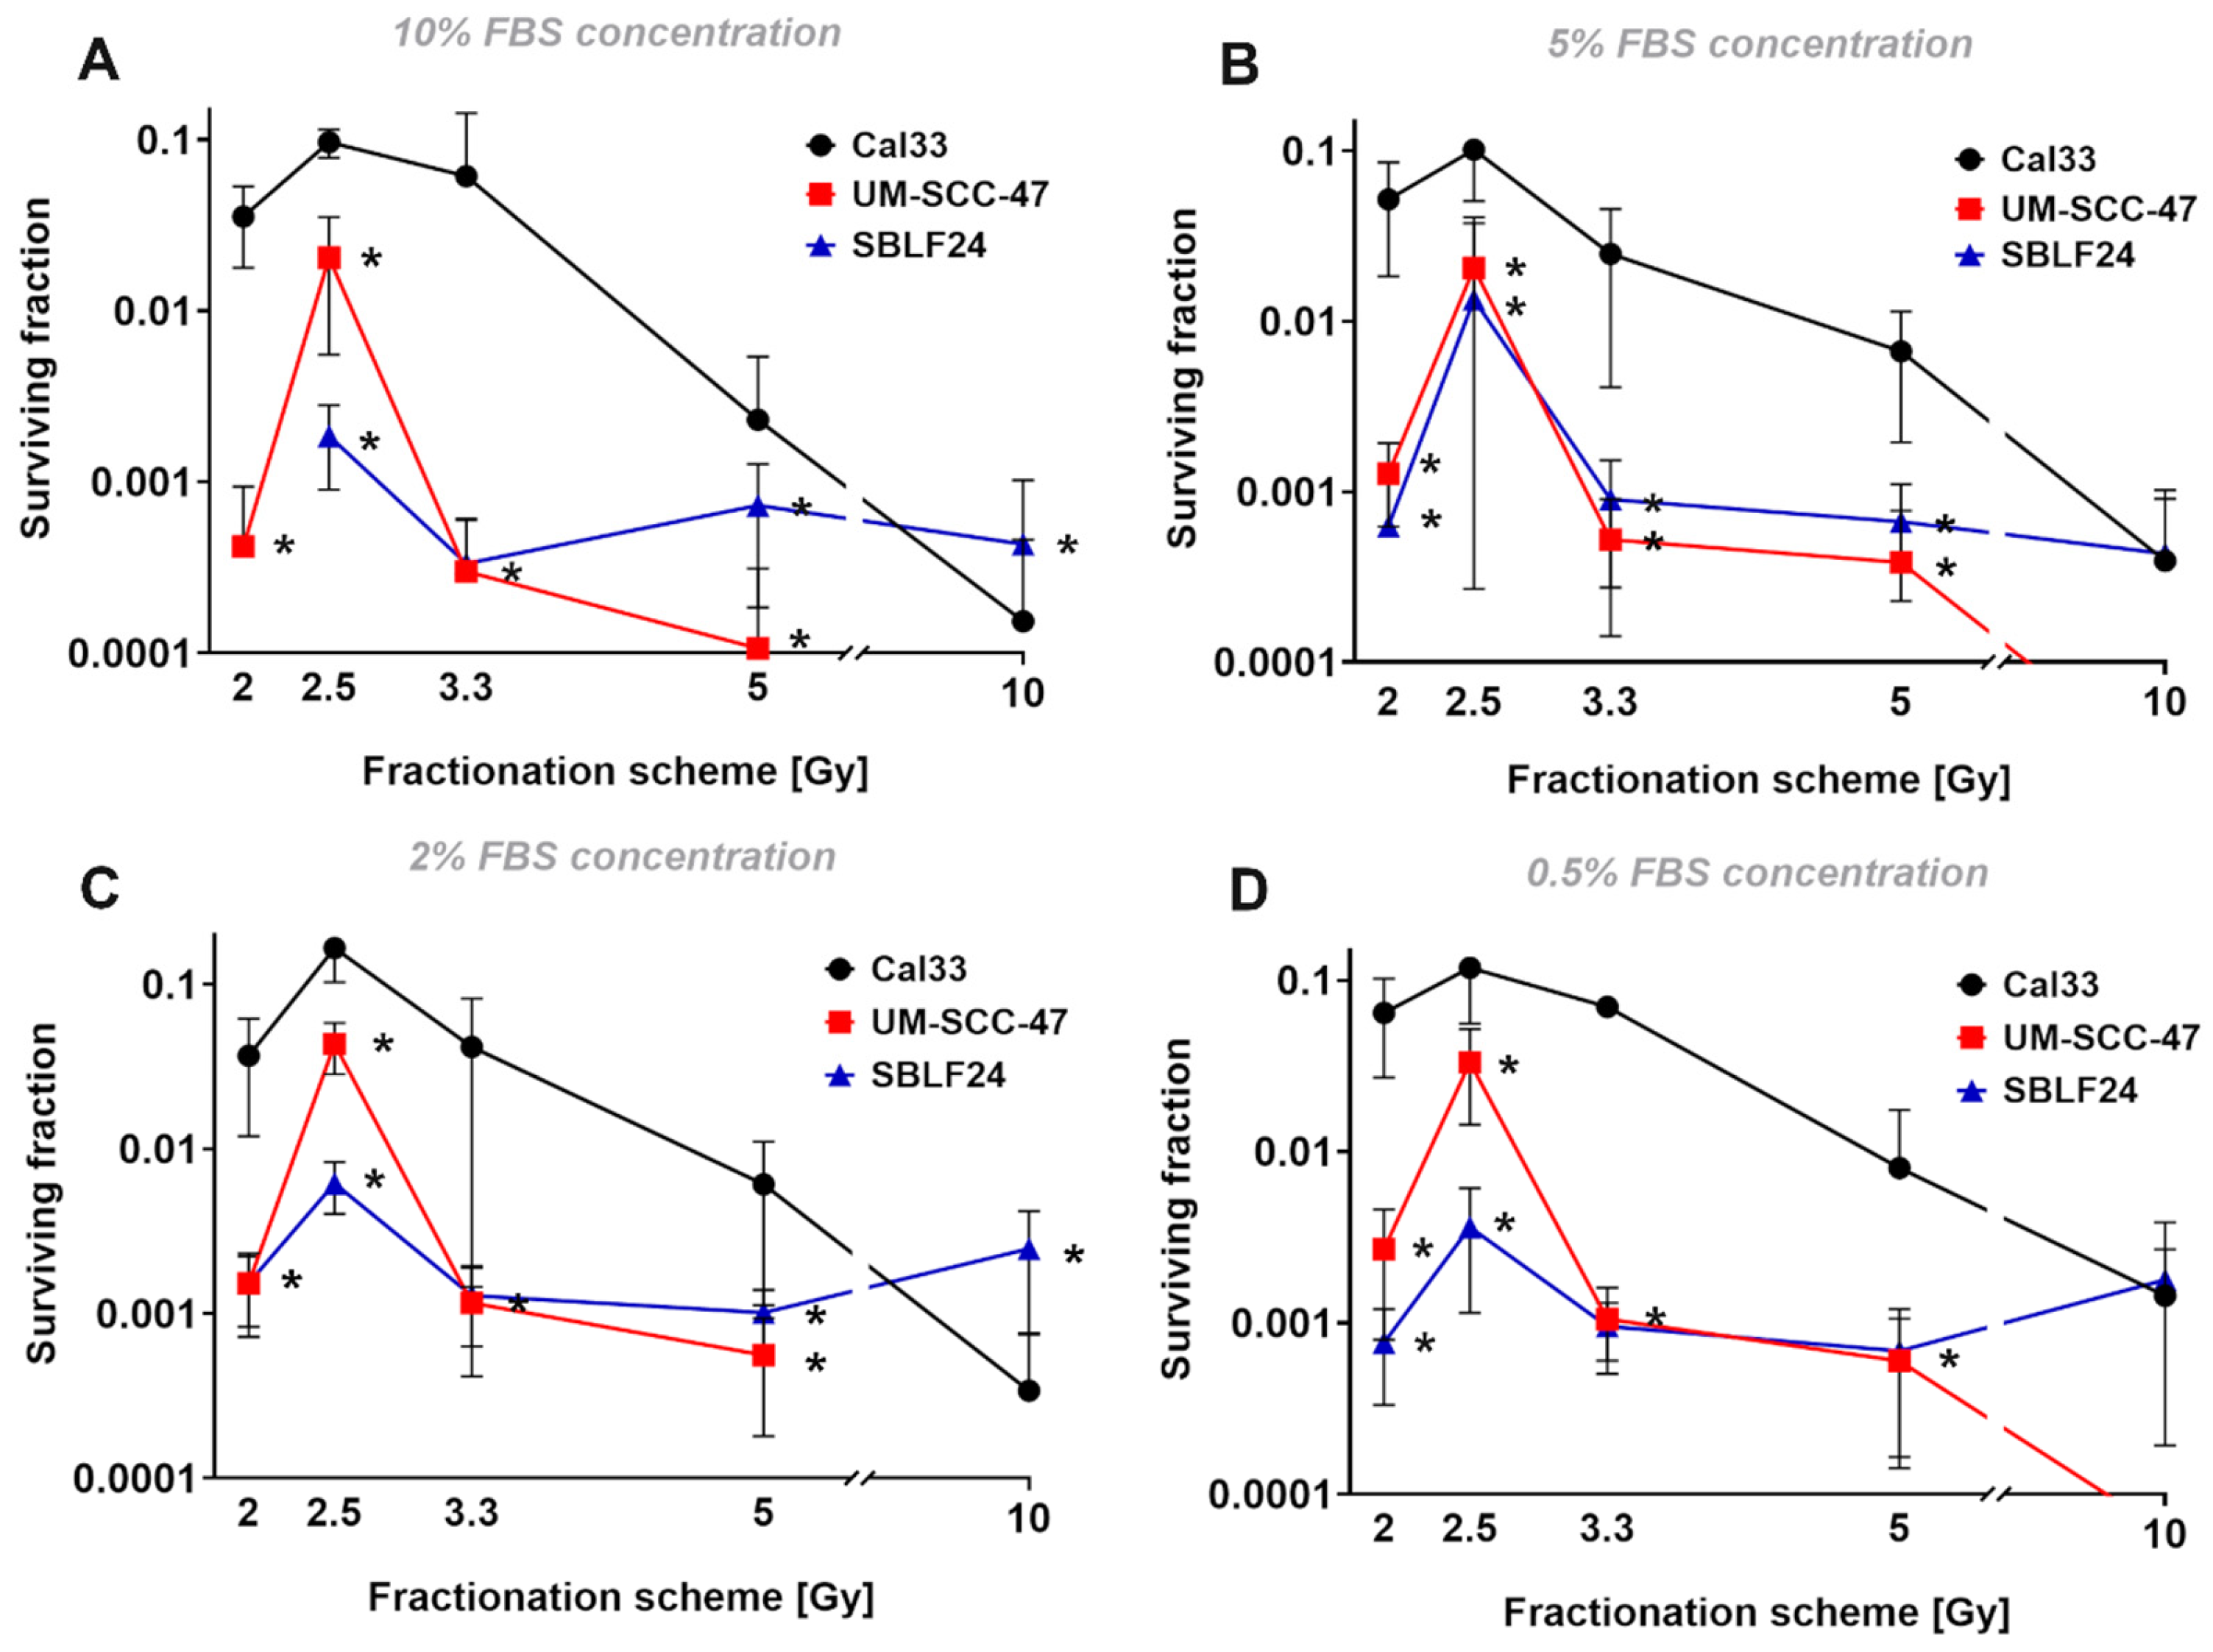
After deciding on four FBS concentrations (0.5%, 2%, 5%, 10%) that seemed appropriate for the following experiment, we wanted to investigate the relationship between the different growth rates and the fractionation gain. The fractionation schemes used were chosen to divide 10 Gy into 1–5 fractions. Due to the non-linear dose–response relationship in survival curves, a single dose or less strongly fractionated dose has a higher effect than normofractionated doses of, e.g., 5 × 2 Gy. This was clearly observed for both tumor cell lines. In the fibroblast cell line, which usually has a high alpha–beta ratio and is therefore less susceptible to fractionation, there were only slight differences from 1 × 10 Gy to 3 × 3.3 Gy. We could not explain the very striking finding that 5 × 2 Gy was more effective than 4 × 2.5 Gy and similar to 3 × 3.3 Gy. We suspected that the fact that we synchronized the cells by FBS deprivation prior to irradiation to have uniform conditions resulted in the irradiation of an increased number of cells in radiation-sensitive cell cycle phases. Since the cells in G2 and mitosis are particularly sensitive to radiation, we examined whether there were particularly large numbers of cells in these phases. Since we were only able to directly count mitoses, the number of mitotic cells decreased significantly by the second irradiation. At the same time, however, the strong decrease in mitosis points to a pronounced G2 arrest and thus to cells in a radiation-sensitive cell cycle phase. One hypothesis would be that the 5 × 2 Gy fractionation leads to a particularly large number of cells in G2/mitosis being hit during the five irradiations. However, this does not seem very likely here, as this should also happen with the 4 × 2.5 Gy and it is therefore unclear what led to this increased effect. It is generally accepted that arresting cells in G2 and thus irradiating cells at their most radiation-sensitive stage increases the effectiveness of irradiation [
21,
22].
The surviving fractions of the HPV+ cell culture UM-SCC-47 were significantly lower than those of HPV− Cal33 in general (
p < 0.010). The lower surviving fractions of UM-SCC-47 are likely caused by the HPV positivity. According to the literature, HPV+ carcinomas tend to have a higher radiosensitivity than HPV− carcinomas [
23,
24,
25,
26], which leads to lower surviving fractions in HPV+ cells. In addition, the fractionation gain with lower fractionation was significantly higher for HPV+ cell culture. While at 4 × 2.5 Gy the UM-SCC-47 cell line was only 10× more radiation sensitive than Cal33, at the lower fractionation numbers, this was more in the direction of 100× lower survival.
A limitation could be that we did not perform flow cytometric cell cycle analysis in our study. This could also be considered for further studies, to observe the cell cycle in more detail and confirm cell cycle arrest after irradiation. Also, the surviving fractions in our colony-forming assays were quite low in general. Next time, a higher number of cells could be seen in larger dishes to achieve higher surviving fractions in general.
The clinical consequence of the study is probably more of a theoretical nature, even if it shows that slowly dividing cells can also be inactivated by radiation in the same way. It is well known that hyopfractionation is more effective than normofractionation due to the non-linear dose–response relationship. In a clinical setting, of course, there are more influencing factors such as the repopulation of rapidly dividing cells, radiation sensitivity of tumor and normal tissue, apha/beta of the tissue, oxygenation, tumor size, and many other factors.


