Article

Assessing Radiation Effects on Chemo-Treated BT20 and 4T1 Breast Cancer, and Neuroblastoma Cell Lines: A Study of Single and Multiple-Cell Ionization via Infrared Laser Trapping

1
Department of Physics, Addis Ababa University, Addis Ababa 1176, Ethiopia
2
Department of Physics, Middle Tennessee State University, Murfreesboro, TN 37132, USA
3
International Ginseng Institute, School of Agriculture, Middle Tennessee State University, Murfreesboro, TN 37132, USA
4
Department of Pharmacology, College of Medicine, Guangxi University of Science and Technology, Liuzhou 545006, China
5
Department of Biology, Sierra College, Rocklin, CA 95677, USA
6
Department of Physics, California State University Dominguez Hills, Carson, CA 90747, USA
*
Author to whom correspondence should be addressed.
Radiation 2024, 4(1), 85-100; https://doi.org/10.3390/radiation4010007
Submission received: 4 January 2024 / Revised: 23 February 2024 / Accepted: 29 February 2024 / Published: 7 March 2024

Abstract

:

Simple Summary

In this study, we explore how a breast tumor cell line, known as BT20, reacts to radiation when treated with a new antitumor compound. Our goal is to understand whether this compound, DMDD, can make these cancer cells more sensitive to radiation, which could potentially make cancer treatments more effective. Using a specialized technique called laser trapping, we measure how the cells respond to different levels of radiation with and without the compound. Our findings aim to provide valuable insights into how treatments can be tailored for better efficiency, potentially impacting how cancer therapies are approached and offering a more personalized strategy for patient care. This research is intended for anyone interested in the advancements in cancer treatment and the potential for more targeted, effective therapies.

Abstract

Background: Our study aimed to assess the radiation sensitivity of BT20, a human breast tumor cell line, using the laser-trapping technique and compare it with N2a and 4T1 cells. Additionally, we investigated the impact of the antitumor compound 2-Dodecyl-6-methoxycyclohexa-2,5-diene-1,4-dione (DMDD) on radiation sensitivity. Methods and Materials: We employed laser trapping to calculate both the threshold ionization energy (TIE) and threshold radiation dose (TRD) for BT20, N2a, and 4T1 cells. We assessed the effect of DMDD on BT20 cells’ radiosensitivity and conducted comparisons across these cell lines. Results: Our findings reveal that DMDD significantly enhances the radiosensitivity of BT20 breast carcinoma cells. Moreover, we observed distinct trends in TIE and TRD across the three cell lines, with differences attributed to variations in cell size and composition. When multiple cell ionizations were considered, a notable reduction in TRD was observed, implicating factors such as the chain effect of ionizing radiation and the influence of DMDD. The study found that TIE increased with the number of cells in the trap while TRD consistently decreased across all three cell lines, suggesting comparable radiation sensitivity, and oligostilbene treatment further reduced TRD, presenting the potential for enhancing therapeutic ratios in cancer treatment. Conclusion: The antitumor compound DMDD enhances the radiosensitivity of BT20 breast carcinoma cells, highlighting its potential in cancer treatment. Furthermore, our study underscores the impact of cell size and multiple-cell ionizations on TRD. Leveraging laser trapping techniques, biocompatible nanoparticles, and advanced optical tweezers opens promising avenues for personalized and effective cancer therapy approaches.

1. Introduction

Breast cancer is a disease in which cells in breast tissues change and divide uncontrollably. It is the most frequently diagnosed cancer in women and one of the leading causes of cancer deaths among women. Over 2.1 million cases of invasive breast cancer are diagnosed worldwide, and more than 450,000 women die from breast cancer [1]. The risk of a woman developing breast cancer throughout her lifetime is about 12.5% [2]. In particular, women with triple-negative breast cancers (TNBC) (higher rates in Black and LatinX women) are shown to have poorer survival than those with other types of breast cancer, with only 14% of them surviving five years after diagnosis [3,4]. Early detection and various types of treatments results in significant improvement in the survival rates of women diagnosed with breast cancer, which has been achieved in recent years due to tremendous advancement [5,6,7,8,9,10,11,12,13,14,15,16].
TNBC is an invasive breast cancer subtype representing approximately 15% of all breast carcinomas [17]. The lack of three receptors characterizes TNBC, i.e., progesterone receptor (PR), estrogen receptor (ER), and human epidermal growth factor receptor 2 (HER2). Because treatments for breast cancer commonly target one of these three receptors, patients with TNBC have a poor prognosis compared to the other subtypes of breast cancer [4].
In radiation therapy (RT), high-energy radiation destroys the cancer cells’ reproduction ability, and the body naturally removes these cells. Such high-energy radiation may cause inadvertent damage to the healthy cells surrounding the tumor. Combining radiation and chemotherapies improves therapeutic efficacy by inhibiting DNA [10]. Cisplatinum, taxanes hypothermia, hyperthermia, and biocompatible nanoparticles are combined modalities used in cancer treatment [10]. Biocompatible nanoparticles that can absorb infrared radiation and generate heat are useful for inducing highly localized hyperthermia [13].
Recent research employing advanced laser-trapping techniques [18,19,20,21,22,23,24,25] has demonstrated that these methods play a pivotal role in the characterization of crucial parameters, particularly in the context of cancer treatment. Laser trapping, also known as optical trapping or optical tweezing, is a cutting-edge experimental method that utilizes highly focused laser beams to manipulate and immobilize microscopic particles, including biological cells, at precise locations within a three-dimensional space [26,27,28,29]. This innovative approach allows for the precise control and study of individual cells, enabling researchers to investigate their behaviors and responses under controlled conditions.
In the context of this manuscript, laser trapping has emerged as a vital tool for understanding key parameters such as threshold ionization energy (TIE) and threshold radiation dose (TRD) in the context of cancer treatment. It is important to note that near-infrared (NIR) lasers do not ionize atoms or molecules as UV or X-ray photons do because of their lower energy photons. Instead, processes like Multiphoton Absorption, Tunnel Ionization, or Laser-Induced Breakdown led to ionization in cells [30,31,32,33,34]. In experiments with optical tweezers, differentiating thermal ionization caused by high-intensity light from non-thermal ionization mechanisms is crucial [35]. By utilizing laser trapping, researchers have been able to subject individual cancer cells to controlled doses of radiation while monitoring their response in real time. This technique has unveiled a remarkable trend wherein as treatment periods increase, TIE and TRD exhibit significant reductions. This finding underscores the critical role of laser trapping in optimizing radiation-based therapies for cancer treatment, as it provides valuable insights into the mechanisms underlying radiation-induced cell damage and the potential for enhancing treatment efficacy.
In addition to the conventional chemotherapeutic agents commonly employed in combined radiation and chemotherapy treatments, research on herbal extracts derived from traditional Chinese medicines (TCMs) and naturally occurring oligostilbene compounds has revealed their effectiveness against a variety of cancer types. Notably, TCM herbal extracts such as 2-Dodecyl-6-methoxycyclohexa-2,5-diene-1,4-dione (DMDD) sourced from the root of Averrhoa carambola L. and Suffruticosol B obtained from peony seeds have exhibited the capacity to enhance the sensitivity of cancer cells to radiation, while simultaneously influencing their biophysical properties [18,19,20]. These agents play a dual role by augmenting tumor cells’ responsiveness to radiation and safeguarding normal tissues from radiation-induced damage, as demonstrated in previous studies [36,37,38,39]. The combination of laser trapping and the study of these herbal extracts provides a comprehensive understanding of how these compounds impact cancer cells at the cellular and molecular levels, further highlighting the significance of infrared laser trapping as an indispensable tool in characterizing these effects [18,19,20].
In the realm of cancer research, the exploration of radiation sensitivity and the impact of antitumor compounds on cancer cells are pivotal areas of investigation. A recent study delved into the radiation sensitivity of 4T1 breast cancer cells, both untreated and treated with an antitumor compound derived from DMDD, employing a laser trapping technique to discern the effects. The findings from this study illuminated a decrease in Total Ionization Energy (TIE) and Radiation Dose Threshold (TRD) with prolonged treatment durations, indicating an enhanced radiation sensitivity attributable to the DMDD treatment [18]. Concurrently, another investigation focused on the radiation response of untreated N2a cells, utilizing infrared laser trap ionization to understand the dynamics between TIE, TRD, and cell mass. This study uncovered an inverse relationship between TRD and cell mass, revealing that as cell mass increases, TRD decreases. Such observations suggest a novel approach for in vivo TRD calculation, shedding light on potential advancements in radiation dosimetry for cancer treatment [25].
Complementing these findings, a separate examination of in situ membrane components in human mammary epithelial cells (MCF-10A) and six breast cancer cell lines, including BT-20, MCF-7, SK-BR-3, MDA-MB-231, MDA-MB-157, and MDA-MB-361, revealed elevated levels of polyunsaturated lipids in MCF-10A cells compared to the cancerous counterparts, with BT20 cells showcasing higher lipid levels relative to other breast cancer lines [40]. The analytical technique employed, matrix-assisted laser desorption/ionization-Fourier transform ion cyclotron resonance mass spectrometry, allowed for the detailed study of these lipid profiles without necessitating lipid extraction and separation. Building on this foundation, our study seeks to further investigate these lipid elevations across different cancer cells, employing laser trap ionization to conduct quantitative analyses of threshold radiation doses for single and multiple cell ionizations.
This paper presents a focused study on the BT20 triple-negative breast cancer (TNBC) cell line [41], drawing comparisons with the previously mentioned findings from 4T1 [18] and N2a [25] cell lines. Originating from a 74-year-old female in 1958 [42], the BT20 cell line offers a distinct contrast to the 4T1 line derived from mice [43], providing a unique perspective in our examination of threshold ionization radiation doses. By measuring and analyzing these doses in the context of single and multiple ionizations of BT20 cells, our research endeavors to juxtapose these results against those obtained for 4T1 and N2a cells, aiming to uncover nuanced insights into the interplay between cell type, lipid composition, and radiation sensitivity in cancer treatment.

2. Materials and Methods

2.1. Overview

Our study employs cell culture, treatment, and advanced laser trapping ionization techniques for comparing effects on BT20, 4T1 and N2a cells, all obtained from the American Type Culture Collection (ATCC). To mitigate potential hyperthermic effects associated with infrared laser trapping [35], we applied strategies from prior research [18,19,20,21,22,23,24,25], adjusting laser intensity and exposure duration. Our cell ionization protocol follows established methodologies [18,19,20,21,22,23,24,25], enabling a comparative analysis of TIE and Radiation TRD across these cell lines.

2.2. DMDD Extraction and Preparation

DMDD was extracted from Averrhoa carambola L. roots via multi-step solvent extraction, resulting in a yellow powder. The process involved refluxing with 60% aqueous ethanol, sequential solvent extractions, and open silica gel column chromatography [44], followed by recrystallization with methanol [45].

2.3. Cell Culture and Treatment

BT20, 4T1 and N2A cells were cultured under conditions recommended by ATCC. BT20 cells were maintained in RPMI1640 medium supplemented with 10% FBS at 37 °C in a 5% CO2 atmosphere. Cells were passaged every 2–3 days. For experimental treatments, cells were seeded in 96-well plates, allowing 24 h for adherence before treatment with 100 μM DMDD, identified as an effective dose [37,45]. Groups included untreated controls, 2-h, and 24-h treatments, each with six replicates. Following treatment, media were transferred to Eppendorf tubes for analysis, and cells were detached for further assessment.

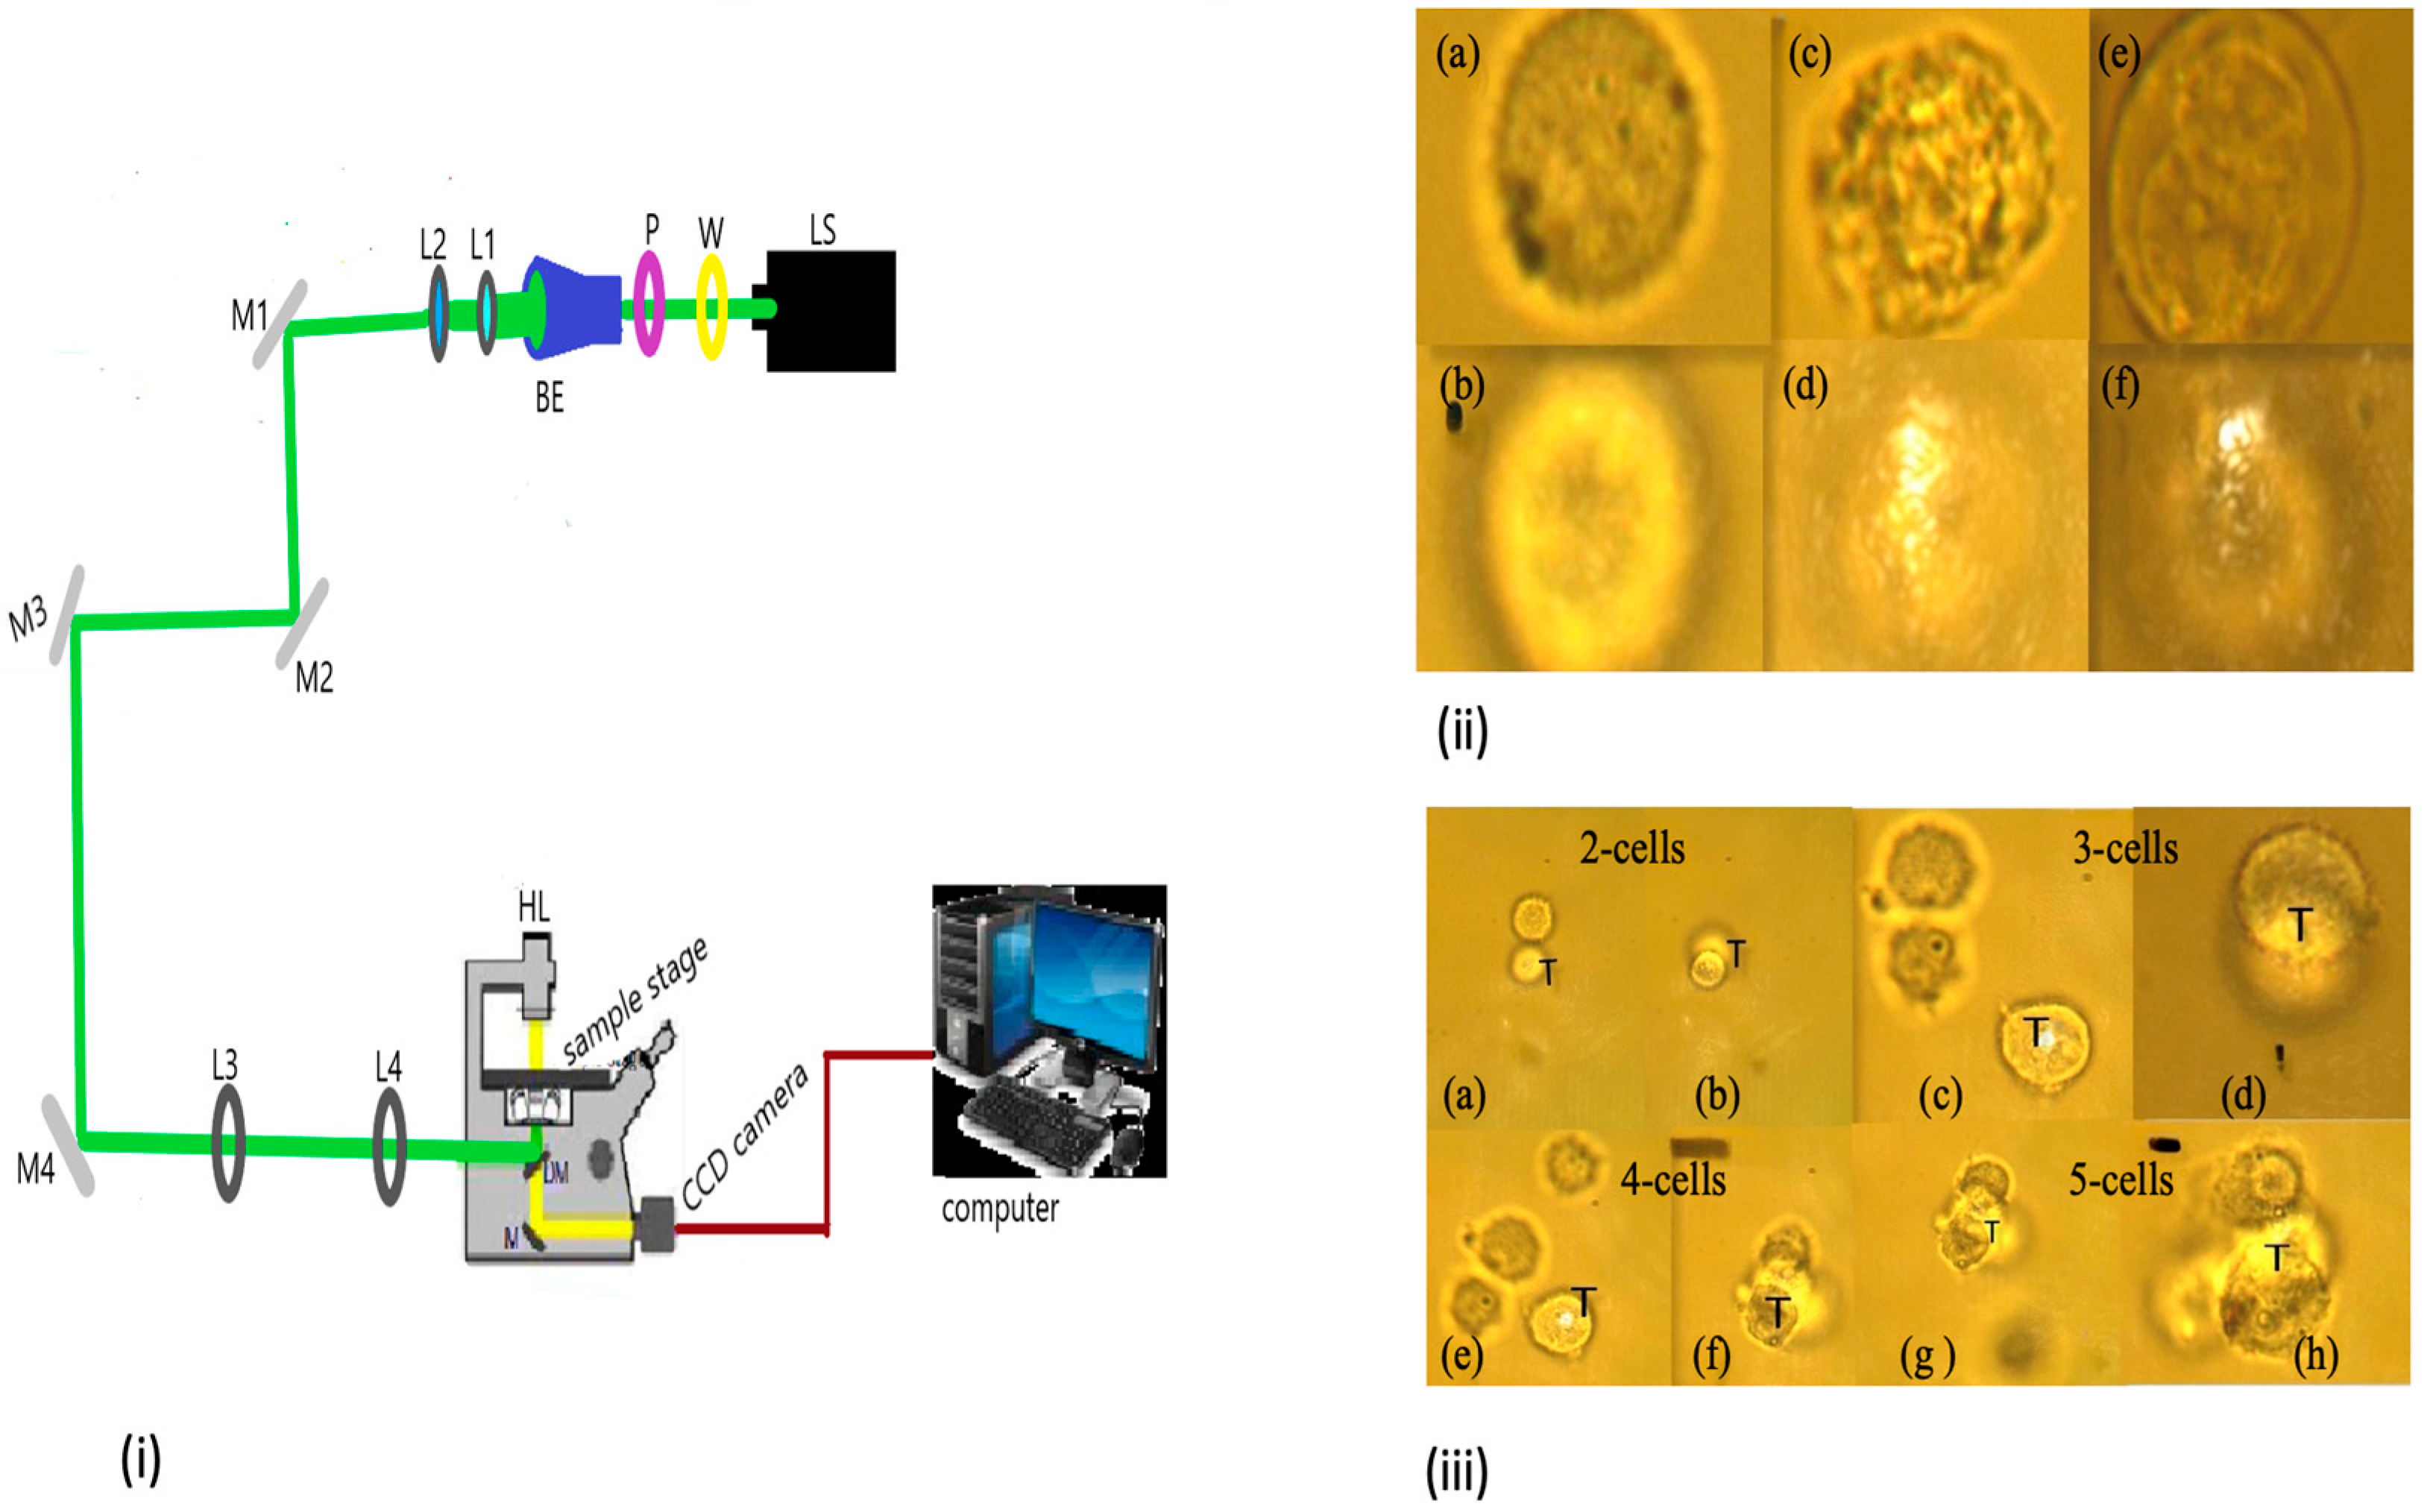
2.4. Laser Trapping and Ionization Setup

Our laser trapping apparatus, depicted in Figure 1i, uses a 1064 nm laser and an inverted microscope with a high numerical aperture objective lens. This setup allows precise control over the laser for trapping and ionization, consistent with methodologies from recent studies [18,19,20,21,22,23,24,25]. The real live successive images illustrating this process are shown in Figure 1ii for single ionization (a,b) for untreated, (c,d) for 2-h treated, and (f,g) for 24-h treated and similar in Figure 1iii for multiple cell ionization.

2.5. Quantitative Analysis and Comparison

To determine the threshold ionization energy, we need to measure the diameter of each cell group. ImageProplus6 programming software is used to carry out this measurement. A 7.27 × 10⁻⁸ m/pixel conversion factor was discovered using 3.1 μ m silicon beads. We calculated the TIE and TRD for BT20 cells, comparing these with data for 4T1 and N2a cells. The mass M c of each cell was calculated through Equation (1) and using the commonly recognized cancer cell density, ρ = 1000   k g / m 3 [46,47,48], and V c is the volume:
M C = ρ V c
The TIE was calculated as:
T I E = A c A b P I P t T
where A c is the cross-sectional area of the cell, A b is the beam size at the trap location, P I = 0.886   W is the average incident power, P t = 0.74   W is the average transmitted power, and T is the ionization period. The ionization period and was found using the digital camera image grabbing rate and several images captured during the time each cell entered and got ejected from the trap. A c is the beam size that was determined at the trap location from the numerical aperture of the objective lens [44]. The TRD was determined by:
T R D   = T I E M C
These calculations allowed for assessing the minimum radiation energy required for irreversible damage to the cells.

2.6. Mechanistic Insights and Comparative Analysis

The study compares ionization thresholds among BT20, 4T1, and N2A cells, focusing on membrane lipid composition’s role in susceptibility to laser-induced ionization, as detailed in references [18,25]. Although assays like gammaH2AX foci analyses, cell proliferation colorimetric assays, and apoptosis assessments (including TUNEL staining and FACS analyses) offer important perspectives on radiation’s impact and mechanisms [49,50,51], in our experiments, cell rupture is the ultimate measure for evaluating cell survival. The critical threshold of ionization energy leading to cell mortality is defined by the quantum of radiation energy a cell absorbs from the instant it is captured in the trap to the moment it exits. This absorbed energy directly correlates with the capability of our laser trapping setup to induce cell death, marking cell rupture as a direct and conclusive indicator of cell viability within our study framework.

2.7. Summary

By combining laser trapping ionization techniques with a comprehensive analysis framework, including both the calculation of TIE and TRD and the integration of additional cellular assays, our study delivers a nuanced understanding of the differential susceptibilities of cancer cell lines to ionization. This multifaceted approach enriches our insights into targeted therapeutic strategies against cancer.

3. Results and Discussion

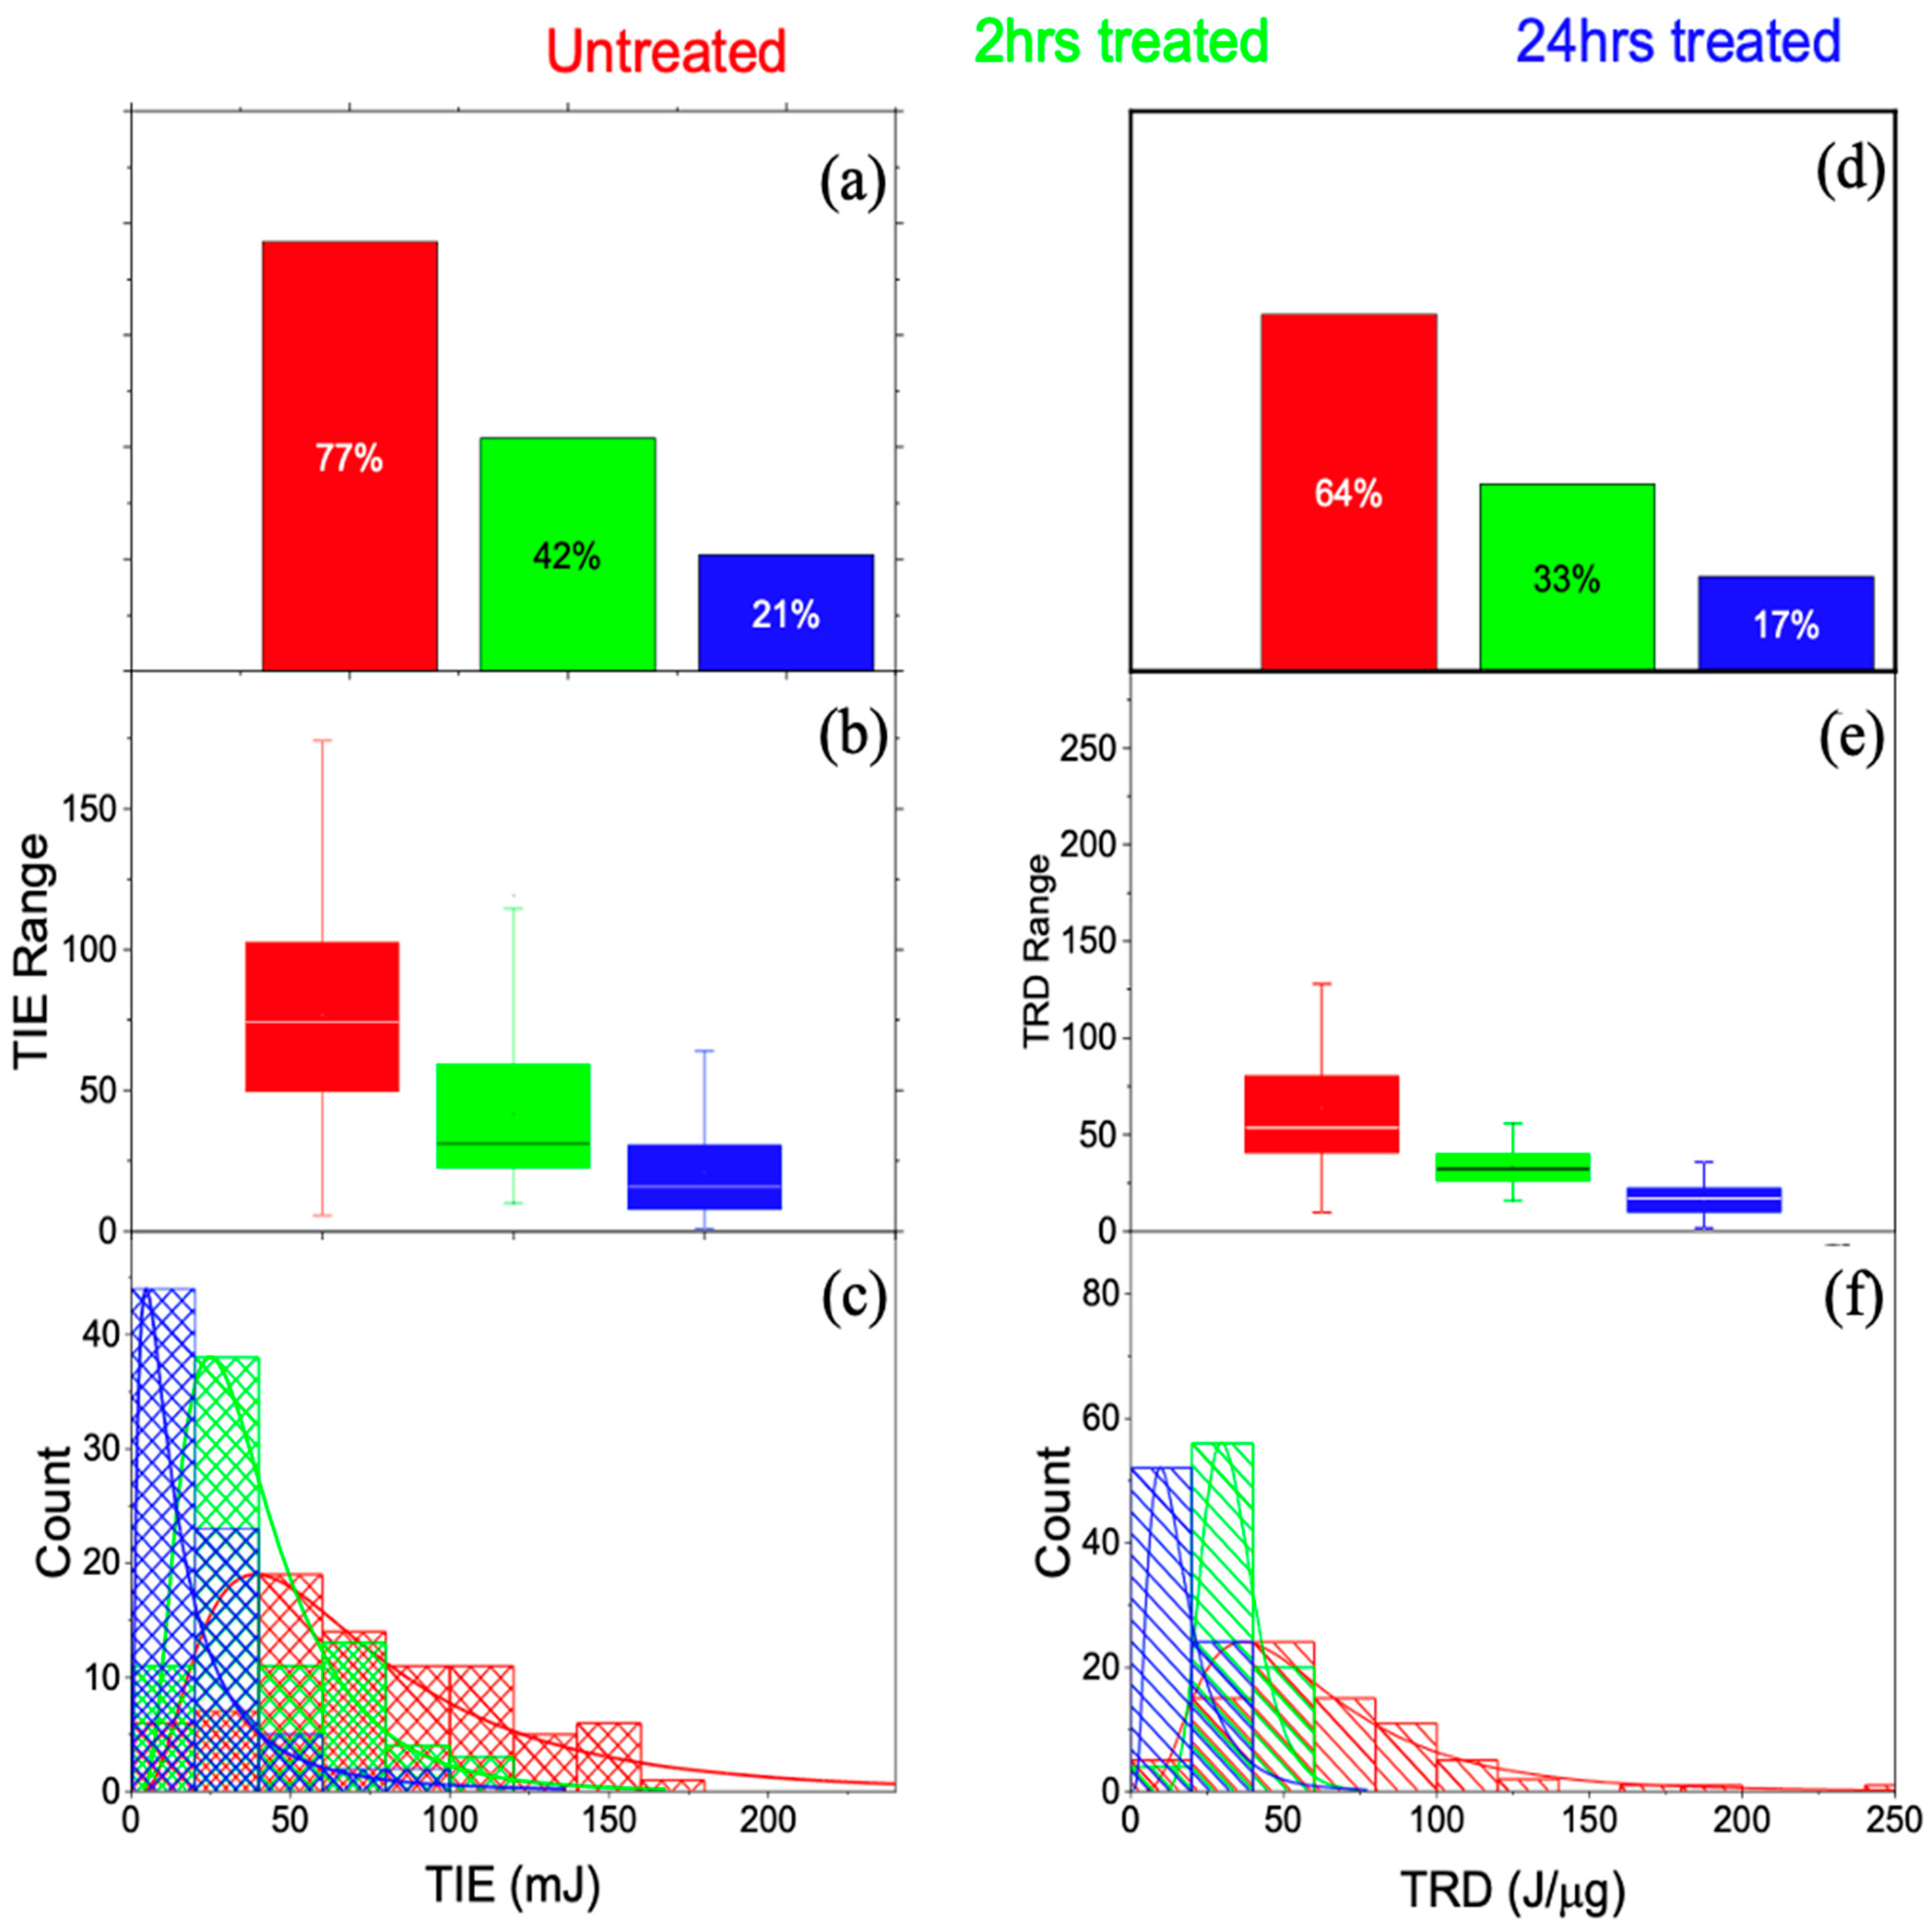
3.1. Single-Cell Ionization

A total of 80, 80, and 76 BT20 cells from the untreated, 2-h, and 24-h treated groups were analyzed, respectively. Figure 2 shows the basic statistical parameters for each group, such as mean diameter (D), ionization time (T), cross-sectional area (Ac), volume (Vc), mass (Mc), TIE, and TRD. The average ionization time is calculated and displayed in Figure 2.
No significant differences were observed in their values, which resulted in similar values for average masses in the three groups. A similar closeness was observed with 4T1, and the variations in response to radiation for the three groups were attributed to the inherent biochemical structure differences caused by the dose and period of treatment of DMDD [18]. As the treatment period increases, the ionization time decreases. The absorbed threshold energy is calculated from the ionization time, each cell and beam area ratio, and the power transmitted ( P t ).
Figure 2a–c illustrates the TIE statistical distributions for each cell group via bar graphs, box plots, and histograms. The untreated group is indicated in red, the 2-h treated group in green, and the 24-h treated BT20 cells in blue. The distributions and mean values show the treated groups have a lower TIE compared to the untreated group. This effect is amplified with an increase in the duration of treatment, as observed from the lower TIE for the 24-h treated group compared to the 2-h treated group, as shown in Figure 2b. The bar graph in Figure 2a shows that the TIE for untreated BT20 cells makes up 77% of the Bar, whereas the 2-h and 24-h treated BT20 cells cover 42% and 21%, respectively.
Different cell groups absorbed varying amounts of TRD, calculated per unit mass. Figure 2d–f displays color-coded results per group. The average TRD absorption was 63.66 ± 39.44 J/μg for untreated, 33.38 ± 9.04 J/μg for 2-h treated, and 16.93 ± 7.62 J/μg for 24-h treated groups, with corresponding reductions of 64%, 33%, and 17% as shown in Figure 2d. This figure also indicates that DMDD-treated BT20 cells received lower radiation doses compared to untreated cells. Additionally, Figure 2e demonstrates that longer DMDD treatment further reduces radiation doses.
The results’ validity for TIE and TRD was confirmed by statistical analysis. In this case, Fcrit(2,15) = 3.68 at 0.05. Since F = 43.4 > 3.68, the results are significant; the p-value for this test is almost zero (see Table 1). Thus, we can conclude that there is strong evidence that the expected values in the three groups are different.
The relationship between ionization radiation energy and cell mass was examined using BT20 cells, employing TIE and TRD as metrics. Consistent with prior findings for 4T1 cancer cells [18], we observed an increase in TIE with cell mass across all examined groups. Specifically, BT20 cells subjected to a 24-h treatment exhibited the lowest TIE in comparison to other treated groups. Furthermore, the TRD, when plotted against mass, revealed that treated cells generally presented a lower TRD. This analysis also suggests an inverse correlation between TRD and mass for BT20 cells across all groups.

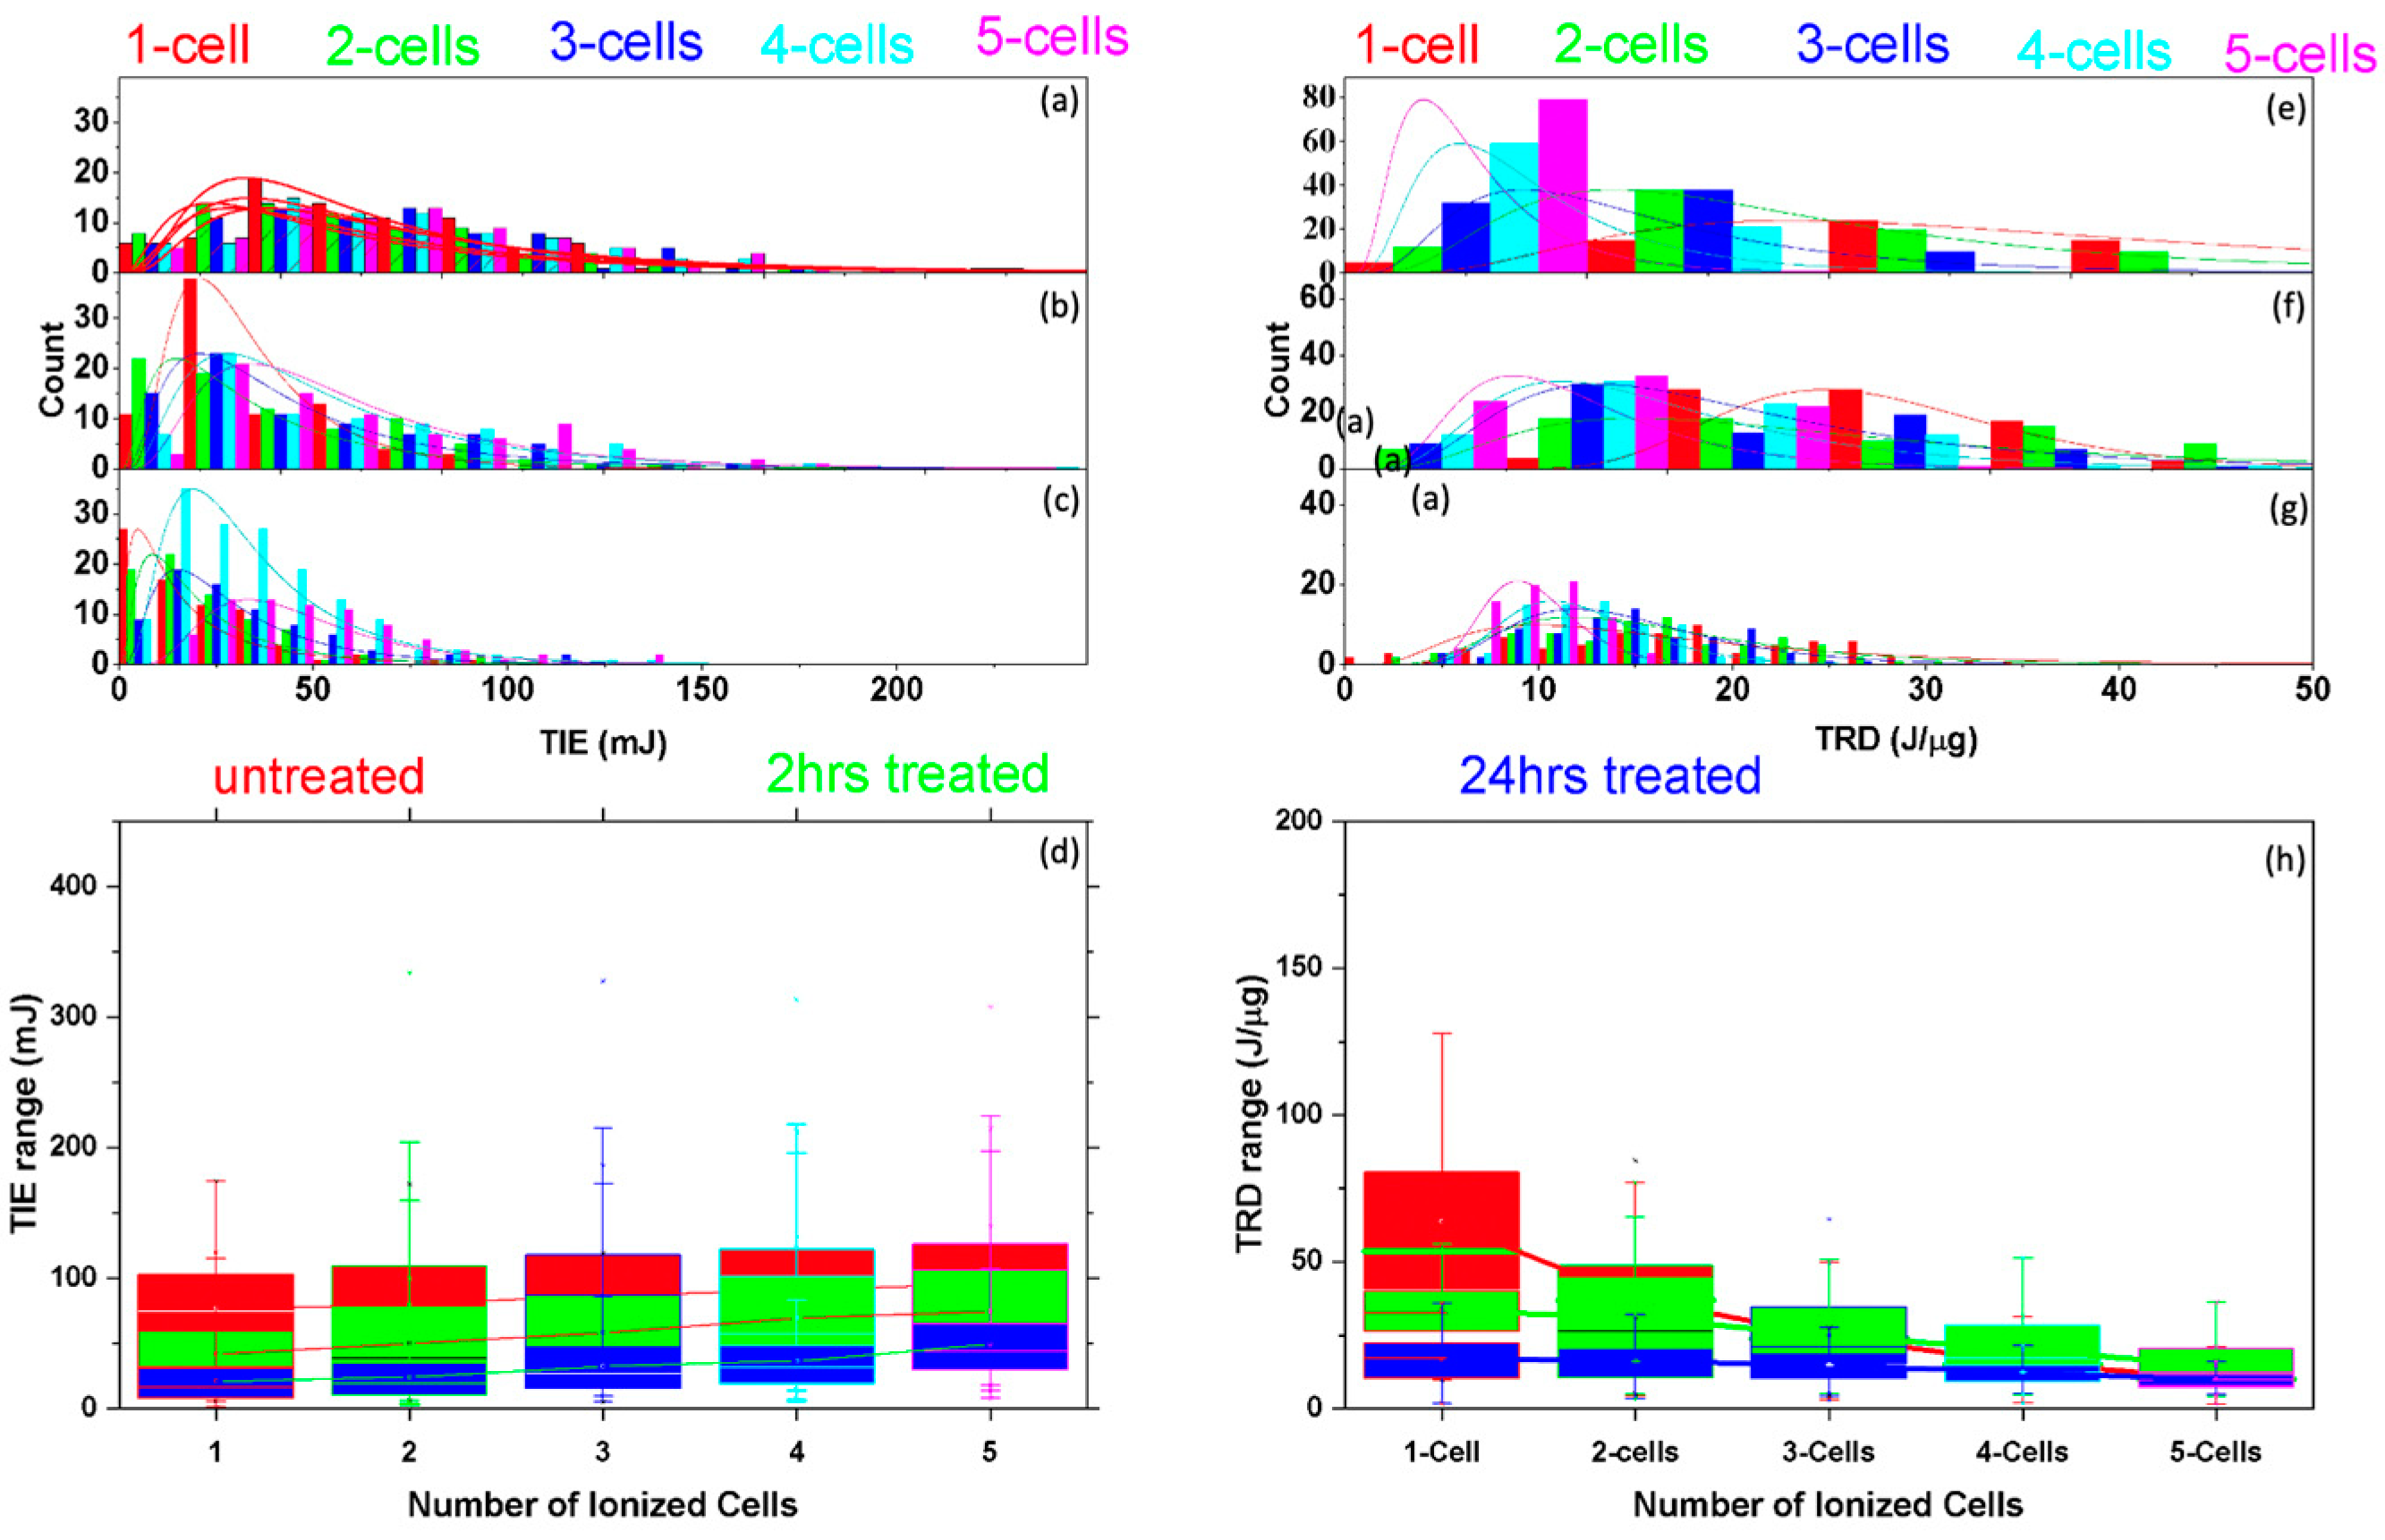
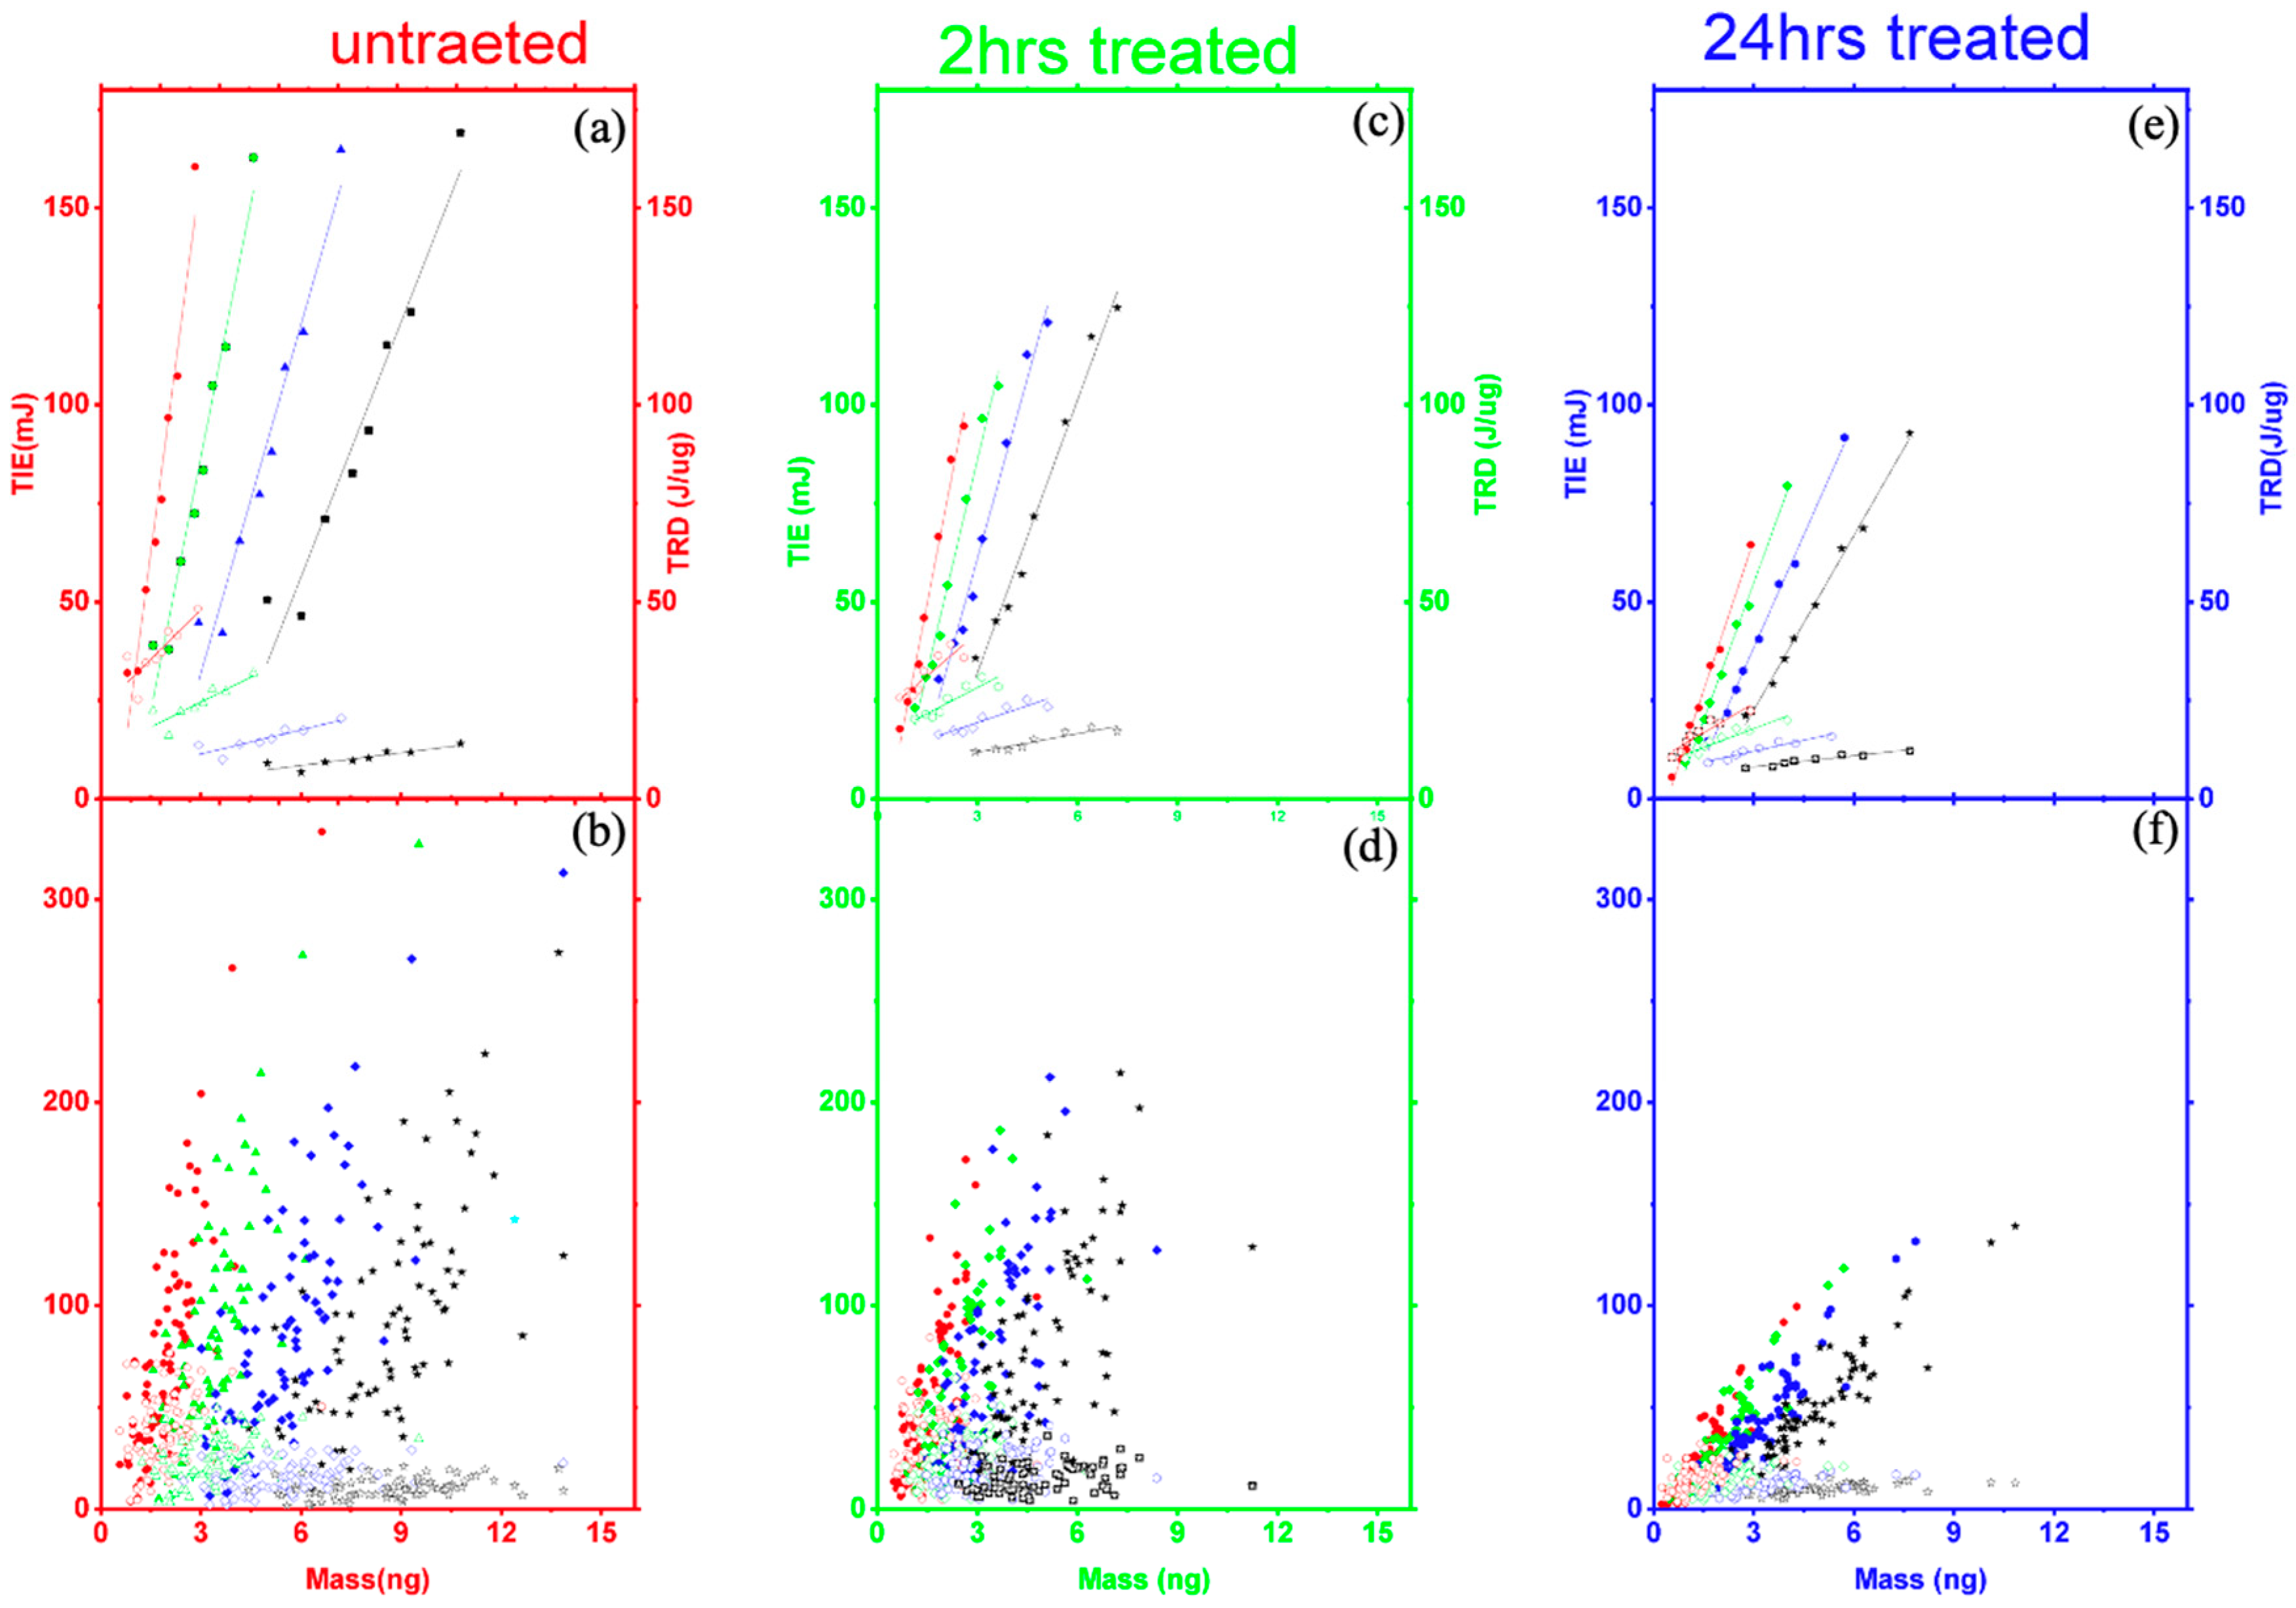
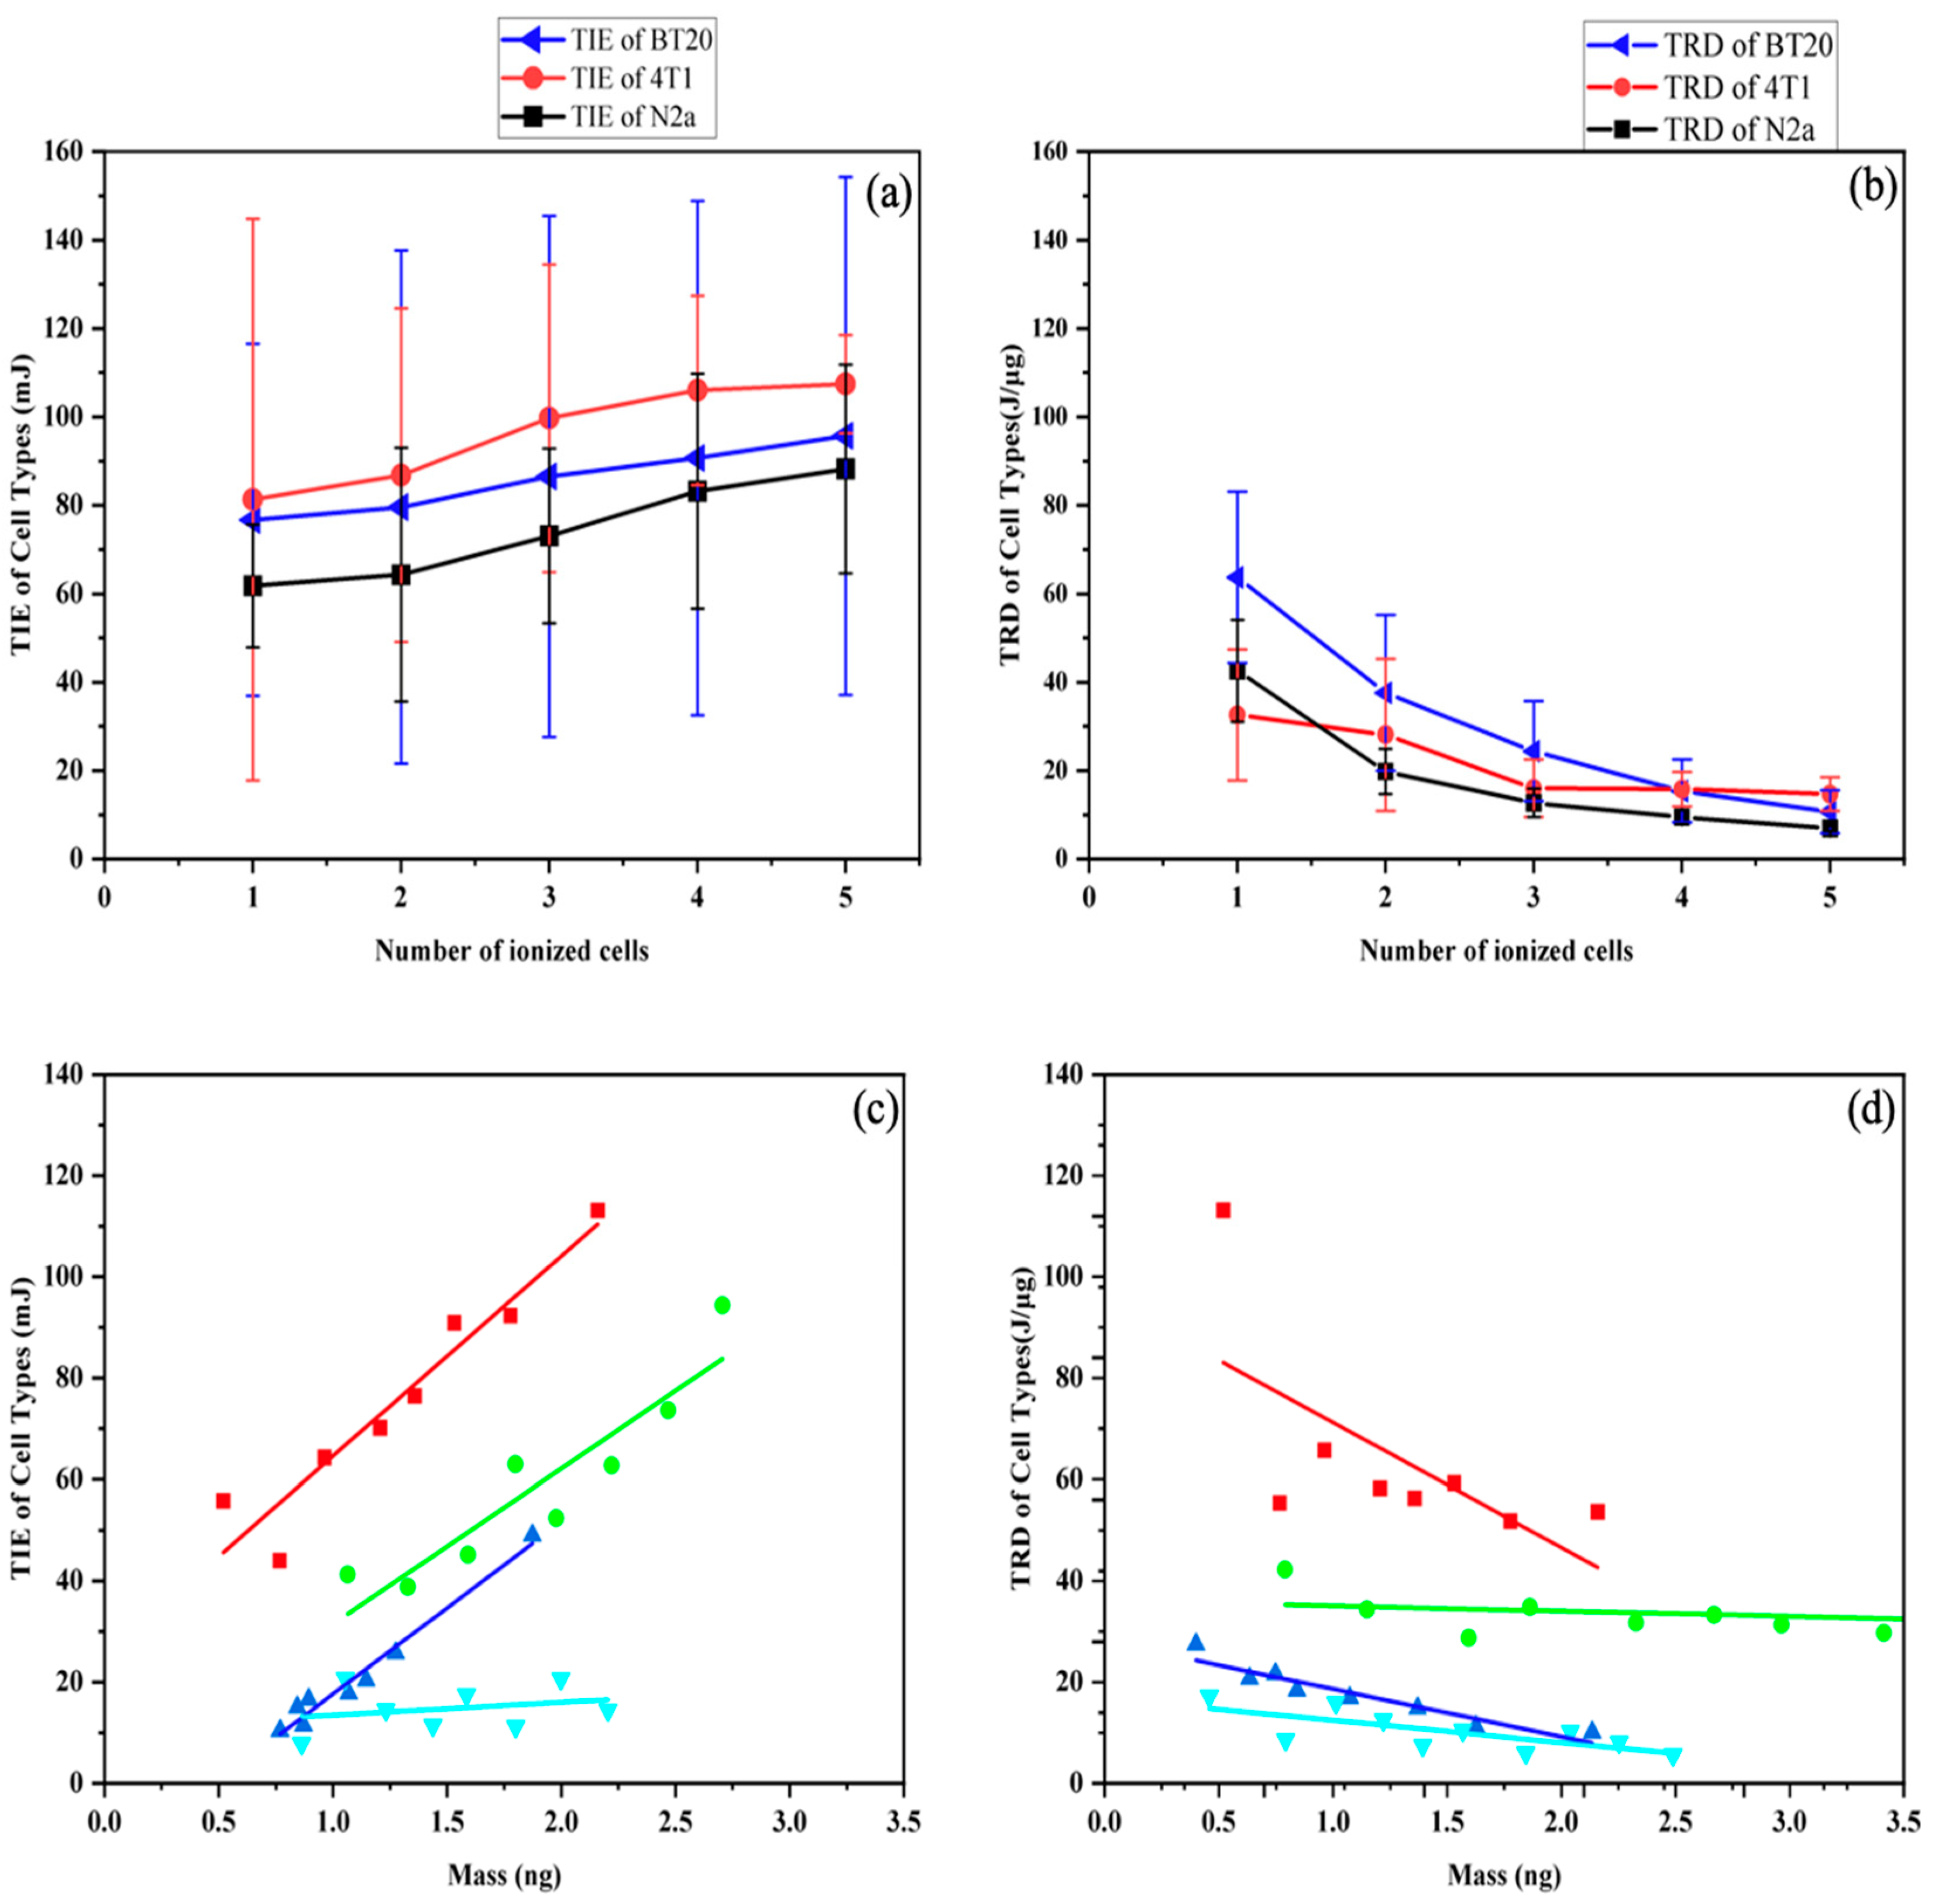
3.2. Multiple Cell Ionization

Until the cell was fully ionized and trapped, we kept it isolated from the others for the single-cell study. Compared to other small cells, such as RBCs, cancer cells have a longer ionization period which makes the procedure somewhat challenging [18,19,20,21,22,23,24,25]. The strong gradient force attracts the nearby cells, which causes them to enter the trap at different times. This results in multiple cells in the trap. However, all the cells eject at the same time after ionization.
The goal was to calculate the TIE and TRD for multiple cells for the untreated control, 2-h, and 24-h treated groups. Here we investigated whether the TIE and TRD change as cells are added to the trap as the first cell experience membrane breakdown as charge builds up from radiation exposure.
As a result, we formed five subgroups (1-cell, 2-cells, 3-cells, 4-cells, and 5-cells) based on the number of cells present in the trap during the ionization period in each untreated control group, the 2-h treated group and the 24-h treated group. In multiple-cell ionization, the cells may enter the trap at different times, but all cells leave the trap simultaneously. As such, we calculated the ionization period (T) for all the various subgroups from the image of the cell as it enters to when they simultaneously leave the trap. The TIE, which is the energy absorbed, is calculated using Equation (2). We determine the cell’s mass in the trap during multiple ionization phases by assuming the same density in single ionization but we replaced Vc with the Vsum (the sum of the volume of the individual cells in the subgroups) so that Mc in Equation (1) becomes Msubgroup = ρVsum.
We display the results using a histogram and the box-and-whisker plot of the TIE and TRD in Figure 3 (the left histograms are for the TIE, and the right side is for the TRD). The control group is Figure 3a, 2 h treated is Figure 3b, and 24 h treated is Figure 3c. A one-cell subgroup, a two-cell subgroup, a three-cell subgroup, a four-cell subgroup, and a five-cell subgroup are represented by pink, yellow, orange, navy, and cyan, respectively, in each histogram. In the left side of Figure 3a–c, we observed the shift in the peak values to the right, which indicates that the TIE is increasing with the number of cells in the trap consistently for control, 2-h, and 24-h treated groups. The box-and-whisker plot displays this in Figure 3d.
The summary of the values for the basic statistical parameters for the TIE is given in Table 2. The average TIE for the five subgroups (1-cell to 5-cells) increases with the number of cells regardless of treatment. A quantitative comparison was made between the subgroups (1–5 cells) and the two groups by analyzing the relative TIE percentage increase. Concerning the single cell, we would expect 200–500% relative increases in the TIE for either of the three groups after removing the effects of intracellular electrical and thermal interactions resulting from the radiation field.
Nevertheless, we found values were 3.8%, 12.8%, 18.3%, and 24.8% (untreated), 19.5%, 38.7%, 66.8%, and 78.9% (two-hours treated), and 15.8%, 54.8%, 96.1% and 134.8% (24-h treated). The results of the TIE in multiple-cell ionization indicate that intracellular electrical and thermal effects result from infrared radiation. For the multiple cells corresponding to the treated groups and the control group, relative comparisons showed 37.5%, 33.2%, 23.5%, and 22.1% in the 2-h treated group, and 69.7%, 62.7%, and 54.9% in the 24-h treated group. These values are lower than the corresponding values for the control group. Here, we confirm that the DMDD treatment activates the augmented cell’s reactive response.
The corresponding TRD is displayed in the graphs with the same color coding on the right side of Figure 3. We observed a shift to the left in the TRD distribution curves in all three groups–control (Figure 3a), 2-h (Figure 3b), and 24-h (Figure 3c) treated. This indicates a decrease in TRD as the number of cells in the trap increased. The box-and-whisker plot in Figure 3d for control (red), 2-h (green), and 24-h treated (blue) displays this result. Table 2 summarizes the basic statistical parameters in the TRD. A consistent decrease in the TRD value can be observed as the number of cells in the trap increases from 1 to 5 cells: 63.66–10.74 J/µg for the control; 33.38–10.39 J/µg for the 2-h treated; and 16.93–9.81 J/µg for the 24-h treated.
According to the results of the study, the average TRD of multiple cells (2–5) decreased by 40.9% when untreated; 6.8%, 26.2%, 39.9%, and 68.9% when treated for 2 h; and 4.7%, 12.8%, 27.2%, and 42.1% when treated for 24 h. Compared to single-cell ionization, multiple-cell ionization (2–5 cells) shows a significant impact on radiation dosimetry, which can be applied to chemo and hyperthermia treatments together. Multiple cells (2–5 cells) entering the trap can be explained by the same statistical analysis as a single cell entering the trap. Figure 4 shows the results for the control ((a) and (b)), 2-h ((c) and (d)) and 24-h ((e) and (f)) treatments. These graphs illustrate the TIE and the TRD, respectively, on the left and right axes. A color scheme is also displayed in the TIE and TRD graphs for the number of cells in the trap: (two cells (yellow), three cells (orange), four cells (Navy), and five cells (Cyan)) with symbols corresponding to the color scheme for TIE.
In the bottom row (b,d,f), we show all the calculated data for TIE and TRD vs. mass, while the top row (a,c,e) shows reduced data obtained from a similar linear fit procedure for single cells. According to the linear fit (solid for TIE and dotted for TRD) for the reduced data in Figure 4a,c,e which agrees with the results for the single cell, the TIE in multiple-cell ionization increases with mass and the TRD decreases with mass.
In the context of cell ionization, a minimal TRD can result from a combination of gradual charge accumulation and a temperature increase due to infrared radiation. Radiation effectively destroys cancer cells by damaging their DNA, with the energy delivered being sufficient to cause dielectric breakdown, indicating enough ionization energy is present. Evidence suggests that the TIE or TRD may be modified through the synergistic use of chemotherapy and hyperthermia. Absent radiation, a basic cellular model, like that of a BT20 cell, can be represented as a dielectric sphere with assorted electric dipoles. Laser radiation’s rapidly fluctuating electric field prompts these dipoles to align with the field’s polarization, leading to the fracture of weaker dipoles and subsequent cell charging [38].
Cells contain atoms with varying dipole moments, resulting in diverse dynamic energies and fragmentation times. Charge accumulation within cells is a time-dependent process influenced by the uneven electric fields from a Gaussian laser beam, peaking at the center. This varying field facilitates gradual charge buildup, affecting the threshold radiation dose as cells sequentially ionize upon entering the trap. Radiation induces dielectric breakdown in cells, causing charge accumulation and subsequent cell ionization damage. Consequently, TRD diminishes with increasing cell numbers.

3.3. Mechanistic Framework

The foundational framework used for conducting a single or multiple-cell ionization by laser trapping for BT20 is discussed here.

3.3.1. Threshold Ionization Energy and Radiation Dose Theory

A cell’s basic model is a spherical shell of a dielectric nature composed of phospholipid bilayer membranes with bounded charges. These bound charges can become extremely polarized in a strongly applied electric field. The dipoles in the material align with the electric field due to the force of an external electric field (Eo). This is because any dipole out of phase with the applied electric field experiences torque. Furthermore, the cell membrane is conductive as the potential difference is set across it due to the separation because of the oscillating external electric field. The gradual build-up of charges results in the total dielectric breakdown causing BT20 to be ejected as electric force now overcomes the trapping force [19].

3.3.2. The Mechanism of Cell Ionization

While the absorbed light can cause heating in both the particle and its surrounding medium [35]—potentially leading to cell charging by affecting ion mobility and cell membrane properties—it is also crucial to consider non-thermal ionization pathways [30,31,32,33,34]. These can occur due to interactions between the NIR laser pulses and the cell, independent of heat.
It is essential to understand the role of the membrane lipid layers in cancer cells to achieve these objectives. The primary composition of cell membranes is lipids with a hydrophilic head and two hydrophobic tails derived from fatty acids that are joined by an alcohol residue to form a sheet-like bilayer structure. There is an increased “rate” of “de novo” synthesis and turnover of membrane lipids in cancer cells. These thousands of lipid molecules play essential roles in biological processes such as signaling and metabolic pathways [52,53].
Changes in membrane lipid components can alter the activity of membrane proteins responsible for ion channels, transporters, receptors, signal transducers, and enzyme activity [53,54] and profoundly affect cell properties and functioning [40,55]. The lipid layers breakdown that is responsible for the ionization of the cells by radiation is better explained from the sheet-like bilayer structure of these lipid layers. When this bilayer structure contacts water, the polar head of the bilayer structure dissolve the ions surrounding the bilayer, making the cell membrane act as a capacitor. The concentration gradient of these ions across the “capacitor-like” membrane forms an electrostatic potential difference across the cell.
When the cell is exposed to an external electric field, it polarizes the cell membrane creating a torque due to the misalignment of the induced dipoles. Thus, the membrane structure is rearranged into aqueous pores, increasing the membrane’s conductivity and permeability, and enabling water and molecular transport to the cell, known as reversible electroporation [56,57,58]. However, exposure to a rapidly oscillating high electric field (for example, from high-intensity radiation from the laser trap) prevents the membrane from resealing. The electrons are pulled apart from the atom to ionize the cell permanently. As a result, the gradual intense charge buildup leads to an electrostatic force that exceeds the intensity gradient trap force, and at this instant, the cell is ejected from the trap [19].

4. The Comparison with N2a and 4T1 Cells Lines

This section presents the TIE and TRD versus mass values of single and multiple ionization using laser trapping. Figure 5 illustrates the results of the three experiments on N2a (black), BT20(blue), and 4T1 (red) untreated cancer cells TIE and TRD values vary with the number of cells in the trap. TIE increased with the cell number in all three cell lines (see Figure 5a). N2a cells are on average smaller than breast cancer cells, which explains the difference in the TIE energy. The trend in TRD is comparatively similar for all three cells (see Figure 5b). As each cell enters the trap, undergoes membrane breakdown, and accumulates charges due to radiation damage, this study aims to distinguish between the two types of breast cancer cells and N2a. To achieve this goal, we selected five subgroups in the trap during the ionization process in each untreated group from each cell lines and for treated group BT20 and 4T1.
The results for the TIE and TRD for single and multiple cells are displayed in Figure 5a,b untreated cell line respectively. The red color-coded, gray-codes, and blue color-coded scatter plots illustrate the 4T1, N2a and BT20 cell lines, respectively. The data points from Figure 5a indicate that the TIE increases consistently for each cell lines as the number of cells in the trap increases.
In comparing TRD between single cells for BT20, 4T1, and N2a, we found that the TRD decreased with cell mass. The reduction observed in the TRD with increased cell mass is attributed to chain ionization (Figure 5b) [18,19,25]. Our results indicate that, since tumors are clusters of single cells, we can adjust the amount of energy necessary to destroy a tumor based on its size and mass. This adjustment is made by knowing the maximum amount of energy required for single-cell death.
Radiation therapy exploits the fact that cancer cells accumulate gene mutations in DNA and, as a result, may lose DNA repair function compared to normal cells [59,60,61,62]. Furthermore, in radiation therapy, the therapeutic ratio is the maximum radiation dose that kills cancer cells locally. A low acute and late morbidity is associated with the minimum radiation dose in normal tissues [63]. Single-cell ionization is used to determine how much energy is required to kill a specific cell. Thus, the maximum ionization energy required for a single cancer cell is required for safe radiation dosing. Therefore, Figure 5b demonstrates that there is a way forward in radiation therapy for more effective treatment plans, as seen in the fact that the TRD decreases with the increase of cell mass for all three cancer lines.
Now, we consider the effects of oligostilbenes on TIE and TRD for BT20 and 4T1 in Figure 5c,d. Figure 5c displays TIE scatter plots with linear fitted lines, while Figure 5d displays TRD. The untreated (green) and 24-h treated (cyan) 4T1 cancer cells groups, as well as the untreated (red) and 24-h treated (blue), BT20 cancer cells groups, are shown in Figure 5c,d. Comparing 4T1 and BT20 cancer cells, the untreated 4T1 cells had a mean TIE of 81 ± 64 mJ, reducing to 24 ± 20 mJ after 24-h treatment. For BT20 cells, the values were 76 ± 39 mJ untreated and 20 ± 18 mJ treated. The relative TIE reduction was 6.17% in untreated cells and 16.67% in treated cells. The mean TRD for untreated 4T1 cells was 33 ± 15 J/μg, dropping to 10 ± 6 J/μg post-treatment, while for BT20 cells, it was 64 ± 39 J/μg untreated and 17 ± 7 J/μg treated. The TRDs from BT20 and 4T1, both treated with oligostilbenes, were further reduced compared to the untreated cells. This means that the chain ionization effect occurring in the presence of multiple cells and treatment of oligostilbenes will optimize the therapeutic ratio as demonstrated by the reduction in TRD in BT20 and 4T1.
The TIE values differ between 4T1 and BT20 cell lines, possibly due to variations in their chemical and biological properties. For example, 4T1 cells have higher levels of polyunsaturated fatty acids compared to BT20 cells [40]. Figure 5b shows TRD calculations for both cell types, where the distribution curves shift right, indicating lower TRD with more cells. This difference in TRD might relate to each cell line’s distinct charging capacity and the effect of infrared ionization radiation.
While our method demonstrates the potential for highly precise measurements of radiation energy, leading to a promising avenue for optimizing the therapeutic ratio at the cellular level, the observed large standard deviations call for cautious interpretation. These preliminary findings suggest reduced tissue toxicity and enhanced sterilization of cancerous cells, yet further detailed studies are necessary to corroborate these results and refine their application in clinical settings.

5. Conclusions

We examined the effects of 2-Dodecyl-6-methoxycyclohexa-2, 5-diene-1, and 4-dione (DMDD) on BT20 breast carcinoma cells compared to 4T1 cells. We assessed the radiosensitivity of BT20-treated cells and compared it to that of 4T1 and N2a cancer cell lines. To calculate the TIE and TRD, we used the laser-trapping technique developed by Erenso and colleagues [18,19,20,21,22,23,24,25]. We demonstrated here that the antitumor compound DMDD increased the radio sensitivity of BT20, with the most significant difference being that the TRD decreased with increased cell mass. Furthermore, multiple-cell ionization leads to significant reductions in TRD due to the chain effect of the ionizing radiation field, absorption by water molecules at 1064 nm, and the antitumor compound. It is, however, important to note that this study could also be applied in vivo due to the recent advances made in the development of biocompatible nanoparticles for combined modalities in cancer treatment. Recent progress in optical tweezers has afforded researchers the new capability to trap tumors in vivo [64,65]. Thus, this work is a proof of concept allowing to better determination of more tailored and appropriate therapeutic ratios.

Author Contributions

Conceptualization, D.B.E. and M.S.G.; Methodology, D.B.E., M.S.G., G.A. and K.O.E.; Investigation, M.S.G.; Formal Analysis, H.T.C. and M.S.G.; Resources, Y.G., L.C. and D.B.E.; Writing—Original Draft, M.S.G., D.B.E. and H.T.C.; Writing—Review & Editing, H.T.C., G.A., K.O.E., D.B.E. and M.S.G.; Visualization, D.B.E., M.S.G. and H.T.C.; Supervision, D.B.E. and H.T.C.; Funding Acquisition, H.T.C. All authors have read and agreed to the published version of the manuscript.

Funding

United States Department of Education-Minority Science and Engineering Improvement Program (MSEIP), grant number: P120A210055. The content is solely the responsibility of the authors and does not necessarily represent the official views of any of the funding agencies, which had no direct role in designing, conducting, or reporting the study.

Institutional Review Board Statement

Not applicable.

Informed Consent Statement

Not applicable.

Data Availability Statement

The datasets generated during and/or analyzed during the current study are available from the corresponding author on reasonable request.

Acknowledgments

The authors thank Middle Tennessee State University for hosting Mulugeta Setie from Addis Ababa University to collect data for this research.

Conflicts of Interest

The authors declare no conflict of interest.

References

  1. World Health Organization. Global Health Observatory; World Health Organization: Geneva, Switzerland, 2019; Available online: https://who.int/gho/database/en/ (accessed on 21 June 2019).
  2. Bray, F.; Ferlay, J.; Soerjomataram, I.; Siegel, R.L.; Torre, L.A.; Jemal, A. Global cancer statistics 2018: GLOBOCAN estimates of incidence and mortality worldwide for 36 cancers in 185 countries. CA Cancer J. Clin. 2018, 68, 394–424. [Google Scholar] [CrossRef]
  3. Bauer, K.R.; Brown, M.; Cress, R.D.; Parise, C.A.; Caggiano, V. Descriptive analysis of estrogen receptor (ER)-negative, progesterone receptor (PR)-negative, and HER2-negative invasive breast cancer, the so-called triple-negative phenotype: A population-based study from the California cancer Registry. Cancer 2007, 109, 1721–1728. [Google Scholar] [CrossRef] [PubMed]
  4. Sugita, B.; Gill, M.; Mahajan, A.; Duttargi, A.; Kirolikar, S.; Almeida, R.; Regis, K.; Oluwasanmi, O.L.; Marchi, F.; Marian, C.; et al. Differentially expressed miRNAs in triple negative breast cancer between African-American and non-Hispanic white women. Oncotarget 2016, 7, 79274. [Google Scholar] [CrossRef] [PubMed]
  5. Baskar, R.; Lee, K.A.; Yeo, R.; Yeoh, K.W. Cancer and radiation therapy: Current advances and future directions. Int. J. Med. Sci. 2012, 9, 193–199. [Google Scholar] [CrossRef]
  6. Liauw, S.L.; Connell, P.P.; Weichselbaum, R.R. New paradigms and future challenges in radiation oncology: An update of biological targets and technology. Sci. Transl. Med. 2013, 5, 173sr2. [Google Scholar] [CrossRef] [PubMed]
  7. Lane, R.J.; Khin, N.Y.; Pavlakis, N.; Hugh, T.J.; Clarke, S.J.; Magnussen, J.; Rogan, C.; Flekser, R.L. Challenges in chemotherapy delivery: Comparison of standard chemotherapy delivery to locoregional vascular mass fluid transfer. Future Oncol. 2018, 14, 647–663. [Google Scholar] [CrossRef]
  8. Wang, L.; Correa, C.R.; Zhao, L.; Hayman, J.; Kalemkerian, G.P.; Lyons, S.; Cease, K.; Brenner, D.; Kong, F.-M. The effect of radiation dose and chemotherapy on overall survival in 237 patients with stage III non-small cell lung cancer. Int. J. Radiat. Oncol. Biol. Phys. 2009, 73, 1383–1390. [Google Scholar] [CrossRef]
  9. Begg, A.C.; Stewart, F.A.; Vens, C. Strategies to improve radiotherapy with targeted drugs. Nat. Rev. Cancer 2011, 11, 239–253. [Google Scholar] [CrossRef]
  10. Maingon, P.; Govaerts, A.-S.; Rivera, S.; Vens, C.; Shash, E.; Grégoire, V. New challenge of developing combined radio-drug therapy. Chin. Clin. Oncol. 2014, 3, 18. [Google Scholar] [CrossRef]
  11. Yoo, G.S.; Park, W.; Yu, J.I.; Choi, D.H.; Kim, Y.-J.; Shin, K.H.; Wee, C.W.; Kim, K.; Park, K.R.; Kim, Y.B.; et al. Comparison of Breast Conserving Surgery Followed by Radiation Therapy with Mastectomy Alone for Pathologic N1 Breast Cancer Patients in the Era of Anthracycline Plus Taxane-Based Chemotherapy: A Multicenter Retrospective Study (KROG 1418). Cancer Res. Treat. 2019, 51, 1041–1051. [Google Scholar] [CrossRef]
  12. Nguyen, P.T.; Abbosh, A.; Crozier, S. Three-Dimensional Microwave Hyperthermia for Breast Cancer Treatment in a Realistic Environment Using Particle Swarm Optimization. IEEE Trans. Biomed. Eng. 2017, 64, 1335–1344. [Google Scholar] [CrossRef]
  13. Ami, N.; Sato, H.; Hayakawa, Y. Paclitaxel-induced hypothermia and hypoperfusion increase breast cancer metastasis and angiogenesis in mice. Oncol. Lett. 2018, 15, 2330–2334. [Google Scholar] [CrossRef]
  14. Norouzi, H.; Khoshgard, K.; Akbarzadeh, F. In vitro outlook of gold nanoparticles in photo-thermal therapy: A literature review. Lasers Med. Sci. 2018, 33, 917. [Google Scholar] [CrossRef]
  15. Rastinehad, A.R.; Anastos, H.; Wajswol, E.; Winoker, J.S.; Sfakianos, J.P.; Doppalapudi, S.K.; Carrick, M.R.; Knauer, C.J.; Taouli, B.; Lewis, S.C.; et al. Gold nanoshell-localized photothermal ablation of prostate tumors in a clinical pilot device study. Proc. Natl. Acad. Sci. USA 2019, 116, 18590–18596. [Google Scholar] [CrossRef]
  16. Zhang, H.; Chen, J. Current status and future directions of cancer immunotherapy. J. Cancer 2018, 9, 1773–1781. [Google Scholar] [CrossRef] [PubMed]
  17. Malekian, S.; Rahmati, M.; Sari, S.; Kazemimanesh, M.; Kheirbakhsh, R.; Muhammadnejad, A.; Amanpour, S. Expression of Diverse Angiogenesis Factor in Different Stages of the 4T1 Tumor as a Mouse Model of Triple-Negative Breast Cancer. Adv. Pharm. Bull. 2020, 10, 323. [Google Scholar] [CrossRef] [PubMed]
  18. Muhammed, E.; Chen, L.; Gao, Y.; Erenso, D. Chemo treated 4T1 breast cancer cells radiation response measured by single and multiple cells ionization using infrared laser trap. Sci. Rep. 2019, 9, 17547. [Google Scholar] [CrossRef] [PubMed]
  19. Muhammed, E.; Erenso, D.B.; Gao, Y.; Chen, L.; Kelley, M.; Vazquez, C.; Gale, M.; Nichols, C.; Crogman, H.T. Measurement of Charge and Refractive Indices in Optically Trapped and Ionized Living Cells. Tomography 2023, 9, 70–88. [Google Scholar] [CrossRef] [PubMed]
  20. Goangul, M.S.; Solomon, R.M.; Devito, D.L.; Brown, C.A.; Coopper, J.; Erenso, D.B.; Gao, Y.; Pellizzaro, A.; Revalee, J.M.; Crogman, H.T. The Effectiveness of Suffruticosol B in Treating Lung Cancer by the Laser Trapping Technique. Biophysica 2023, 3, 109–120. [Google Scholar] [CrossRef]
  21. Kelley, M.; Gao, Y.; Erenso, D. Single cell ionization by a laser trap: A preliminary study in measuring radiation dose and charge in BT20 breast carcinoma cells. Biomed. Opt. Express 2016, 7, 3438–3448. [Google Scholar] [CrossRef] [PubMed]
  22. Kelley, M.; Devito, D.; Mushi, R.; Aguinaga, M.d.P.; Erenso, D.B. Laser trap ionization for identification of human erythrocytes with variable hemoglobin quantitation. J. Biomed. Opt. 2018, 23, 055005. [Google Scholar] [CrossRef]
  23. Pasquerilla, M.; Kelley, M.; Mushi, R.; Aguinaga, M.D.P.; Erenso, D. Laser trapping ionization of single human red blood cell. Biomed. Phys. Eng. Express 2018, 4, 045020. [Google Scholar] [CrossRef]
  24. Pellizzaro, A.; Welker, G.; Scott, D.; Solomon, R.; Cooper, J.; Farone, A.; Farone, M.; Mushi, R.S.; Aguinaga, M.d.P.; Erenso, D. Direct laser trapping for measuring the behavior of transfused erythrocytes in a sickle cell anemia patient. Biomed. Opt. Express 2012, 3, 2190–2199. [Google Scholar] [CrossRef]
  25. Goangul, M.S.; Stewart, W.C.; Erenso, D.; Crogman, H.T. The radiation response measurement of a single and multiple cell ionization of neuroblastoma cells by infrared laser trap. J. Radiat. Res. 2022, 64, 113–125. [Google Scholar] [CrossRef]
  26. Ashkin, A. Applications of laser radiation pressure. Science 1980, 210, 1081–1088. [Google Scholar] [CrossRef]
  27. Chu, S.; Bjorkholm, J.E.; Ashkin, A.; Cable, A. Experimental observation of optically trapped atoms. Phys. Rev. Lett. 1986, 57, 314. [Google Scholar] [CrossRef]
  28. Neuman, K.C.; Block, S.M. Optical trapping. Rev. Sci. Instrum. 2004, 75, 2787–2809. [Google Scholar] [CrossRef] [PubMed]
  29. Essiambre, R.J. Arthur Ashkin: Father of the optical tweezers. Proc. Natl. Acad. Sci. USA 2021, 118, e2026827118. [Google Scholar] [CrossRef] [PubMed]
  30. Boyd, R. Contemporary Nonlinear Optics; Academic Press: Cambridge, MA, USA, 2012. [Google Scholar]
  31. Keldysh, L.V. Ionization in the field of a strong electromagnetic wave. J. Exp. Theor. Phys. 1965, 20, 1307–1314. [Google Scholar]
  32. Miziolek, A.W.; Palleschi, V.; Schechter, I. (Eds.) Laser Induced Breakdown Spectroscopy; Cambridge University Press: Cambridge, UK, 2006. [Google Scholar]
  33. Dahotre, N.B.; Samant, A. Laser Machining of Advanced Materials; CRC Press: Boca Raton, FL, USA, 2011. [Google Scholar]
  34. Corkum, P.Á.; Krausz, F. Attosecond science. Nat. Phys. 2007, 3, 381–387. [Google Scholar] [CrossRef]
  35. Peterman, E.J.; Gittes, F.; Schmidt, C.F. Laser-induced heating in optical traps. Biophys. J. 2003, 84, 1308–1316. [Google Scholar] [CrossRef] [PubMed]
  36. Yan, S.; Tianen, Y. A study of the radiosensitive effects on mammary carcinoma in mice by Chinese medicine (Salvia plus Astragalus) and aspirin. Chin. J. Cancer Res. 1989, 1, 54–59. [Google Scholar] [CrossRef]
  37. Zhang, P.; Cui, Z.; Liu, Y.; Wang, D.; Liu, N.; Yoshikawa, M. Quality evaluation of traditional Chinese drug toad venom from different origins through a simultaneous determination of bufogenins and indole alkaloids by HPLC. Chem. Pharm. Bull. 2005, 53, 1582–1586. [Google Scholar] [CrossRef] [PubMed]
  38. Gao, Y.; Huang, R.; Gong, Y.; Park, H.S.; Wen, Q.; Almosnid, N.M.; Chippada-Venkata, U.D.; Hosain, N.A.; Vick, E.; Farone, A.; et al. The antidiabetic compound 2-dodecyl-6-methoxycyclohexa-2,5-diene-1,4-dione, isolated from Averrhoa carambola L., demonstrates significant antitumor potential against human breast cancer cells. Oncotarget 2015, 6, 24304–24319. [Google Scholar] [CrossRef] [PubMed]
  39. Chen, C.; Nong, Z.; Xie, Q.; He, J.; Cai, W.; Tang, X.; Chen, X.; Huang, R.; Gao, Y. 2-Dodecyl-6-methoxycyclohexa-2,5-diene-1,4-dione inhibits the growth and metastasis of breast carcinoma in mice. Sci. Rep. 2017, 7, 6704. [Google Scholar] [CrossRef] [PubMed]
  40. He, M.; Guo, S.; Li, Z. In situ characterizing membrane lipid phenotype of breast cancer cells using mass spectrometry profiling. Sci. Rep. 2015, 5, 11298. [Google Scholar] [CrossRef] [PubMed]
  41. Chavez, K.J.; Garimella, S.V.; Lipkowitz, S. Triple negative breast cancer cell lines: One tool in the search for better treatment of triple negative breast cancer. Breast Dis. 2010, 32, 35. [Google Scholar] [CrossRef] [PubMed]
  42. Lasfargues, E.Y.; Ozzello, L. Cultivation of human breast carcinomas. J. Natl. Cancer Inst. 1958, 21, 1131–1147. [Google Scholar]
  43. Pulaski, B.A.; Ostrand-Rosenberg, S. Mouse 4T1 breast tumor model. Current protocols in immunology, American Type Culture Collection (ATCC): BT20 (ATCC HTB-19) Hum. Cells 2000, 39, 20–22. [Google Scholar] [CrossRef]
  44. Wen, Q.; Lin, X.; Liu, Y.; Xu, X.; Liang, T.; Zheng, N.; Kintoko; Huang, R. Phenolic and Lignan Glycosides from the Butanol Extract of Averrhoa carambola L. Root. Molecules 2012, 17, 12330–12340. [Google Scholar] [CrossRef]
  45. Ni, Z.; Lin, X.; Wen, Q.; Kintoko; Zhang, S.; Huang, J.; Xu, X.; Huang, R. Effect of 2-dodecyl-6-methoxycyclohexa-2,5-diene-1,4-dione, isolated from Averrhoa carambola L. (Oxalidaceae) roots, on advanced glycation end-product-mediated renal injury in type 2 diabetic kkay mice. Toxicol. Lett. 2021, 339, 88–96. [Google Scholar] [CrossRef]
  46. Grover, W.H.; Bryan, A.K.; Diez-Silva, M.; Suresh, S.; Higgins, J.M.; Manalis, S.R. Measuring single-cell density. Proc. Natl. Acad. Sci. USA 2011, 108, 10992–10996. [Google Scholar] [CrossRef]
  47. Zhao, Y.; Lai, H.S.S.; Zhang, G.; Lee, G.B.; Li, W.J. Measurement of single leukemia cell’s density and mass using optically induced electric field in a microfluidics chip. Biomicrofluidics 2015, 9, 022406. [Google Scholar] [CrossRef] [PubMed]
  48. Baniyash, M.; Netanel, T.; Witz, I.P. Differences in Cell Density Associated with Differences in Lung-colonizing Ability of B16 Melanoma Cells. Cancer Res. 1981, 41, 433–437. [Google Scholar]
  49. Stenvall, A.; Larsson, E.; Holmqvist, B.; Strand, S.E.; Jönsson, B.A. Quantitative γ-H2AX immunofluorescence method for DNA double-strand break analysis in testis and liver after intravenous administration of 111 InCl 3. EJNMMI Res. 2020, 10, 22. [Google Scholar] [CrossRef] [PubMed]
  50. Mirzayans, R.; Murray, D. Do TUNEL and other apoptosis assays detect cell death in preclinical studies? Int. J. Mol. Sci. 2020, 21, 9090. [Google Scholar] [CrossRef] [PubMed]
  51. Mah, L.J.; El-Osta, A.; Karagiannis, T.C. γH2AX: A sensitive molecular marker of DNA damage and repair. Leukemia 2010, 24, 679–686. [Google Scholar] [CrossRef] [PubMed]
  52. van Meer, G.; de Kroon, A.I. Lipid map of the mammalian cell. J. Cell Sci. 2011, 124, 5–8. [Google Scholar] [CrossRef] [PubMed]
  53. Escribá, P.V.; González-Ros, J.M.; Goñi, F.M.; Kinnunen, P.K.; Vigh, L.; Sánchez-Magraner, L.; Fernández, A.M.; Busquets, X.; Horváth, I.; Barceló-Coblijn, G. Membranes: A meeting point for lipids, proteins and therapies. J. Cell Mol. Med. 2008, 12, 829–875. [Google Scholar] [CrossRef]
  54. Field, C.J.; Thomson, C.A.; Van Aerde, J.E.; Parrott, A.; Lien, E.; Clandinin, M.T. Lower proportion of CD45R0(+) cells and deficient interleukin-10 production by formula-fed infants, compared with human-fed, is corrected with supplementation of long-chain polyunsaturated fatty acids. J. Pediatr. Gastr. Nutr. 2000, 31, 291–299. [Google Scholar]
  55. Volmer, R.; van der Ploeg, K.; Ron, D. Membrane lipid saturation activates endoplasmic reticulum unfolded protein response transducers through their transmembrane domains. Proc. Natl. Acad. Sci. USA 2013, 110, 4628–4633. [Google Scholar] [CrossRef] [PubMed]
  56. Hercules, W.; Lindesay, J.; Coble, A.; Schmukler, R. Electroporation of Biological Cells Embedded in a Polycarbonate Filter; Howard University: Washington, DC, USA, 2003; p. 20059. [Google Scholar]
  57. Neumann, E.; Sowers, A.; Jordan, C. Electroporation and Electrofusion in Cell. Biology 1990, 94, 1048–1049. [Google Scholar]
  58. Chang, D.; Chassy, B.; Saunders, J.; Sowers, A. Guide to Electroporation and Electrofusion; Academic Press: New York, NY, USA, 1992. [Google Scholar]
  59. Bhattacharya, S.; Aroumougame, A. Repurposing DNA repair factors to eradicate tumor cells upon radiotherapy. Transl. Cancer Res. 2017, 6, S822. [Google Scholar] [CrossRef]
  60. Alhmoud, J.F.; Woolley, J.F.; Al Moustafa, A.E.; Mallei, M.I. DNA damage/repair management in cancers. Cancers 2020, 12, 1050. [Google Scholar] [CrossRef] [PubMed]
  61. Jackson, S.P.; Jiri, B. The DNA-damage response in human biology and disease. Nature 2009, 461, 1071–1078. [Google Scholar] [CrossRef]
  62. Nickoloff, J.A.; Lynn, T.; Neelam, S.; Kato, T.A. Exploiting DNA repair pathways for tumor sensitization, mitigation of resistance, and normal tissue protection in radiotherapy. Cancer Drug Resist. 2021, 4, 244. [Google Scholar] [CrossRef]
  63. Yuan, A.; Rao, M.-V.; Nixon, R.-A. Neurofilaments and neurofilament proteins in health and disease. Cold Spring Harb. Perspect. Biol. 2017, 9, a018309. [Google Scholar] [CrossRef]
  64. Zhong, M.C.; Wei, X.B.; Zhou, J.H.; Wang, Z.Q.; Li, Y.M. Trapping red blood cells in living animals using optical tweezers. Nat. Commun. 2013, 4, 1768. [Google Scholar] [CrossRef]
  65. Hason, M.; Bartůněk, P. Zebrafish models of cancer—New insights on modeling human cancer in a non-mammalian vertebrate. Genes 2019, 10, 935. [Google Scholar] [CrossRef]
Figure 1. Display our laser trap set and cell clustering single and multi-cell ionization. (i) Experimental setup: The laser (wavelength 1064 nm and maximum power 8 Watts) power is controlled by the combined action of a half-wave plate (W) and a polarizer (P). The mirrors M1 and M2 redirect the laser beam from the beam expander. The diameter of the emitted beam increases as it leaves the beam expander while two converging lenses (L1 and L2) readjust the beam diameter to fit the diameter of the window of the objective lens. The mirrors M3 and M4 align and redirect the laser beam while M5 functions as a steering mirror that, together with the converging lenses (L3 and L4) controls the trap’s location on the microscope’s focal plane as displayed on a TV screen with cells images. (ii) Single cell ionization: BT20 breast cancer cells imaged before and after trapping: (a,b) for the untreated control; (c,d) for 2-h treated; (e,f) for 24-h treated, respectively. (iii) Multiple cell ionization: for the untreated 2-cells, 3-cells, 4-cells, and 5-cells ionization, the letter (T) represented the trapping point. For 2-cells (a) one is trapped the second is free, (b) both are trapped. For 3-cells (c) one trapped and 2 free, (d) 3 trapped cells. For 4-cells (e) one trapped and 3 free, (f) 4 trapped cells. For 5-cells (g) 4 trapped cells and one free, (h) all five cells trapped.
Radiation 04 00007 g001
Figure 2. The TIE (a–c) and TRD (d–f) graphical statistics for untreated control group (shown in red), 2-h treated group (shown in green), and 24-h treated group (shown in blue) BT20 cells.
Radiation 04 00007 g002
Figure 3. TIE represented in a-c, on the left column and TRD represented in e-j, on the right column in multiple cell ionization. Histograms in each column shows distributions for (a,e) untreated control cells, (b,f) 2-h treated cells, and (c,g) 24-h treated cells. Cells color codes in each histogram: 1-cell (magenta), 2-cells (yellow), 3-cells (orange), 4-cells (navy), and 5-cells (Cyan). (d,h) shows the range distribution of the TIE (left) and TRD (right) in each subgroup (1-cell, 2-cells, 3-cells, 4-cells, and 5-cells) for control (red), 2-h (green), and 24-h (blue) treated cell groups. The solid lines in (d,h) connect the average TIE (left) and TRD (right) for each subgroup in each cell group.
Radiation 04 00007 g003
Figure 4. The correlation between multi-cell TIE and TRD in relation to mass is presented for three distinct scenarios: untreated control (illustrated on the left in panels a,b), 2-h treatment (featured in the center in panels c,d), and 24-h treatment (shown on the right in panels e,f). The legend uses color-coding to represent various cell numbers: 2-cells (red), 3-cells (green), 4-cells (blue), and 5-cells (black). These graphs feature double-y-axes, with TIE represented on the left axis and TRD on the right axis. In the bottom row graphs (b,d,f), the complete dataset is presented for each scenario of multiple-cell ionization (2-cells (red), 3-cells (green), 4-cells (blue), and 5-cells (black)). The TIE against mass is represented with filled markers (circle, triangle, rhombus, star), while the TRD vs. mass is depicted with unfilled markers (rectangle, circle, triangle, star). The top row graphs showcase the corresponding reduced data along with linear fits for both TIE and TRD.
Radiation 04 00007 g004
Figure 5. Multiple cells mean versus the number of cells in a trap comparison for the tree N2a, BT20 and 4T1 cancer cells. (a) TIE. (b) TRD. In each of these scattered line plats, the red color-coded data point represents 4T1 cancer cells with the same color-coded error bars, the blue color-coded data points denote the BT20 cancer cells with the same color-coded error bars and the black one is just N2a cell lines of a mouse neuroblasts with black color -coded error bars. TIE (c) and TRD (d) vs. mass for untreated (red) and 24-h treated (blue) BT-20 breast cancer cells, as well as untreated (green) and 24-h treated (cyan) 4T1 breast cancer cells: reduced data with a linear fit.
Radiation 04 00007 g005
Table 1. Hypothesis of one-way ANOVA.
Homogeneity Variance Test for Untreated, 2 h and 24 h Treated Groups
TIETRD
DFSSMSF-ValueProb. > FDFSSMSF-ValueProb. > F
Model213,342.86671.421.42.9343 ×   10 9 223,704.911,852.543.41.1 ×   10 16
Error23372,635.3311.7 23363,591.1272.9
Mean comparison for untreated (1), 2 h treated (2) and 24 h treated (3) groups
MDSEMq-vProb.αSignLCLUCLMDSEMq-vProb.αLCLUCL
1 vs. 255.94.716.700.05167.144.730.33.7811.30039.221.3
1 vs. 335.14.710.600.05146.124.146.23.8317.20055.837.7
2 vs. 320.84.76.24. ×   10 5 0.0519.631.916.53.836.17.8 ×   10 5 025.57.4
Table 2. The descriptive statistics showing the parameters for the TIE, the mass, and TRD for the 5 subgroups in the untreated, 2-h treated and 24-h treated groups of the BT20 cell line.
Untreated BT20 Group
No# of
Cells
TIE (mJ)Mass (ng)TRD (J/µg)
MeansdMin MaxMeanSDMin MaxMeansdMin Max
18076.739.85.774.31.30.70.31.363.739.49.853.6
28079.658.03.770.71.90.90.61.937.617.64.236.9
38086.558.95.178.93.41.21.23.324.411.32.923.7
48090.758.26.582.75.61.72.55.615.47.11.914.9
58095.758.67.988.58.82.34.48.810.74.81.410.1
2-h Treated BT20 group
TIE (mJ)Mass (ng)TRD (J/µg)
18041.625.89.931.11.20.60.41.033.49.015.932.3
28049.838.56.238.31.50.70.51.331.116.74.726.1
38057.841.39.546.42.20.90.91.924.712.44.920.9
48069.446.613.657.33.31.21.52.920.19.74.616.9
58074.546.217.862.74.91.62.44.410.46.74.112.4
24-h Treated BT20 group
TIE (mJ)Mass (ng)TRD (J/µg)
17620.918.30.915.91.10.60.20.616.97.61.635.8
27624.219.42.319.21.40.70.24.316.16.30.231.9
37632.322.94.826.72.00.90.55.714.85.04.327.5
47640.924.88.735.23.11.20.97.812.33.60.921.5
57648.925.613.443.54.81.61.710.89.82.44.915.9
Disclaimer/Publisher’s Note: The statements, opinions and data contained in all publications are solely those of the individual author(s) and contributor(s) and not of MDPI and/or the editor(s). MDPI and/or the editor(s) disclaim responsibility for any injury to people or property resulting from any ideas, methods, instructions or products referred to in the content.

