Strategic Readiness for AI and Smart Technology Adoption in Emerging Hospitality Markets: A Tri-Lens Assessment of Barriers, Benefits, and Segments in Albania
Abstract
1. Introduction
2. Literature Review
2.1. AI and Smart Technology in Hospitality
2.2. Insights from Emerging Hospitality Markets
2.3. Toward a Tri-Lens Framework: Integrating TOE, TAM, and DOI
3. Materials and Methods
3.1. Theoretical Framework and Research Design
3.2. Instrument Development and Operationalization of Constructs
3.3. Data Collection and Sampling
3.4. Analytical Strategy
4. Results
4.1. Descriptive Statistics: Adoption, Benefits, and Barriers
4.1.1. Adoption of Core Technologies
4.1.2. Adoption of AI and Smart Technologies
4.1.3. Perceived Benefits of AI and Smart Technology
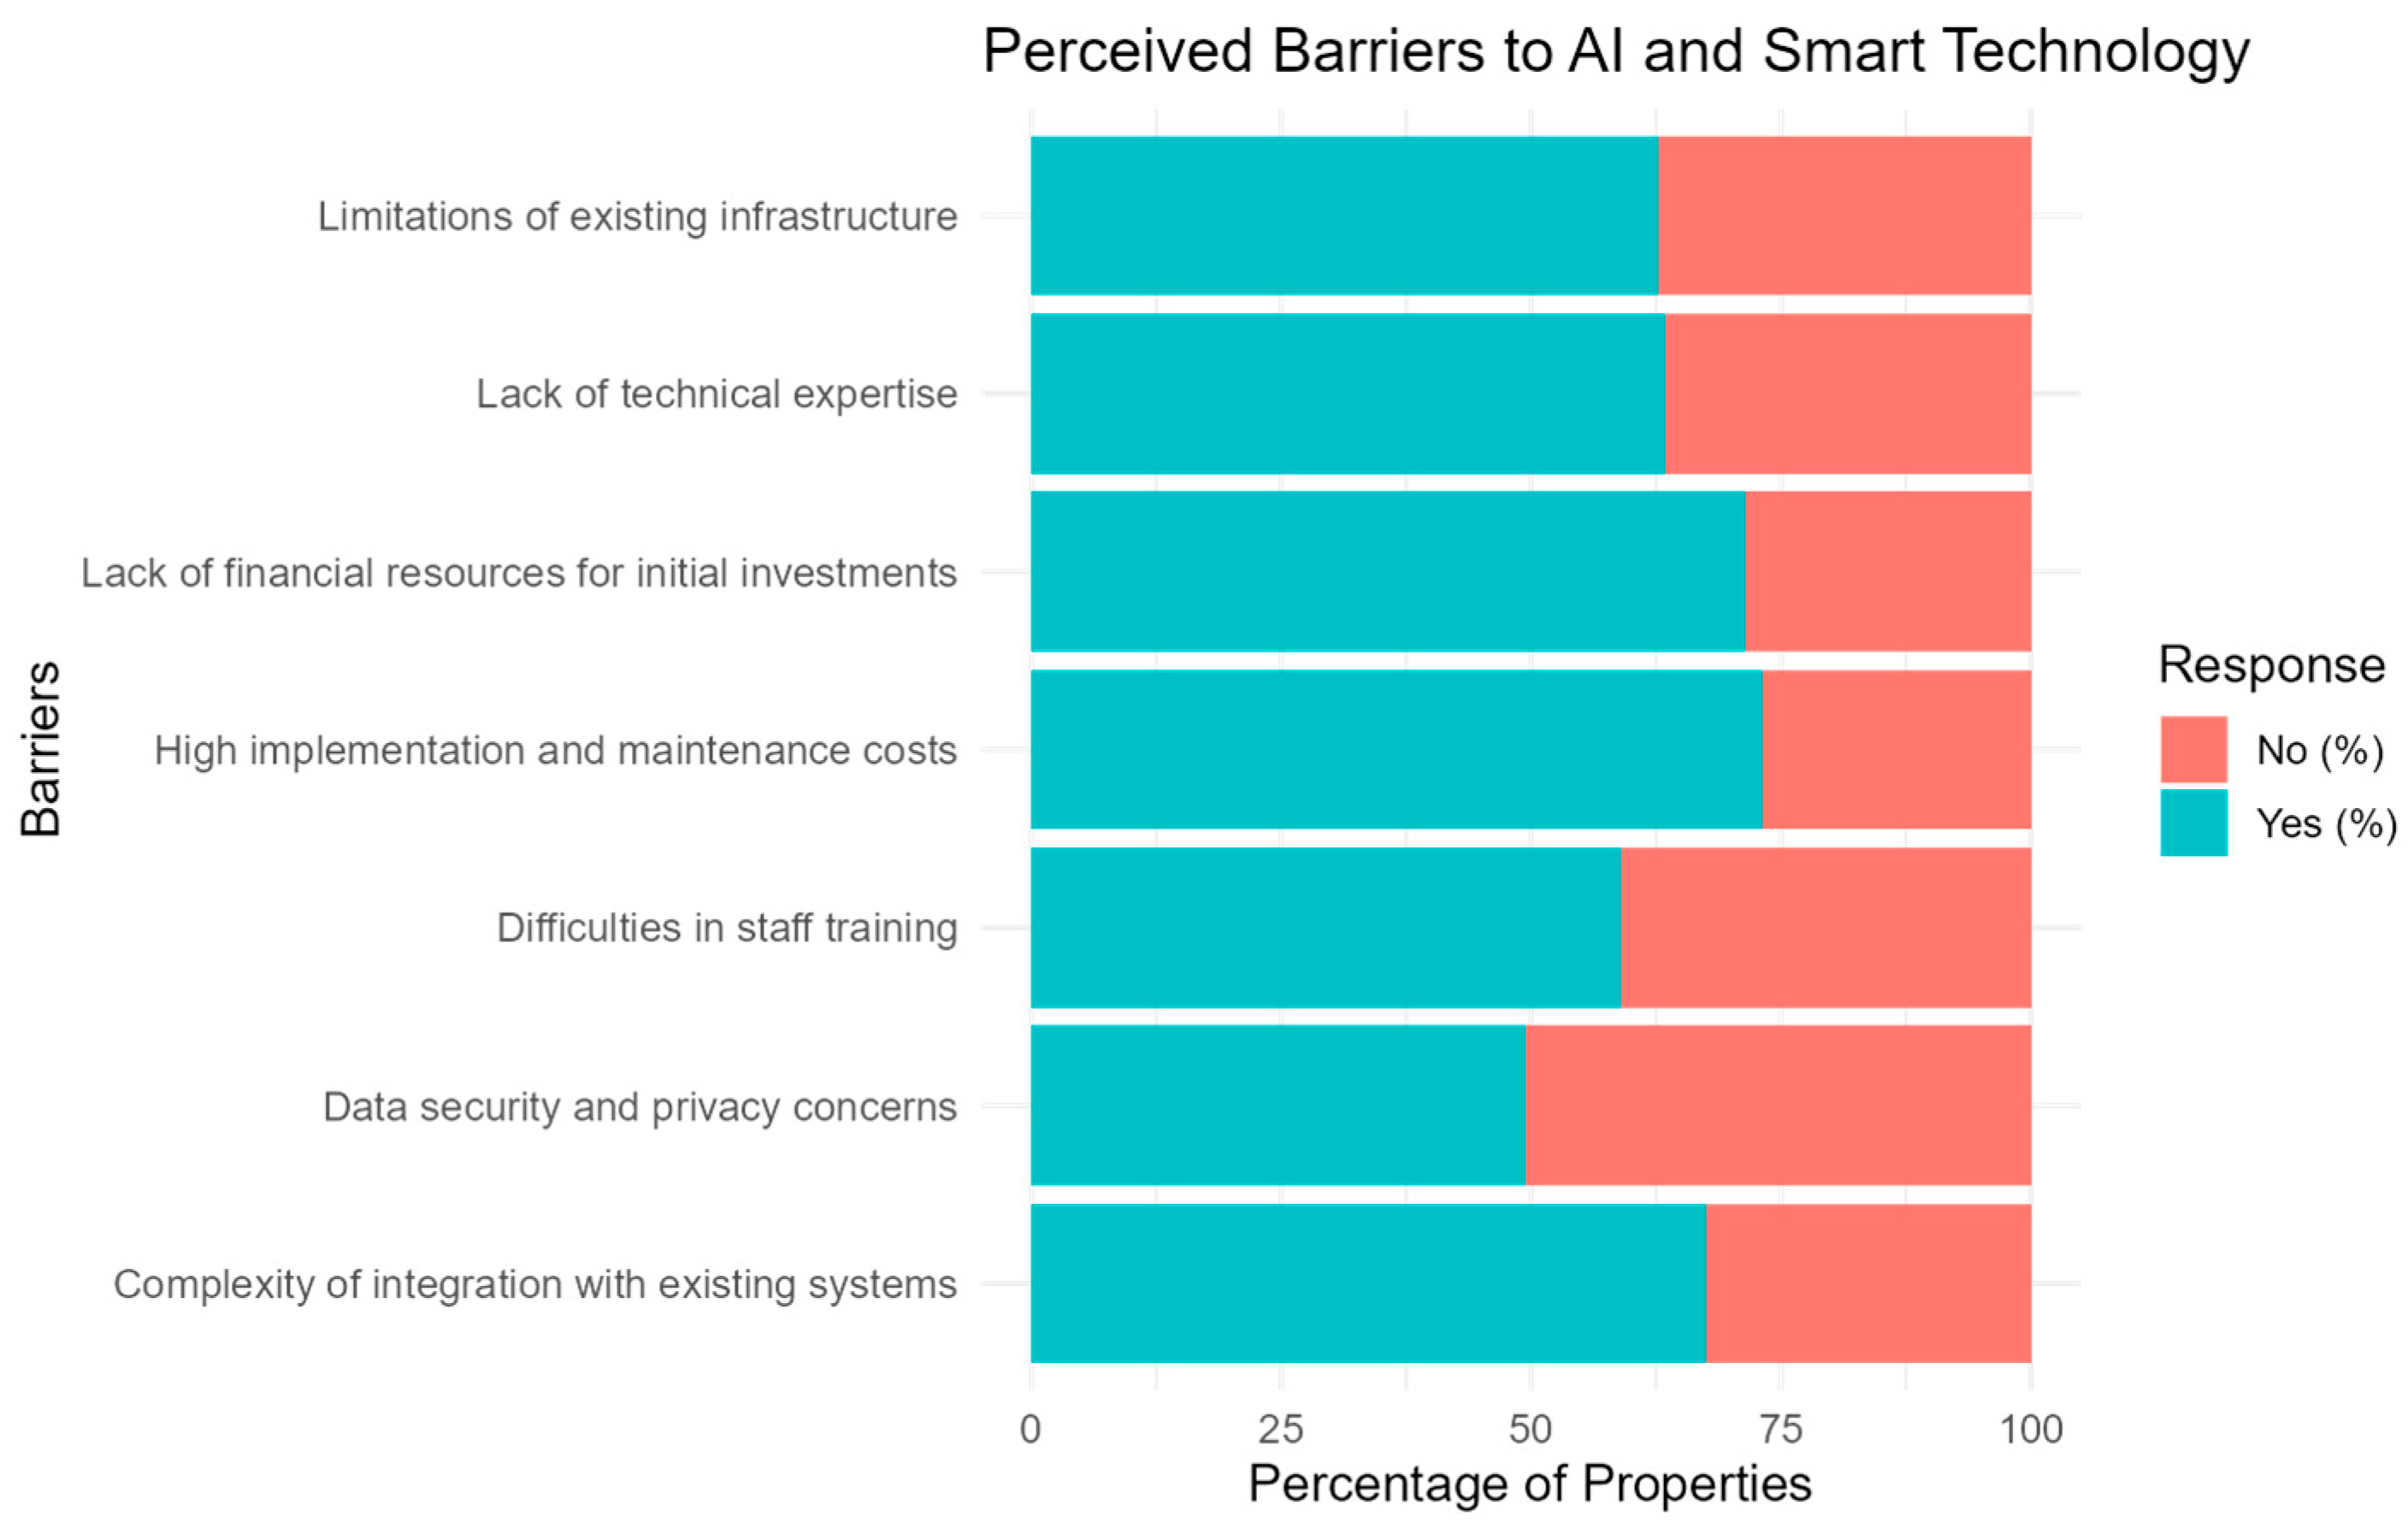
4.1.4. Perceived Barriers to Integration of AI and Smart Technology
4.2. Exploratory Factor Analysis and Adoption Segmentation
4.2.1. Exploratory Factor Analysis (EFA)
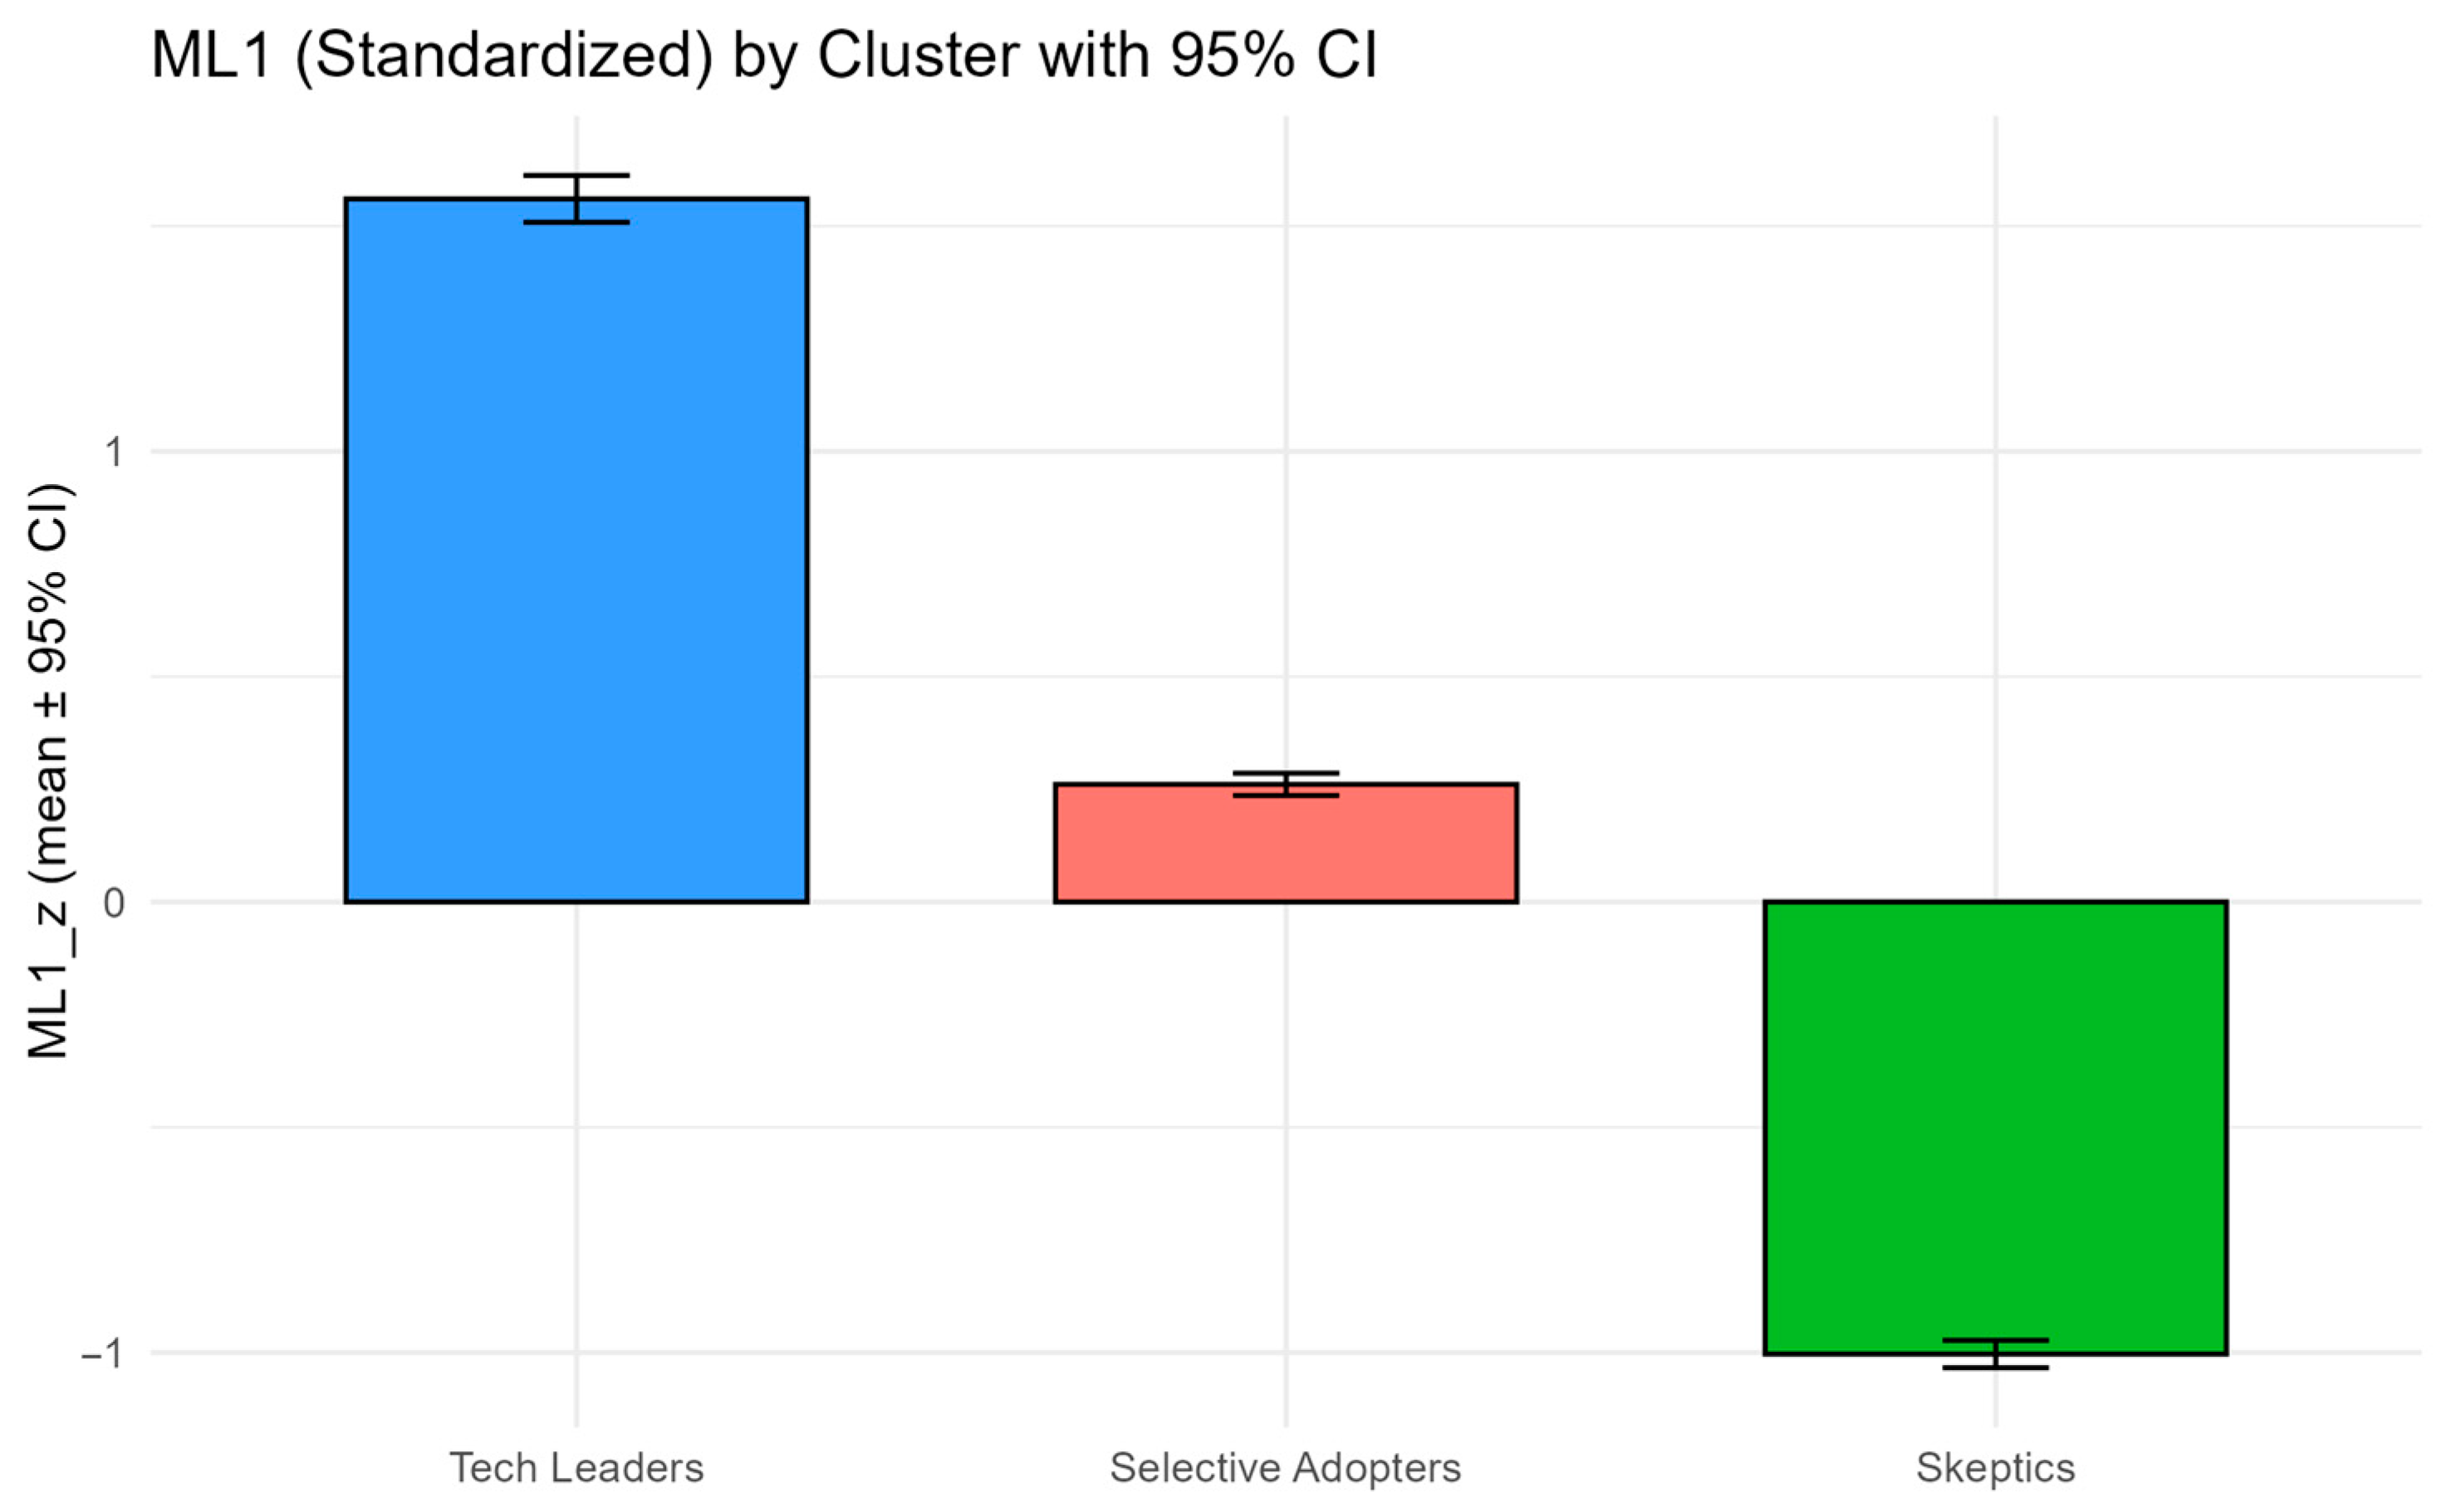
4.2.2. Cluster Analysis
4.3. Structural Equation Modeling (SEM)
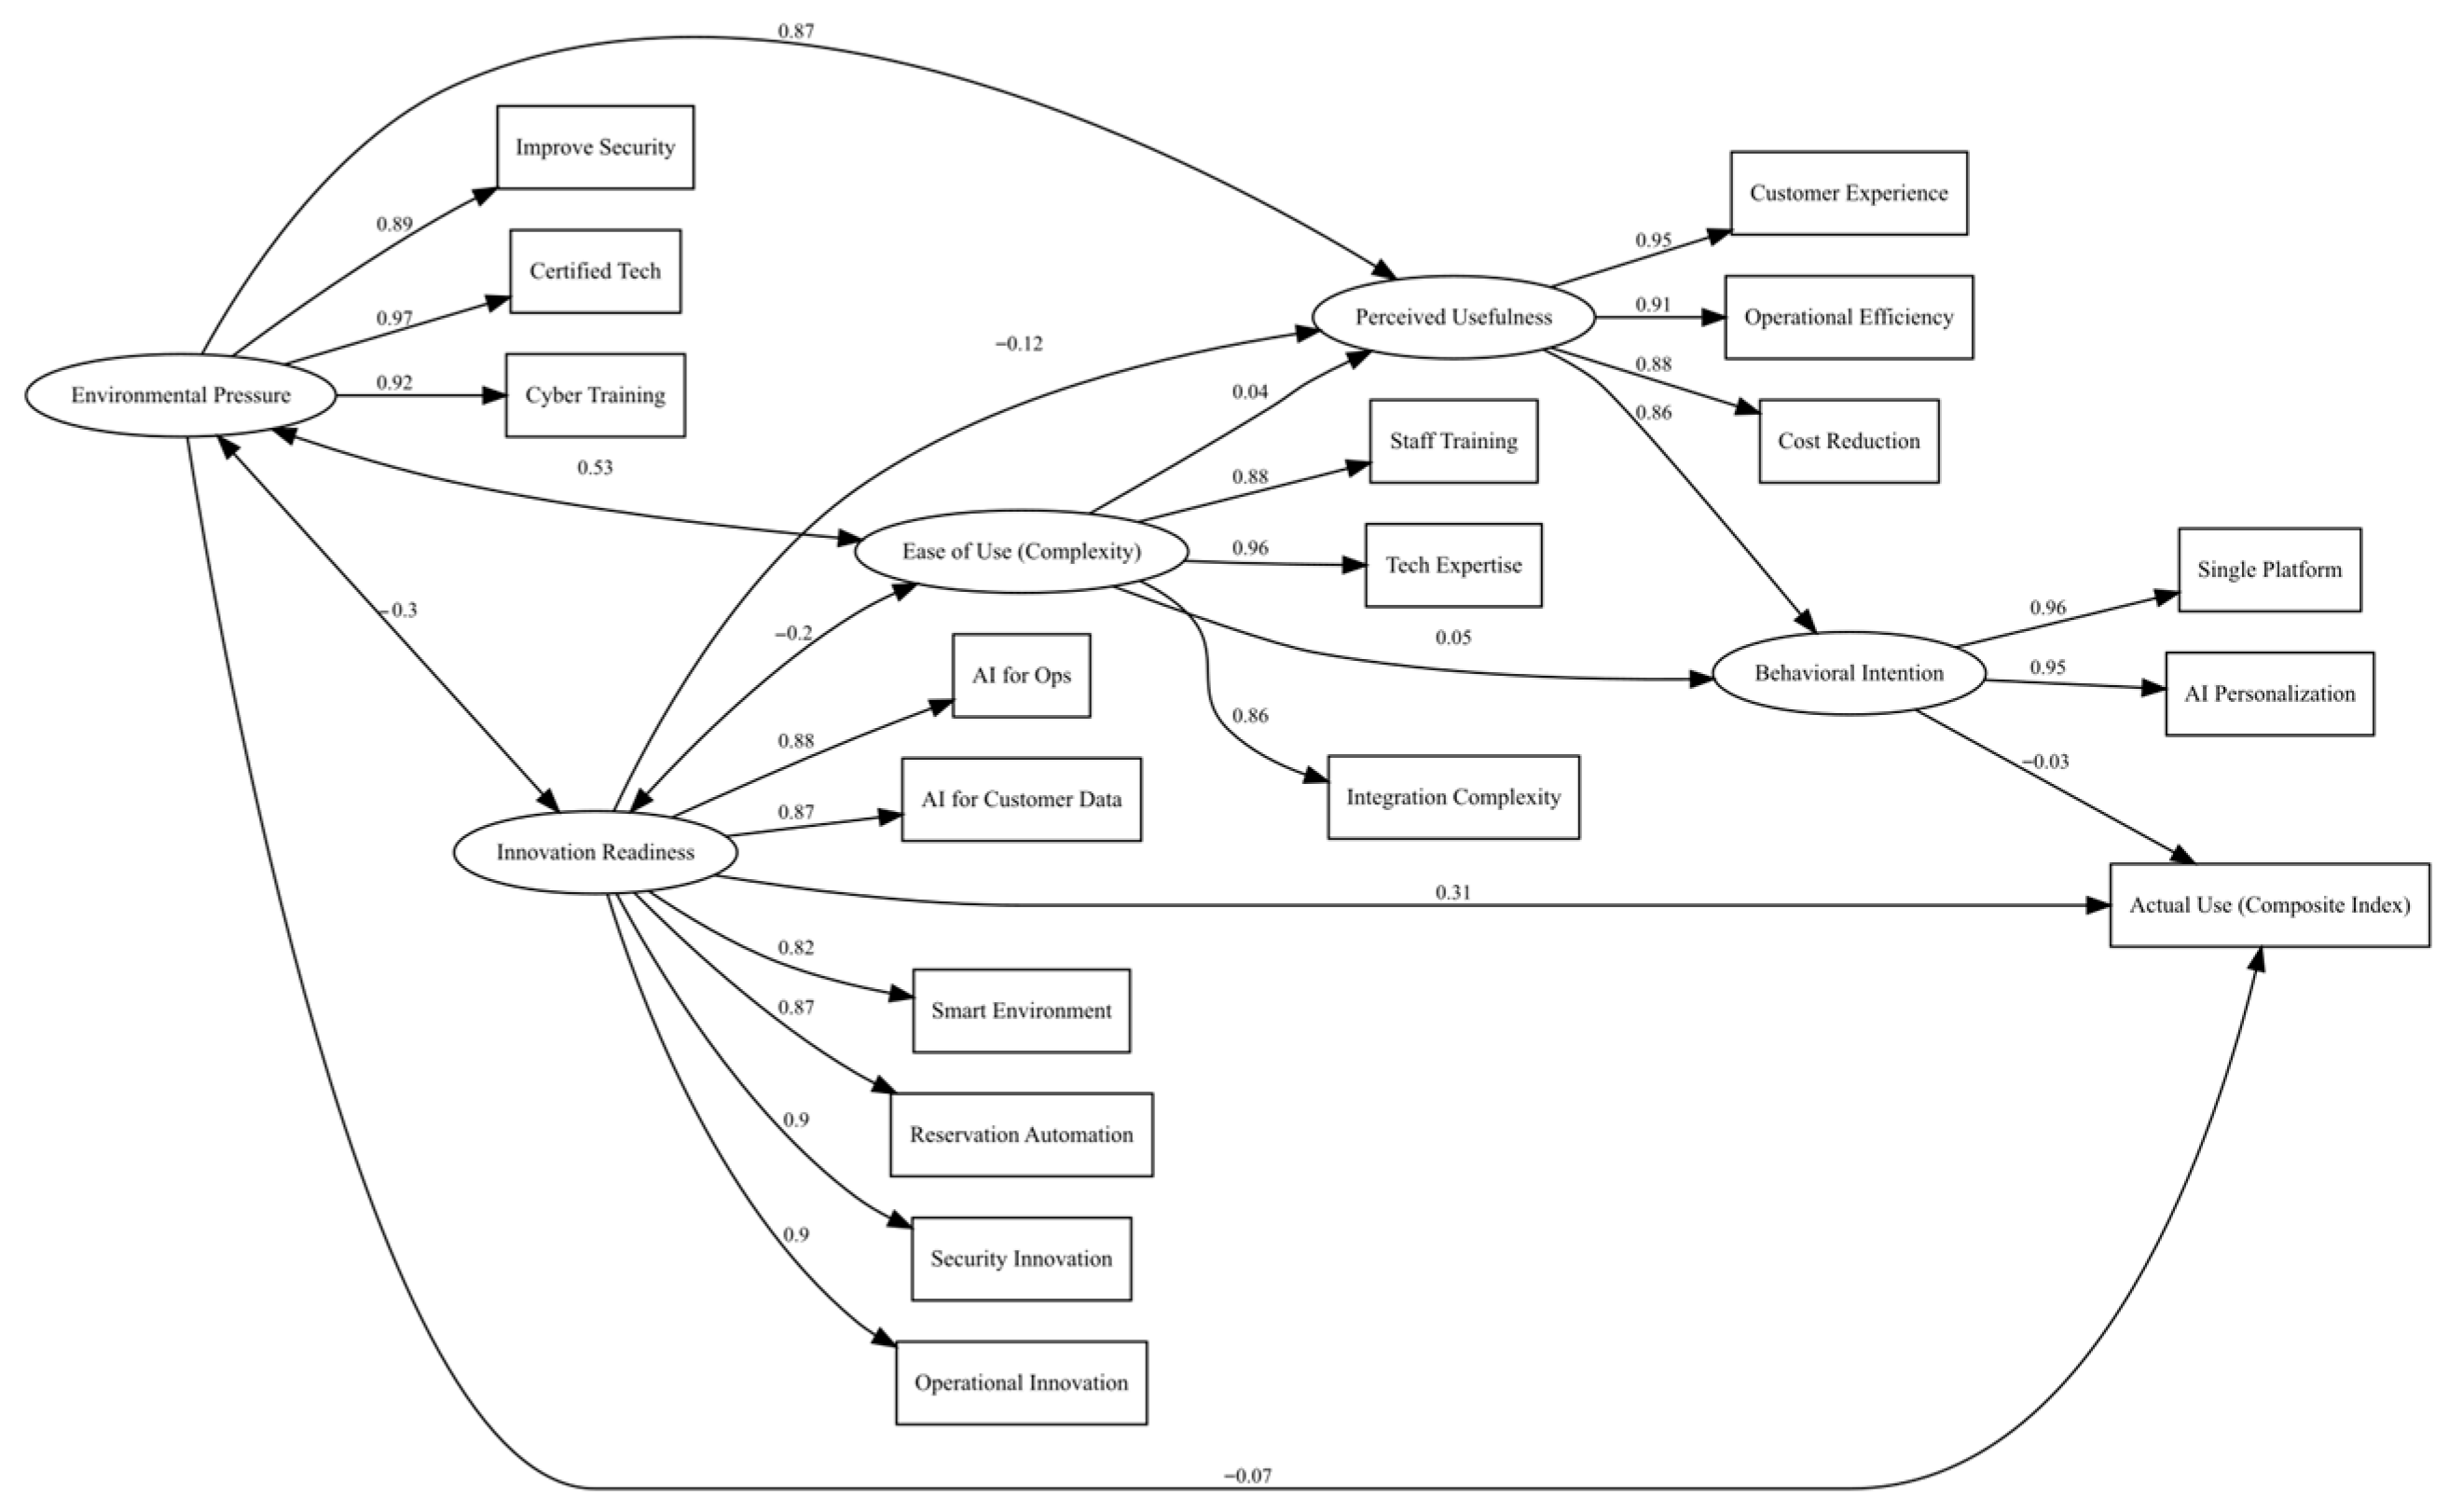
4.3.1. Model Specification and Fit
4.3.2. Measurement Model
4.3.3. Structural Model Findings
4.3.4. Multi-Group SEM
5. Discussion
5.1. Operational Digitalization vs. Strategic AI Readiness
5.2. High Perceived Benefits, Strong Structural Constraints
5.3. Segmentation Reveals Divergent Digital Pathways
5.4. Innovation Readiness and Environmental Pressure Drive Adoption
5.5. Policy and Practice Implications
5.6. Limitations and Future Research
6. Conclusions
Supplementary Materials
Author Contributions
Funding
Institutional Review Board Statement
Informed Consent Statement
Data Availability Statement
Acknowledgments
Conflicts of Interest
Abbreviations
| AI | Artificial Intelligence |
| AU | Actual Usage (composite index of core systems) |
| BI | Behavioral Intention |
| CFI | Comparative Fit Index |
| χ2 | Chi-square statistic |
| df | Degrees of Freedom |
| DOI | Diffusion of Innovations |
| EFA | Exploratory Factor Analysis |
| ICT | Information and Communication Technology |
| INSTAT | Albanian Institute of Statistics |
| KMO | Kaiser–Meyer–Olkin |
| ML1 | Readiness for Smart and AI-Driven Hospitality Technology |
| OTA | Online Travel Agency |
| PEOU | Perceived Ease of Use (implementation complexity) |
| PMS | Property Management System |
| PU | Perceived Usefulness |
| RMSEA | Root Mean Square Error of Approximation |
| RMSR | Root Mean Square Residual |
| ROI | Return on Investment |
| SEM | Structural Equation Modeling |
| SI | Strategic Intent |
| SMHEs | Small and Medium-sized Hospitality Enterprises |
| SRMR | Standardized Root Mean Square Residual |
| TAM | Technology Acceptance Model |
| TLI | Tucker–Lewis Index |
| TOE | Technology–Organization–Environment |
| ULMC | Unmeasured Latent Method Construct |
| VIF | Variance Inflation Factor |
Appendix A
| Lens | Level | Construct (This Study) | Conceptual Domain | Boundary Rule | Measurement | SEM Role | Cross-Lens Interactions |
|---|---|---|---|---|---|---|---|
| TAM | Individual | Perceived Usefulness (PU) | Beliefs about performance gains from smart/AI tech | No readiness or adoption items | Reflective | Mediator | Env_CompPress → PU → BI |
| TAM | Individual | Perceived Ease of Use (PEOU) (implementation complexity) | Implementation burden (Expertise, integration, training) | Not capability/ willingness; no adoption items | Reflective | Predictor of PU & BI (expected −) | PEOU → PU, BI (−) |
| TAM | Individual | Behavioral Intention (BI) | Intention to invest/deploy | No adoption or readiness items | Reflective | Proximal driver of AU | PU → BI → AU_comp (varies by segment) |
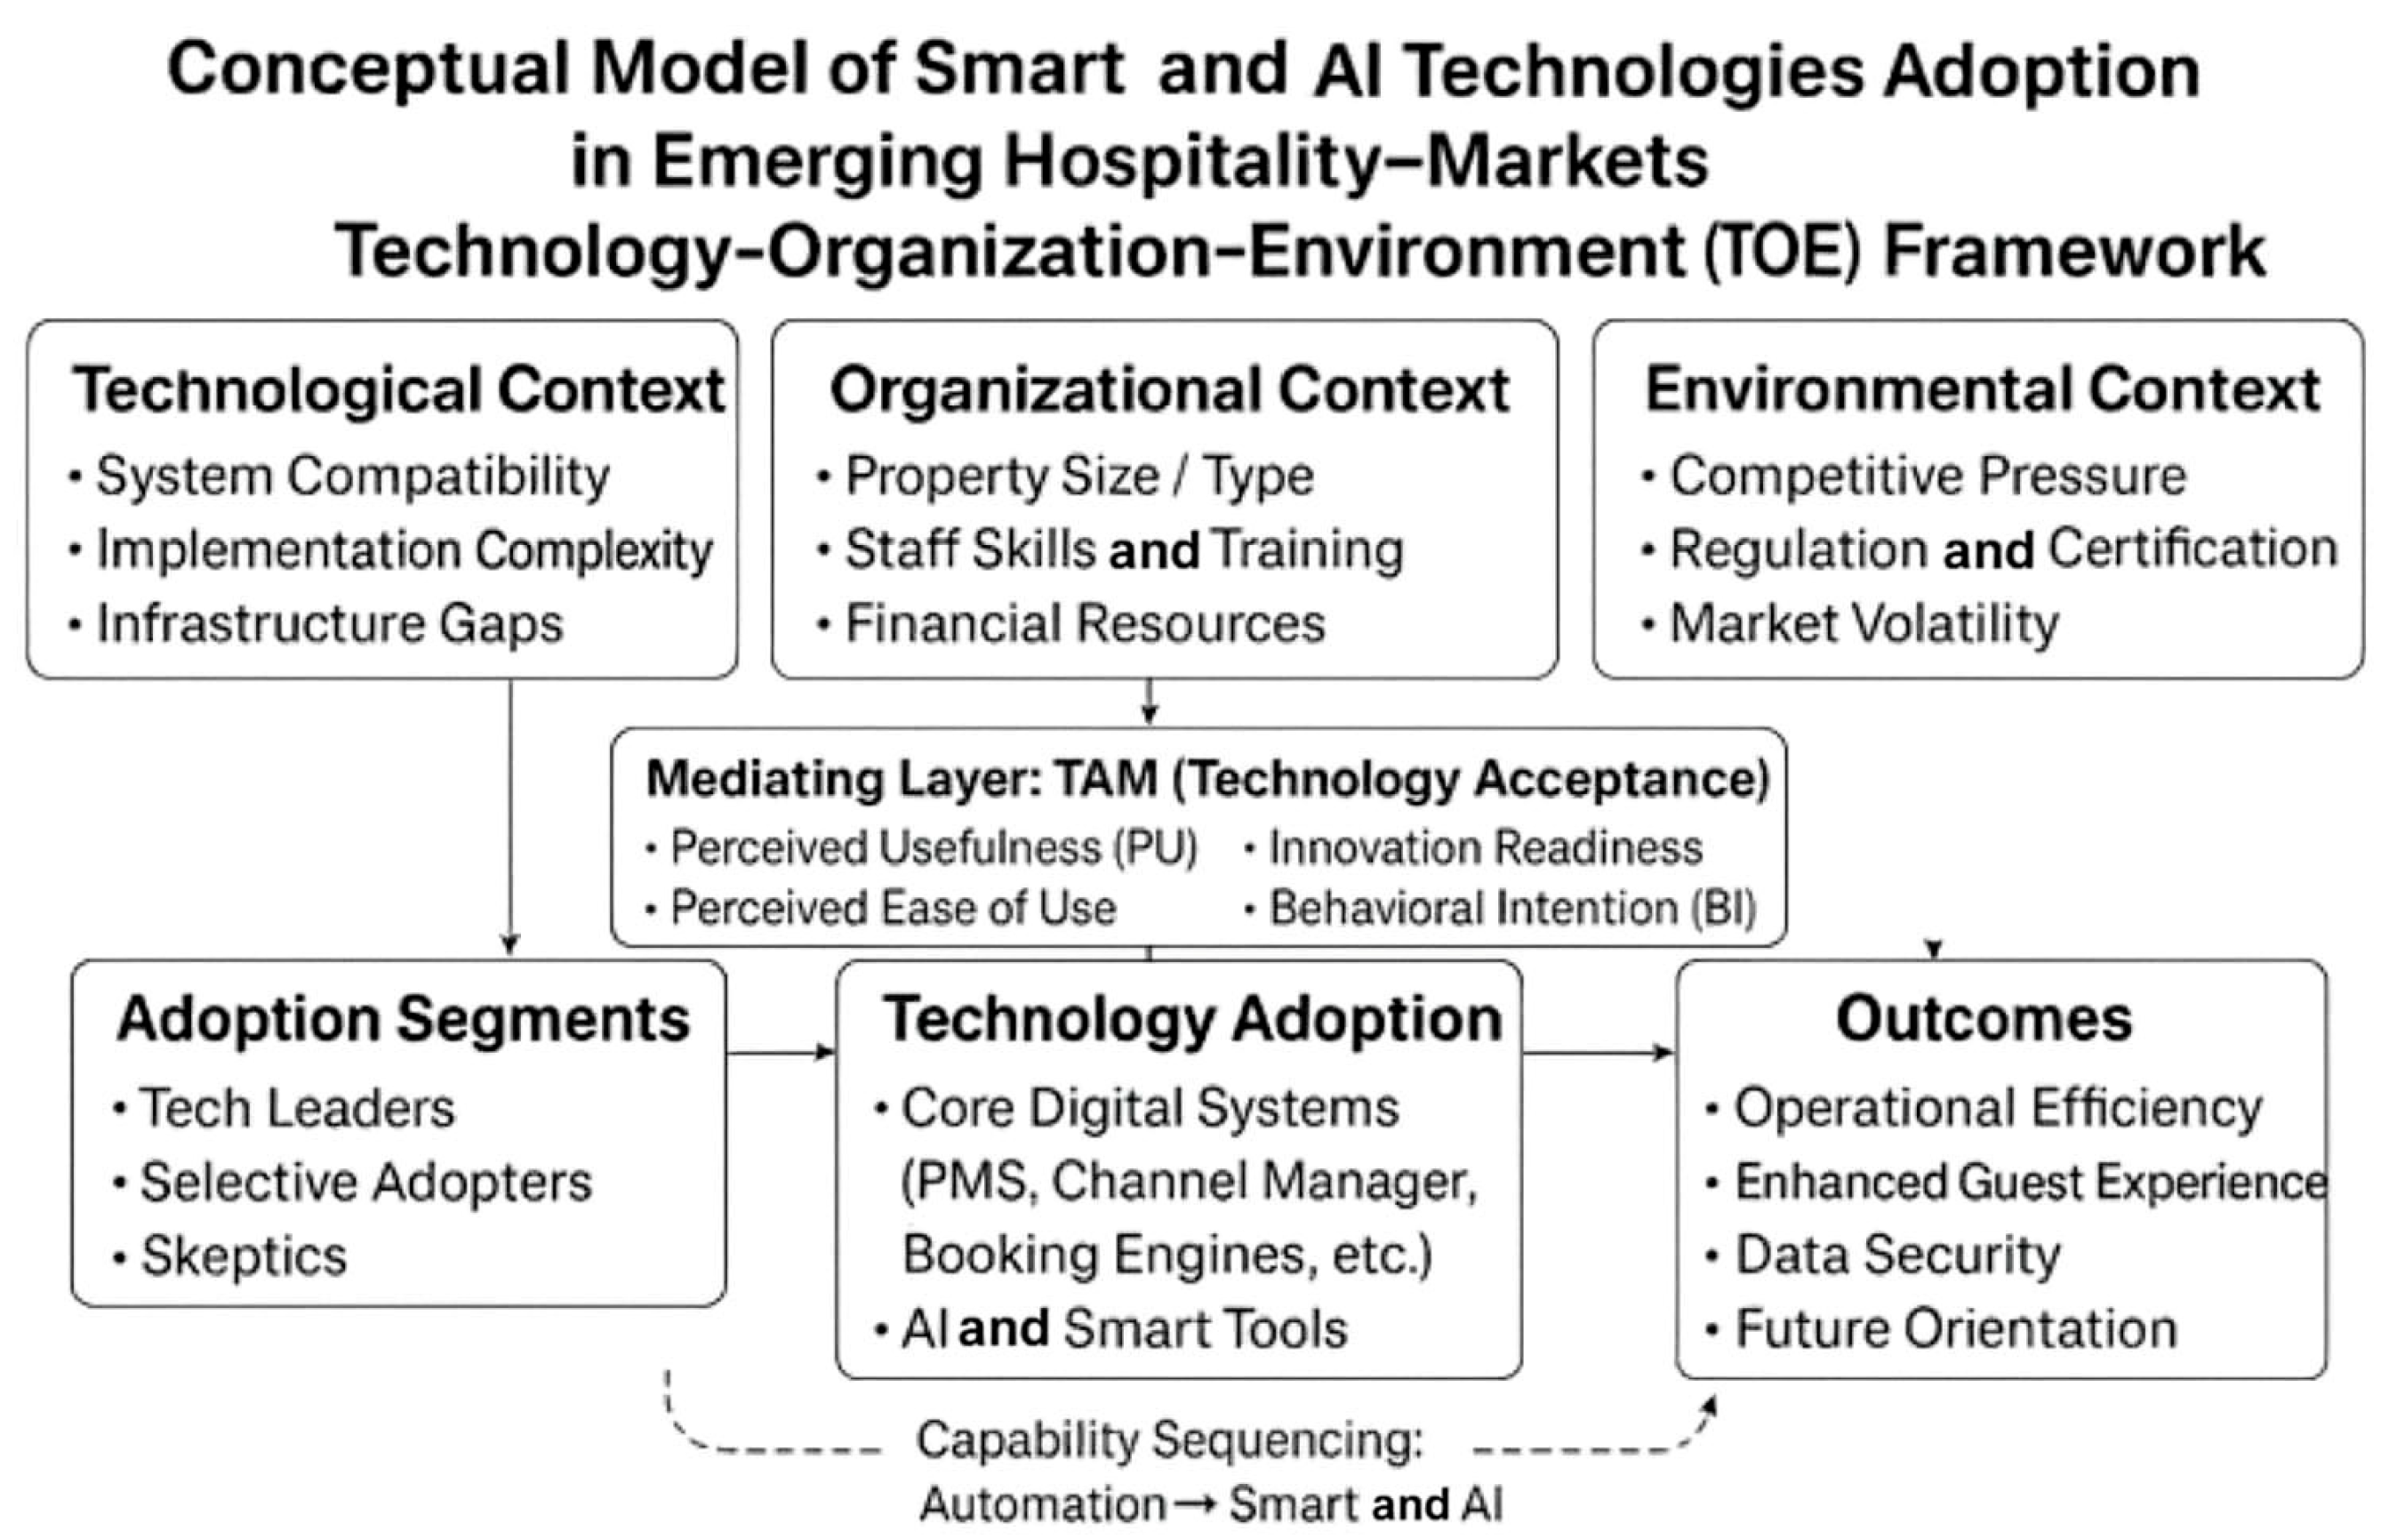
| TOE | Organizational | Innovation Readiness (ML1) | Strategic preparedness/ willingness | Not intention; not complexity; no adoption items | Reflective EFA→CFA | Direct driver; basis for segments | ML1 → AU_comp; segmentation source |
| TOE | Environmental | Environmental Competitive Pressure | External market/ regulatory pressure | No internal capability/ readiness/ adoption items | Reflective | Exogenous antecedent to PU | Env_CompPress → PU (indirect to BI/AU) |
| TOE | Technological | Actual Use (AU_comp) | Breadth/depth of adopted tool stack | Not used as indicators elsewhere | Composite (formative) | Outcome | Endpoint of PU/BI and ML1 effects |
| DOI | System/Market | Adoption segments (k-means on ML1) | Diffusion maturity profiles | Not modeled as latent; no indicators | Grouping (moderator) | Moderates path coefficients (multi-group SEM) | Tests heterogeneity (e.g., BI → AU_comp) |
| TAM Construct | Item Codes | Description |
|---|---|---|
| Perceived Usefulness (PU) | P44_1, P44_2, P44_3, P48_1 | Belief that technology improves efficiency, reduces costs, enhances experience |
| Perceived Ease of Use (PEOU) | P34_2, P34_3, P34_5 | Complexity: expertise, integration, training |
| Behavioral Intention (BI) | P40, P48_2, P48_3, P48_5 | Intention to invest in AI and automation |
| Actual Usage (AU) | P6, P8, P10, P12, P14, P16, P18, P20, P22, P23, P24, P25, P27, P29 | Use of PMS, CRM, website builders, booking engines, etc. |
| TOE Dimension | Sub-Dimension | Item Codes | Description |
|---|---|---|---|
| Technological | Existing Technology Use | P6–P8, P10–P12, P14–P16, P18–P20, P22–P25, P27, P29–P33 | Core systems (PMS, CRM, channel managers, sensors, BMS, etc.) |
| Technological | Innovation Readiness (RL1) | P35–P40 | Willingness to adopt AI/smart systems |
| Organizational | Size and Resources | Q1, P4, P41 | Rooms, type, budget |
| Organizational | Internal Capabilities | P34_5, P44_4, P48_4 | Staff skills, training, improvement needs |
| Environmental | Competitive Pressure | P18, P27, P45_1–P45_3, P47_3, P48_6 | Security, reputation, trust |
| Environmental | Regulatory and Infrastructure | P34_6, P34_7, P43 | Infrastructure, privacy, lack of integration |
| Variable | Value | df | Chi-Square | p-Value | N | |
|---|---|---|---|---|---|---|
| KMO | Overall KMO | 0.941 | – | – | – | – |
| KMO by Item | P35 | 0.935 | – | – | – | – |
| KMO by Item | P36 | 0.936 | – | – | – | – |
| KMO by Item | P37 | 0.947 | – | – | – | – |
| KMO by Item | P38 | 0.944 | – | – | – | – |
| KMO by Item | P39 | 0.939 | – | – | – | – |
| KMO by Item | P40 | 0.943 | – | – | – | – |
| Bartlett | Bartlett’s Test | – | 15 | 12,255.52 | <0.001 | 1671 |
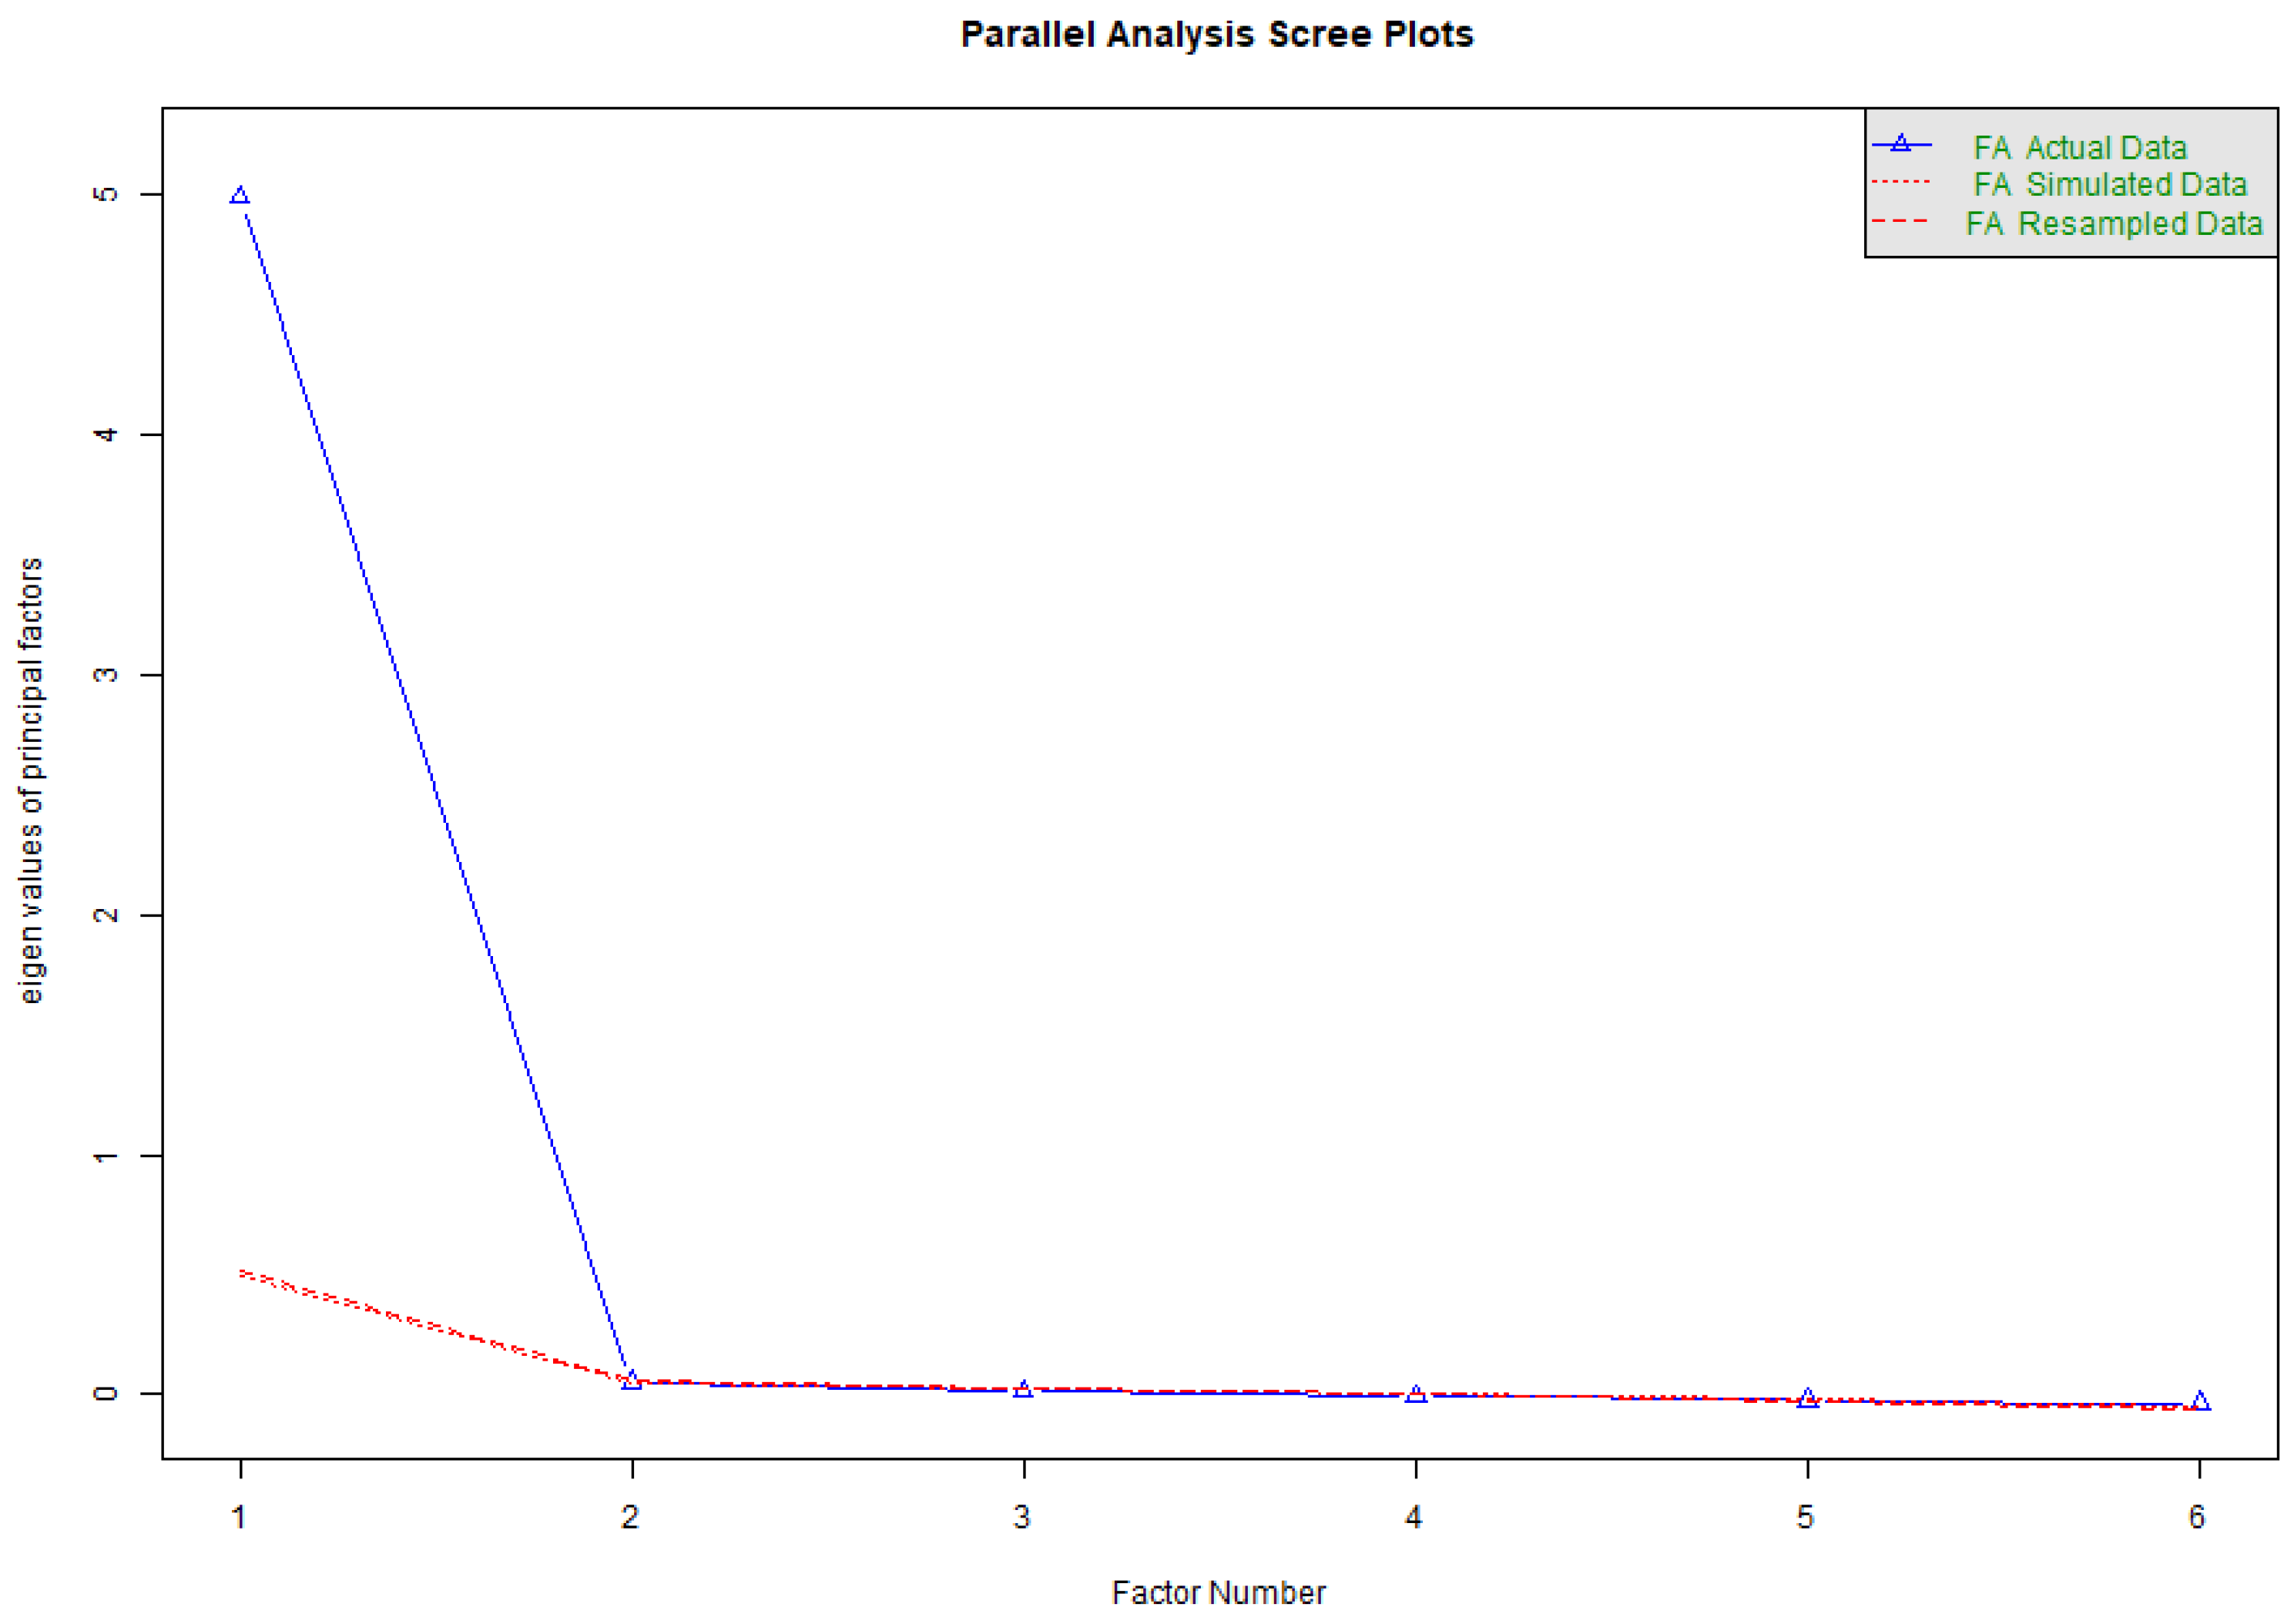
| Component | Observed Eigen | Simulated Eigen | Obs − Sim |
|---|---|---|---|
| 1 | 4.987 | 0.491 | 4.496 |
| 2 | 0.053 | 0.051 | 0.003 |
| 3 | 0.014 | 0.024 | −0.010 |
| 4 | −0.009 | 0.001 | −0.010 |
| 5 | −0.023 | −0.021 | −0.001 |
| 6 | −0.036 | −0.054 | 0.018 |
| Item | RL1 |
|---|---|
| P35 | 0.925 |
| P36 | 0.903 |
| P37 | 0.900 |
| P38 | 0.916 |
| P39 | 0.919 |
| P40 | 0.906 |
| Item | Communality |
|---|---|
| P35 | 0.856 |
| P36 | 0.815 |
| P37 | 0.810 |
| P38 | 0.840 |
| P39 | 0.845 |
| P40 | 0.821 |
| Measure | RL1 |
|---|---|
| SS loadings | 4.987 |
| Proportion Var | 0.831 |
| Cronbach’s Alpha (α) | |||
| Cronbach’s α | Standardized α | Number of Items | N (Observations) |
| 0.953 | 0.954 | 6 | 1671 |
| McDonald’s Omega (ω) | |||
| Omega Total | Omega Hierarchical | Number of Items | N (Observations) |
| 0.967 | – | 6 | 1671 |
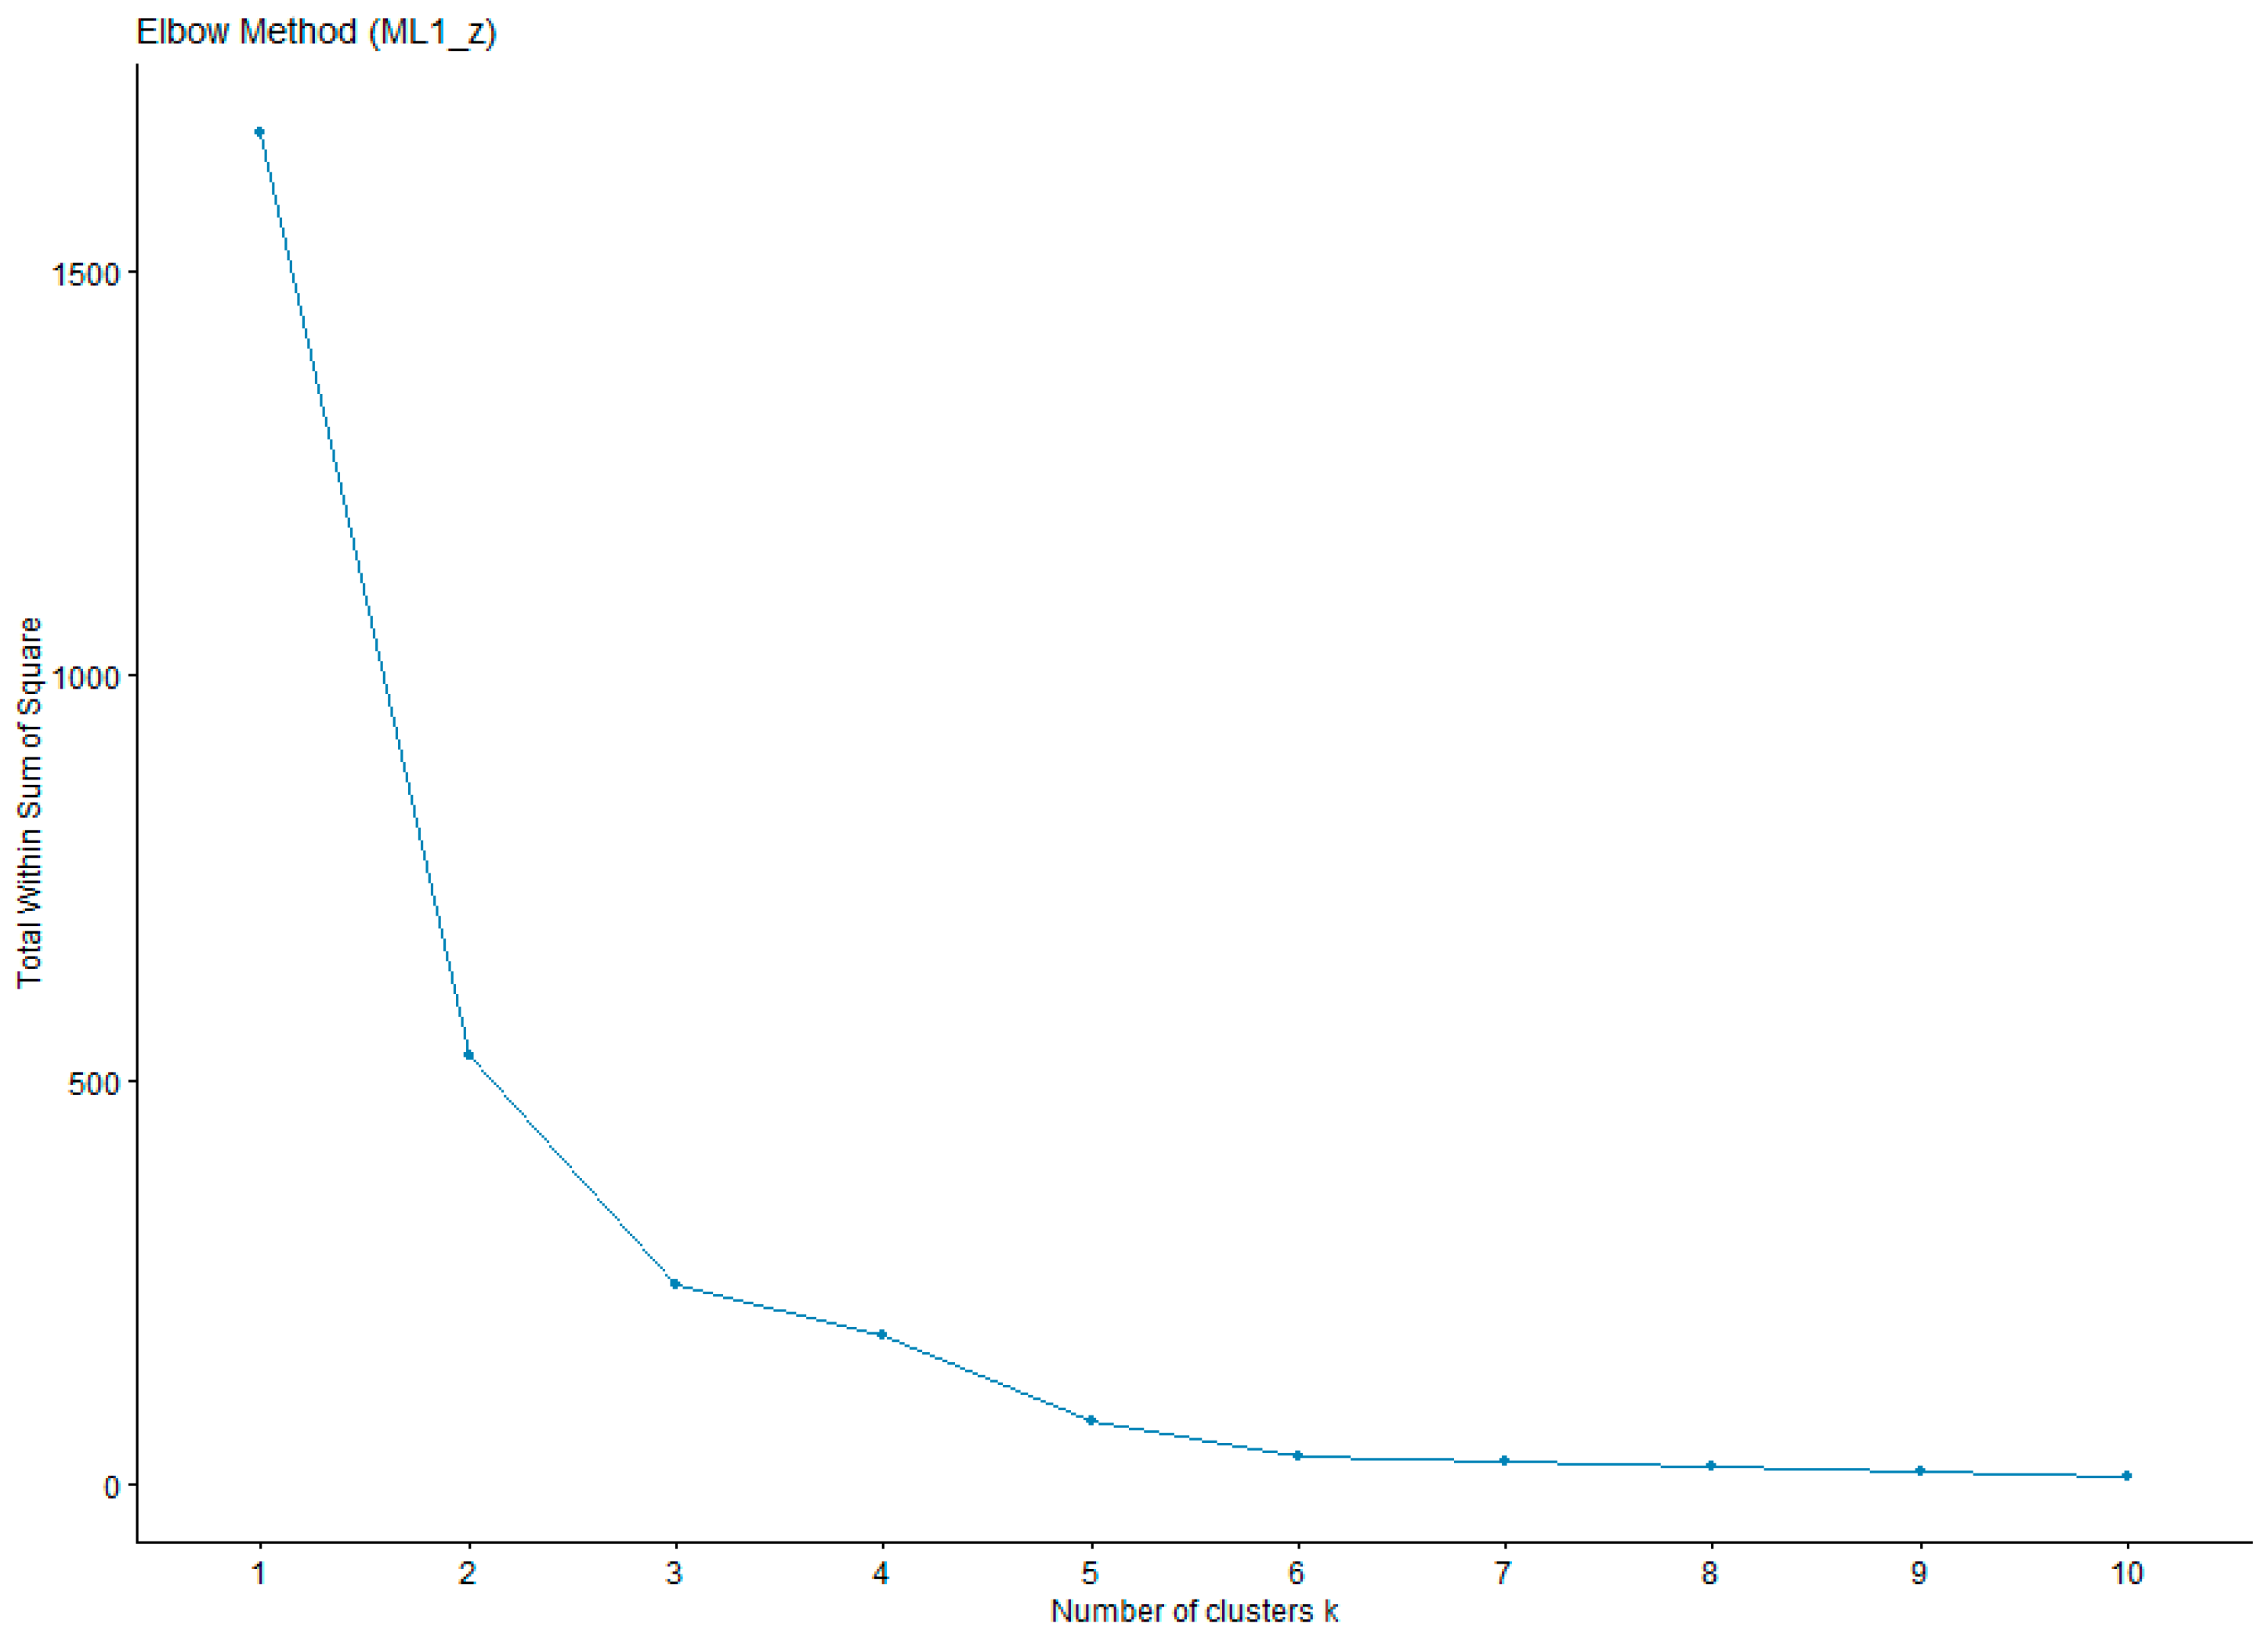
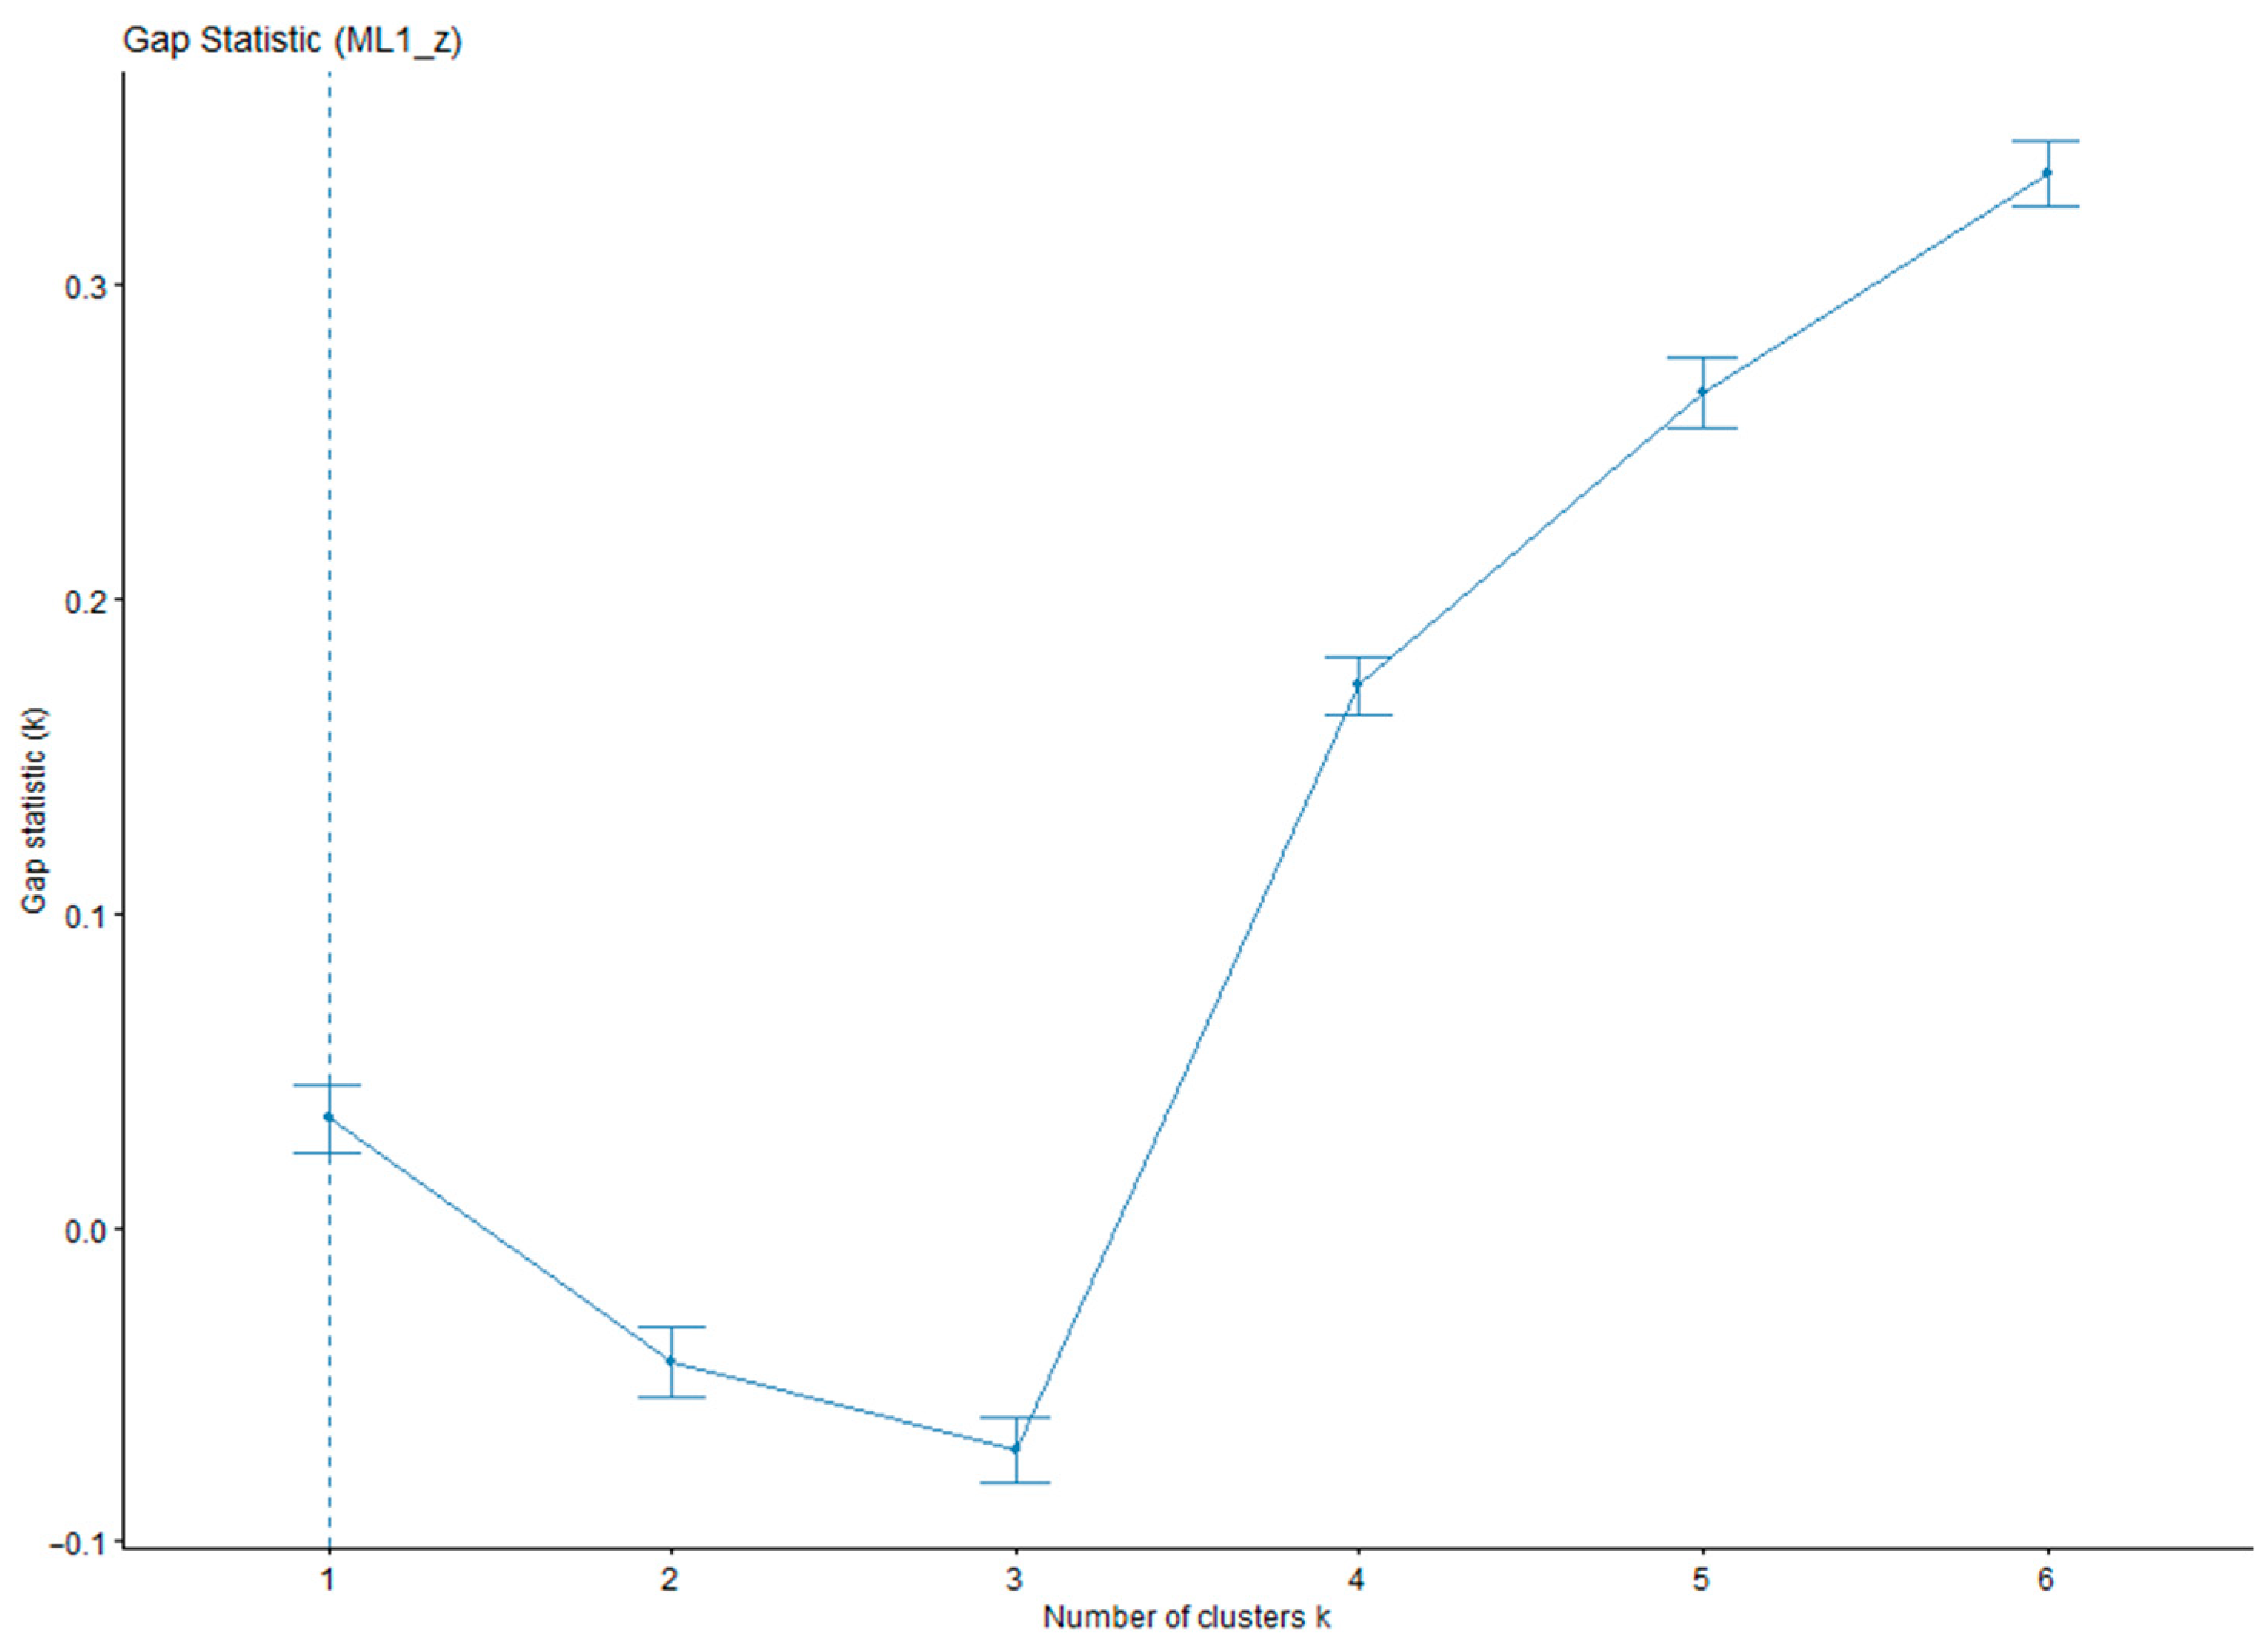
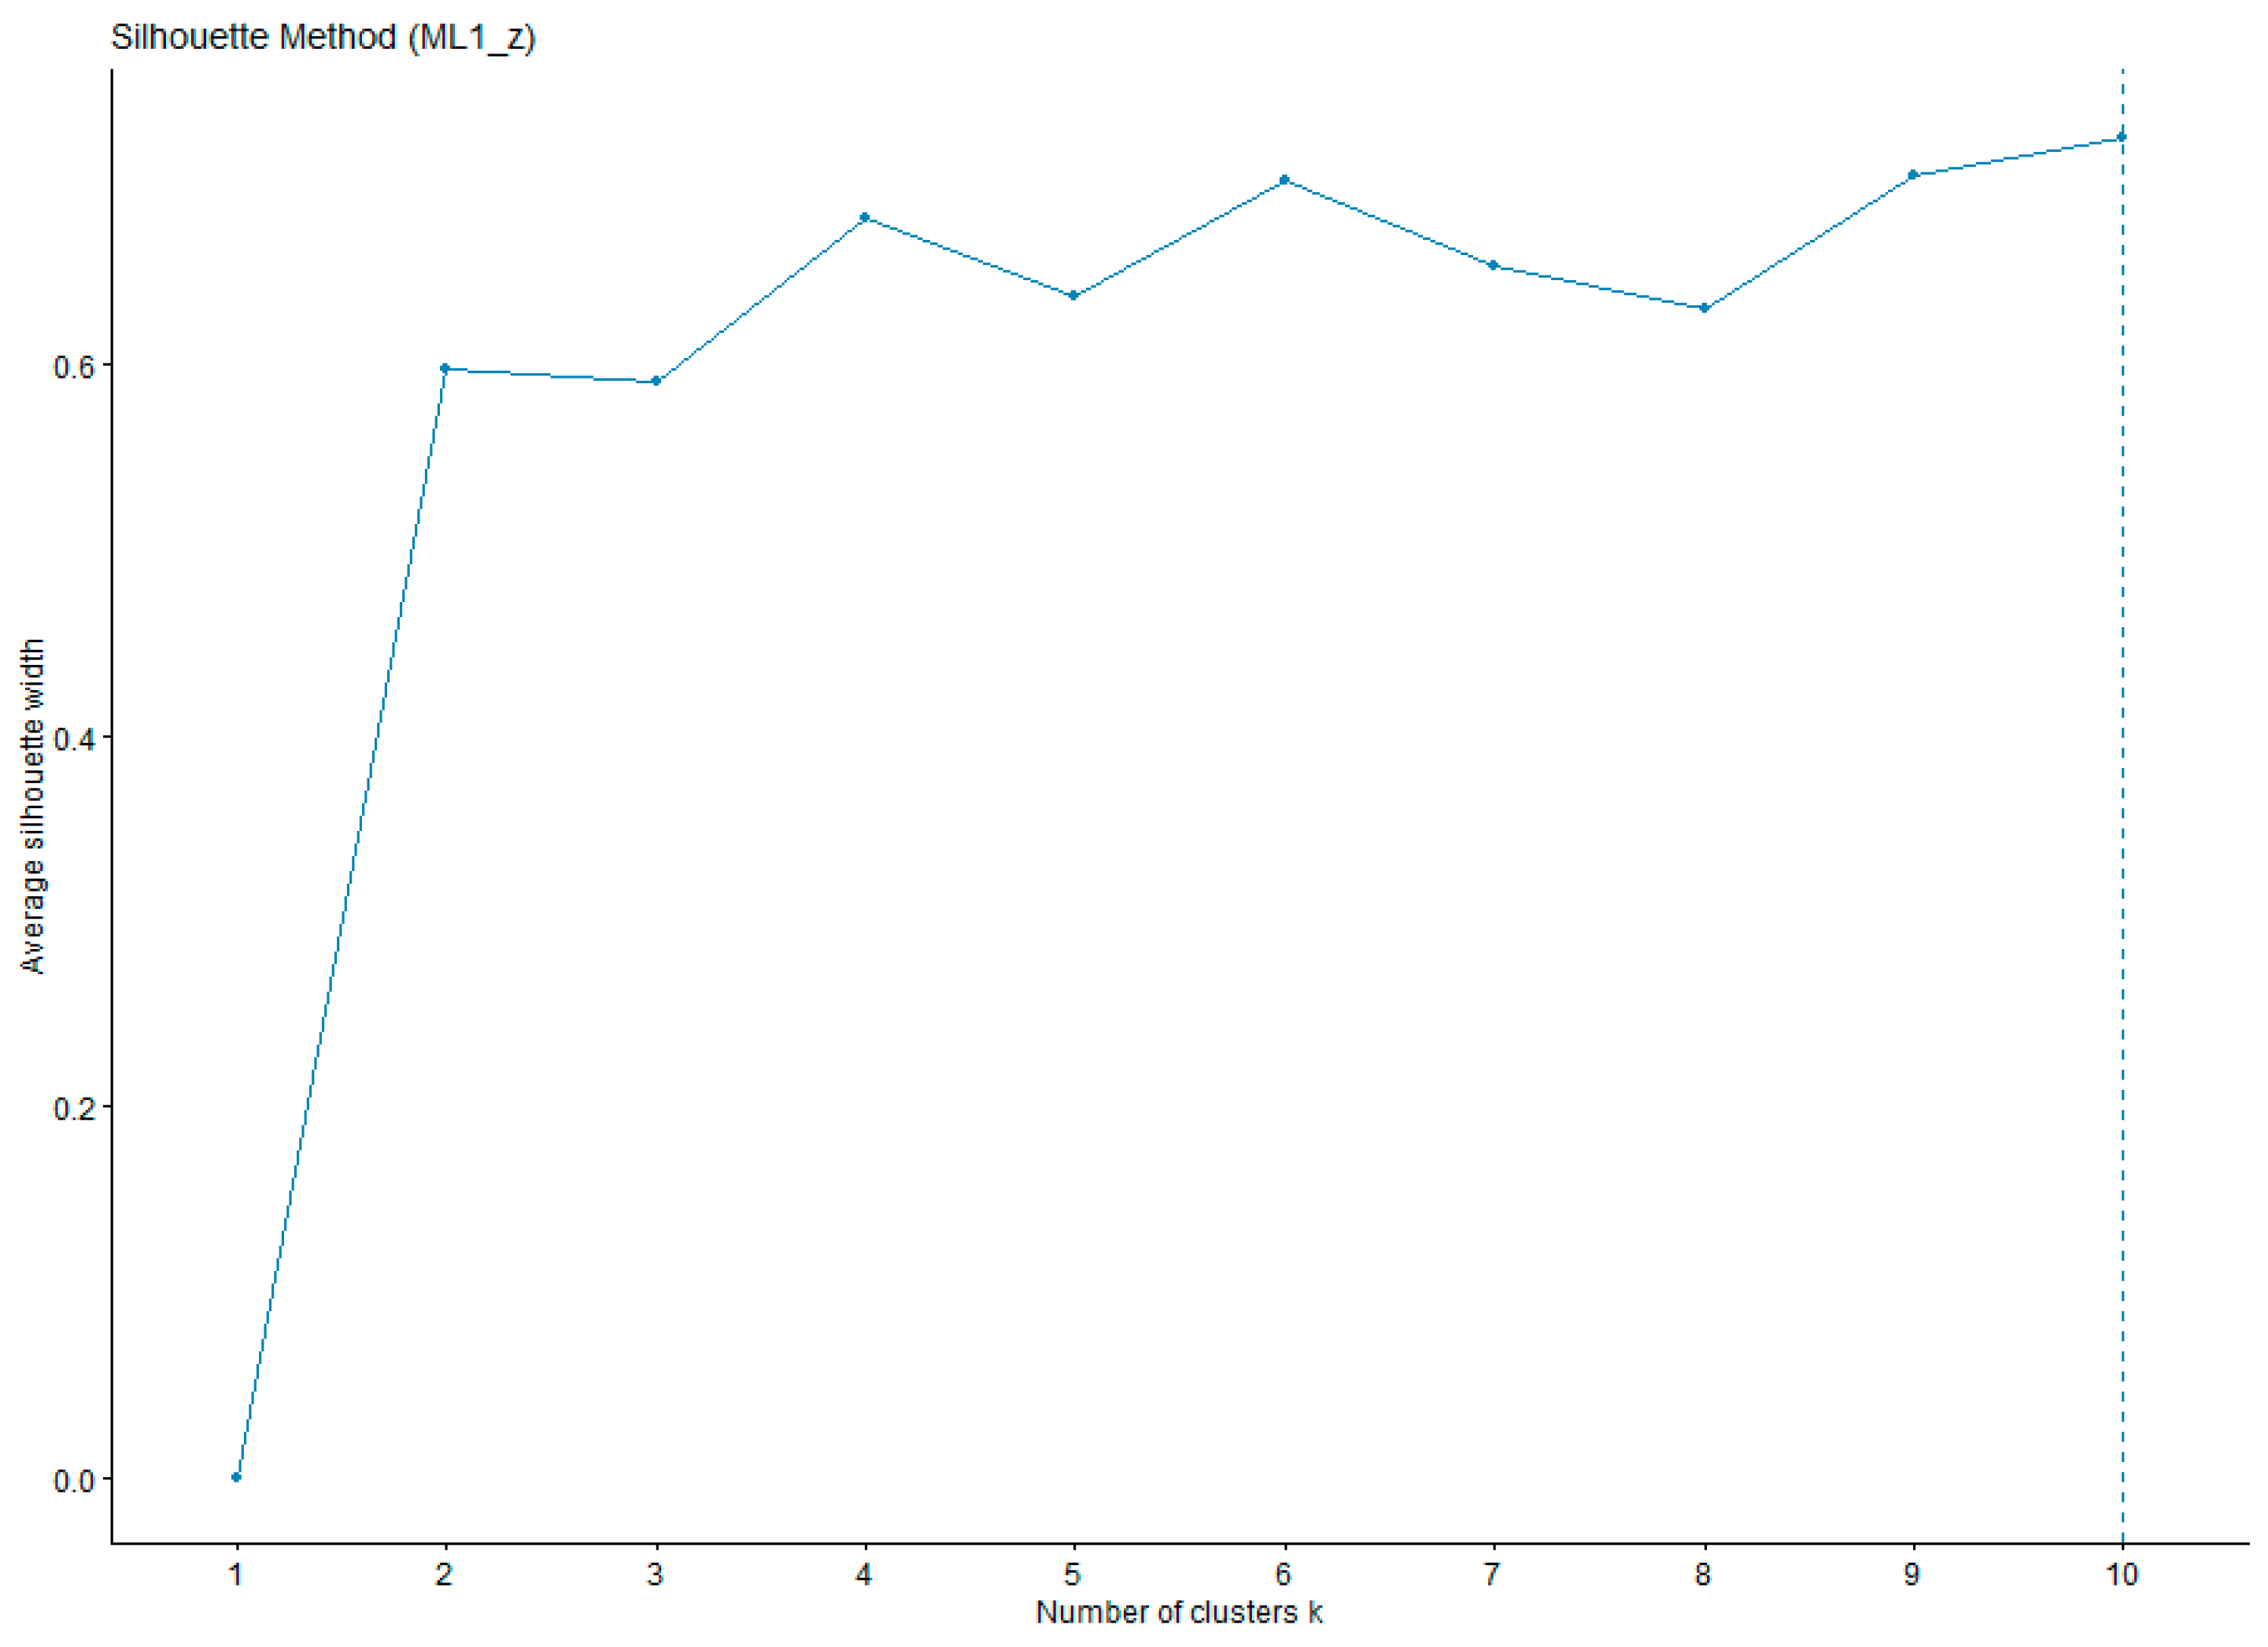
| Cluster Membership (Sample Sizes and Percentages) | ||||
| Cluster Label | N | Percent (%) | ||
| Tech Leaders | 296 | 17.7 | ||
| Selective Adopters | 726 | 43.4 | ||
| Cluster Label | N | Percent (%) | ||
| Cluster Centers (K-means Solution, ML1 Standardized Scores) | ||||
| Cluster Label | N | Mean (ML1_z) | 95% CI Lower | 95% CI Upper |
| Tech Leaders | 296 | 1.560 | 1.508 | 1.612 |
| Selective Adopters | 726 | 0.261 | 0.236 | 0.286 |
| Skeptics | 649 | −1.003 | −1.034 | −0.973 |
| Cluster Centers (K-means Solution, ML1 Standardized Scores) | ||||
| Cluster | Center (ML1_z) | Label | ||
| 1 | 0.261 | Selective Adopters | ||
| 2 | 1.560 | Tech Leaders | ||
| 3 | −1.003 | Skeptics | ||
| Item | Threshold | Estimate | SE |
|---|---|---|---|
| P44_1 | t1 | 0.405 | 0.035 |
| P44_2 | t1 | 0.650 | 0.037 |
| P44_3 | t1 | 0.743 | 0.038 |
| P34_2 | t1 | 0.368 | 0.035 |
| P34_3 | t1 | 0.499 | 0.035 |
| Fit Index | Value |
|---|---|
| CFI | 1.000 |
| TLI | 1.000 |
| RMSEA | 0.006 |
| SRMR | 0.025 |
| Indicator | β (Estimate) | SE | z | p-Value |
|---|---|---|---|---|
| P44_1 | 0.064 | 0.054 | 1.184 | 0.236 |
| P44_2 | −0.197 | 0.049 | −4.021 | <0.001 |
| P44_3 | 0.117 | 0.054 | 2.150 | 0.032 |
| P34_2 | 0.321 | 0.054 | 5.914 | <0.001 |
| P34_3 | −0.045 | 0.051 | −0.877 | 0.380 |

| Model | CFI | TLI | RMSEA | SRMR | χ2 | Df |
|---|---|---|---|---|---|---|
| Configural | 1.000 | 1.001 | 0.000 | 0.044 | 306.51 | 375 |
| Metric (loadings equal) | 1.000 | 1.000 | 0.000 | 0.053 | 406.96 | 409 |
| Structural (loadings + regressions equal) | 0.999 | 0.999 | 0.016 | 0.055 | 471.74 | 425 |
| Comparison | χ2 | df | χ2 diff | df diff | p-Value |
|---|---|---|---|---|---|
| Configural | 306.51 | 375 | – | – | – |
| Metric | 406.96 | 409 | 42.86 | 34 | 0.142 |
| Structural | 471.74 | 425 | 21.98 | 16 | 0.144 |
| Group | Path | Estimate | SE | z | p-Value | β (Std.) |
|---|---|---|---|---|---|---|
| Tech Leaders | PU ← PEOU | 0.015 | 0.226 | 0.065 | 0.948 | 0.005 |
| Tech Leaders | PU ← RL1 | −0.540 | 0.200 | −2.699 | 0.007 | −0.180 |
| Tech Leaders | PU ← Env_CompPress | 2.606 | 0.775 | 3.361 | 0.001 | 0.866 |
| Tech Leaders | BI ← PU | 0.943 | 0.365 | 2.588 | 0.010 | 0.973 |
| Tech Leaders | BI ← PEOU | −0.233 | 0.252 | −0.923 | 0.356 | −0.080 |
| Technology | Count Yes | Count No | Total N | Yes (%) | No (%) |
|---|---|---|---|---|---|
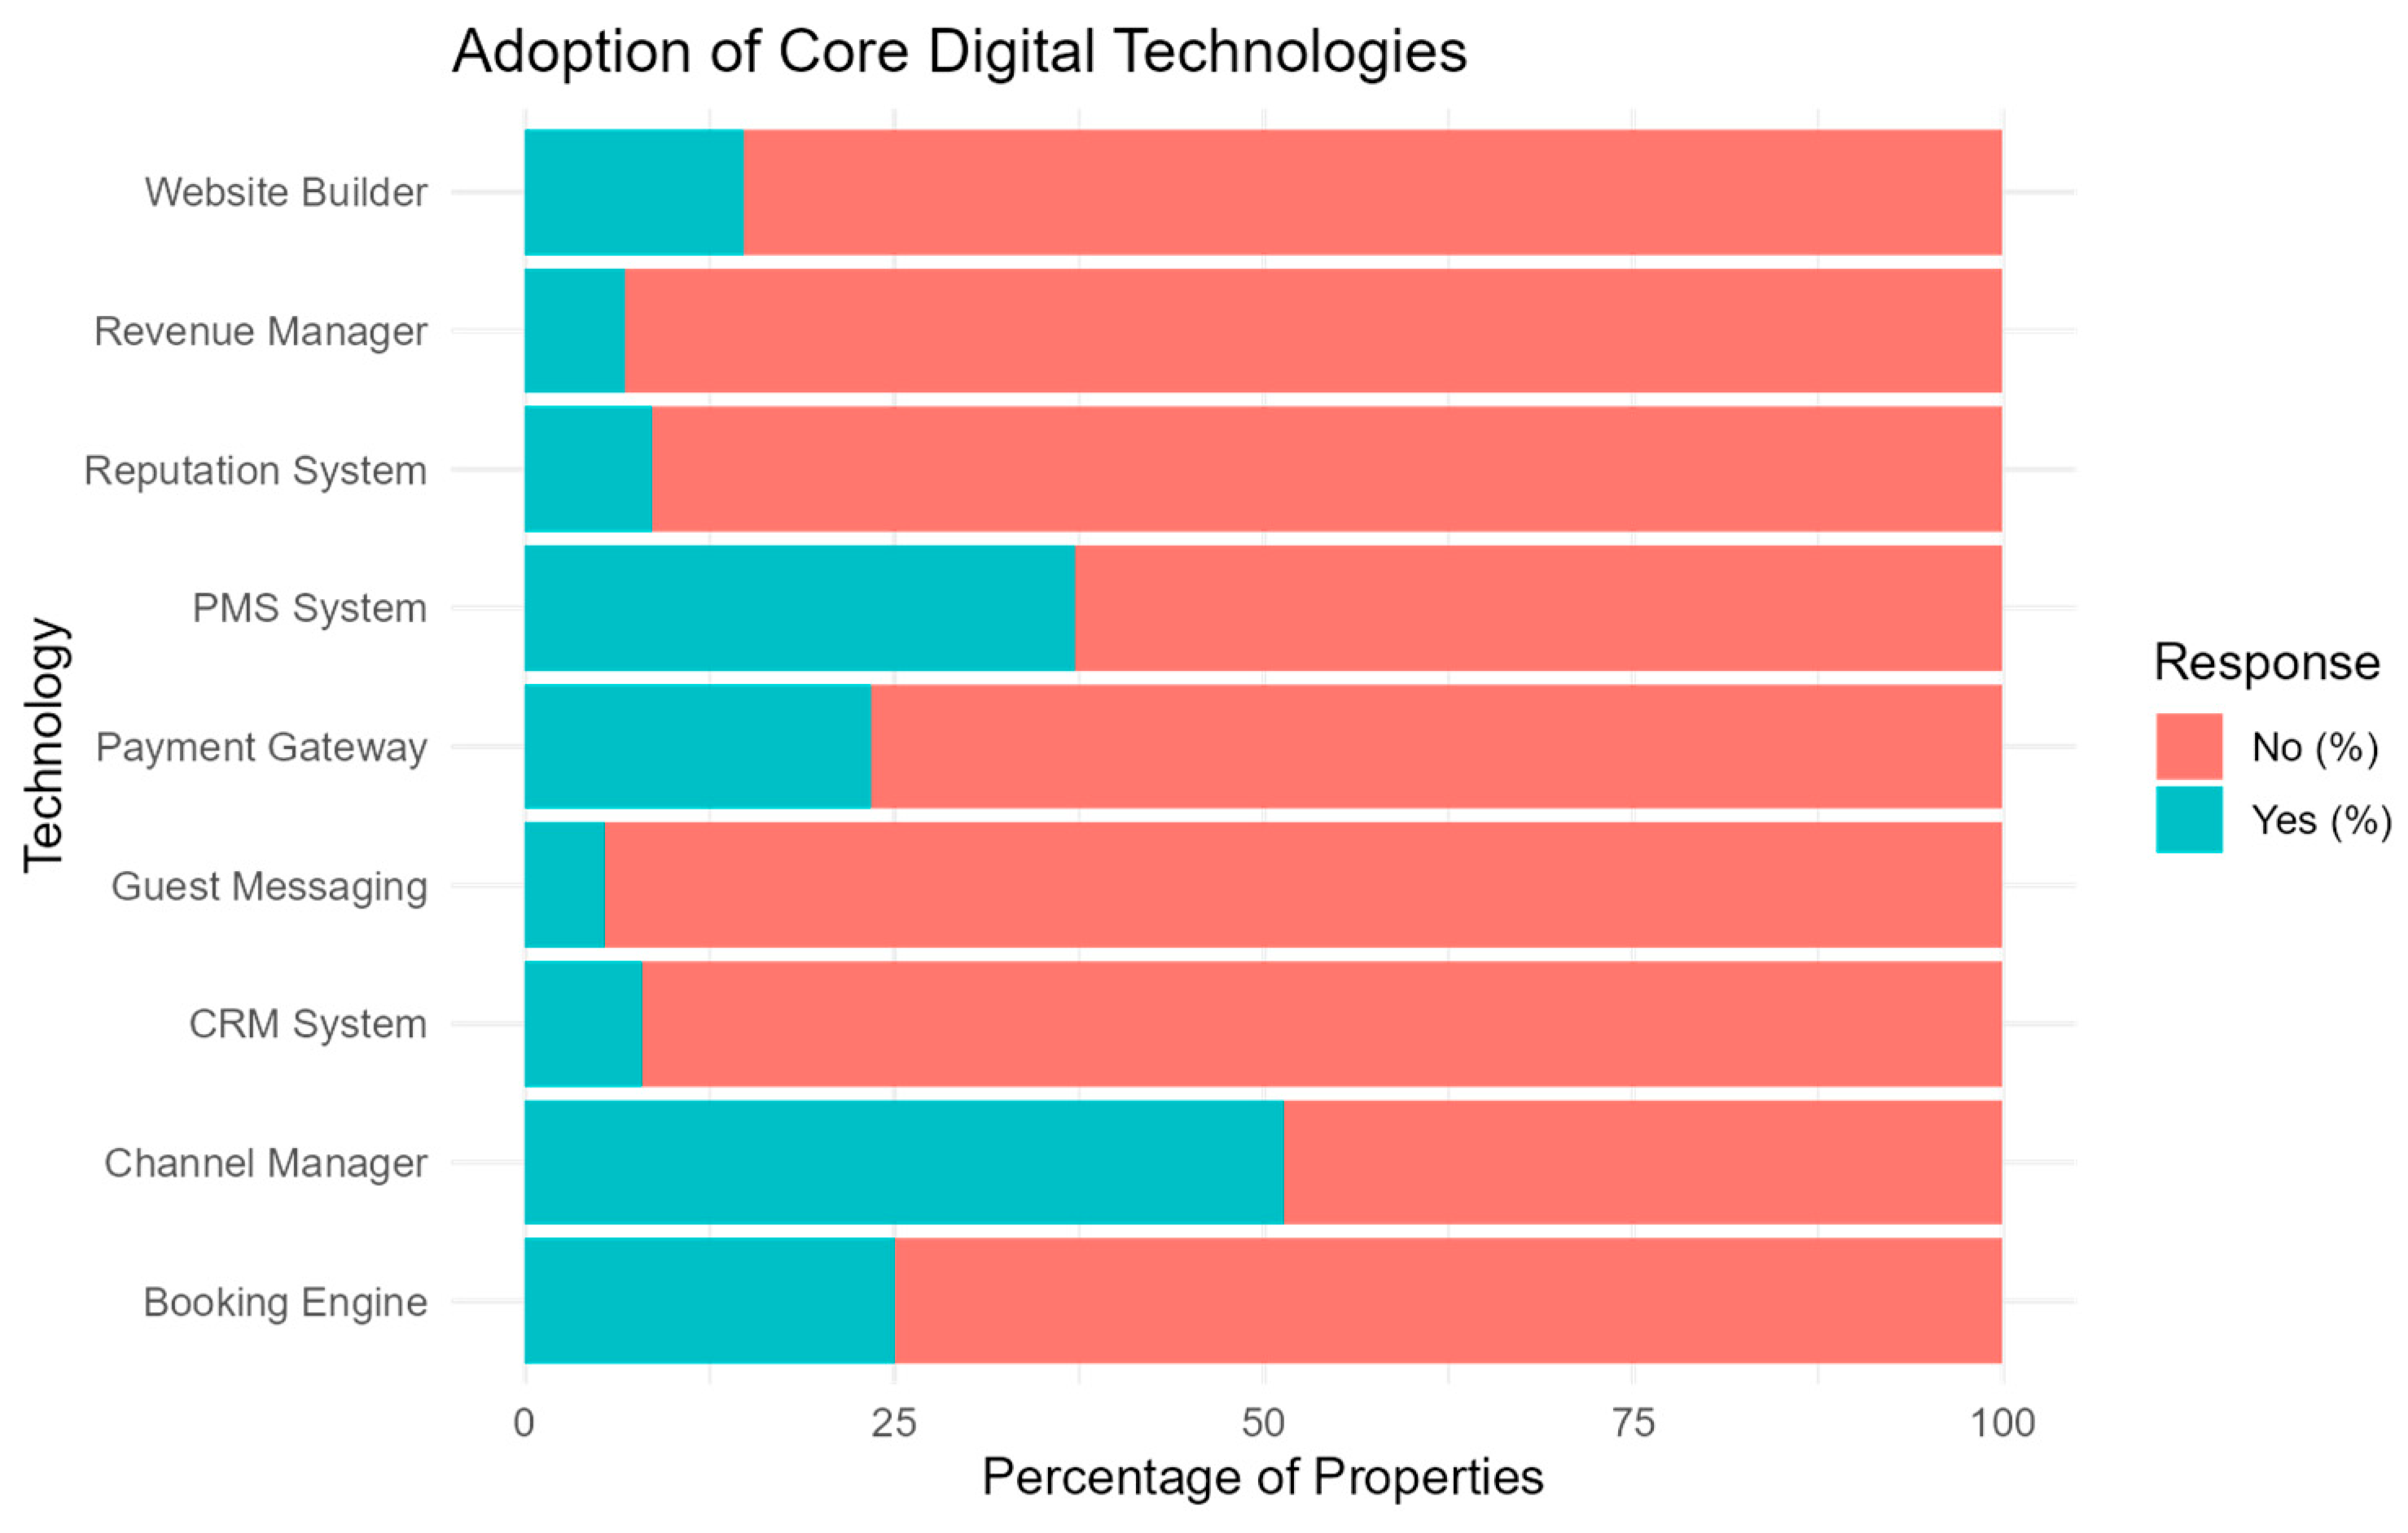
| PMS System | 643 | 1085 | 1728 | 37.2 | 62.8 |
| Channel Manager | 884 | 840 | 1724 | 51.3 | 48.7 |
| CRM System | 135 | 1581 | 1716 | 7.9 | 92.1 |
| Website Builder | 253 | 1453 | 1706 | 14.8 | 85.2 |
| Booking Engine | 425 | 1277 | 1702 | 25.0 | 75.0 |
| Payment Gateway | 328 | 1377 | 1705 | 19.2 | 80.8 |
| Guest Messaging | 107 | 1595 | 1702 | 6.3 | 93.7 |
| Revenue Manager | 91 | 1618 | 1709 | 5.3 | 94.7 |
| Reputation System | 155 | 1556 | 1711 | 9.1 | 90.9 |
| Technology | Count Yes | Count No | Total N | Yes (%) | No (%) |
|---|---|---|---|---|---|
| Self-Check-in | 109 | 1592 | 1701 | 6.4 | 93.6 |
| Upsell System | 32 | 1657 | 1689 | 1.9 | 98.1 |
| Reputation Management | 223 | 1464 | 1687 | 13.2 | 86.8 |
| Smart Lighting and Thermostat Ctrl | 364 | 1321 | 1685 | 21.6 | 78.4 |
| Security Cameras and Motion Sensors | 1167 | 515 | 1682 | 69.4 | 30.6 |
| Keyless Door Management | 469 | 1216 | 1685 | 27.8 | 72.2 |
| Energy-saving Sensors | 411 | 1274 | 1685 | 24.4 | 75.6 |
| Smart Plugs for Device Control | 139 | 1546 | 1685 | 8.3 | 91.7 |
| Cleaning Robots | 58 | 1629 | 1687 | 3.4 | 96.6 |
| Virtual Assistants/Chatbots | 145 | 1541 | 1686 | 8.6 | 91.4 |
| Building Management System (BMS) | 71 | 1615 | 1686 | 4.2 | 95.8 |
| Air Quality Management | 212 | 1473 | 1685 | 12.6 | 87.4 |
| Construct | Count Yes | Count No | Total N | Yes (%) | No (%) |
|---|---|---|---|---|---|
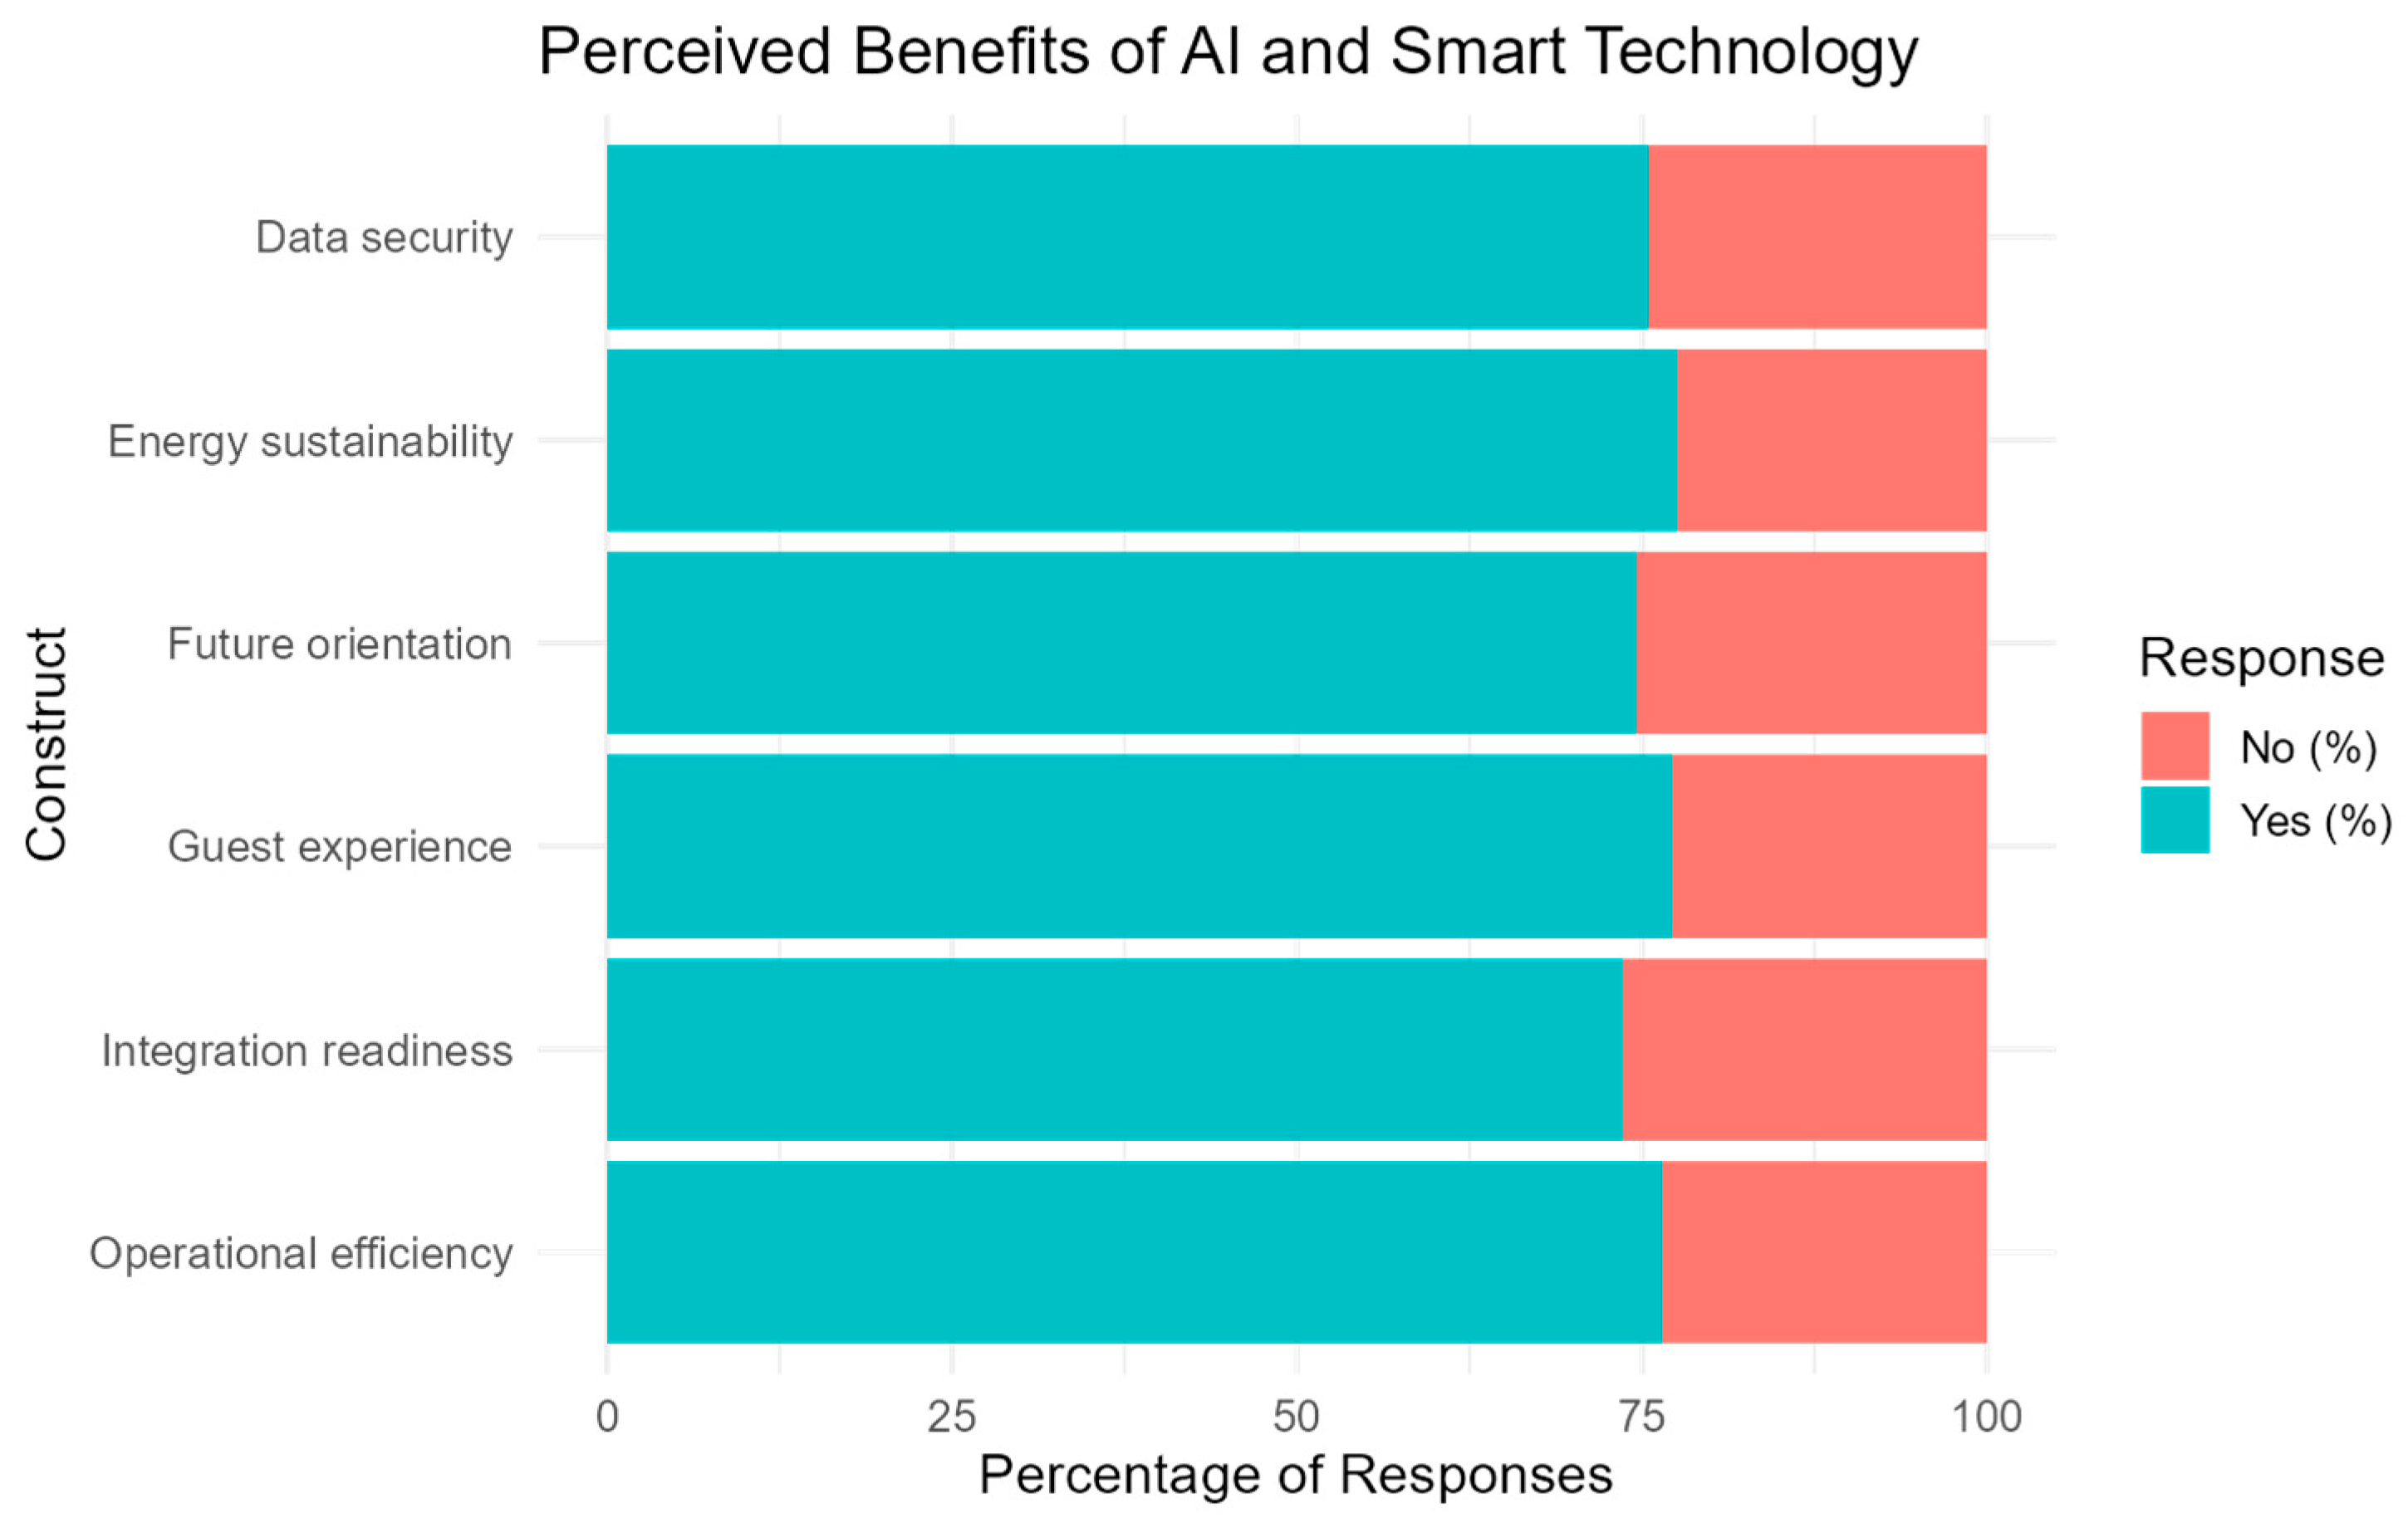
| Data security | 1236 | 404 | 1640 | 75.4 | 24.6 |
| Energy sustainability | 1271 | 366 | 1637 | 77.6 | 22.4 |
| Future orientation | 1205 | 411 | 1616 | 74.6 | 25.4 |
| Guest experience | 1280 | 379 | 1659 | 77.2 | 22.8 |
| Integration readiness | 1192 | 428 | 1620 | 73.6 | 26.4 |
| Operational efficiency | 1254 | 388 | 1642 | 76.4 | 23.6 |
| Barrier | Yes (n, %) | No (n, %) | Total N |
|---|---|---|---|
| High implementation and maintenance costs | 1204 (73.1%) | 444 (26.9%) | 1648 |
| Lack of technical Expertise | 1039 (63.4%) | 599 (36.6%) | 1638 |
| Complexity of integration with existing systems | 1103 (67.5%) | 531 (32.5%) | 1634 |
| Lack of financial resources for investments | 1176 (71.5%) | 469 (28.5%) | 1645 |
| Difficulties in staff training | 964 (59.0%) | 669 (41.0%) | 1633 |
| Data security and privacy Concerns | 806 (49.5%) | 821 (50.5%) | 1627 |
| Limitations of existing Infrastructure | 1033 (62.8%) | 611 (37.2%) | 1644 |
| Factor Correlations and Factor Score Adequacy | ||
| Measure | MR1 | MR2 |
| Factor correlations | 1.00 | 0.31 |
| 0.31 | 1.00 | |
| Factor score adequacy | ||
| Correlation of regression scores with factors | 0.99 | 0.82 |
| Multiple R2 of scores with factors | 0.97 | 0.67 |
| Minimum correlation of possible factor scores | 0.94 | 0.35 |
| Model Fit Statistics | ||
| Fit Statistic | Value | Notes |
| Mean item complexity | 1.1 | Average complexity of item loadings |
| Null model df | 15 | Objective function = 7.35 |
| Null model χ2 | 12,255.52 | p < 0.001 |
| Two-factor model df | 4 | Objective function = 0.01 |
| Likelihood χ2 | 16.3 | p = 0.0026 |
| Empirical χ2 | 0.86 | p = 0.93 |
| RMSR | 0.00 | Root Mean Square of Residuals |
| df-corrected RMSR | 0.01 | Adjusted RMSR |
| Tucker–Lewis Index (TLI) | 0.996 | Excellent fit |
| RMSEA | 0.043 | 90% CI [0.023, 0.066] |
| BIC | −13.38 | Bayesian Information Criterion |
| Fit (off-diagonal) | 1.00 | Based on off-diagonal residuals |
| Item | P35 | P36 | P37 | P38 | P39 | P40 |
|---|---|---|---|---|---|---|
| P35 | 0.144 | 0.019 | −0.006 | −0.006 | −0.010 | 0.004 |
| P36 | 0.019 | 0.185 | 0.024 | −0.014 | −0.014 | −0.016 |
| P37 | −0.006 | 0.024 | 0.190 | 0.001 | −0.003 | −0.014 |
| P38 | −0.006 | −0.014 | 0.001 | 0.160 | 0.010 | 0.009 |
| P39 | −0.010 | −0.014 | −0.003 | 0.010 | 0.155 | 0.017 |
| P40 | 0.004 | −0.016 | −0.014 | 0.009 | 0.017 | 0.170 |
| Test Statistic (χ2) | df | p-Value |
|---|---|---|
| 1440.18 | 2 | <0.001 |
| Comparison | Z | Unadjusted p-Value | Adjusted p-Value |
|---|---|---|---|
| Selective Adopters − Skeptics | 26.51 | <0.001 | <0.001 |
| Selective Adopters − Tech Leaders | −15.43 | <0.001 | <0.001 |
| Skeptics − Tech Leaders | −35.59 | <0.001 | <0.001 |
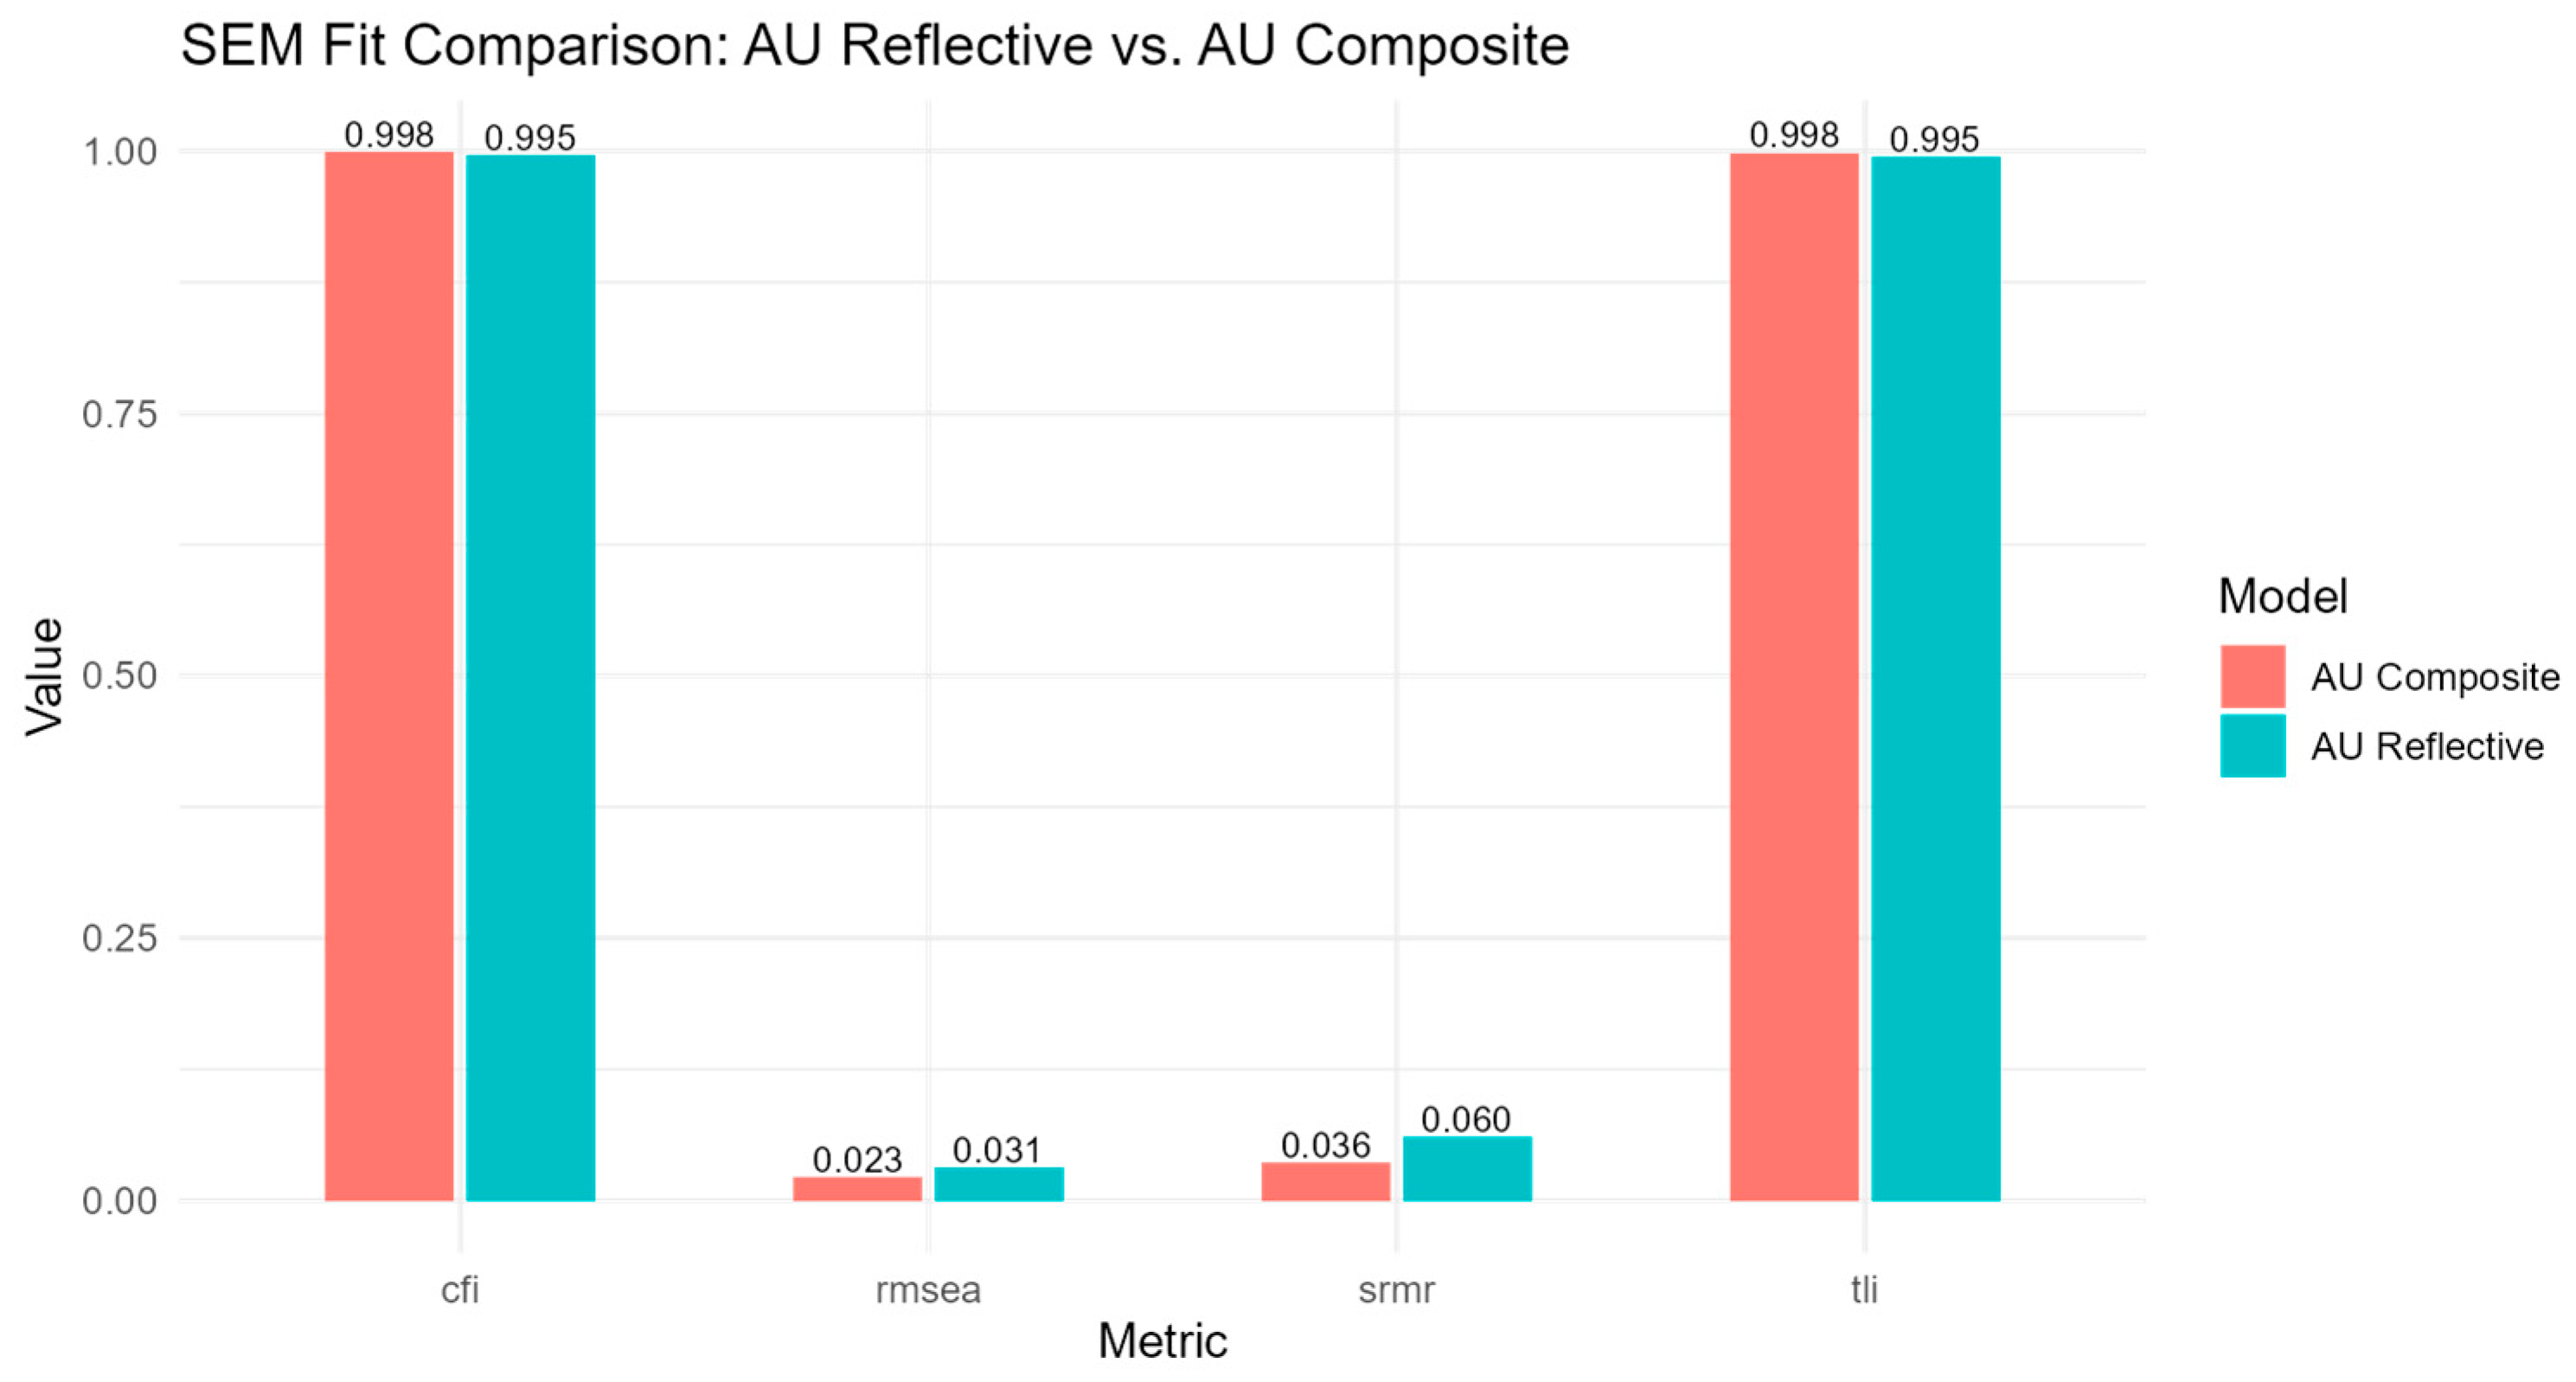
| Fit Index | Value |
|---|---|
| CFI | 0.998 |
| TLI | 0.998 |
| RMSEA | 0.023 |
| SRMR | 0.036 |
| Chi-Square | 213.75 |
| Df | 125 |
| Chi-Square/df | 1.71 |
| Fit Index | Value |
|---|---|
| CFI | 0.995 |
| TLI | 0.995 |
| RMSEA | 0.031 |
| SRMR | 0.060 |
| Chi-Square | 558.12 |
| df | 241 |
| Chi-Square/df | 2.32 |
| Construct | Indicator | Standardized Loading (β) |
|---|---|---|
| PU–Perceived Usefulness | Customer Experience | 0.972 |
| Operational Efficiency | 0.921 | |
| Cost Reduction | 0.891 | |
| PEOU–Perceived Ease of Use | Tech Expertise | 0.964 |
| Integration Complexity | 0.866 | |
| Staff Training | 0.878 | |
| ML1–Adoption Readiness | AI for Customer Data | 0.862 |
| Smart Environment | 0.819 | |
| Reservation Automation | 0.872 | |
| Security Innovation | 0.902 | |
| Operational Innovation | 0.903 | |
| AI for Operations | 0.879 | |
| BI–Behavioral Intention | Single Platform | 0.957 |
| AI Personalization | 0.949 | |
| Env_CompPress– Environmental Competitive Pressure | Improve Security | 0.893 |
| Certified Technology | 0.972 | |
| Cyber Training | 0.922 |
| Item | N (Non-Missing) | N (Missing) | % Yes (1) | % No (0) |
|---|---|---|---|---|
| P6 | 1582 | 89 | 35.2 | 0.0 |
| P10 | 1570 | 101 | 8.3 | 0.0 |
| P12 | 1562 | 109 | 15.7 | 0.0 |
| P14 | 1557 | 114 | 26.5 | 0.0 |
| P16 | 1557 | 114 | 24.5 | 0.0 |
| P18 | 1547 | 124 | 7.4 | 0.0 |
| P20 | 1545 | 126 | 6.0 | 0.0 |
| Number of AU Items Completed (Contributed) | Frequency (n) |
|---|---|
| 0 | 75 |
| 1 | 17 |
| 2 | 7 |
| 3 | 7 |
| 4 | 14 |
| 5 | 15 |
| 6 | 40 |
| 7 (all items answered) | 1,494 |
| Endogenous Variable | R2 (Composite Model) | R2 (Reflective Model) |
|---|---|---|
| P44_1 | 0.820 | 0.820 |
| P44_2 | 0.780 | 0.775 |
| P44_3 | 0.911 | 0.905 |
| P34_2 | 0.929 | 0.920 |
| P34_3 | 0.748 | 0.748 |
| P34_5 | 0.772 | 0.780 |
| P35 | 0.755 | 0.769 |
| P36 | 0.671 | 0.675 |
| P37 | 0.764 | 0.768 |
| P38 | 0.803 | 0.776 |
| P39 | 0.809 | 0.794 |
| P40 | 0.770 | 0.769 |
| P48_2 | 0.916 | 0.918 |
| P48_5 | 0.900 | 0.903 |
| P6 | – | 0.644 |
| P10 | – | 0.776 |
| P12 | – | 0.833 |
| P14 | – | 0.682 |
| P16 | – | 0.410 |
| P18 | – | 0.914 |
| P20 | – | 0.852 |
| P45_1 | 0.795 | 0.798 |
| P45_2 | 0.945 | 0.952 |
| P45_3 | 0.852 | 0.849 |
| PU | 0.860 | 0.859 |
| BI | 0.785 | 0.785 |
| AU_comp/AU | 0.126 | 0.177 |
| Dependent Variable | Predictor | VIF |
|---|---|---|
| PU | Innovation Readiness (ML1) | 1.6 |
| Perceived Ease of Use (PEOU) | 1.4 | |
| Environmental Competitive Pressure | 1.9 | |
| BI | Perceived Usefulness (PU) | 1.7 |
| Perceived Ease of Use (PEOU) | 1.8 | |
| AU_comp | Behavioral Intention (BI) | 6.4 |
| Environmental Competitive Pressure | 6.0 | |
| Innovation Readiness (ML1) | 1.9 | |
| Perceived Ease of Use (PEOU) | 1.7 |
| Cluster Membership by Property Size | ||||
| Room Size Category | Tech Leaders (n, %) | Selective Adopters (n, %) | Skeptics (n, %) | Total (N) |
| Micro (<10) | 130 (17.1%) | 317 (41.7%) | 313 (41.2%) | 760 |
| Small (11–20) | 83 (17.5%) | 223 (47.1%) | 167 (35.3%) | 473 |
| Medium (21–50) | 62 (18.3%) | 138 (40.8%) | 138 (40.8%) | 338 |
| Large (>50) | 21 (16.8%) | 48 (38.4%) | 56 (44.8%) | 125 |
| Cluster Membership by Region (Selected Municipalities) | ||||
| Region | Selective Adopters (n, %) | Skeptics (n, %) | Tech Leaders (n, %) | |
| Berat | 28 (52.8%) | 20 (37.7%) | 5 (9.4%) | |
| Dibër | 14 (58.3%) | 10 (41.7%) | 0 (0.0%) | |
| Durrës | 61 (54.5%) | 30 (26.8%) | 21 (18.8%) | |
| Elbasan | 17 (34.0%) | 29 (58.0%) | 4 (8.0%) | |
| Gjirokastër | 10 (62.5%) | 6 (37.5%) | 0 (0.0%) | |
| Himarë | 64 (63.4%) | 28 (27.7%) | 9 (8.9%) | |
| Korçë | 31 (35.2%) | 45 (51.1%) | 12 (13.6%) | |
| Lezhë | 40 (54.1%) | 21 (28.4%) | 13 (17.6%) | |
| Pogradec | 10 (45.5%) | 8 (36.4%) | 4 (18.2%) | |
| Sarandë | 104 (33.7%) | 137 (44.3%) | 68 (22.0%) | |
| Shkodër | 71 (38.6%) | 78 (42.4%) | 35 (19.0%) | |
| Tiranë | 80 (37.6%) | 97 (45.5%) | 36 (16.9%) | |
| Vlorë | 42 (50.0%) | 36 (42.9%) | 6 (7.1%) | |
References
- AIDA/UNWTO. (2024). Tourism doing business–Investing in Albania. Available online: https://aida.gov.al/wp-content/uploads/2024/04/tourism-doing-business-investing-in-albania.pdf (accessed on 21 July 2025).
- Ali, O., Murray, P. A., Muhammed, S., Dwivedi, Y. K., & Rashiti, S. (2022). Evaluating organizational level IT innovation adoption factors among global firms. Journal of Innovation & Knowledge, 7(3), 100213. [Google Scholar] [CrossRef]
- Alsharif, A., Isa, S. M., & Alqudah, M. N. (2024). Smart tourism, hospitality, and destination: A systematic review and future directions. Journal of Tourism and Services, 15(29), 72–110. [Google Scholar] [CrossRef]
- Bartlett, M. S. (1954). A note on the multiplying factors for various χ2 approximations. Journal of the Royal Statistical Society Series B: Statistical Methodology, 16(2), 296–298. [Google Scholar] [CrossRef]
- Brown, T. A. (2015). Confirmatory factor analysis for applied research (2nd ed.). The Guilford Press. [Google Scholar]
- Buhalis, D., & Leung, R. (2018). Smart hospitality—Interconnectivity and interoperability towards an ecosystem. International Journal of Hospitality Management, 71, 41–50. [Google Scholar] [CrossRef]
- Byrne, B. M. (2016). Structural equation modeling with AMOS: Basic concepts, applications, and programming (3rd ed.). Routledge. [Google Scholar] [CrossRef]
- Chen, Y., Hu, Y., Zhou, S., & Yang, S. (2023). Investigating the determinants of performance of artificial intelligence adoption in hospitality industry during COVID-19. International Journal of Contemporary Hospitality Management, 35(8), 2868–2889. [Google Scholar] [CrossRef]
- Cronbach, L. J. (1951). Coefficient alpha and the internal structure of tests. Psychometrika, 16(3), 297–334. [Google Scholar] [CrossRef]
- Davis, F. D. (1989). Perceived usefulness, perceived ease of use, and user acceptance of information technology. MIS Quarterly, 13(3), 319. [Google Scholar] [CrossRef]
- Dayour, F., Adongo, S., & Kosoe, E. A. (2023). The boon and bane of ICT services to small and medium-sized tourism and hospitality enterprises (SMTHEs) in northern Ghana. Small Enterprise Research, 30(2), 255–273. [Google Scholar] [CrossRef]
- Dwivedi, Y. K., Kshetri, N., Hughes, L., Slade, E. L., Jeyaraj, A., Kar, A. K., Baabdullah, A. M., Koohang, A., Raghavan, V., Ahuja, M., Albanna, H., Albashrawi, M. A., Al-Busaidi, A. S., Balakrishnan, J., Barlette, Y., Basu, S., Bose, I., Brooks, L., Buhalis, D., … Wright, R. (2023). Opinion paper: “So what if ChatGPT wrote it?” Multidisciplinary perspectives on opportunities, challenges and implications of generative conversational AI for research, practice and policy. International Journal of Information Management, 71, 102642. [Google Scholar] [CrossRef]
- EUROSTAT. (2023). Cloud computing—Statistics on the use by enterprises. Available online: https://ec.europa.eu/eurostat/statistics-explained/index.php?title=Cloud_computing_-_statistics_on_the_use_by_enterprises (accessed on 21 July 2025).
- EUROSTAT. (2025). Use of artificial intelligence in enterprises. Available online: https://ec.europa.eu/eurostat/statistics-explained/index.php?title=Use_of_artificial_intelligence_in_enterprises (accessed on 21 July 2025).
- Gajić, T., Vukolić, D., Bugarčić, J., Đoković, F., Spasojević, A., Knežević, S., Đorđević Boljanović, J., Glišić, S., Matović, S., & Dávid, L. D. (2024). The adoption of artificial intelligence in Serbian hospitality: A potential path to sustainable practice. Sustainability, 16(8), 3172. [Google Scholar] [CrossRef]
- Garrido, L. E., Abad, F. J., & Ponsoda, V. (2013). A new look at Horn’s parallel analysis with ordinal variables. Psychological Methods, 18(4), 454–474. [Google Scholar] [CrossRef] [PubMed]
- Gursoy, D., Li, Y., & Song, H. (2023). ChatGPT and the hospitality and tourism industry: An overview of current trends and future research directions. Journal of Hospitality Marketing & Management, 32(5), 579–592. [Google Scholar] [CrossRef]
- Hair, J. F., Hult, G. T. M., Ringle, C. M., & Sarstedt, M. (2022). A primer on partial least squares structural equation modeling (PLS-SEM) (3rd ed.). SAGE Publications, Incorporated. [Google Scholar]
- Hameed, M. A., Counsell, S., & Swift, S. (2012). A meta-analysis of relationships between organizational characteristics and IT innovation adoption in organizations. Information & Management, 49(5), 218–232. [Google Scholar] [CrossRef]
- Hayton, J. C., Allen, D. G., & Scarpello, V. (2004). Factor retention decisions in exploratory factor analysis: A tutorial on parallel analysis. Organizational Research Methods, 7(2), 191–205. [Google Scholar] [CrossRef]
- Holgado–Tello, F. P., Chacón–Moscoso, S., Barbero–García, I., & Vila–Abad, E. (2010). Polychoric versus Pearson correlations in exploratory and confirmatory factor analysis of ordinal variables. Quality & Quantity, 44(1), 153–166. [Google Scholar] [CrossRef]
- Horn, J. L. (1965). A rationale and test for the number of factors in factor analysis. Psychometrika, 30(2), 179–185. [Google Scholar] [CrossRef]
- Ifinedo, P. (2012, January 4–7). Technology acceptance by health professionals in Canada: An analysis with a modified UTAUT model. 2012 45th Hawaii International Conference on System Sciences (pp. 2937–2946), Maui, HI, USA. [Google Scholar] [CrossRef]
- INSTAT. (2024). Tourism statistics. Available online: https://www.instat.gov.al/en/themes/industry-trade-and-services/tourism-statistics/#tab3 (accessed on 21 July 2025).
- Ivanov, S., & Webster, C. (2020). Robots in tourism: A research agenda for tourism economics. Tourism Economics, 26(7), 1065–1085. [Google Scholar] [CrossRef]
- Ivanov, S., Webster, C., & Berezina, K. (2022). Handbook of e-Tourism. Springer International Publishing. [Google Scholar] [CrossRef]
- Kaiser, H. F. (1974). An index of factorial simplicity. Psychometrika, 39(1), 31–36. [Google Scholar] [CrossRef]
- Khang, A., Dutta, P. K., Gupta, S., Ayedee, N., & Chatterjee, S. (2024). Revolutionizing the AI-digital landscape: A guide to sustainable emerging technologies for marketing professionals (1st ed.). Productivity Press. [Google Scholar] [CrossRef]
- Kim, H., So, K. K. F., Shin, S., & Li, J. (2025). Artificial intelligence in hospitality and tourism: Insights from industry practices, research literature, and expert opinions. Journal of Hospitality & Tourism Research, 49(2), 366–385. [Google Scholar] [CrossRef]
- Kline, R. B. (2016). Principles and practice of structural equation modeling (4th ed.). The Guilford Press. [Google Scholar]
- Majid, G. M., Tussyadiah, I., Kim, Y. R., & Pal, A. (2023). Intelligent automation for sustainable tourism: A systematic review. Journal of Sustainable Tourism, 31(11), 2421–2440. [Google Scholar] [CrossRef]
- Mariani, M. (2019). Big data and analytics in tourism and hospitality: A perspective article. Tourism Review, 75(1), 299–303. [Google Scholar] [CrossRef]
- Mariani, M., & Borghi, M. (2023). Exploring environmental concerns on digital platforms through big data: The effect of online consumers’ environmental discourse on online review ratings. Journal of Sustainable Tourism, 31(11), 2592–2611. [Google Scholar] [CrossRef]
- McDonald, R. P. (2013). Test theory: A unified treatment (1st ed.). Psychology Press. [Google Scholar] [CrossRef]
- Muça, E., Boboli, I., Kapaj, I., & Kapaj Mane, A. (2022). Smart technology effecting tourism development in Albania. Journal of Environmental Management and Tourism, 13(8), 2113. [Google Scholar] [CrossRef] [PubMed]
- Muthén, L. K., & Muthén, B. O. (2017). Mplus user’s guide (8th ed.). Muthén & Muthén. Available online: https://www.statmodel.com/download/usersguide/MplusUserGuideVer_8.pdf (accessed on 21 July 2025).
- Nicolau, J. L., Xiang, Z., & Wang, D. (2024). Daily online review sentiment and hotel performance. International Journal of Contemporary Hospitality Management, 36(3), 790–811. [Google Scholar] [CrossRef]
- Nikopoulou, M., Kourouthanassis, P., Chasapi, G., Pateli, A., & Mylonas, N. (2023). Determinants of digital transformation in the hospitality industry: Technological, organizational, and environmental drivers. Sustainability, 15(3), 2736. [Google Scholar] [CrossRef]
- Nunnally, J. C., & Bernstein, I. H. (1994). Psychometric theory (3rd ed., pp. 248–292). McGraw-Hill. [Google Scholar]
- Omowole, B. M., Olufemi-Philips, A. Q., Ofadile, O. C., Eyo-Udo, N. L., & Ewim, S. E. (2024). Barriers and drivers of digital transformation in SMEs: A conceptual analysis. International Journal of Scholarly Research in Science and Technology, 5(2), 019–036. [Google Scholar] [CrossRef]
- Parvez, M. O., Eluwole, K. K., Lasisi, T. T., & Kim, W. G. (2025). GenAI in hotel operations: ChatGPT adoption among front-office employees. Current Issues in Tourism, 28, 1–15. [Google Scholar] [CrossRef]
- Peng, X., Zhang, L., Lee, S., Song, W., & Shou, K. (2025). Navigating hospitality innovation (1995–2023): A bibliometric review and forward outlook. Journal of Hospitality and Tourism Technology, 16(1), 91–123. [Google Scholar] [CrossRef]
- Pergelova, A., Beck, S., Zwiegelaar, J., & Stylos, N. (2024). Smart technologies use by SMEs in the hospitality industry: Implications for customer interactions and organizational resilience. In N. Stylos, R. Rahimi, & P. Robinson (Eds.), Contemporary marketing management for tourism and hospitality (pp. 67–97). Springer International Publishing. [Google Scholar] [CrossRef]
- Phaphoom, N., Wang, X., Samuel, S., Helmer, S., & Abrahamsson, P. (2017). A survey study on major technical barriers affecting the decision to adopt cloud services. arXiv, arXiv:1712.00606. [Google Scholar] [CrossRef]
- Porsdam Mann, S., Vazirani, A. A., Aboy, M., Earp, B. D., Minssen, T., Cohen, I. G., & Savulescu, J. (2024). Guidelines for ethical use and acknowledgement of large language models in academic writing. Nature Machine Intelligence, 6(11), 1272–1274. [Google Scholar] [CrossRef]
- Revelle, W. (2024). psych: Procedures for psychological, psychometric, and personality research (Version 2.5.6) [Computer software]. Northwestern University; Comprehensive R Archive Network (CRAN). Available online: https://cran.r-project.org/web/packages/psych/index.html (accessed on 21 July 2025).
- Rogers, E. M. (2003). Diffusion of innovations (5th ed.). Free Press. [Google Scholar]
- Rousseeuw, P. J. (1987). Silhouettes: A graphical aid to the interpretation and validation of cluster analysis. Journal of Computational and Applied Mathematics, 20, 53–65. [Google Scholar] [CrossRef]
- Sánchez, E., Calderón, R., & Herrera, F. (2025). Artificial intelligence adoption in SMEs: Survey based on TOE–DOI framework, primary methodology and challenges. Applied Sciences, 15(12), 6465. [Google Scholar] [CrossRef]
- Schumacker, R. E., & Lomax, R. G. (2015). A beginner’s guide to structural equation modeling (4th ed.). Routledge. [Google Scholar] [CrossRef]
- Shin, H., Ryu, J., & Jo, Y. (2025). Navigating artificial intelligence adoption in hospitality and tourism: Managerial insights, workforce transformation, and a future research agenda. International Journal of Hospitality Management, 128, 104187. [Google Scholar] [CrossRef]
- Sigala, M. (2020). Tourism and COVID-19: Impacts and implications for advancing and resetting industry and research. Journal of Business Research, 117, 312–321. [Google Scholar] [CrossRef]
- Soomro, R. B., Al-Rahmi, W. M., Dahri, N. A., Almuqren, L., Al-mogren, A. S., & Aldaijy, A. (2025). A SEM–ANN analysis to examine impact of artificial intelligence technologies on sustainable performance of SMEs. Scientific Reports, 15(1), 5438. [Google Scholar] [CrossRef]
- Šakytė-Statnickė, G., & Budrytė-Ausiejienė, L. (2025). Application of artificial intelligence in the tourism sector: Benefits and challenges of AI-based digital tools in tourism organizations of Lithuania, Latvia, and Sweden. Tourism and Hospitality, 6(2), 67. [Google Scholar] [CrossRef]
- Thorndike, R. L. (1953). Who belongs in the family? Psychometrika, 18(4), 267–276. [Google Scholar] [CrossRef]
- Tibshirani, R., Walther, G., & Hastie, T. (2001). Estimating the number of clusters in a data set via the gap statistic. Journal of the Royal Statistical Society Series B: Statistical Methodology, 63(2), 411–423. [Google Scholar] [CrossRef]
- To, W. M., & Yu, B. T. W. (2025). Artificial intelligence research in tourism and hospitality journals: Trends, emerging themes, and the rise of generative AI. Tourism and Hospitality, 6(2), 63. [Google Scholar] [CrossRef]
- Tornatzky, L. G., & Fleischer, M. (1990). The processes of technological innovation. Lexington Books. [Google Scholar]
- Trai, D. V., Tien, N. H., & Quyet, N. X. (2025). The impact of digital transformation on tourism sustainable development: A case of SMEs in Vietnam. International Journal of Entrepreneurship and Small Business. Advance online publication. [Google Scholar] [CrossRef]
- Tussyadiah, I. (2020). A review of research into automation in tourism: Launching the annals of tourism research curated collection on artificial intelligence and robotics in tourism. Annals of Tourism Research, 81, 102883. [Google Scholar] [CrossRef]
- Venkatesh, V., & Davis, F. D. (2000). A theoretical extension of the technology Acceptance Model: Four Longitudinal Field Studies. Management Science, 46(2), 186–204. [Google Scholar] [CrossRef]
- Venkatesh, V., Morris, M. G., Davis, G. B., & Davis, F. D. (2003). User acceptance of information technology: Toward a unified view. MIS Quarterly, 27(3), 425. [Google Scholar] [CrossRef]
- Venkatesh, V., Thong, J. Y., & Xu, X. (2012). Consumer acceptance and use of information technology: Extending the unified theory of acceptance and use of technology. MIS Quarterly, 36(1), 157. [Google Scholar] [CrossRef]
- Vrontis, D., Chaudhuri, R., & Chatterjee, S. (2022). Adoption of digital technologies by SMEs for sustainability and value creation: Moderating role of entrepreneurial orientation. Sustainability, 14(13), 7949. [Google Scholar] [CrossRef]
- Walle, A. D., Hunde, M. K., & Demsash, A. W. (2023). Healthcare professionals’ intention to adopt mobile phone-based SMS and its predictors for adherence support and care of TB patients in a resource-limited setting: A structural equation modelling analysis. BMJ Open, 13(12), e070813. [Google Scholar] [CrossRef]
- Wang, W., & Mohamed, M. (2025). Will users practice what they preach? Exploring the influencing factors of the intention behaviour gap in electric vehicles adoption. Transportation Research Interdisciplinary Perspectives, 31, 101424. [Google Scholar] [CrossRef]
- Wickham, H. (2016). Ggplot2. Springer International Publishing. [Google Scholar] [CrossRef]
- Wickham, H., François, R., Henry, L., Müller, K., & Vaughan, D. (2014). dplyr: A grammar of data manipulation (Version 1.1.4) [Dataset]. The Comprehensive R Archive Network. [Google Scholar] [CrossRef]
- Wong, I. A., Lian, Q. L., & Sun, D. (2023a). Autonomous travel decision-making: An early glimpse into ChatGPT and generative AI. Journal of Hospitality and Tourism Management, 56, 253–263. [Google Scholar] [CrossRef]
- Wong, I. A., Zhang, T., Lin, Z. C., & Peng, Q. (2023b). Hotel AI service: Are employees still needed? Journal of Hospitality and Tourism Management, 55, 416–424. [Google Scholar] [CrossRef]
- Yan, Z., Konar, R., & Balasubramanian, K. (2024). The future of hotels robotics, AI, and service automation in practice. In E. Ozen, A. Singh, S. Taneja, R. Rajaram, & J. P. Davim (Eds.), Advances in E-business research (pp. 249–278). IGI Global. [Google Scholar] [CrossRef]


| Path (lhs → rhs) | Estimate | SE | Z | p-Value | 95% CI Lower | 95% CI Upper | Std. Loading (β) |
|---|---|---|---|---|---|---|---|
| PU = ~P44_1 | 0.339 | 0.026 | 12.88 | <0.001 | 0.287 | 0.391 | 0.906 |
| PU = ~P44_2 | 0.330 | 0.026 | 12.91 | <0.001 | 0.280 | 0.381 | 0.883 |
| PU = ~P44_3 | 0.357 | 0.028 | 12.62 | <0.001 | 0.302 | 0.413 | 0.954 |
| PEOU = ~P34_2 | 0.964 | 0.017 | 55.65 | <0.001 | 0.930 | 0.998 | 0.964 |
| PEOU = ~P34_3 | 0.865 | 0.021 | 41.53 | <0.001 | 0.824 | 0.905 | 0.865 |
| PEOU = ~P34_5 | 0.879 | 0.019 | 47.28 | <0.001 | 0.842 | 0.915 | 0.879 |
| RL1 = ~P35 | 1.071 | 0.038 | 28.23 | <0.001 | 0.997 | 1.145 | 0.869 |
| RL1 = ~P36 | 1.063 | 0.043 | 24.92 | <0.001 | 0.979 | 1.146 | 0.819 |
| RL1 = ~P37 | 1.152 | 0.045 | 25.47 | <0.001 | 1.064 | 1.241 | 0.874 |
| RL1 = ~P38 | 1.139 | 0.041 | 27.57 | <0.001 | 1.058 | 1.220 | 0.896 |
| RL1 = ~P39 | 1.140 | 0.041 | 27.98 | <0.001 | 1.060 | 1.220 | 0.899 |
| RL1 = ~P40 | 1.086 | 0.039 | 27.82 | <0.001 | 1.010 | 1.163 | 0.878 |
| BI = ~P48_2 | 0.444 | 0.027 | 16.45 | <0.001 | 0.391 | 0.497 | 0.957 |
| BI = ~P48_5 | 0.440 | 0.027 | 16.51 | <0.001 | 0.388 | 0.492 | 0.949 |
| Env_CompPress = ~P45_1 | 0.892 | 0.013 | 66.58 | <0.001 | 0.865 | 0.918 | 0.892 |
| Env_CompPress = ~P45_2 | 0.972 | 0.008 | 116.94 | <0.001 | 0.956 | 0.988 | 0.972 |
| Env_CompPress = ~P45_3 | 0.923 | 0.011 | 84.21 | <0.001 | 0.901 | 0.944 | 0.923 |
| PU ← PEOU | 0.096 | 0.090 | 1.07 | 0.287 | −0.081 | 0.273 | 0.036 |
| PU ← RL1 | −0.317 | 0.058 | −5.50 | <0.001 | −0.430 | −0.204 | −0.119 |
| PU ← Env_CompPress | 2.312 | 0.229 | 10.11 | <0.001 | 1.864 | 2.760 | 0.865 |
Disclaimer/Publisher’s Note: The statements, opinions and data contained in all publications are solely those of the individual author(s) and contributor(s) and not of MDPI and/or the editor(s). MDPI and/or the editor(s) disclaim responsibility for any injury to people or property resulting from any ideas, methods, instructions or products referred to in the content. |
© 2025 by the authors. Licensee MDPI, Basel, Switzerland. This article is an open access article distributed under the terms and conditions of the Creative Commons Attribution (CC BY) license (https://creativecommons.org/licenses/by/4.0/).
Share and Cite
Godolja, M.; Tavanxhiu, T.; Sevrani, K. Strategic Readiness for AI and Smart Technology Adoption in Emerging Hospitality Markets: A Tri-Lens Assessment of Barriers, Benefits, and Segments in Albania. Tour. Hosp. 2025, 6, 187. https://doi.org/10.3390/tourhosp6040187
Godolja M, Tavanxhiu T, Sevrani K. Strategic Readiness for AI and Smart Technology Adoption in Emerging Hospitality Markets: A Tri-Lens Assessment of Barriers, Benefits, and Segments in Albania. Tourism and Hospitality. 2025; 6(4):187. https://doi.org/10.3390/tourhosp6040187
Chicago/Turabian StyleGodolja, Majlinda, Tea Tavanxhiu, and Kozeta Sevrani. 2025. "Strategic Readiness for AI and Smart Technology Adoption in Emerging Hospitality Markets: A Tri-Lens Assessment of Barriers, Benefits, and Segments in Albania" Tourism and Hospitality 6, no. 4: 187. https://doi.org/10.3390/tourhosp6040187
APA StyleGodolja, M., Tavanxhiu, T., & Sevrani, K. (2025). Strategic Readiness for AI and Smart Technology Adoption in Emerging Hospitality Markets: A Tri-Lens Assessment of Barriers, Benefits, and Segments in Albania. Tourism and Hospitality, 6(4), 187. https://doi.org/10.3390/tourhosp6040187


