Article

Beyond the Tables: Measuring the Impact of Non-Gaming Diversification on Casino Profitability in Macau

by
Qizhou Luo
* and
Shunfeng Song
College of Business, University of Nevada, Reno, NV 89557, USA
*
Author to whom correspondence should be addressed.
Tour. Hosp. 2025, 6(2), 91; https://doi.org/10.3390/tourhosp6020091
Submission received: 17 April 2025 / Revised: 12 May 2025 / Accepted: 16 May 2025 / Published: 21 May 2025

Abstract

:
This study investigates the relationship between diversification and profitability in Macau’s gaming firms, offering quantitative evidence from the world’s largest gambling market. Compared to other major gambling hubs such as Las Vegas, Macau’s gaming companies generate higher revenues but exhibit significantly lower levels of diversification, highlighting an urgent need for strategic expansion beyond gaming. Drawing on governmental data and company financial reports issued from 2010 to 2019, this research employs a combination of case study analysis, linear regression modeling, and bootstrapping techniques. The findings reveal that an increased share of non-gaming business significantly enhances profitability metrics, including net profit margin, return on assets, and a firm’s profit share within the overall gaming market. These results offer valuable implications for the development of corporate strategies, regulatory frameworks, and future academic research.

1. Introduction

“What I like about casinos is that they allow us to build hotels. A slot machine, a blackjack table, or a roulette table—they have no power. It’s the non-casino stuff that keep people coming back again and again”, remarked Steve Wynn, a prominent Las Vegas gambling mogul (WSJ, 2014). Wynn’s emphasis on “non-casino stuff” has proved highly effective in Las Vegas. Following the opening of Wynn Macau in 2006, the company’s Macau casinos quickly emerged as the primary revenue driver for the Wynn group (Saiidi, 2018). By 2024, Macau’s gross gaming revenue (GGR) reached MOP 226.8 billion (approximately USD 28.35 billion), far surpassing Las Vegas’ USD 8.8 billion, reinforcing its position as the world’s leading gambling market (Reuters, 2025; The Nevada Independent, 2025). This disparity raises a critical question: does the non-gaming sector enhance the profitability of gaming companies in Macau, as it does in the United States? This study seeks to explore how diversification influences the profitability of gaming firms in the world’s largest gambling market.
Macau is a globally renowned tourism destination, famous for its vibrant gaming industry, luxury resorts, and UNESCO-listed heritage sites. It serves as a cultural bridge between East and West, blending Portuguese colonial history with Chinese traditions. As the world’s largest gambling market by revenue, Macau plays a crucial role in international leisure and entertainment tourism, especially for visitors from mainland China.
Macau’s gaming companies derive the majority of their revenue from gambling operations. Between 2010 and 2019, gaming revenue accounted for an average of over 90% of their total earnings. In contrast, gaming firms in Las Vegas reported a gaming revenue share of just above 30% during the same period. Although the proportion of non-gaming revenue for Macau’s gaming firms has been increasing, it remains a relatively small fraction of their overall income. This suggests significant potential for growth in non-gaming sectors, such as hotels, restaurants, and shopping malls. Moreover, there is an urgent need for Macau’s gaming companies to increase their non-gaming revenue share to ensure their sustainable development (see Figure 1).
Diversifying business operations and expanding the share of non-gaming revenue offers numerous benefits for gaming companies. The non-gaming component can effectively complement the gaming sector, with amenities such as restaurants, hotels, and shopping facilities significantly boosting revenue from gaming activities such as slot machines and table games (Lucas & Brewer, 2001; Suh, 2011). Furthermore, in a competitive market, where Macau’s casinos vie with each other as well as gaming hubs across Asia, differentiation is a critical factor, and unique non-gaming attractions provide a competitive edge. For instance, Wynn Macau distinguishes itself with the Performance Lake—a choreographed fountain display—and the SkyCab aerial gondola ride. Similarly, The Venetian’s Grand Canal, The Parisian’s Eiffel Tower, and The Londoner’s Big Ben draw substantial tourist traffic to their shopping malls, restaurants, and showrooms, generating significant revenue for Sands China.
Macau’s gaming companies face a pressing need for sustainable development. Over-reliance on gaming has led to social challenges, and the economic fragility of Macau was further exposed by disruptions due to China’s anti-corruption campaign (Wan & Li, 2013; M. T. Liu et al., 2015; Chen, 2018). To address this issue, gaming firms should leverage Macau’s unique strengths to expand their non-gaming businesses. Macau boasts a rich array of non-gaming tourism assets, including its UNESCO World Heritage Site, the Historic Centre of Macau, and international celebrity events facilitated by its visa-free policy. Additionally, the rising trend of “special forces travel” among budget-conscious Chinese youth—characterized by fast-paced, cost-efficient trips—has heightened demand for non-gaming offerings in Macau (Yu & Shepherd, 2023).
The COVID-19 pandemic severely impacted Macau’s economy due to its heavy reliance on tourism and the gaming industry, which both collapsed amid travel restrictions. Gross gaming revenue dropped by over 90% in early 2020, leading to a sharp economic contraction (Zhou et al., 2022a). Unemployment rose, particularly among residents dependent on tourism-related sectors. The crisis exposed Macau’s economic vulnerability and intensified calls for diversification. In response, the government accelerated efforts to develop non-gaming sectors, including finance, healthcare, and cultural tourism.
This study contributes to the existing literature by examining a largely under-explored topic: the relationship between diversification and profitability in Macau’s gaming companies. Prior research in the context of Macau has been predominantly qualitative, with limited quantitative analyses, and has focused primarily on describing diversification policies, measures, and scales (Zeng, 2023; Zeng et al., 2021). The scarcity of granular data on Macau’s gaming industry has constrained quantitative studies, while the fact that English is not an official language in Macau further restricts the accessibility of data for international researchers. To address these gaps, this study compiles data from credible sources within Macau’s gaming sector, creating a relatively novel dataset. In doing so, it offers a fresh approach to the entrenched study of Macau’s gaming industry.
While much of the existing research has focused on the contribution of non-gaming amenities to total revenue, generally yielding unsurprising results (Suh, 2011; Min et al., 2019), the impact of these amenities on the overall performance of companies remains under-explored. Although some studies have identified a positive relationship between diversification and performance, their samples were drawn from the United States and relied on outdated data (Kang et al., 2011; Walker & Bryant, 2011). This research extends beyond revenue contributions to investigate the effects of diversification on firm profitability. Leveraging data from the world’s largest gambling market, our findings provide robust empirical evidence for the gaming industry. These results offer a compelling incentive for gaming companies to diversify their business models, promoting sustainable development not only for firms in Macau, but also globally.
The remainder of this paper is organized as follows. Section 2 presents a literature review focused on Macau’s gaming industry and diversification trends within the sector, with Section 2.3 providing a case study of The Venetian Macao and Section 2.4 outlining the three hypotheses of the study. Section 3 describes the data and methodology. Section 4 presents the empirical results. Finally, Section 5 concludes the study and discusses its implications for policy, corporate strategies, and future academic research.

2. Literature Review

2.1. Macau’s Gaming Industry

The roots of Macau’s gaming industry trace back to 1847, when gambling was legalized, establishing it as a pioneering location in Asia (Wang et al., 2017). However, significant scholarly attention began with the liberalization of the market in 2002, which ended the monopoly of the Sociedade de Turismo e Diversões de Macau (STDM). Siu and Eadington (2009) examined this pivotal shift, analyzing the entry of foreign operators such as Wynn Resorts, Las Vegas Sands, and Galaxy Casino. They highlighted the strategic decisions faced by these operators, particularly the dominance of table games over slot machines in Macau’s casinos. Unlike Western markets, table games generate a disproportionately high revenue share due to cultural preferences and higher profit margins per square foot, despite greater labor and space demands. This study set the stage for understanding Macau’s unique post-liberalization market dynamics.
Following this liberalization, the rapid expansion of the gaming industry brought both economic growth and social challenges. Fong et al. (2011) provided a welfare economics perspective, calculating the social cost of gambling in Macau before and after 2002. Using data from 2003 and 2007, they estimated a 163% increase in social costs—from USD 40 million to USD 106 million—attributed to increased gambling supply and the legacy of an under-developed monopoly system. The key costs include problem gambling, crime, and community disruption, although the authors noted that their estimates were conservative due to data limitations. This study underscores the trade-offs of rapid industry growth, a theme that recurs in later research.
The early 2010s saw further exploration of Macau’s gaming preferences and sustainability. Lam (2012) investigated the inclinations of Chinese gamblers, comparing slot machines and table games from a cultural perspective. His findings reinforced the observations of Siu and Eadington (2009), noting a strong preference for table games among Chinese players, driven by social interaction and perceived skill elements. Concurrently, Wan and Li (2013) assessed the sustainability of Macau’s tourism sector, including gaming, from 2002 to 2009. They identified positive economic impacts but also highlighted negative socio-cultural and environmental effects, such as rising crime and student dropout rates. The authors advocated for diversification beyond casinos and greater community involvement in planning, signaling early concerns about over-reliance on gaming.
The mid-2010s marked a turning point as China’s anti-corruption campaign, which has intensified since 2012, began impacting Macau’s VIP gaming segment. M. T. Liu et al. (2015) analyzed the industry’s success in the prior decade and its vulnerabilities in 2014, attributing the decline in revenue to macroeconomic and political factors in China. They suggested a shift toward mass-market gaming and non-gaming amenities, in order to mitigate the reliance on VIP business. VIP rooms also create cognitive distortion and pathological gambling problems for VIP hosts in Macau (Xu et al., 2023). J. M. Luo et al. (2016) shifted focus to corporate social responsibility (CSR), examining practices among Macau’s gambling operators in 2012. Their triangulation of document reviews, website content, and site visits revealed strengths in leadership and community activities but weaknesses in supply chain and stakeholder engagement, offering a nuanced view of the industry’s adaptation.
Wang et al. (2017) provided a historical overview, noting pressures from China’s 2015 casino controls and competition from neighboring Asian markets. They proposed internal diversification and external regional strategies to counter these challenges. Chen (2018) quantified the anti-corruption campaign’s lagged negative impact on gaming revenue from 2010 to 2017, emphasizing its effect on per capita gaming expenditure rather than visitor numbers. This externality analysis highlighted the campaign’s role in reshaping Macau’s market structure.
Recent studies have reflected a maturing industry adapting to regulatory and global pressures. Zhou et al. (2022b) performed an ARIMA time-series analysis to assess the impacts of the anti-corruption campaign, finding minimal disruption to non-VIP gaming revenue. They argued that the campaign spurred a healthier, diversified development model, aligning with Macau’s 2021 gaming law revisions. C. Liu and Lin (2024) evaluated sustainability in the post-COVID-19 period, noting high economic volatility and unemployment but improved environmental conditions. They advocated for industrial pluralism and regional cooperation, such as the Guangdong–Macau In-Depth Cooperation Zone, to enhance resilience.
Stevenson and Wang (2024), in a New York Times article, offered a contemporary snapshot; in particular, they observed that, 25 years after Macau’s return to China, its economic boundaries with the mainland are blurring. They suggested that Beijing seeks more than gaming dominance, pushing for broader economic integration—a sentiment echoed in academic calls for diversification.
As the most densely populated city in the world, Macau undergoes a significant number of demolitions as part of its ongoing urban renewal efforts. Q. Luo (2025) explores how different types of housing demolition compensation affect entrepreneurship in China, finding that cash compensation significantly boosts entrepreneurial activity by relieving liquidity constraints. In the context of Macau’s gambling-driven economy, the findings suggest that monetary compensation policies could similarly support entrepreneurial diversification, helping to reduce over-reliance on the casino sector.
Oxford Analytica (2025) observes that Macau, more than Hong Kong, exemplifies China’s “one country, two systems” model by combining economic freedom with political loyalty to Beijing. Despite efforts, economic diversification away from gambling has seen little success. Macau is becoming more integrated with mainland China through joint development projects and increased policy influence from Beijing, with rising Chinese tourism helping to sustain the local economy.

2.2. Diversification and the Gaming Industry

The exploration of diversification in the gaming industry began with Roehl (1996), who investigated the role of casino amenities in driving gambling expenditure. Analyzing data from an unspecified market, Roehl found that users of amenities such as gourmet restaurants and shows spend significantly more on gambling than non-users. This early study highlighted the potential of non-gaming offerings to enhance gaming revenue, framing diversification as a competitive tool in an increasingly crowded market.
Building on this, Lucas and Brewer (2001) examined slot operations in a Las Vegas locals’ market casino, using regression analysis to assess factors influencing daily slot volume. Their findings revealed that temporal variables (e.g., day of the week) strongly predict slot volume, while operational variables such as food covers show no significant effect. However, marketing efforts such as buy-in incentives and bingo headcounts were found to positively influence slot play, suggesting that diversification into complementary activities can indirectly boost gaming, albeit with limited economic significance.
Lucas and Santos (2003) revisited the restaurant–gaming relationship, contradicting their earlier findings. Analyzing 200 days of data from three North American casinos, they identified a significant positive effect of restaurant volume (covers) on slot machine coin-in. This shift underscores the evolving understanding of non-gaming amenities as revenue drivers, adding empirical weight to the sparse literature and highlighting strategic implications for casino management.
Li and Greenwood (2004) provided a theoretical lens on intra-industry diversification, studying the Canadian insurance sector but offering insights applicable to the gaming sector. They proposed three benefits: synergies from economies of scope, mutual forbearance via multi-market competition, and market structuration efficiencies. Their findings suggest that diversification itself does not guarantee performance gains unless paired with specific conditions (e.g., competitive familiarity), laying a conceptual foundation for later gaming-specific studies.
The early 2010s marked a shift toward examining the direct impacts of product diversification on casino performance. Kang et al. (2011) studied U.S. casinos, finding an inverse U-shaped relationship between the degree of diversification and firm performance. Using financial and accounting metrics, they showed that moderate diversification—particularly integrating food and beverage (F&B) services with gaming—enhances performance through complementary effects; however, excessive diversification incurs costs that outweigh the benefits. This suggests a balanced approach to diversification is necessary.
Suh (2011) narrowed the focus to the indirect impact of showroom entertainment on slot gaming in a Las Vegas Strip hotel–casino. Analyzing hourly slot volume data, Suh found a positive effect of showroom headcounts on slot play at specific times (6 p.m., 9 p.m., 10 p.m.), although the incremental revenue per attendee was modest. This study refines the granularity of diversification research, emphasizing temporal dynamics and return-on-investment considerations. Shampaner-Ghiassi (2012) broadened the scope, evaluating the contributions of non-gaming amenities at a casino–resort with a focus on quantifying how amenities such as hotels and retail complement gaming revenue, reinforcing the trend toward integrated resort models.
Min et al. (2019) deepened the analysis of non-gaming spillovers, examining a year of casino performance data. They found that restaurant and showroom amenities significantly boost the volume of slot gaming, although table games showed little effect in this context. This distinction highlights the varying impacts of diversification across gaming types, offering practical insights for optimizing amenity investments in competitive markets.
Wong and Lai (2021) explored memorable tourism experiences (MTEs) at gaming destinations, distinguishing between gaming and non-gaming MTEs. Their model links these experiences to destination image, satisfaction, and behavioral intentions, finding that non-gaming MTEs more strongly influence image and word of mouth, while gaming MTEs drive revisit intentions. Multi-group analysis revealed age-based differences, with younger tourists being less swayed by gaming MTEs, suggesting diversification into non-gaming offerings as a strategy to broaden market appeal.
Zeng et al. (2021) investigated diversification in Macau’s gaming industry through a comparative analysis of companies. They examined how firms diversify beyond gaming, aligning with Macau’s push toward integrated resorts and providing a context-specific perspective. Sou and Siu (2023) linked diversification to tourism demand in Macau, using sectoral data (capital formation, employment, value-added) as diversification measures. They observed a positive relationship with visitor numbers, particularly from less saturated, distant markets, suggesting that structural diversification enhances resilience to external shocks. This study advocated for market-driven diversification policies, extending the discussion to macroeconomic impacts. Zeng (2023) further explored non-gaming diversification strategies in Macau’s gaming companies. Their focus on non-gaming aligns with broader trends of reducing reliance on gambling revenue, offering a contemporary view of firm-level adaptation.
Iskenderoglu (2025) highlights how entrepreneurial heterogeneity influences firms’ strategic decisions, especially when entering controversial industries like gambling. Such investments can lead to reputational risks and declining ESG scores, affecting firm valuation. This paper builds on that insight by showing that ESG disclosure can help mitigate the negative impact of controversial investments on the value of diversification.

2.3. Case Study: Venetian Macao

The Venetian Macao has systematically developed a four-pillar non-gaming ecosystem comprising luxury hospitality, retail, MICE (meetings, incentives, conferences, and exhibitions) facilities, and entertainment spectacles. This diversification aligns with Macau’s government-mandated economic shift away from dependence on gaming, while capitalizing on the property’s scale as Asia’s largest integrated resort. The 3000+ suite hotel portfolio commands premium rates through differentiated offerings such as butler services and themed accommodations, achieving 90%+ occupancy rates that outperform market averages (Sands China Ltd., 2025). This hospitality foundation creates a captive audience for cross-amenity spending, demonstrating the integrated resort model’s core value proposition of revenue synergies.
Financial data reveal the tangible impacts of this strategy. Non-gaming contributions grew from 20% to 38% of total revenue between 2019 and 2023, with particularly strong performance in high-margin segments. Retail operations generated 18% of property revenue through innovative leasing models combining base rents with percentage fees, while F&B (food and beverage) outlets achieved 35% profit margins through premium positioning. The 1.2 million sq. ft. convention center drives corporate demand during traditional midweek lulls, with MICE delegates demonstrating 2.5× higher ancillary spending when compared to leisure visitors. These diversified streams provide stability against the volatility of gaming revenue, with non-gaming before-tax margins (32%) consistently outperforming gaming operations (25%) (Sands China Ltd., 2025).
The property’s design fosters natural cross-consumption patterns. Themed retail environments such as the Grand Canal Shoppes—featuring authentic gondola rides—transform shopping into experiential entertainment, increasing the average dwell time to 2.1 nights for non-gaming-focused guests. Data shows these visitors spend MOP 298 daily versus MOP 93 for casino-only patrons, validating the “captive audience” economic model. Entertainment offerings—particularly the 15,000-seat Cotai Arena’s concert series—create powerful demand drivers, with major events generating USD 8–12 million in ancillary revenue through hotel stays, dining, and retail (Sands China Ltd., 2025). This synergistic approach maximizes per-visitor yield while reducing customer acquisition costs.
Facing rising labor costs and competitive pressures, The Venetian has implemented technological and operational innovations. AI-driven dynamic pricing optimizes revenue across hotel rooms and convention spaces, while hybrid MICE solutions combine physical and virtual attendance to expand market reach. Strategic partnerships with tech firms such as Tencent enhance customer relationship management practices through integrated digital loyalty programs that track cross-property spending patterns. These adaptations address key challenges in the industry, particularly the need for labor efficiency in Macau’s tight job market, and the imperative to capture post-pandemic shifts in business tourism preferences toward blended event formats.

2.4. Hypotheses

In Section 2.1, studies on the history and challenges of Macau’s gaming industry were reviewed. These studies highlight growing concerns regarding the economy’s over-reliance on the gaming sector. Additionally, the industry contributes to social issues, including gambling addiction, and has faced turbulence due to anti-corruption crackdowns (Chen, 2018; Zhou et al., 2022b). Therefore, several analyses have advocated for greater diversification and sustainability, offering valuable qualitative insights. As such, Section 2.2 examined studies focused on the role of amenity sectors and their potential benefits to casinos.
A key limitation in existing research on Macau’s casino industry is its heavy reliance on qualitative methods, with little quantitative evidence to support these findings. The few quantitative studies available (see, e.g., C. Liu & Lin, 2024; Zeng, 2023) neither utilize panel data nor establish causal inference. While this methodological approach has become the norm in Macau-related studies, there remains significant room for improvement. Compared to data from the U.S., Macau’s datasets are not only harder to access but are also far less granular. Despite these challenges, we exhaustively compiled the available public data to produce a robust quantitative empirical analysis.
Existing research on casino diversification suffers from significant gaps. Most studies have merely documented or measured basic metrics, such as amenity revenue or its contribution to overall earnings—findings that are intuitive but unsurprising. Crucially, these analyses fail to connect diversification with deeper operational and financial outcomes, such as profitability, efficiency, or market value. Furthermore, the existing literature has predominantly focused on the U.S. gambling market, which now lags behind Macau in terms of both scale and profitability. While a handful of studies (e.g., Kang et al., 2011; Walker & Bryant, 2011) have examined how amenities influence firm performance in the U.S., their relevance is limited due to their early-2010s context. Recent work by Zeng (2023) and Zeng et al. (2021) has addressed diversification in Macau’s gaming companies but remains incomplete, offering only partial measurements of diversification ratios without linking them to tangible corporate benefits.
This study addresses a critical gap in the literature by examining how diversification impacts the profitability of Macau’s gaming companies. Casino operators can enhance their profitability through diversification in several ways; for instance, non-gaming amenities—such as luxury retail, entertainment, and dining—often achieve higher profit margins than gaming operations. These segments attract a broader customer base and generate substantial revenue relative to operating costs, as demonstrated by integrated resorts such as The Venetian Macao. Through empirical analysis of these dynamics, our research provides new insights into the financial benefits of diversification in the world’s largest gaming market.
Another key mechanism through which diversification enhances profitability is by increasing total tourist visitation to both gaming and non-gaming facilities. The presence of high-quality amenities creates a synergistic effect, drawing more visitors to the location overall. This expanded customer base allows casinos to optimize their gaming operations in three ways: (1) achieving higher hold percentages on slot machines and table games, (2) commanding premium pricing in VIP rooms, and (3) increasing overall customer retention. These factors collectively contribute to improved profit margins, enhanced return on investment, and potential market share gains in Macau’s competitive gaming landscape (see Figure 2).
Based on the identified gaps in the literature and our theoretical framework, we propose the following hypotheses:
  • H1: A higher share of non-gaming amenities is positively associated with increased net profit margin (NPM).
  • H2: Greater diversification into non-gaming amenities leads to improved return on assets (ROA).
  • H3: Companies with larger non-gaming revenue shares will capture a greater market share in Macau’s gambling industry.

3. Data and Methods

3.1. Data Sources

This study utilizes manually collected data from two primary sources: (1) official disclosures from Macau’s Gaming Inspection and Coordination Bureau (DICJ, 2025), and (2) corporate annual reports obtained from company websites. As mandated by Macau’s regulatory framework, all six licensed gaming operators submit comprehensive annual reports to the DICJ. Where gaps exist in the DICJ records, we supplemented the dataset with information extracted directly from company filings (e.g., Sands China Ltd., 2025).
The analysis was focused on the period from 2010 to 2019 for several methodological reasons. First, this timeframe represents the first complete decade following the liberalization of Macau’s gaming market in 2002. Second, with the exception of SJM Holdings (established in 1962), all current operators commenced operations between 2000 and 2009 (MGM China in 2004, Galaxy Entertainment in 2002, etc.). Through beginning our sample in 2010, we obtained a balanced panel dataset that captures all six operators throughout the entire study period, while avoiding the initial volatility of their early operating years.
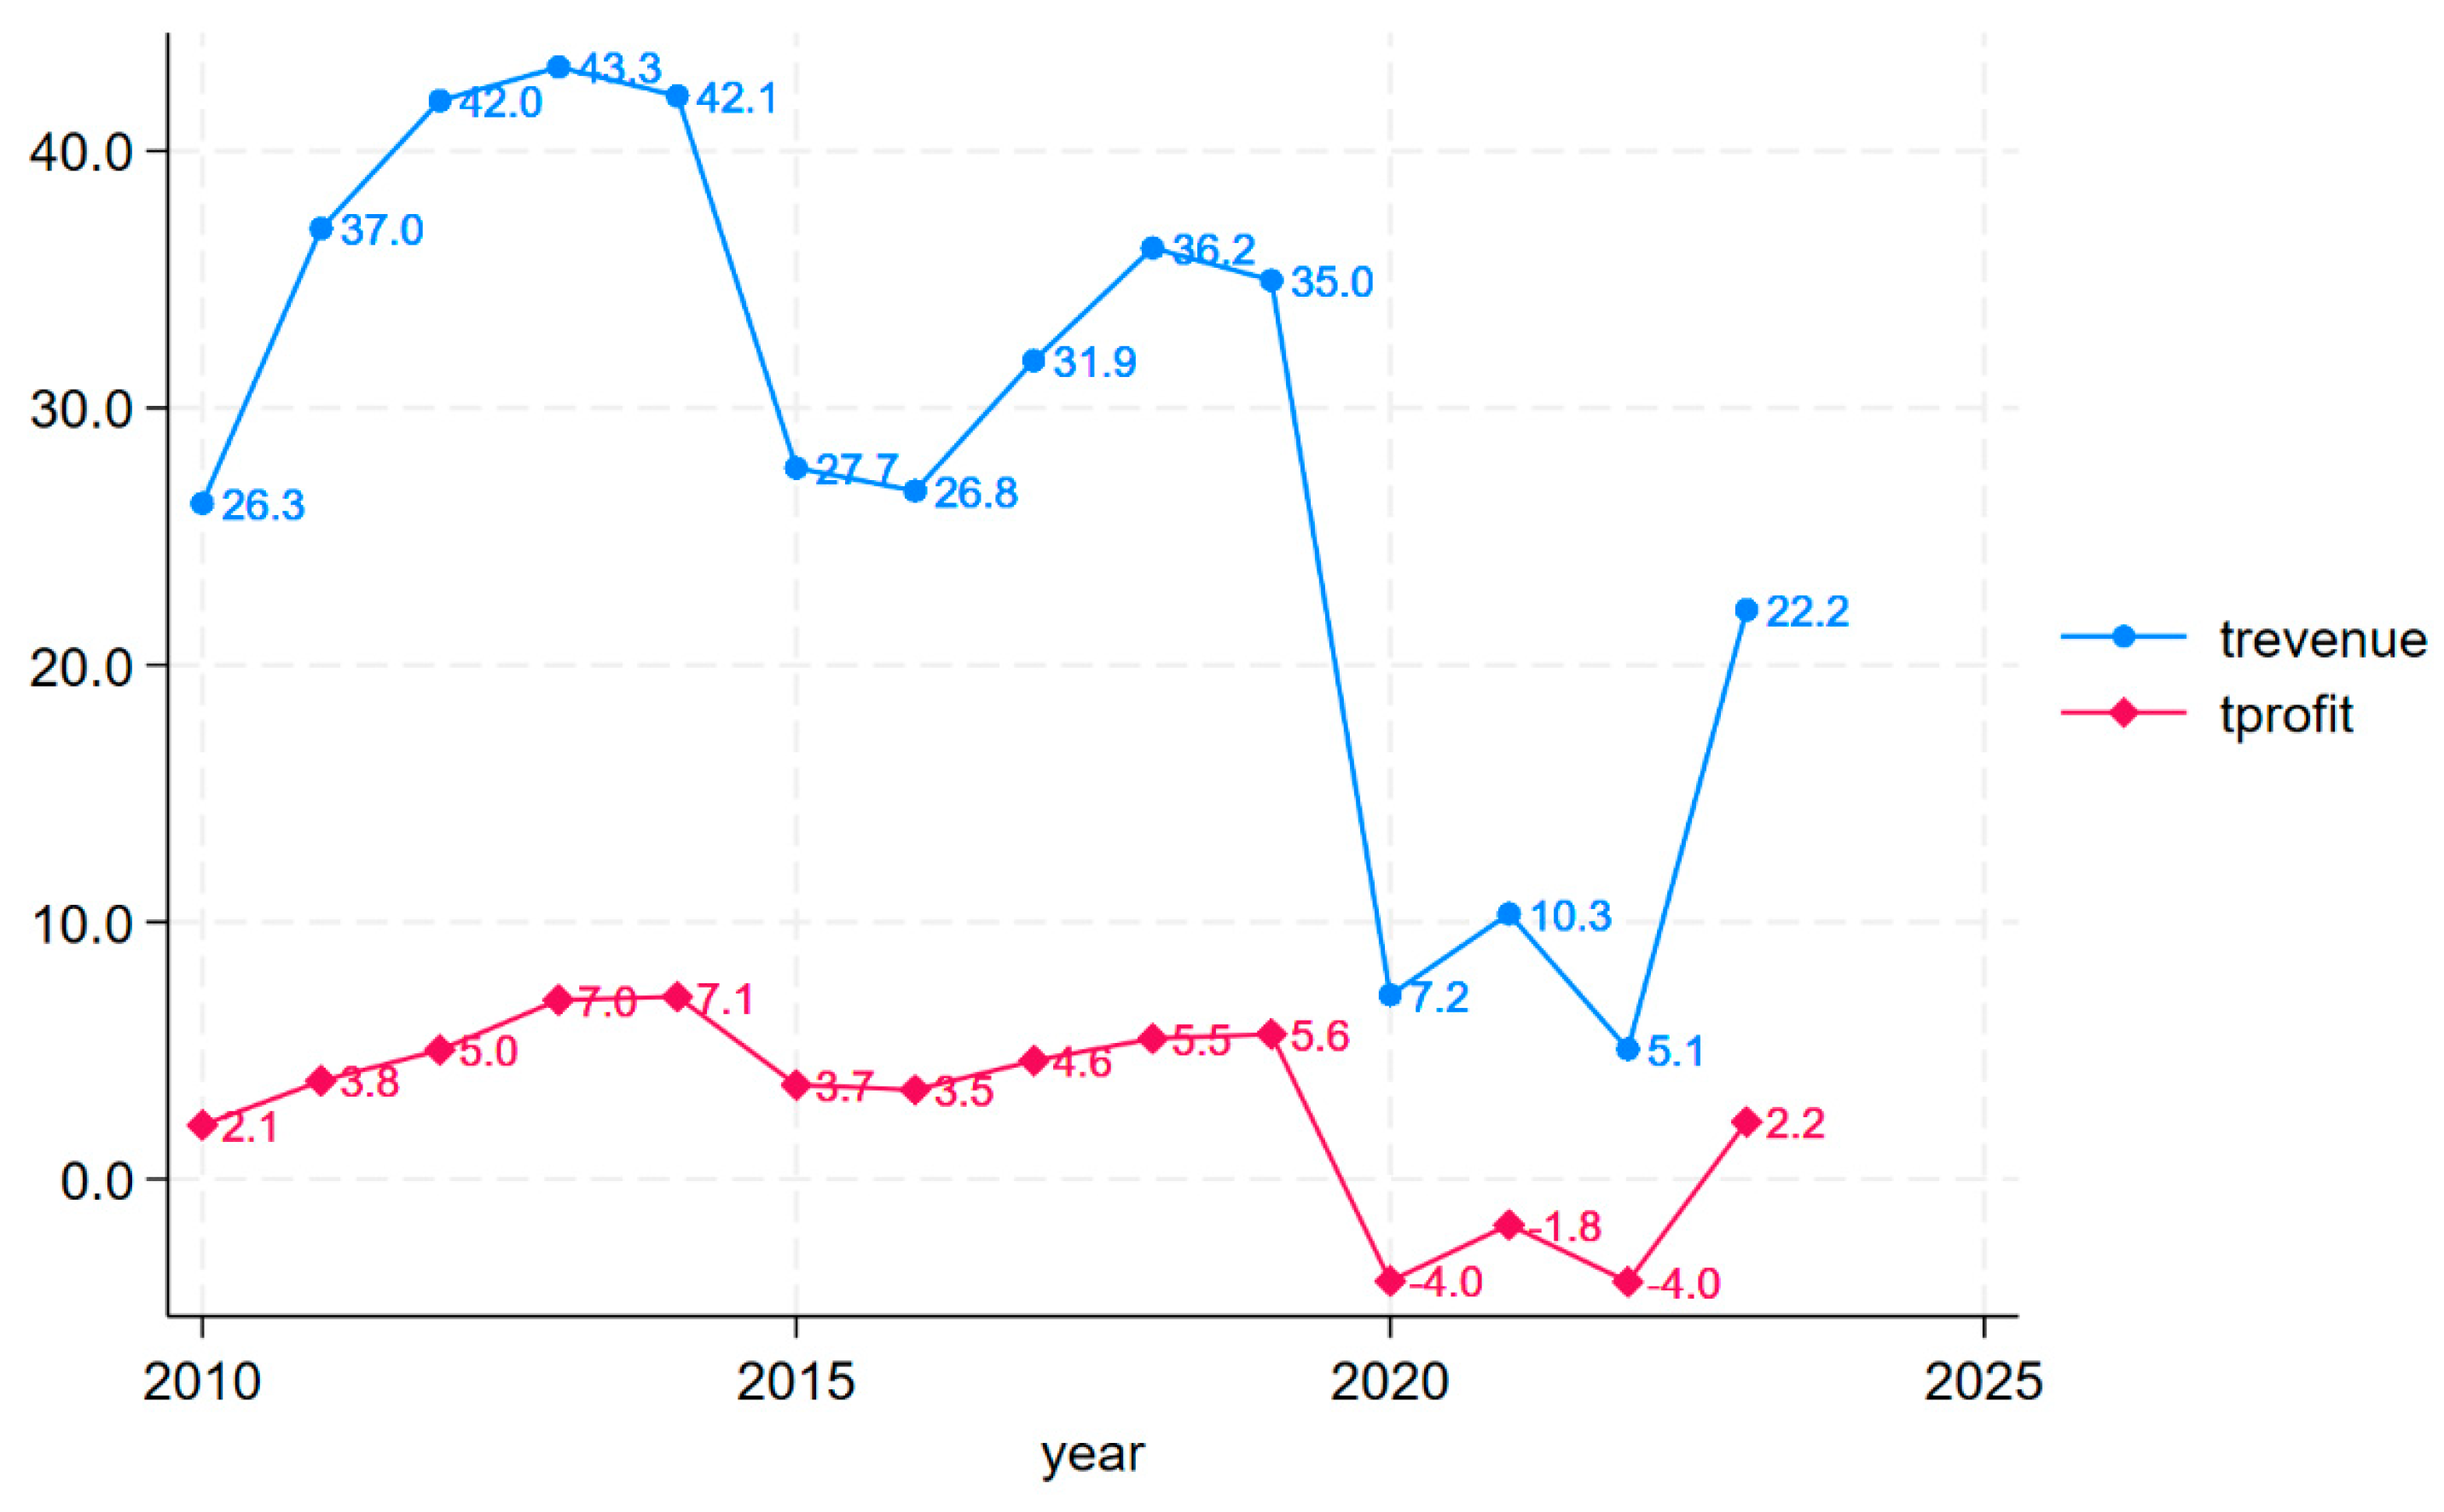
This study’s dataset covers 2010–2019 while excluding subsequent years due to the disruptive impacts of the COVID-19 pandemic on Macau’s gaming industry. This exclusion is justified by government-mandated casino closures (Liang, 2022) and mainland China’s prolonged travel restrictions, which fundamentally altered market conditions and customer flows during the period 2020–2022. Although operations normalized in 2023 and partial 2024 data are emerging, we maintained the pre-pandemic timeframe to ensure comparability across our balanced panel of six operators (established between 1962 and 2009). While excluded from formal analysis, Figure 3 illustrates post-2019 trends in key financial metrics (total revenue and total profit) to provide contextual continuity.
The analysis faced inherent data constraints due to Macau’s unique market structure. Unlike more transparent jurisdictions, Macau’s gaming operators (n = 6) are only required to disclose company-level financials rather than casino-specific performance metrics. This resulted in a limited sample size of 60 firm-year observations (2010–2019). However, three factors mitigate this limitation: (1) these operators collectively represent 100% of the legal market, ensuring complete population coverage; (2) small-sample analyses are well established in gaming research, with comparable studies employing similar observation counts (Kang et al., 2011); and (3) the dataset’s balanced panel structure (10 years × 6 firms) matches or exceeds the sample sizes used in peer-reviewed regional gaming studies (e.g., Phipps et al.’s (2020) Illinois economic impact analysis). While granular casino-level data would offer additional insights, the available firm-level metrics provide sufficient power to test our hypotheses regarding the effects of diversification.
To address the small sample size (N = 60), we employed bootstrapping techniques following Freedman’s (1981) foundational work. This resampling approach allowed for the generation of 300 synthetic datasets through random draws with replacement from our original observations, effectively creating an expanded sample that was five times larger than the original (n = 300). We implemented this technique exclusively in our robustness checks, in order to (1) verify the stability of our core findings while (2) deliberately constraining the expansion factor to prevent over-distortion of the underlying data structure. The 300-replication threshold balances computational efficiency with statistical reliability, as established in comparable econometric applications (see, e.g., Efron & Tibshirani, 1994).
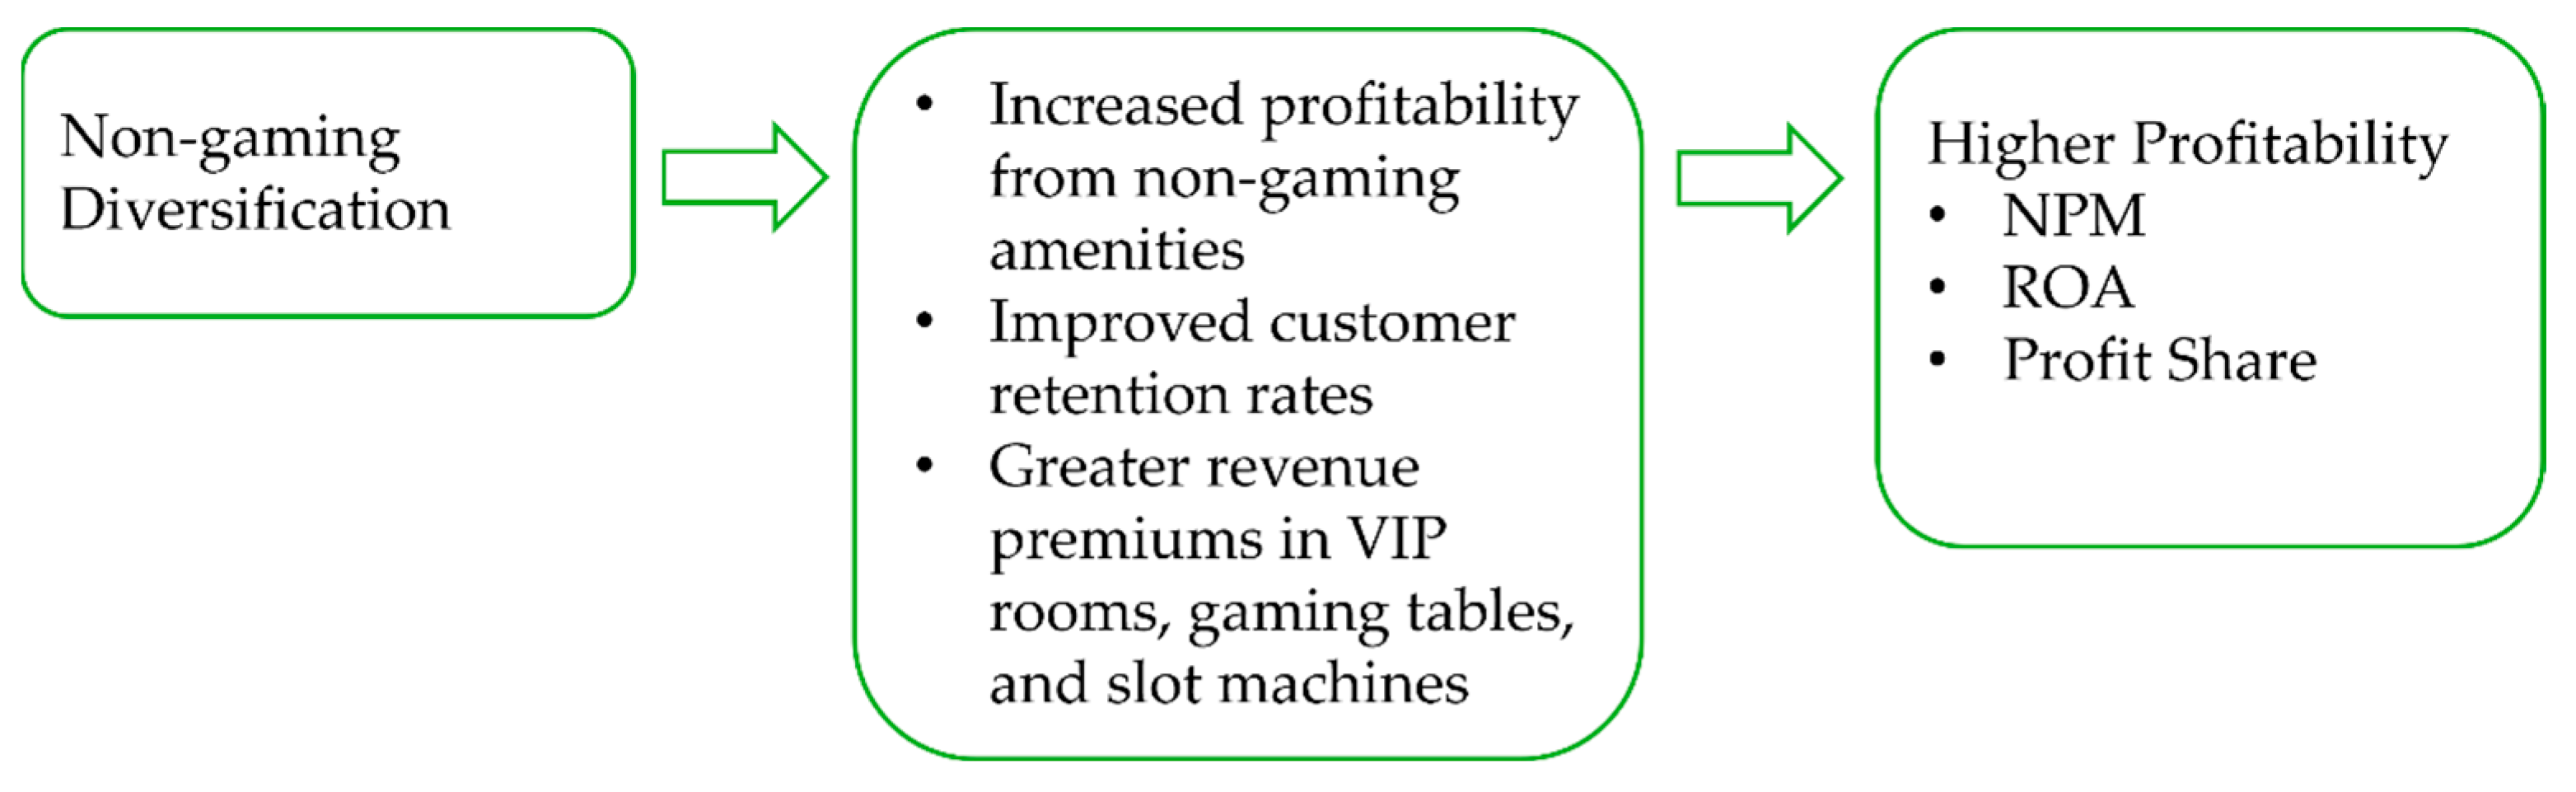
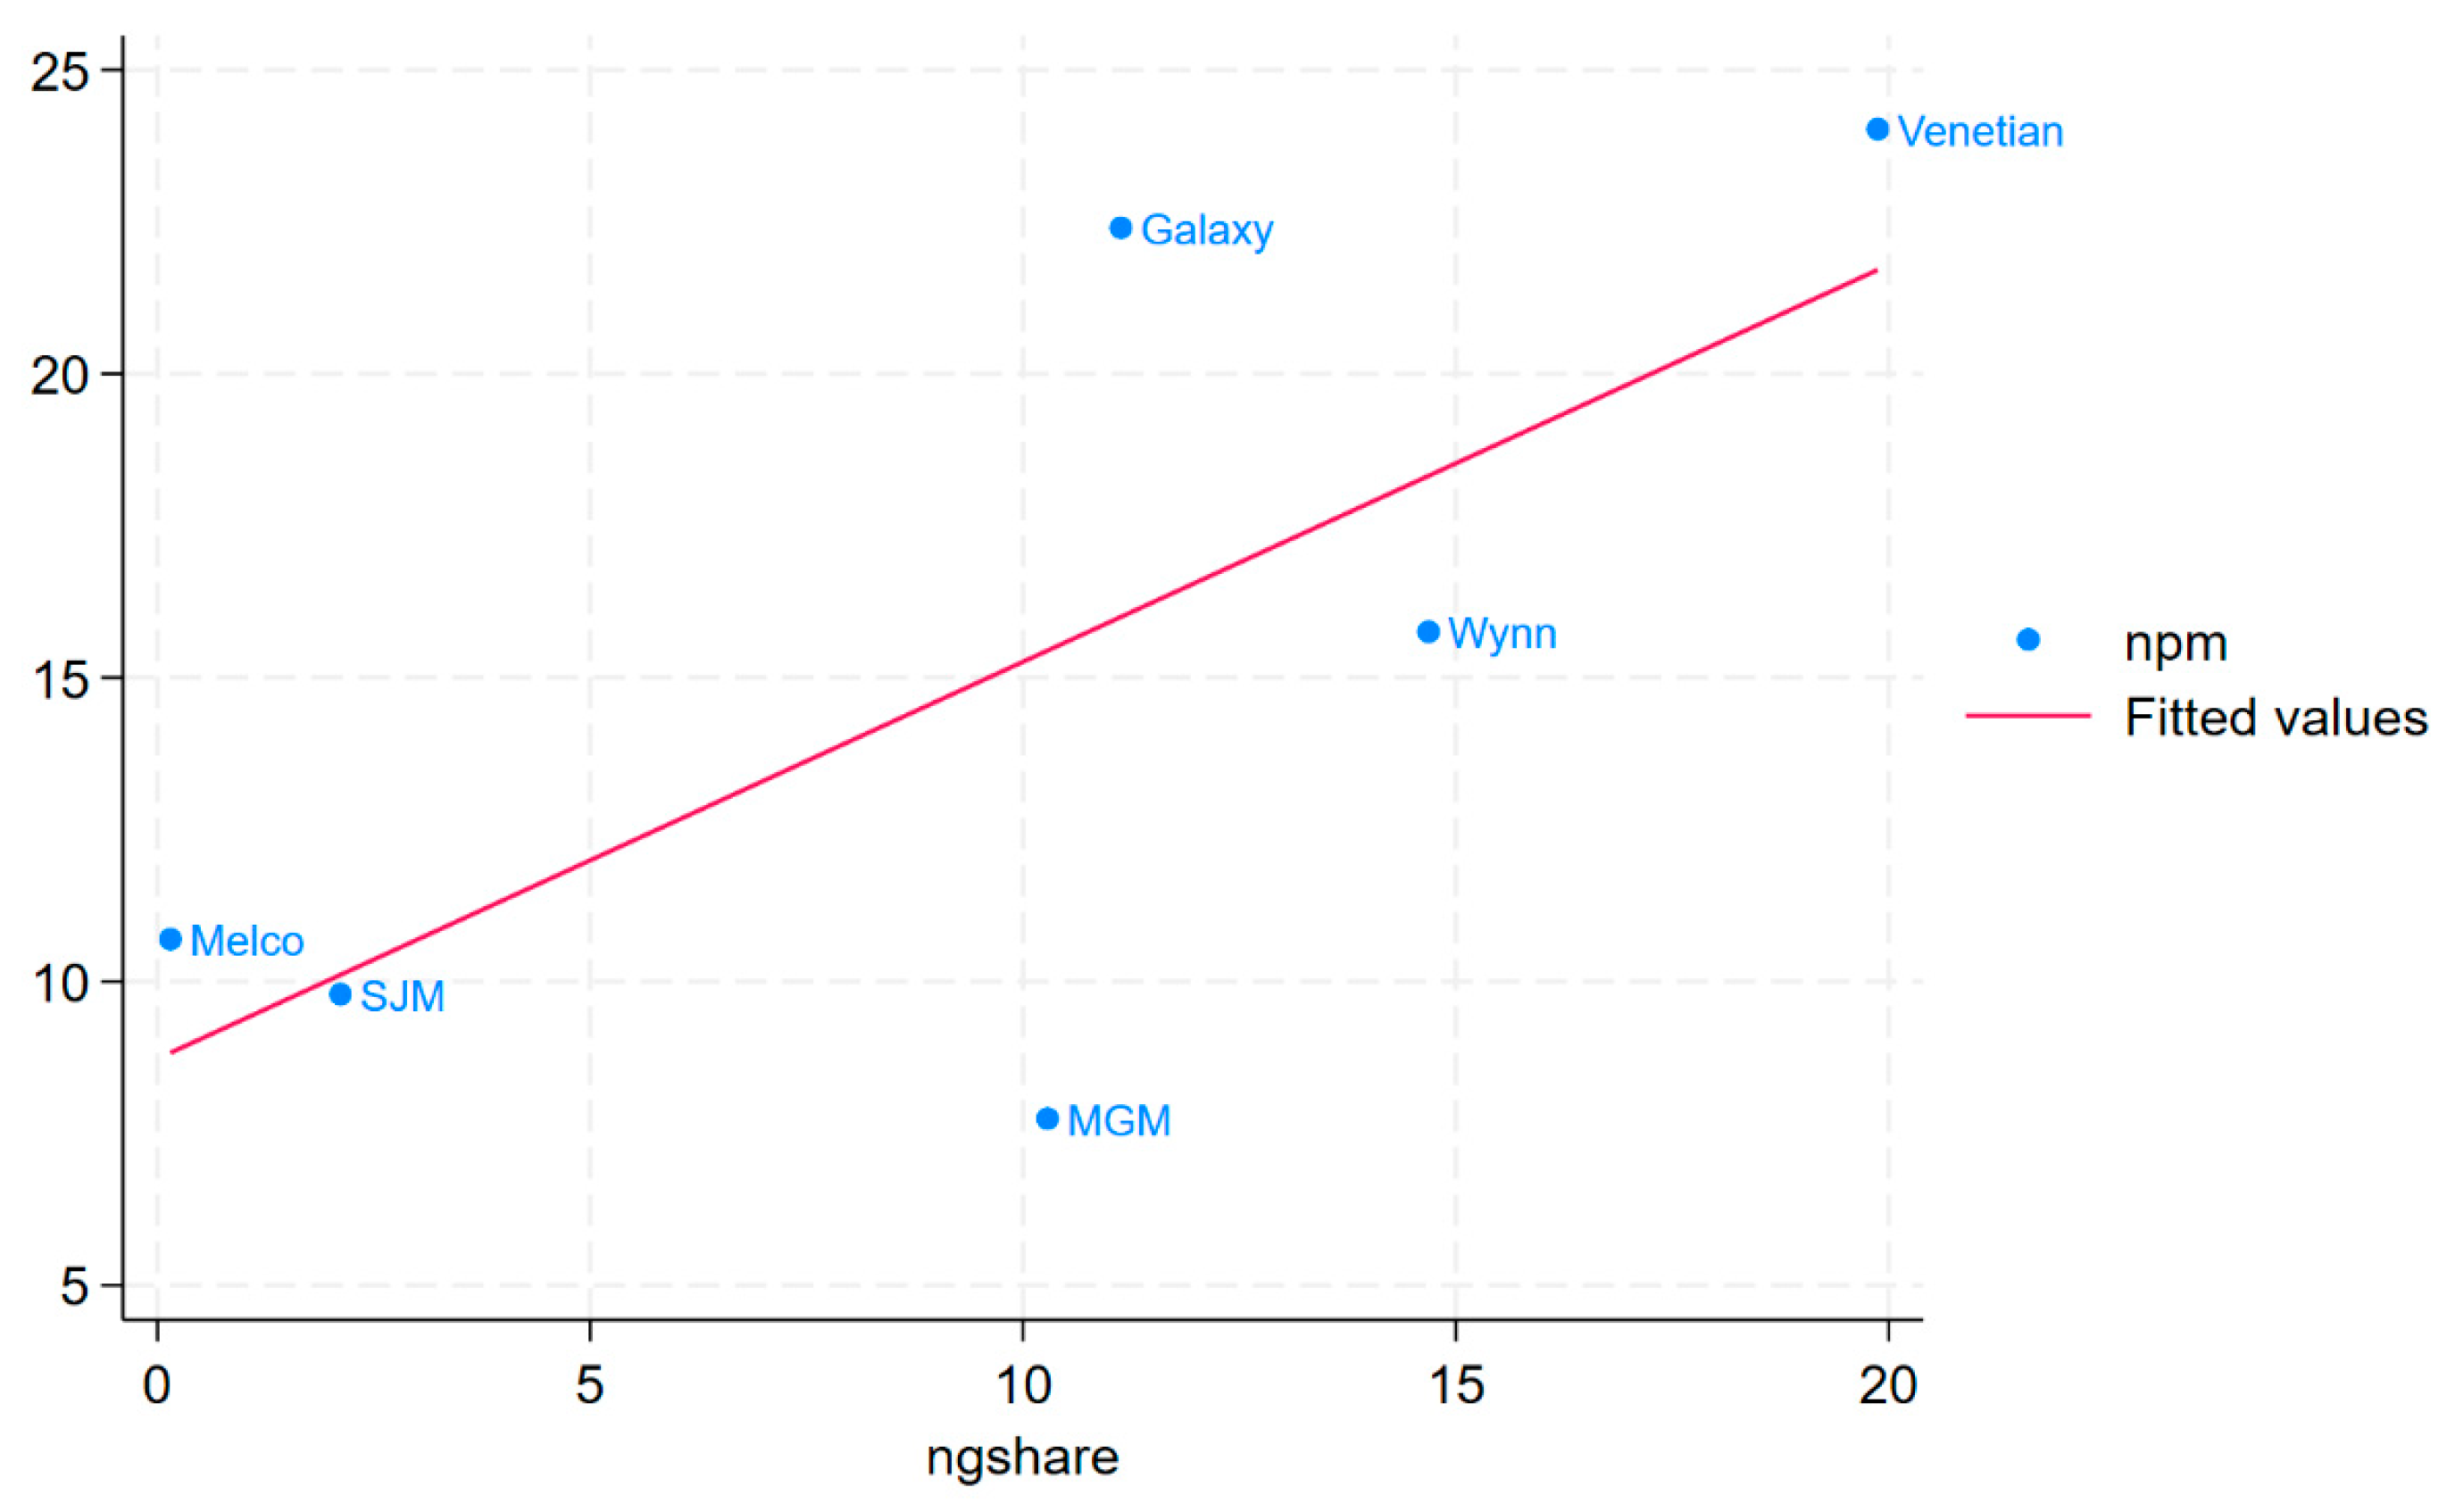
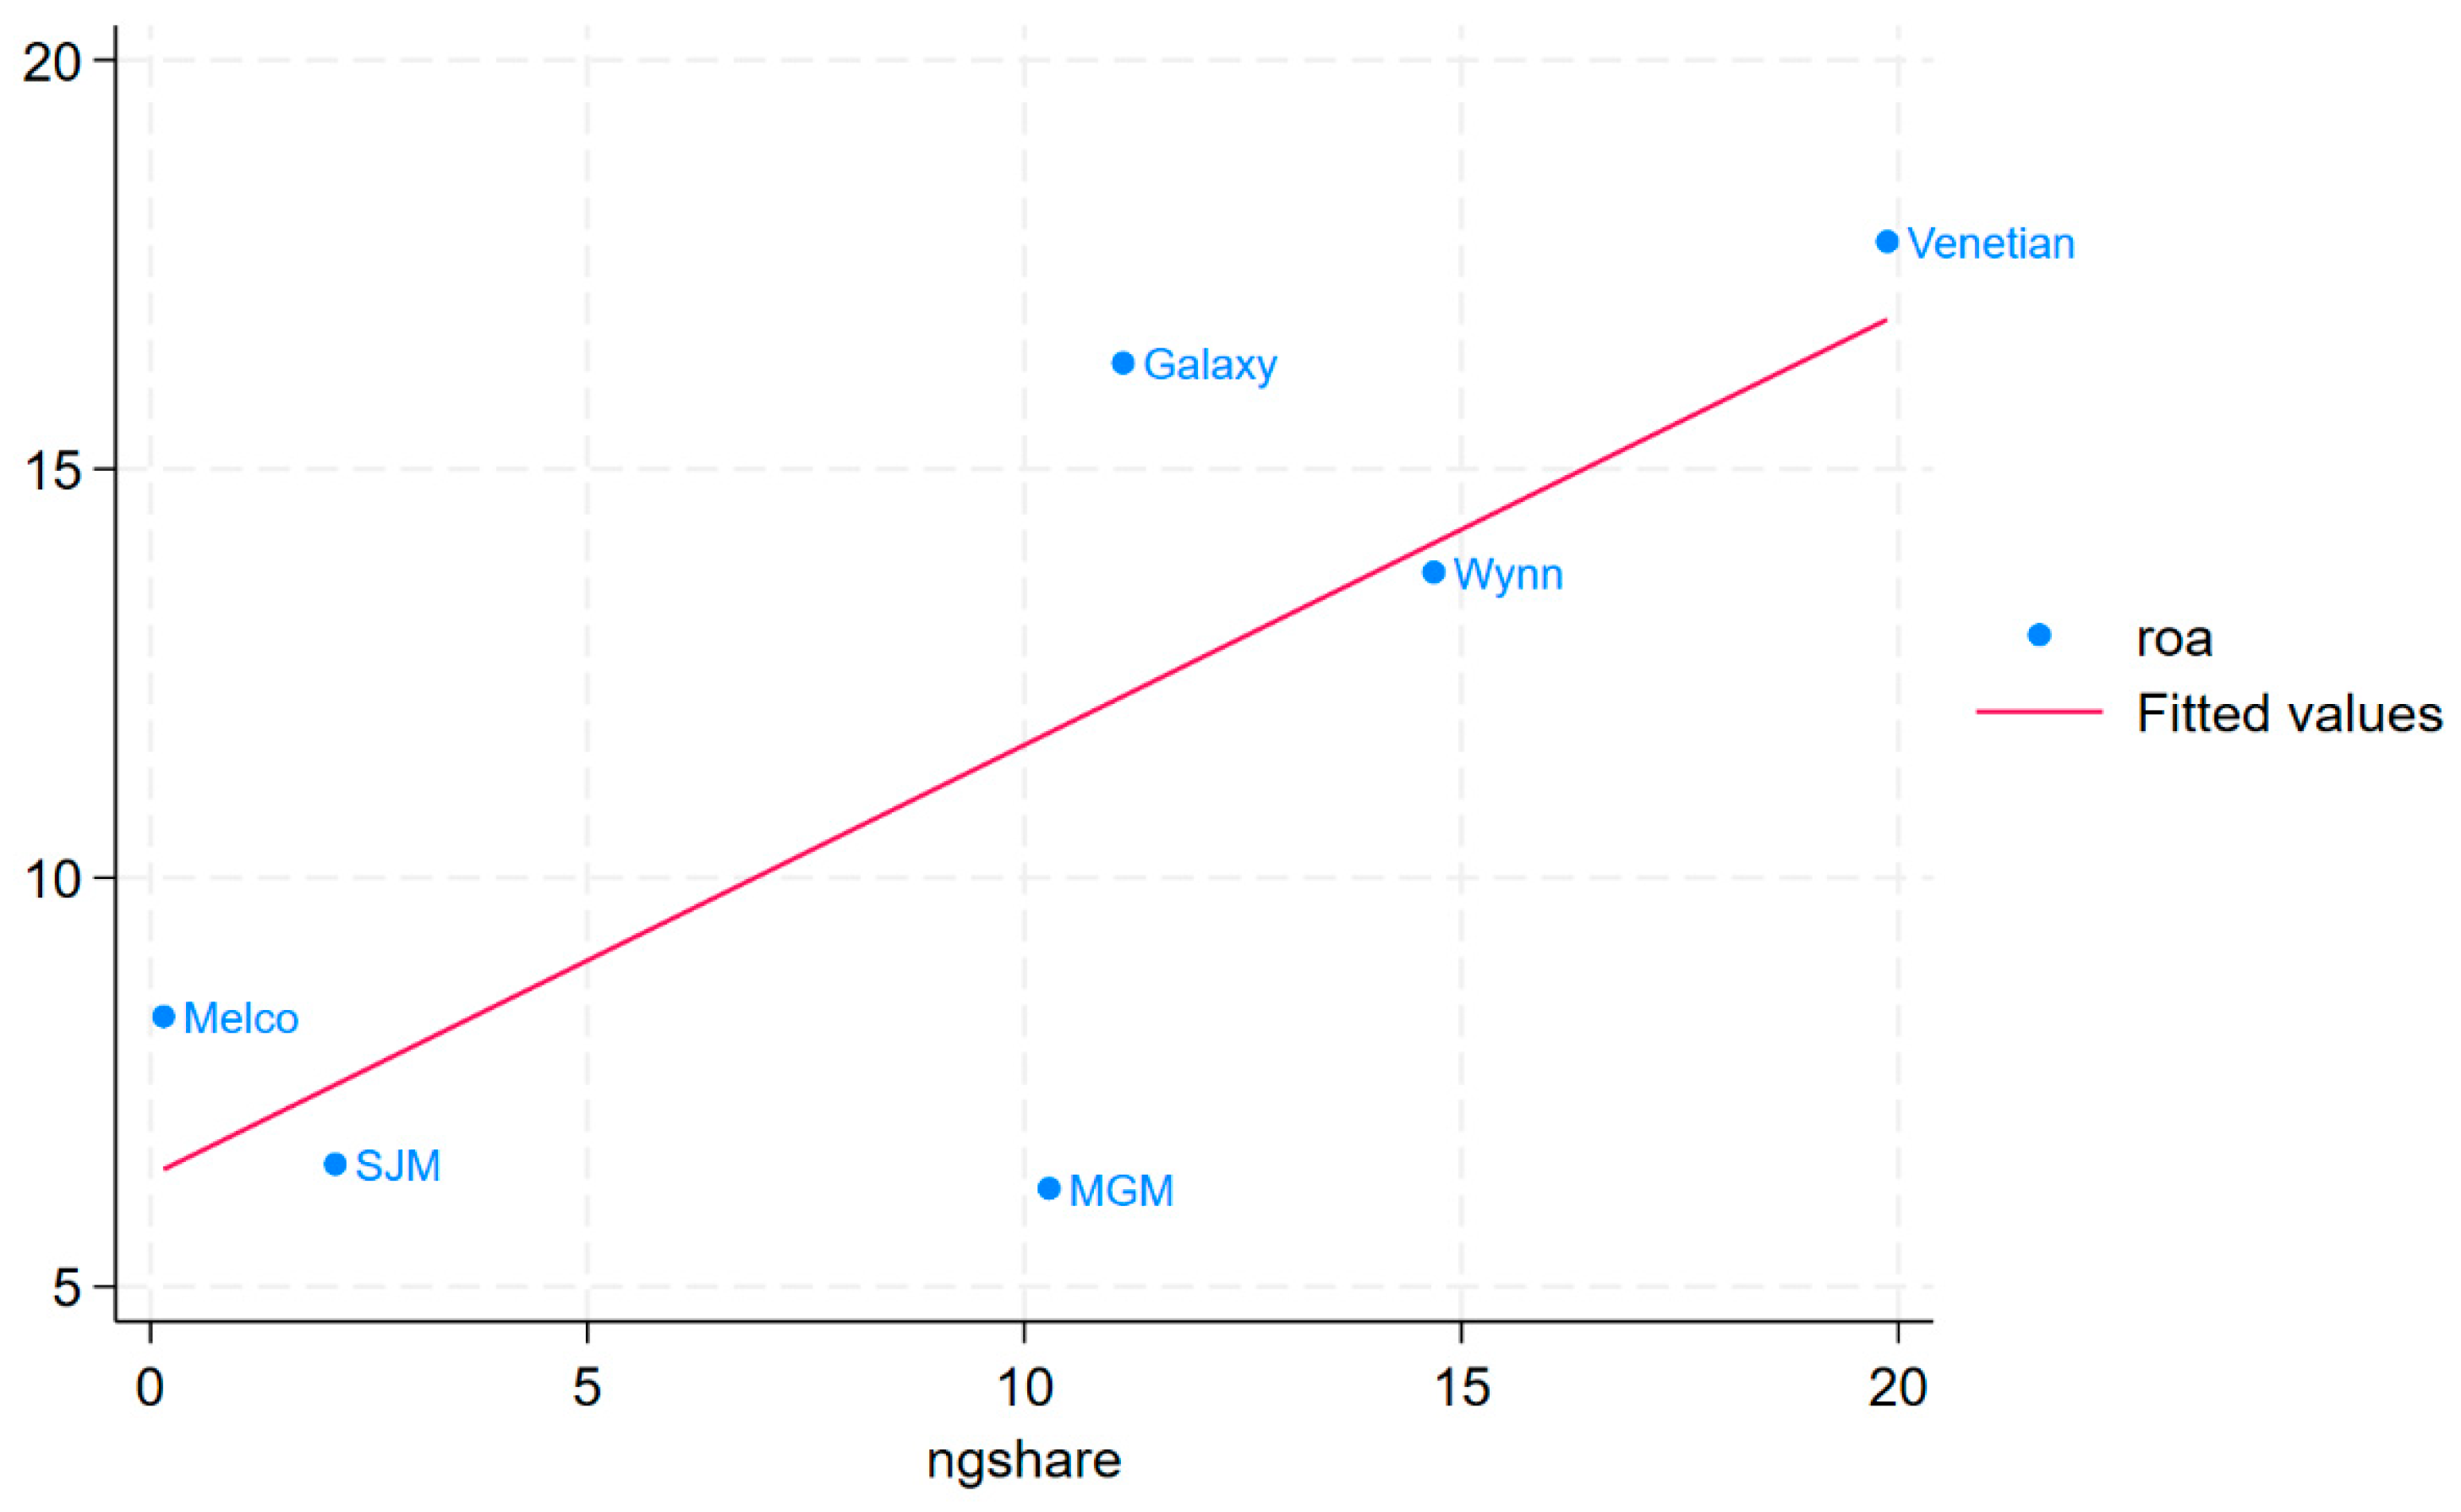
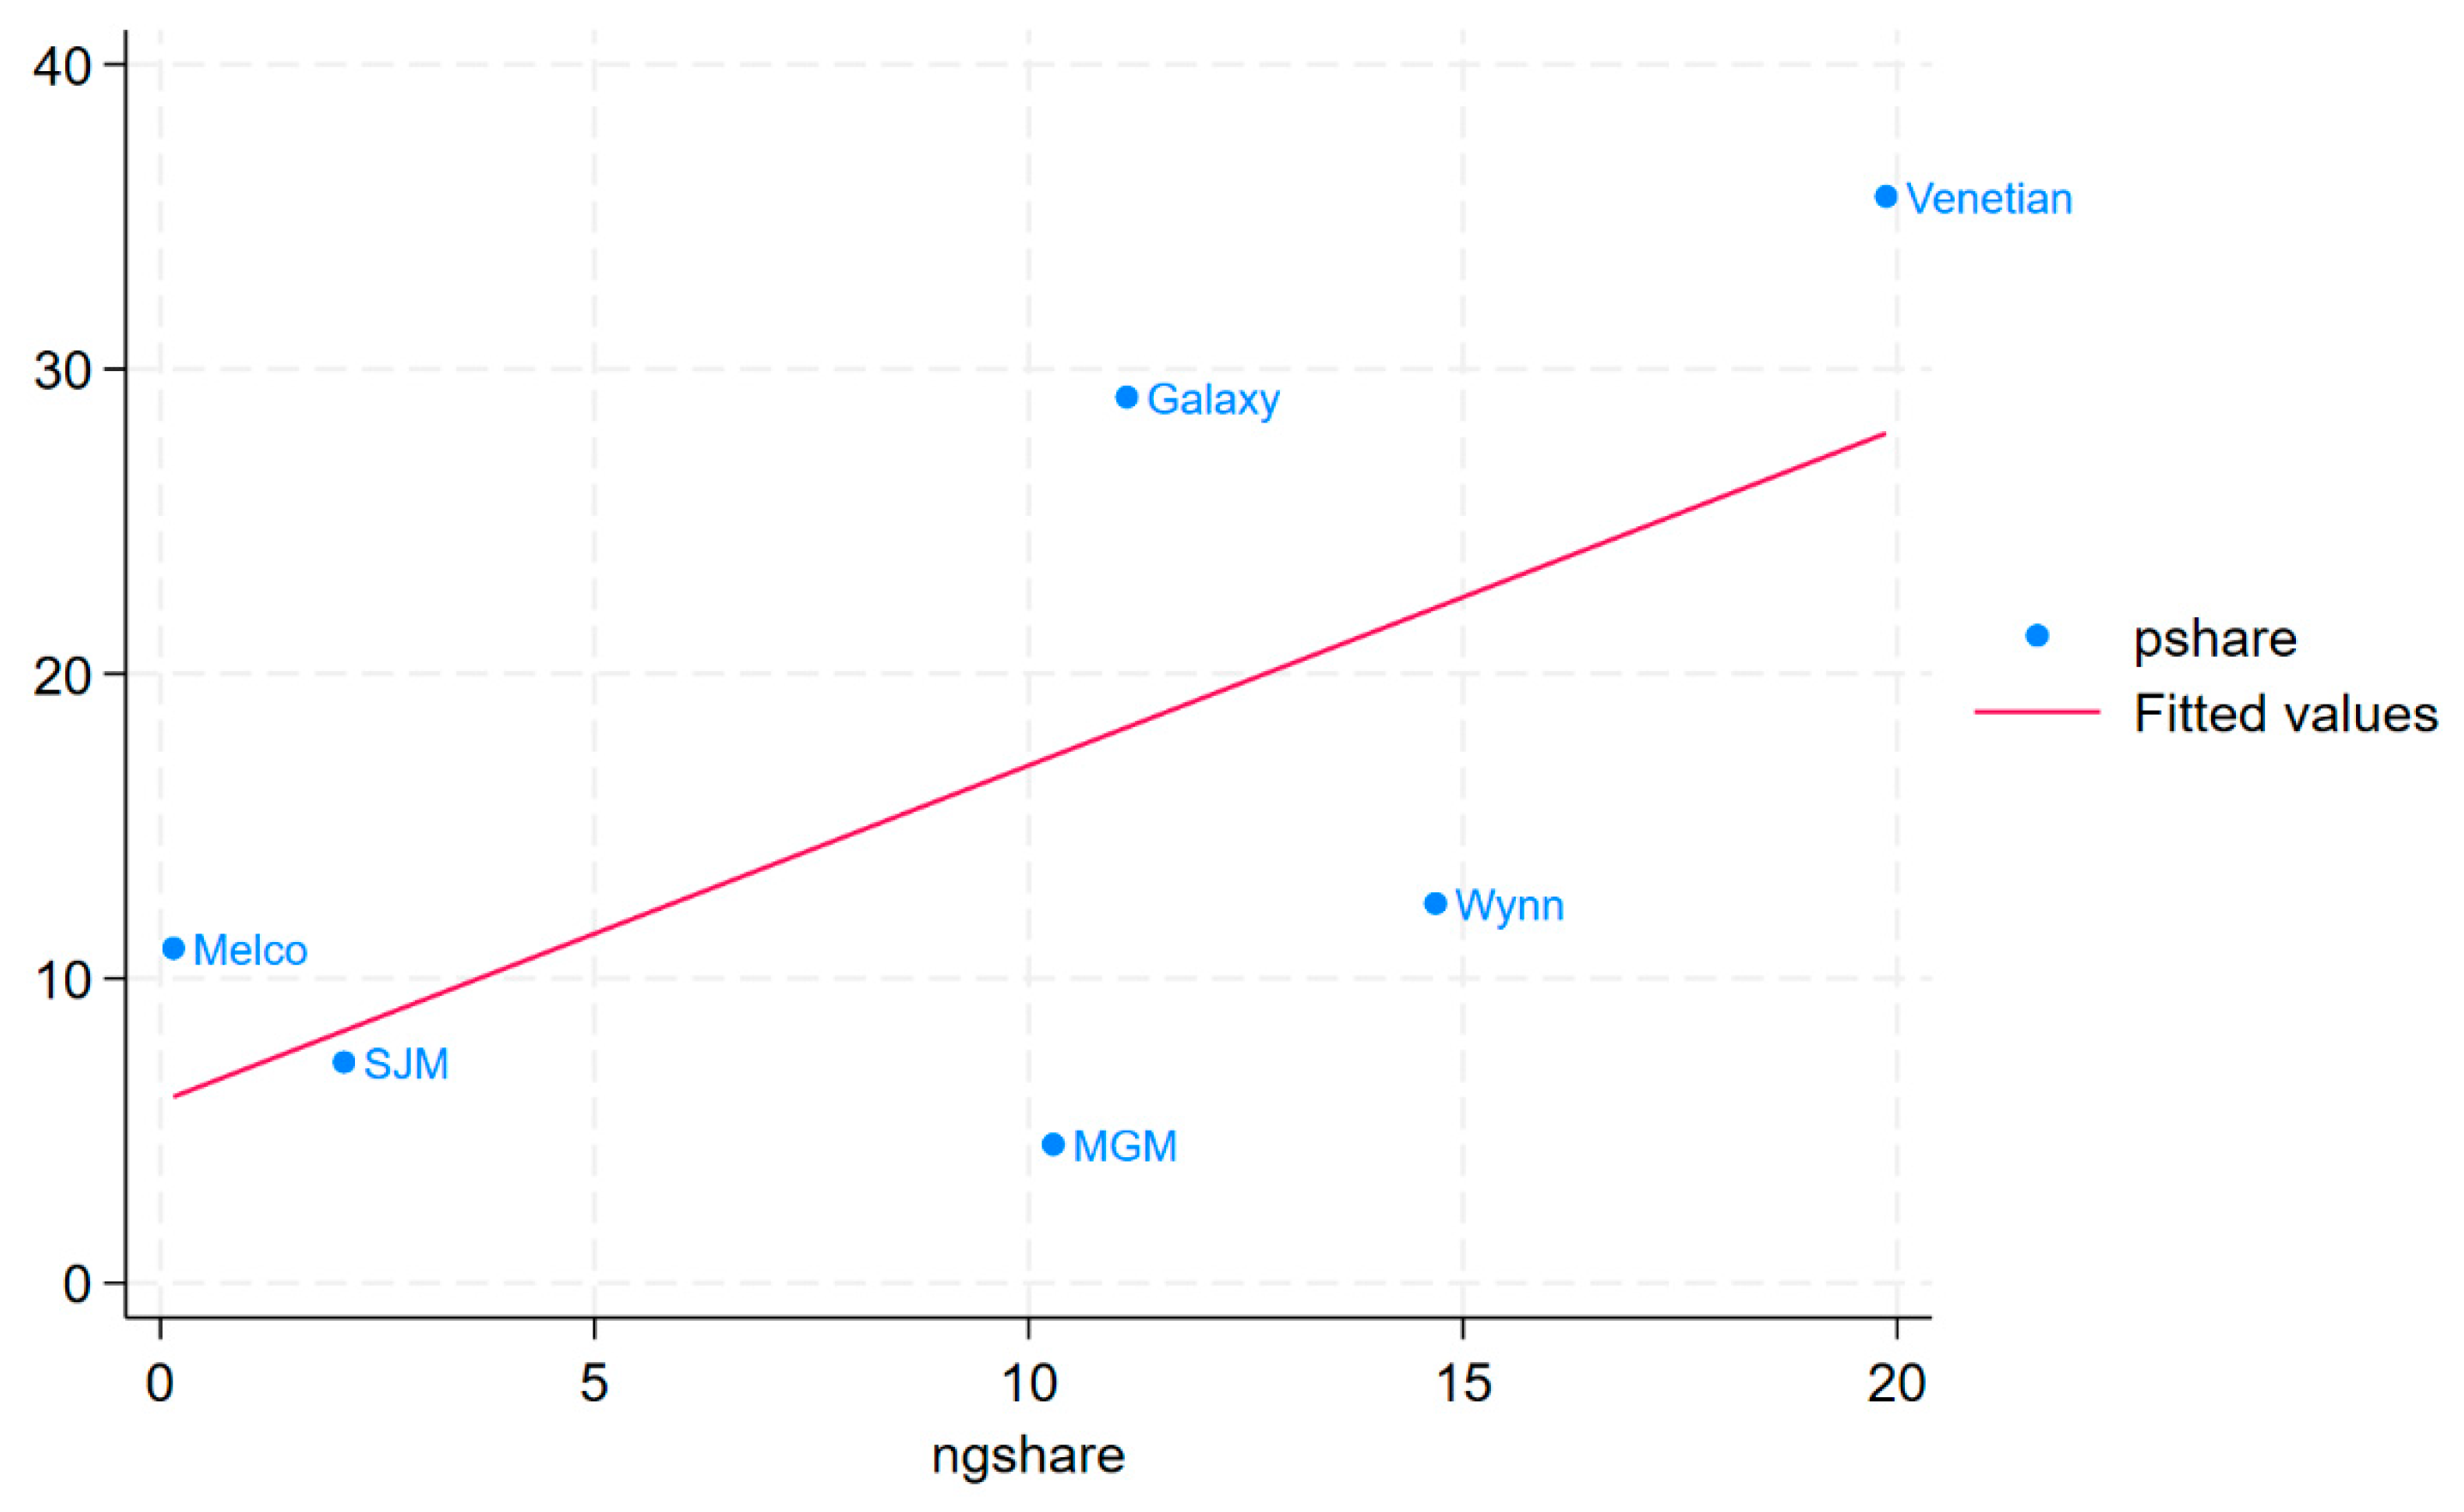
For the dependent variables, we used three profitability measures commonly applied in financial studies (Giroud et al., 2012): net profit margin (NPM), return on assets (ROA), and profit share. We selected all independent and dependent variables as ratios, in order to ensure comparability across companies of different sizes. As these metrics are not directly reported by companies, we calculated them using data from financial statements. NPM and ROA are particularly relevant for gaming companies, as these businesses are asset-intensive and require long cycles to recover the costs of building casinos. Unlike the other two metrics, profit share is not calculated from a single company’s data but, instead, measures a company’s profit as a percentage of the total profit in Macau’s gaming market, with the sum being equal to 100%.
The independent variable of interest is the non-gaming share, calculated as non-gaming revenue divided by the total revenue of the company. This metric encompasses various non-gaming income streams, including hotels, restaurants, shopping malls, conventions, and other revenues. While non-gaming revenue is available from the consolidated financial statements provided on the DICJ website, the specific components of non-gaming revenue are not separately disclosed.
Control variables were used to control for company-specific characteristics as well as temporal trends. The number of casinos refers to how many casinos each company operates, with most companies operating between 2 and 10 casinos. SJM was the company with the most casinos—owning 22 as of 2019—although most are smaller satellite casinos that are fractional compared to its largest property, Grand Lisboa. Age is calculated by subtracting the establishment year from the observation year. All companies except SJM were founded after Macau’s gaming industry liberalization in 2002. The debt-to-equity (D/E) ratio is another control, as companies may take on more debt for large-scale developments, which can lower their return on assets.
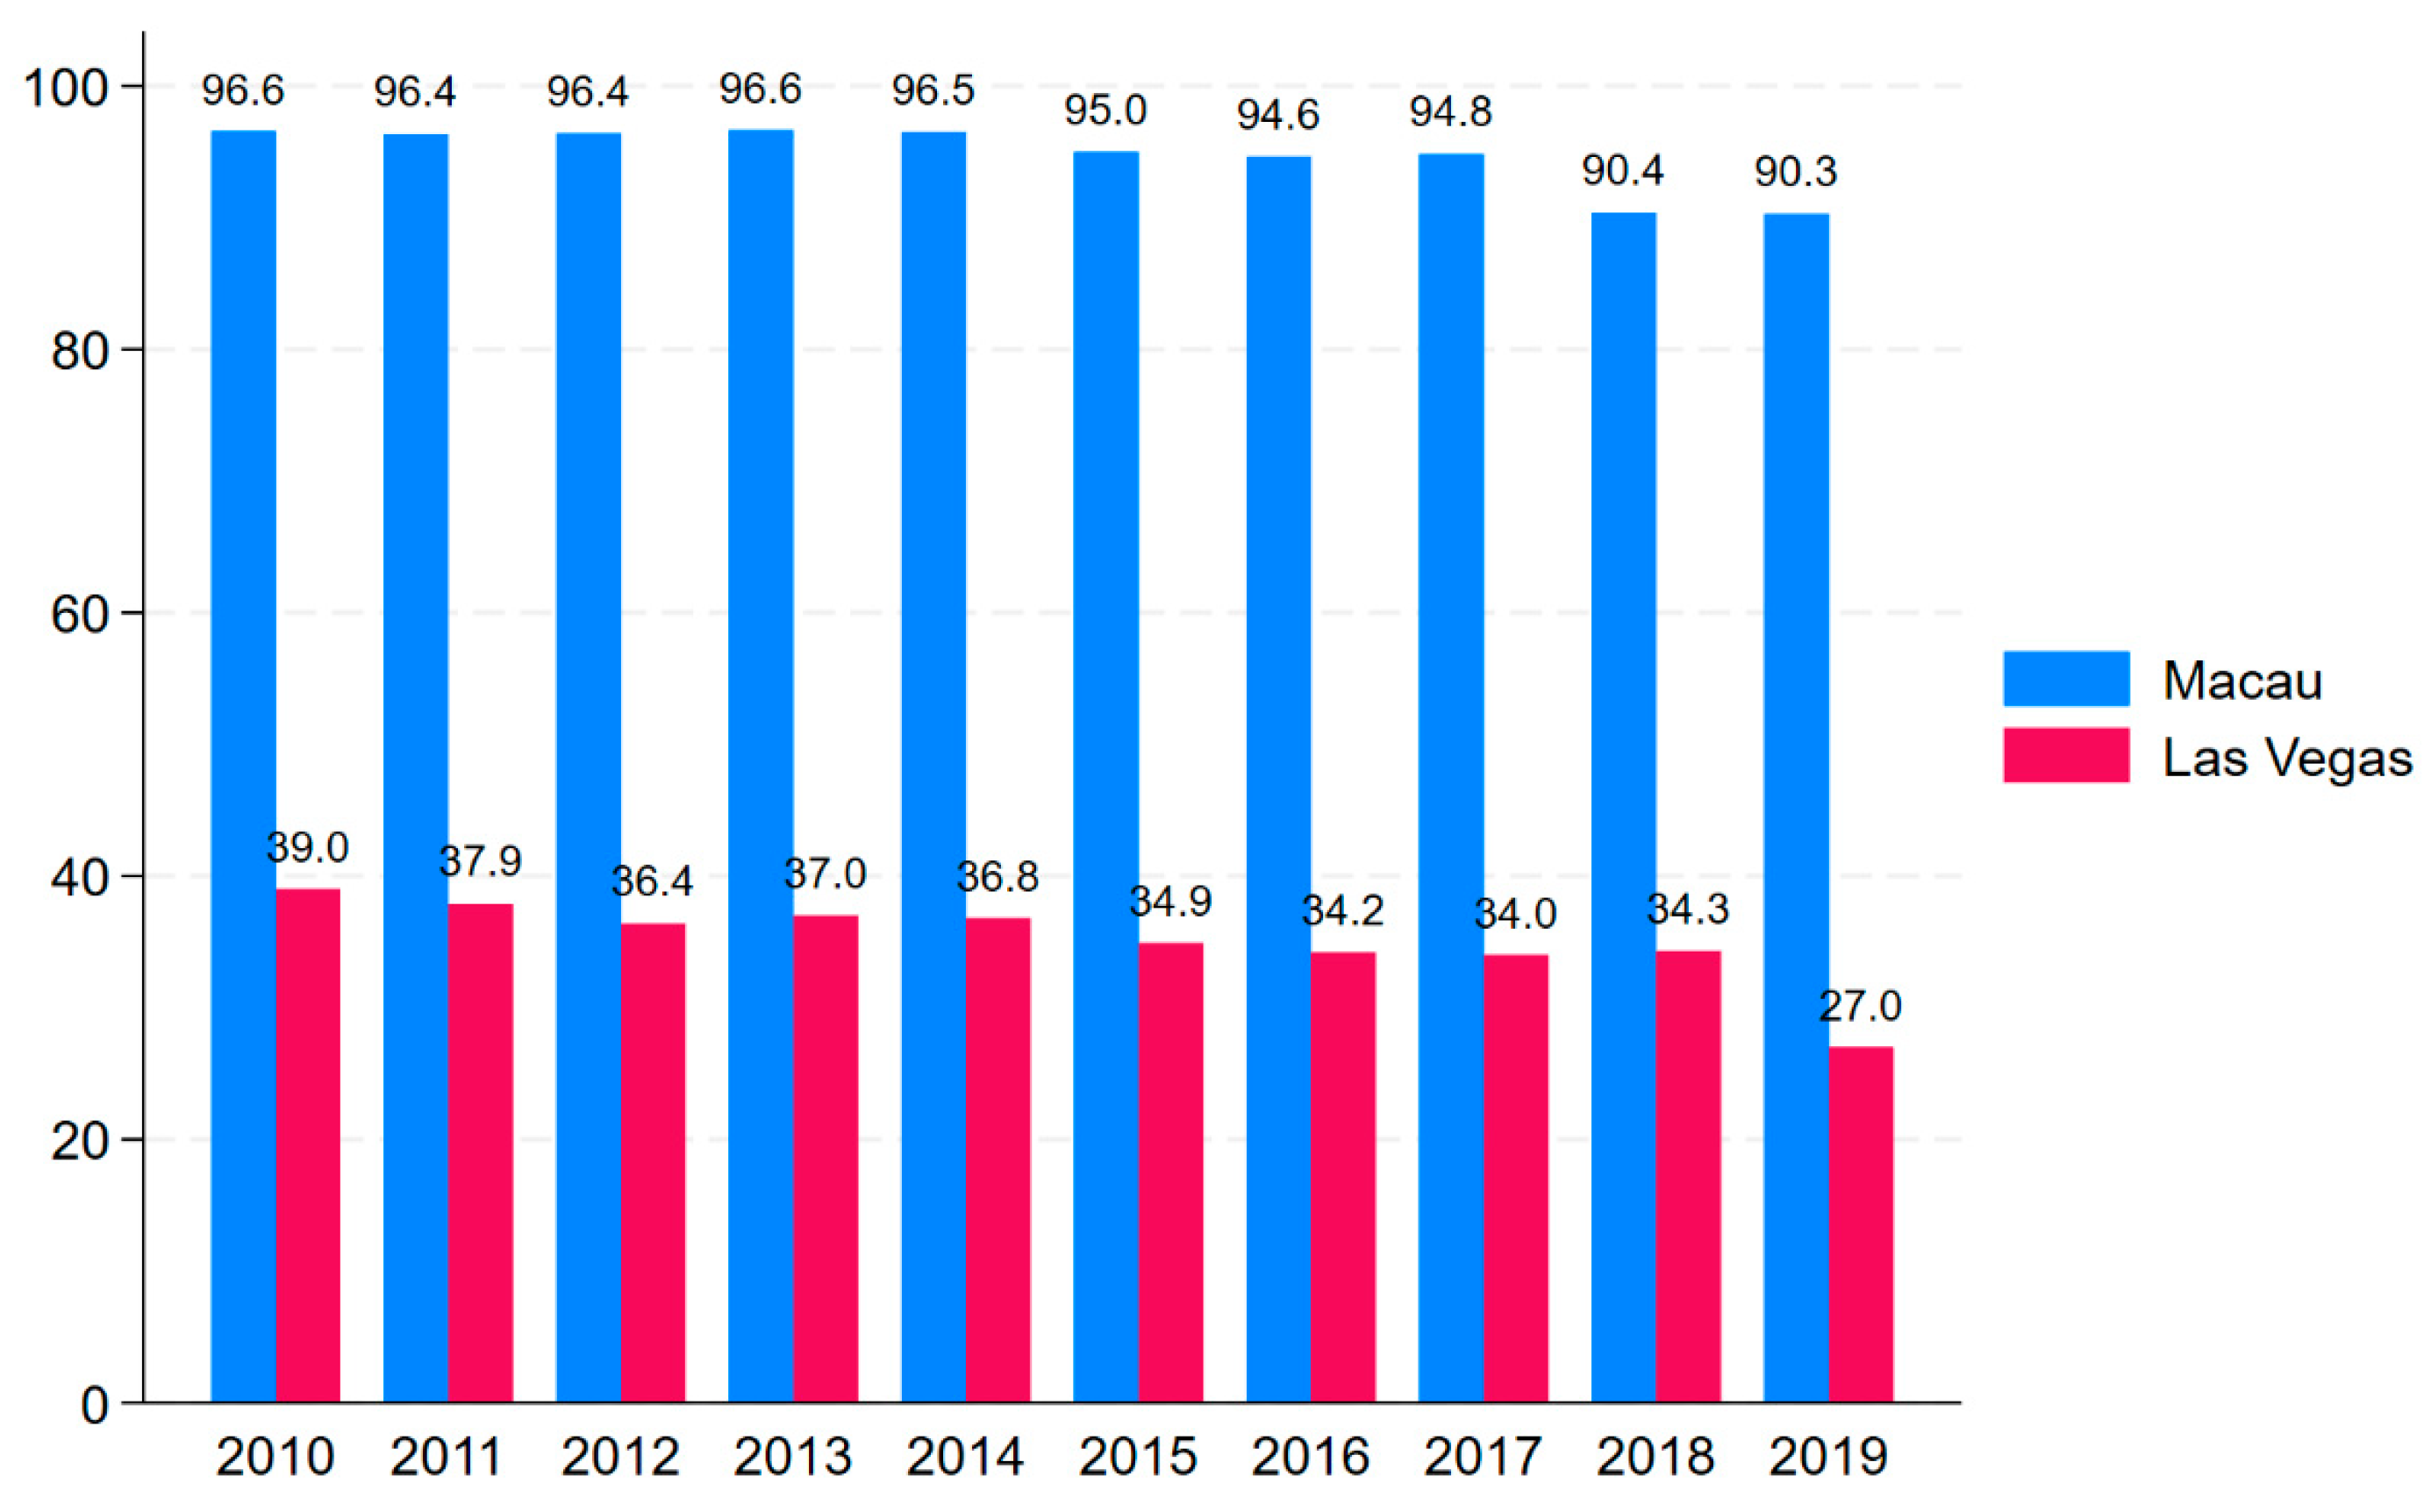
The international status is coded as a binary variable (1 = international). Of Macau’s six licensed operators, The Venetian, Wynn, and MGM represent international firms with Las Vegas headquarters, while SJM, Galaxy, and Melco constitute local companies controlled by Hong Kong and Macau investors. International operators generally maintain greater non-gaming revenue shares than their local counterparts. Although MGM’s chairmanship (held by Pansy Ho, daughter of Stanley Ho) might suggest local affiliation, the company retains its Las Vegas origins, with MGM International maintaining 56% ownership (MGM China, 2016). Notably, while MGM presented the lowest proportion of non-gaming revenue among the international operators, it still exceeded the shares reported by SJM and Melco.
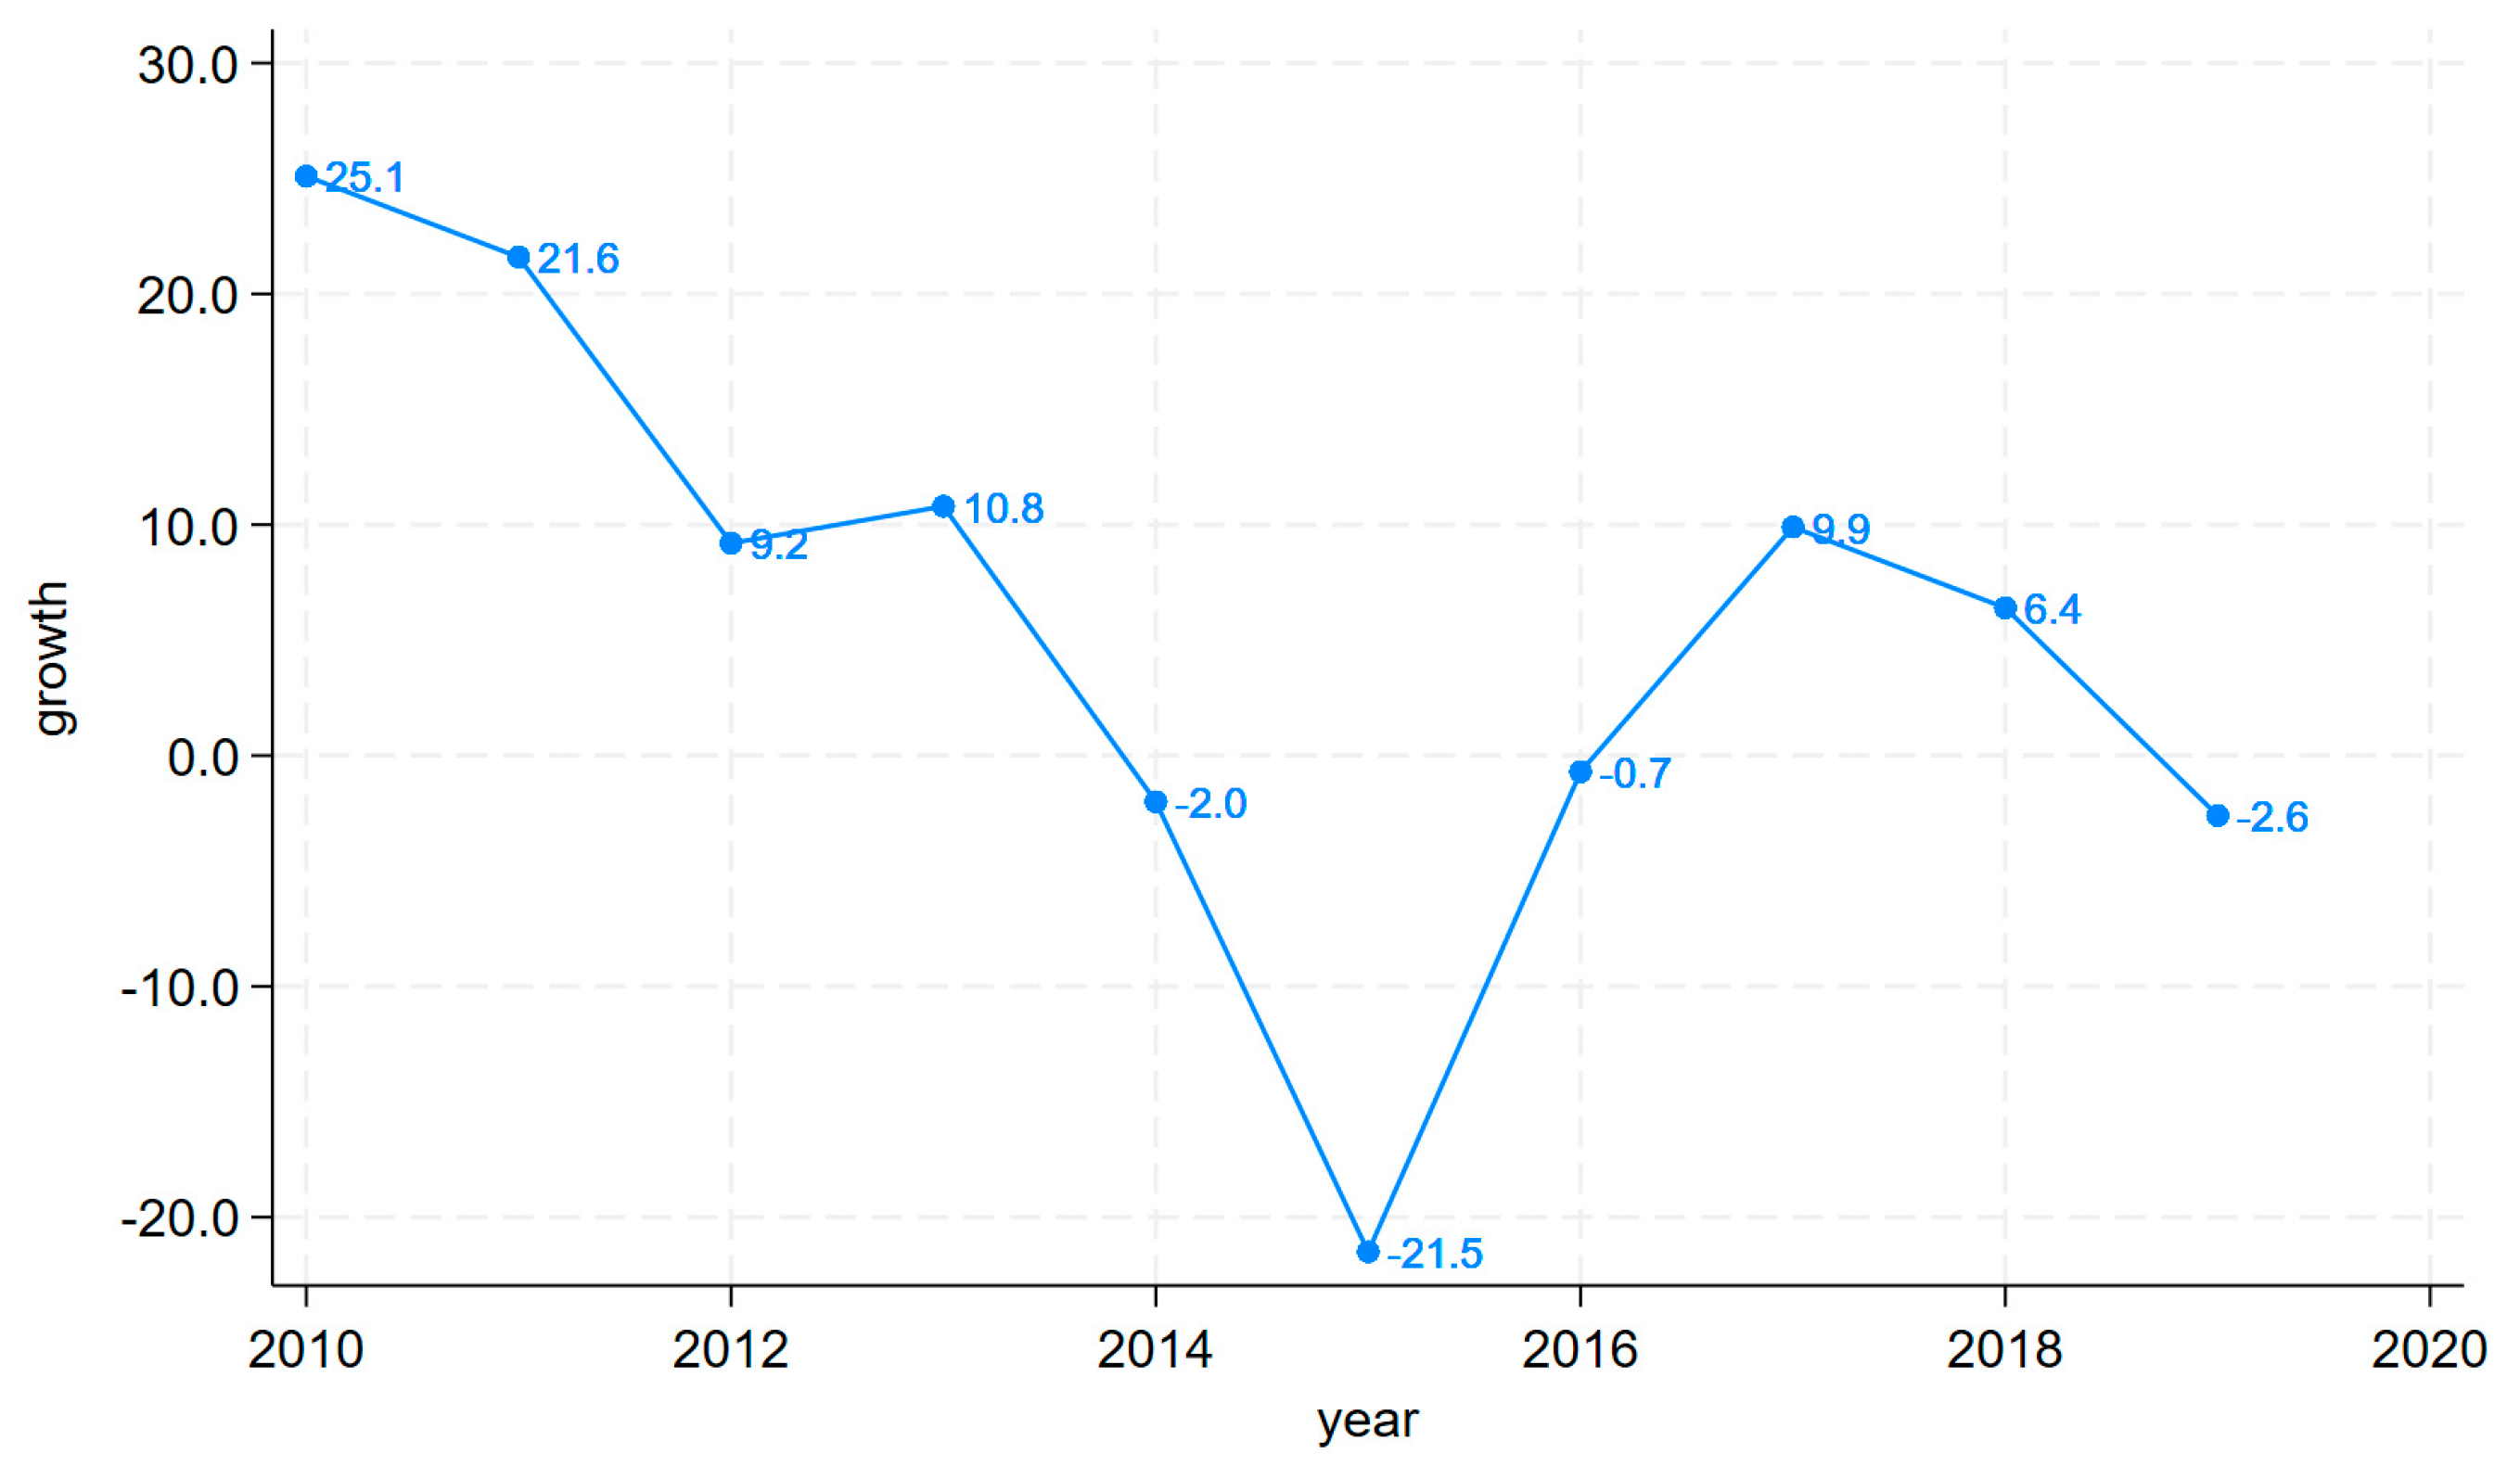
To account for temporal trends, we incorporated Macau’s annual GDP per capita growth rate as a control variable (see Figure 4). This measure captures broader economic fluctuations that affect the gaming sector. Notably, past shocks—particularly China’s anti-corruption campaign from 2014—have significantly impacted Macau’s gambling revenues (Chen, 2018; Zhou et al., 2022b). We opted against annual fixed effects due to our limited sample size, as adding 10 yearly indicators would substantially reduce the degrees of freedom and statistical power. The GDP growth rate serves as an efficient alternative for temporal controls in small-sample studies (Chen, 2018; Phipps et al., 2020), balancing model specification with estimation efficiency.
The formulae used to calculate the ratios are given in Table 1 and the summary statistics are given in Table 2.

3.2. Identification Strategy

We employed a linear ordinary least squares (OLS) model for our analysis. OLS remains the most straightforward and widely used approach in quantitative research. While existing quantitative studies on Macau have primarily used autoregressive (AR) models with economy-level time-series data (Zhou et al., 2022b), our manually collected panel dataset makes OLS particularly advantageous. The model provides high interpretability, with the coefficient β 1 representing the percentage point change in the dependent variable (Y) associated with a one-percentage-point increase in the independent variable (X). The specific formula is as follows:
Y i t = β 0 + β 1 ( N o n g a m i n g   S h a r e ) i t + β j I n d i v i d u a l   C o n t r o l s i t + β k G D P   p . c .   g r o w t h t + ε i t .
In this equation,   Y i t represents our outcome variables: NPM, ROA, and profit share. The independent variable of interest is the non-gaming share, which varies across individual firms (i) and time periods (t). The model incorporates firm-level controls that also vary by firm (i) and time (t). The GDP per capita growth rate varies temporally (t). Furthermore, β 1 denotes the estimated coefficient of the non-gaming share, while ε i t captures the error terms.
Reverse causality concerns are substantially mitigated in our context, due to the physical and operational constraints of casinos. Gaming firms must finalize their development plans before construction, making post-construction modifications to casino floor plans exceptionally difficult. Macau’s casinos represent some of the world’s most capital-intensive and architecturally complex facilities, with designated spaces rigidly allocated for specific uses (Jaschke & Ötsch, 2003).
We use bootstrapping for robustness checks. Bootstrapping is a powerful method for small sample size research because it allows for the estimation of the sampling distribution of a statistic by resampling with replacement from the original data. This approach does not rely on strict parametric assumptions, making it suitable when theoretical distributions are unreliable due to limited observations. Additionally, bootstrapping provides more robust confidence intervals and standard errors, enhancing the reliability of statistical inferences in small samples.

4. Results

4.1. Baseline Results

We first examined the relationship between non-gaming revenue share and net profit margin (NPM). The 2019 scatter plot reveals a clear positive correlation between these variables. The Venetian leads, with both the highest non-gaming share (20%) and NPM (24%). Conversely, Melco and SJM showed lower performance on both metrics, while MGM—the youngest operator (founded in 2007)—displayed the third-lowest non-gaming share and the lowest NPM (see Figure 5). This pattern provides initial support for H1, suggesting that greater non-gaming diversification correlates with improved profitability.
Regression analysis confirmed a significant positive relationship between non-gaming share and NPM (p < 0.01), with a one-percentage-point increase in non-gaming revenue associated with a 0.65-percentage-point NPM increase in the baseline model. This effect remained statistically significant at the 1% level when adding controls, though the magnitude was moderated to 0.53 points with firm characteristics and 0.47 points after accounting for time trends. Both company age and GDP per capita growth also showed significant impacts on profitability. The GDP per capita growth in Macau slowed down from 2010 to 2019, even experiencing negative growth between 2014 and 2016. However, the NPMs of the gaming companies showed a generally upward trend. This results in a negative sign before the GDP per capita growth variable; however, the variable still serves effectively as a control variable, as it reflects the trend over time. The robust significance across all specifications (see Table 3) strongly supports H1, indicating that non-gaming diversification consistently enhances the profit margins of casino operators.
The relationship between non-gaming share and return on assets (ROA) presented a similar positive pattern to that observed for NPM. As expected, Venetian—the most diversified operator—achieved the highest ROA (at 17%). MGM and Wynn showed relatively stronger ROA performance compared to their NPM rankings, attributable to their leaner asset portfolios. In contrast, Melco and SJM demonstrated lower ROAs, reflecting their heavier asset bases coupled with weaker profitability. Notably, Galaxy emerged as the top-performing local operator with the second-highest ROA, consistent with its relatively diversified operations. These results, as visually presented in Figure 6, provide clear evidence supporting H2; that is, a greater non-gaming revenue share correlates with improved asset efficiency.
The regression analysis demonstrated a robust positive relationship between non-gaming share and ROA, with all coefficients significant at the 1% level (see Table 4). A one-percentage-point increase in non-gaming revenue share was found to correspond to (1) a 0.47 percentage point ROA improvement in the baseline model, (2) a 0.57 point increase when controlling for firm characteristics, and (3) a 0.58 point enhancement after incorporating Macau’s GDP growth. While the control variables themselves showed insignificant effects, the consistently strong and statistically significant coefficients for non-gaming share across all specifications (p < 0.01) provide compelling evidence supporting H2, indicating that diversification meaningfully improves asset utilization efficiency in gaming operations.
Consistent with our first two hypotheses, we observed a strong positive correlation between the non-gaming revenue share and market profit share. The Venetian led in both measures, capturing 35% of Macau’s total gaming profits while maintaining the highest non-gaming diversification. Wynn—ranking second in non-gaming share—held the third position in market profit share. Among local operators, Galaxy demonstrated the strongest performance with both the highest non-gaming share and the second-highest profit share (see Figure 7). This remarkably consistent pattern across all three profitability metrics (NPM, ROA, and profit share) provides compelling evidence that diversified operators achieve superior market positioning in Macau’s gaming industry.
The regression analysis confirmed a significant positive relationship between non-gaming share and market profit share (p < 0.01 across all specifications). A one-percentage-point increase in non-gaming revenue was found to correspond to (1) a 1.22 percentage point increase in profit share in the baseline model, (2) a 1.28 point increase when controlling for firm characteristics, and (3) a 1.24 point increase after accounting for time trends. Notably, both the number of casinos and company age emerged as significant positive predictors of market share, suggesting that larger casino portfolios and younger firms tend to capture greater profit shares. The robust significance of non-gaming share coefficients (all at the 1% level, see Table 5) strongly supports H3, demonstrating that diversification not only improves operational metrics but also enhances competitive market positioning in Macau’s gaming industry.

4.2. Robustness Checks

Like many gaming-related studies (e.g., Kang et al., 2011; Phipps et al., 2020), our research faced constraints relating to the sample size. To address this potential limitation, we implemented a bootstrapping procedure with 300 replications (5× the original sample), creating an expanded dataset while preserving the underlying distribution. The bootstrapped OLS results confirmed our core findings: the non-gaming share coefficients remained identical in magnitude when compared to our primary estimates (Section 4.1), although with adjusted standard errors (see Table 6). This consistency across both the original and resampled data strongly suggests that our results are not artifacts of sample size constraints, as the bootstrapped estimates neither distorted the effect sizes nor altered their statistical significance.
While bootstrapping cannot fully overcome the limitations associated with using a small sample, our analysis demonstrated its superior effectiveness for this study, compared to alternative methods such as Monte Carlo simulation. In particular, the utilized technique provides three key advantages: (1) it generates more reliable estimates through resampling of the actual observed data, rather than creating artificial observations; (2) it significantly reduces estimation bias while preserving the original data structure; and (3) it produces robust standard errors that better reflect the true variability of samples. These properties make bootstrapping particularly valuable in our context, where conventional asymptotic approximations might be unreliable. The consistency of the bootstrapped results with the primary findings (Table 6) strengthens our confidence in the study’s conclusions, despite the modest original sample size.

5. Conclusions

This study demonstrated that an increased share of non-gaming revenue significantly enhances three critical profitability metrics for Macau’s gaming operators: (1) net profit margins show direct improvement; (2) return on assets increases substantially, which is particularly valuable in this capital-intensive industry, where asset utilization efficiency determines investment recovery speed; and (3) market share competitiveness strengthens, enabling diversified firms to capture a larger portion of the total market profits. Our bootstrapping-enhanced analysis confirmed that these findings are robust with respect to sample size-related limitations. These results collectively highlight diversification as a strategic imperative for gaming companies operating in Macau’s competitive landscape, with non-gaming operations serving as both drivers of profitability and competitive differentiators.
From a strategic management standpoint, the results of this study demonstrated that diversification hinges on the creation of synergistic ecosystems, in which non-gaming amenities complement and enhance core gaming operations. Through the development of integrated offerings—such as luxury hospitality, retail, and MICE (meetings, incentives, conferences, and exhibitions) facilities—firms can achieve higher margins, stabilize their revenue streams, and extend customer dwell times. Macau’s gaming companies can increase non-gaming diversification by investing in tourism-related infrastructure such as hotels, entertainment venues, and cultural attractions to attract a broader range of visitors. They can also develop partnerships in retail, wellness, and MICE sectors to generate stable, non-casino revenue streams. Additionally, leveraging digital platforms and smart technologies can enhance customer experiences and drive spending outside traditional gaming activities.
Macau’s regulatory push for economic diversification has fundamentally reshaped the business models of casino operators, as seen in mandated non-gaming investment requirements. Policy interventions have created both constraints and opportunities: while compliance increases capital expenditures, they also incentivize firms to develop sustainable revenue sources that are less susceptible to gaming-related volatility. The alignment with Macau’s “tourism+” policy framework highlights how public–private coordination can drive industry-wide transformation. However, challenges persist in terms of balancing regulatory objectives with the profitability needs of firms, suggesting that policymakers must develop calibrated incentives (e.g., tax breaks for non-gaming investments) to ensure their long-term viability.
This study has one caveat: like many previous quantitative gaming studies, our research was subject to sample size constraints. Although bootstrapping helped to mitigate this issue, it does not fully resolve the problem for inference purposes. Regarding endogeneity, the inherent rigidity of casino architectures—particularly the fixed partitioning of gaming and non-gaming spaces (as demonstrated by Venetian Macao’s case)—substantially alleviates reverse causality concerns. Interestingly, even if some reverse causality exists, this would represent a socially beneficial dynamic: greater profitability enables further diversification, potentially creating a virtuous cycle toward more sustainable operations. This suggests that, regardless of causal direction, the expansion of non-gaming operations correlates with positive outcomes for both operators and society.
Our findings both validate prior casino research in the U.S., demonstrating the benefits of diversification (Kang et al., 2011; Suh, 2011). This study breaks new ground by establishing quantitative evidence in the context of Macau—the world’s largest gaming market. Following on from this study, three key research opportunities arise: (1) micro-level analysis using amenity-specific performance data, (2) comparative studies of the effectiveness of diversification across regulatory environments, and (3) longitudinal assessments of how non-gaming components (e.g., entertainment vs. retail) differentially impact operational and financial outcomes. Future work should leverage emerging datasets to examine these granular relationships while maintaining methodological rigor in addressing Macau’s unique market characteristics.

Author Contributions

Conceptualization, Q.L. and S.S.; writing, Q.L. and S.S.; supervision, S.S.; funding acquisition, Q.L. All authors have read and agreed to the published version of the manuscript.

Funding

This research was funded by the University Center for Economic Development of the University of Nevada, Reno, and Nevada’s Department of Tourism and Cultural Affairs. Grant number WLDGTNCFFJZ3.

Institutional Review Board Statement

Not applicable.

Informed Consent Statement

Not applicable.

Data Availability Statement

The data can be found on the official website of Macau’s Gaming Inspection and Coordination Bureau (https://www.dicj.gov.mo/web/cn/frontpage/index.html (accessed on 16 April 2025)). The data can also be found in annual reports of Macau’s gambling companies.

Acknowledgments

We sincerely thank Federico Guerrero, Chunlin Liu, Mark Nichols, Elliott Parker, Kym Pram, Frederick Steinmann, and James Sundali for their invaluable support in this research project.

Conflicts of Interest

The authors declare no conflicts of interest. The funders had no role in the design of the study; in the collection, analyses, or interpretation of data; in the writing of the manuscript; or in the decision to publish the results.

Abbreviations

The following abbreviations are used in this manuscript:
DICJDirecção de Inspecção e Coordenação de Jogos (Macau Gaming Inspection and Coordination Bureau)
GDPGross Domestic Product
MICEmeetings, incentives, conferences, and exhibitions
NGCBNevada Gaming Control Board
NPMnet profit margin
OLSordinary least squares
ROAreturn on assets
SARSpecial Administrative Region
SJMSociedade de Jogos de Macau
STDMSociedade de Turismo e Diversões de Macau
UNESCOUnited Nations Educational, Scientific and Cultural Organization

References

  1. Chen, C. (2018). The impact of anti-corruption on Macau’s gaming industry: An externality analysis. Chinese Studies, 7(2), 144–154. [Google Scholar] [CrossRef]
  2. DICJ. (2025). Gaming inspection and coordination bureau. Available online: https://www.dicj.gov.mo/web/cn/frontpage/index.html (accessed on 16 April 2025).
  3. Efron, B., & Tibshirani, R. J. (1994). An introduction to the Bootstrap. Chapman and Hall/CRC. [Google Scholar] [CrossRef]
  4. Fong, D. K. C., Fong, H. N., & Li, S. Z. (2011). The social cost of gambling in Macao: Before and after the liberalisation of the gaming industry. International Gambling Studies, 11(1), 43–56. [Google Scholar] [CrossRef]
  5. Freedman, D. A. (1981). Bootstrapping regression models. The Annals of Statistics, 9(6), 1218–1228. [Google Scholar] [CrossRef]
  6. Giroud, X., Mueller, H. M., Stomper, A., & Westerkamp, A. (2012). Snow and leverage. The Review of Financial Studies, 25(3), 680–710. [Google Scholar] [CrossRef]
  7. Iskenderoglu, C. (2025). The value of diversification: ESG and investment in controversial industries. Finance Research Letters, 76, 106956. [Google Scholar] [CrossRef]
  8. Jaschke, K., & Ötsch, S. (2003). Stripping Las Vegas: A contextual review of Casino resort architecture. Verld. Bauhaus-Universität. [Google Scholar]
  9. Kang, K. H., Lee, S., & Yang, H. (2011). The effects of product diversification on firm performance and complementarities between products: A study of US Casinos. International Journal of Hospitality Management, 30(2), 409–421. [Google Scholar] [CrossRef]
  10. Lam, D. (2012). Slot or table? A Chinese perspective. UNLV Gaming Research & Review Journal, 9(2), 69–72. Available online: https://digitalscholarship.unlv.edu/grrj/vol9/iss2/6 (accessed on 16 April 2025).
  11. Li, S. X., & Greenwood, R. (2004). The effect of within-industry diversification on firm performance: Synergy creation, multi-market contact and market structuration. Strategic Management Journal, 25(12), 1131–1153. [Google Scholar] [CrossRef]
  12. Liang, A. ((2022,, July 11)). Macau shuts down Casinos following Covid outbreak. Available online: https://www.bbc.com/news/business-62117391 (accessed on 16 April 2025).
  13. Liu, C., & Lin, Y. (2024). Macau’s sustainability and diversification. Business Economics, 59(1), 53–57. [Google Scholar] [CrossRef]
  14. Liu, M. T., Chang, T. T. G., Loi, E. H. N., & Chan, A. C. H. (2015). Macau gambling industry: Current challenges and opportunities next decade. Asia Pacific Journal of Marketing and Logistics, 27(3), 499–512. [Google Scholar] [CrossRef]
  15. Lucas, A. F., & Brewer, K. P. (2001). Managing the slot operations of a hotel Casino in the Las Vegas locals’ market. Journal of Hospitality & Tourism Research, 25(3), 289–301. [Google Scholar] [CrossRef]
  16. Lucas, A. F., & Santos, J. (2003). Measuring the effect of Casino-operated restaurant volume on slot machine business volume: An exploratory study. Journal of Hospitality & Tourism Research, 27(1), 101–117. [Google Scholar] [CrossRef]
  17. Luo, J. M., Lam, C. F., Li, X., & Shen, H. (2016). Corporate social responsibility in Macau’s gambling industry. Journal of Quality Assurance in Hospitality & Tourism, 17(3), 237–256. [Google Scholar] [CrossRef]
  18. Luo, Q. (2025). From demolition to business: How compensation method influences New Ventures. Asian Development Review. [Google Scholar]
  19. MGM China. (2016). MGM resorts to increase stake in MGM China. MGM China Holdings Limited. Available online: https://en.mgmchinaholdings.com/media-releases?item=99 (accessed on 16 April 2025).
  20. Min, J. H., Lee, H., & Blum, S. C. (2019). Spillover impact of non-gaming amenities on gaming volumes. Cornell Hospitality Quarterly, 60(3), 262–269. [Google Scholar] [CrossRef]
  21. NGCB. (2025). Abstract report. Available online: https://gaming.nv.gov/about/abstract/report/ (accessed on 16 April 2025).
  22. Oxford Analytica. (2025). Macau’s move away from gambling will remain difficult. Emerald Expert Briefings. [Google Scholar] [CrossRef]
  23. Phipps, E. H., Nichols, M. W., & Guerrero, F. (2020). The impact of video gaming terminals on Casinos and state and local tax revenue. Public Finance Review, 48(5), 650–675. [Google Scholar] [CrossRef]
  24. Reuters. (2025, January 1). Macau 2024 casino revenues top official estimate but below pre-pandemic levels. Reuters. Available online: https://www.reuters.com/business/macau-2024-casino-revenues-top-official-estimate-below-pre-pandemic-levels-2025-01-01/ (accessed on 16 April 2025).
  25. Roehl, W. S. (1996). Competition, Casino spending, and use of Casino amenities. Journal of Travel Research, 34(3), 57–62. [Google Scholar] [CrossRef]
  26. Saiidi, U. (2018, November 2). China’s answer to Las Vegas has one of the world’s biggest per-person economies. CNBC. Available online: https://www.cnbc.com/2018/11/02/macau-has-one-of-the-worlds-biggest-per-person-economies.html (accessed on 16 April 2025).
  27. Sands China Ltd. (2025). Financial reports. Sands China Ltd. Available online: https://investor.sandschina.com/financial-information/annual-reports/ (accessed on 16 April 2025).
  28. Shampaner-Ghiassi, E. (2012). The non-gaming business of the gaming industry: Evaluating the contribution of non-gaming amenities at a Casino-resort property [Ph.D. thesis, University of Nevada]. UNLV Theses, Dissertations, Professional Papers, and Capstones. [Google Scholar] [CrossRef]
  29. Siu, R. C. S., & Eadington, W. R. (2009). Table games or slots? Competition, evolution and game preference in Macao’s Casino market. The Journal of Gambling Business and Economics, 3(1), 41–63. [Google Scholar] [CrossRef]
  30. Sou, J. P.-U., & Siu, R. C. S. (2023). Does diversification drive tourism demand? A structural change perspective: Evidence from a casino tourism destination. International Journal of Tourism Research, 25(3), 293–304. [Google Scholar] [CrossRef]
  31. Stevenson, A., & Wang, Z. ((2024,, December 20)). Macau is the Casino capital of the world. For China, That’s not enough. The New York Times. Available online: https://www.nytimes.com/2024/12/19/business/macau-china-xi-jinping.html (accessed on 16 April 2025).
  32. Suh, E. (2011). Examining the indirect impact of showroom entertainment on hourly slot gaming volume: The case of a Las Vegas hotel-casino. International Journal of Hospitality Management, 30(3), 522–529. [Google Scholar] [CrossRef]
  33. The Nevada Independent. (2025, January 30). 2024 was a record year for Nevada gaming revenue, but not on the strip. The Nevada Independent. Available online: https://thenevadaindependent.com/article/2024-was-a-record-year-for-nevada-gaming-revenue-but-not-on-the-strip (accessed on 16 April 2025).
  34. Walker, D. M., & Bryant, L. L. (2011). The financial returns to Casino amenities. The Journal of Gambling Business and Economics, 5(1), 67–84. [Google Scholar] [CrossRef]
  35. Wan, Y. K. P., & Li, X. (2013). Sustainability of tourism development in Macao, China. International Journal of Tourism Research, 15(1), 52–65. [Google Scholar] [CrossRef]
  36. Wang, X., Shen, H. W., Cui, W. J., Li, J. Y., & Chen, X. Y. (2017). Crisis and opportunity of Macao gambling industry—Based on the history of gambling industry in Macao. Journal of Business Theory and Practice, 5(4), 4. [Google Scholar] [CrossRef]
  37. Wong, J. W. C., & Lai, I. K. W. (2021). Gaming and non-gaming memorable tourism experiences: How do they influence young and mature tourists’ behavioural intentions? Journal of Destination Marketing & Management, 21, 100642. [Google Scholar] [CrossRef]
  38. World Bank Group. (2025). World bank open data. Available online: https://data.worldbank.org (accessed on 16 April 2025).
  39. WSJ. (2014). “Uncommon knowledge”: Steve Wynn’s Las Vegas stories. WSJ. Available online: https://www.wsj.com/video/uncommon-knowledge-steve-wynn-las-vegas-stories/CF920B09-3D7E-4688-984E-B313B6C9AD79.html (accessed on 16 April 2025).
  40. Xu, T., Abarbanel, B., Erdem, M., Bernhard, B., & Kraus, S. (2023). Problem gambling and cognitive distortions among Macao VIP hosts: A brief report. UNLV Gaming Research & Review Journal, 27(1), 49–58. Available online: https://digitalscholarship.unlv.edu/grrj/vol27/iss1/3 (accessed on 16 April 2025).
  41. Yu, T., & Shepherd, C. ((2023,, September 29)). Young people in China call themselves ‘special forces’ of budget travel. The Washington Post. Available online: https://www.washingtonpost.com/world/2023/09/29/china-holiday-golden-week-travel/ (accessed on 16 April 2025).
  42. Zeng, Z. (2023). Research on non-gaming diversification strategies of gaming companies in Macau. Global Gaming and Tourism Research. [Google Scholar]
  43. Zeng, Z., Ji, C., & Siu, L. C. (2021). Diversification of Macao’s gaming industry: Perspective from a comparison of companies. Global Gaming and Tourism Research. [Google Scholar]
  44. Zhou, F., Schrier, T., & Zheng, T. (2022a). COVID-19 and its after-effects On Macau’s gaming industry. International Journal of Business & Management Studies, 3(12), 44–52. [Google Scholar] [CrossRef]
  45. Zhou, F., Zheng, T., Schrier, T., & Farrish, J. (2022b). Examining the impact of China’s corruption crackdown: A forecast for Macau’s tourism and gaming industry. Tourism and Hospitality, 3(3), 752–764. [Google Scholar] [CrossRef]
Figure 1. Share of gaming revenues in gaming companies from 2010 to 2019. Note: This study examines the share of non-gaming revenue in gaming companies in Macau and Las Vegas. Data for Macau were sourced from the Gaming Inspection and Coordination Bureau (DICJ, 2025) and companies’ annual reports, while data for Las Vegas were derived from the Nevada Gaming Control Board (NGCB, 2025).
Tourismhosp 06 00091 g001
Figure 2. Theoretical framework. Note: non-gaming diversification can significantly enhance the profitability of casinos through various channels, including increased profitability from non-gaming amenities, improved customer retention rates, and greater revenue premiums in VIP rooms, gaming tables, and slot machines. The results are improved profitability indicators, specifically net profit margin (NPM), return on assets (ROA), and profit share.
Tourismhosp 06 00091 g002
Figure 3. Total revenue and total profit of six gaming companies in Macau. Note: Macau’s gaming operators experienced significant financial deterioration during the COVID-19 pandemic, with both total revenue and total profit metrics declining sharply across all firms. Figures are converted from Macanese patacas into billions of U.S. dollars and were extracted from corporate annual reports. Total revenue includes both gaming and non-gaming revenue, while total profit excludes the 40% gambling tax charged by the Macau SAR. The conversion rate of Macanese patacas to U.S. dollars remained stable at 1:0.12 from 2010 to 2023.
Tourismhosp 06 00091 g003
Figure 4. Macau’s per capita GDP growth rate. Note: annual GDP per capita growth rates for Macau. Percentage point values are labeled for each year. Source: World Bank (World Bank Group, 2025).
Tourismhosp 06 00091 g004
Figure 5. Non-gaming share vs. NPM. Note: scatter plot using data from 2019. Horizontal axis shows the non-gaming share in percentage. Vertical axis shows the net profit margin in percentage.
Tourismhosp 06 00091 g005
Figure 6. Non-gaming share vs. ROA. Note: scatter plot using data from 2019. Horizontal axis shows the non-gaming share in percentage. Vertical axis shows the return on assets in percentage.
Tourismhosp 06 00091 g006
Figure 7. Non-gaming share vs. profit share. Note: scatter plot using data from 2019. Horizontal axis shows the non-gaming share in percentage. Vertical axis shows the return on assets in percentage.
Tourismhosp 06 00091 g007
Table 1. Ratio formulae.
RatioFormula
Net Profit Margin (NPM)NPM = Net Profit/Revenue × 100%
Return on Assets (ROA)ROA = Net Profit /Total Assets × 100%
Profit ShareProfit Share = Company’s Profit/Total Market Profit × 100%
Non-gaming ShareNon-gaming Share = Non-gaming Revenue/Total Revenue × 100%
Debt-to-Equity (D/E) RatioD/E Ratio = Total Liabilities/Shareholders’ Equity × 100%
Table 2. Summary statistics.
MatchedInternationalLocal
Mean/sdMean/sdMean/sd
NPM13.4615.8411.08
(5.83)(5.95)(4.69)
ROA15.3717.7013.04
(8.35)(9.30)(6.65)
Profit share16.6718.5714.76
(9.48)(11.36)(6.81)
Non-gaming share5.248.052.43
(5.24)(5.62)(2.82)
No. of casinos6.132.2710.00
(6.75)(1.51)(7.71)
Age17.008.8325.17
(16.35)(3.18)(19.89)
D/E264.84332.63197.05
(187.51)(178.33)(173.85)
GDP p.c. growth5.625.625.62
(12.73)(12.84)(12.84)
N603030
Notes: first column shows the total sample. The second and third columns reflect the international and local gambling firms, respectively. Data from DICJ website and annual reports of these companies.
Table 3. Impact on NPM.
(1)(2)(3)
NPMNPMNPM
Non-gaming share0.655 ***0.534 ***0.471 ***
(0.118)(0.139)(0.140)
No. of casinos 0.2430.766
(0.541)(0.597)
Age −0.194−0.407 *
(0.211)(0.235)
D/E −0.004−0.003
(0.004)(0.004)
International 1.0391.738
(1.987)(1.977)
GDP p.c. growth −0.101 *
(0.053)
Constant10.030 ***13.041 ***13.605 ***
(0.870)(1.489)(1.485)
N606060
Note: column (1) shows the impact of non-gaming share on NPM without control variables. Columns (2) and (3) represent the impact of non-gaming share on NPM with control variables. Standard errors in parentheses. * p < 0.10, ** p < 0.05, *** p < 0.01.
Table 4. Impact on ROA.
(1)(2)(3)
ROAROAROA
Non-gaming share0.472 ***0.568 ***0.576 ***
(0.109)(0.167)(0.175)
No. of casinos 0.2770.244
(0.825)(0.855)
Age −0.195−0.181
(0.334)(0.347)
D/E 0.0030.003
(0.005)(0.005)
International −3.938−4.038
(2.969)(3.064)
GDP p.c. growth −0.014
(0.063)
Constant7.245 ***9.758 ***9.660 ***
(1.010)(1.947)(2.038)
N606060
Note: column (1) shows the impact of non-gaming share on ROA without control variables. Columns (2) and (3) represent the impact of non-gaming share on ROA with control variables. Standard errors in parentheses. * p < 0.10, ** p < 0.05, *** p < 0.01.
Table 5. Impact on profit share.
(1)(2)(3)
Profit ShareProfit ShareProfit Share
Non-gaming share1.222 ***1.279 ***1.235 ***
(0.175)(0.181)(0.186)
No. of casinos 3.272 ***3.635 ***
(0.702)(0.793)
Age −1.320 ***−1.469 ***
(0.274)(0.312)
D/E −0.0010.000
(0.005)(0.005)
International 0.4440.930
(2.581)(2.628)
GDP p.c. growth −0.070
(0.071)
Constant10.267 ***12.299 ***12.691 ***
(1.292)(1.933)(1.974)
N606060
Note: column (1) shows the impact of non-gaming share on profit share without control variables. Columns (2) and (3) represent the impact of non-gaming share on profit share with control variables. Standard errors in parentheses. * p < 0.10, ** p < 0.05, *** p < 0.01.
Table 6. Bootstrapping results.
(1)(2)(3)
NPMROAProfit Share
Non-gaming share0.471 ***0.576 **1.235 ***
(0.129)(0.253)(0.161)
No. of casinos0.7660.2443.635 ***
(0.692)(0.735)(0.970)
Age−0.407−0.181−1.469 ***
(0.278)(0.433)(0.393)
D/E−0.0030.0030.000
(0.004)(0.009)(0.004)
International1.738−4.0380.930
(1.956)(4.778)(2.178)
GDP p.c. growth−0.101−0.014−0.070
(0.062)(0.061)(0.076)
Constant13.605 ***9.660 **12.691 ***
(1.293)(4.736)(1.896)
N300300300
Note: Columns (1), (2), and (3) show the results regarding the impact of non-gaming share on NPM, ROA, and profit share, respectively. Standard errors in parentheses. * p < 0.10, ** p < 0.05, *** p < 0.01.
Disclaimer/Publisher’s Note: The statements, opinions and data contained in all publications are solely those of the individual author(s) and contributor(s) and not of MDPI and/or the editor(s). MDPI and/or the editor(s) disclaim responsibility for any injury to people or property resulting from any ideas, methods, instructions or products referred to in the content.

