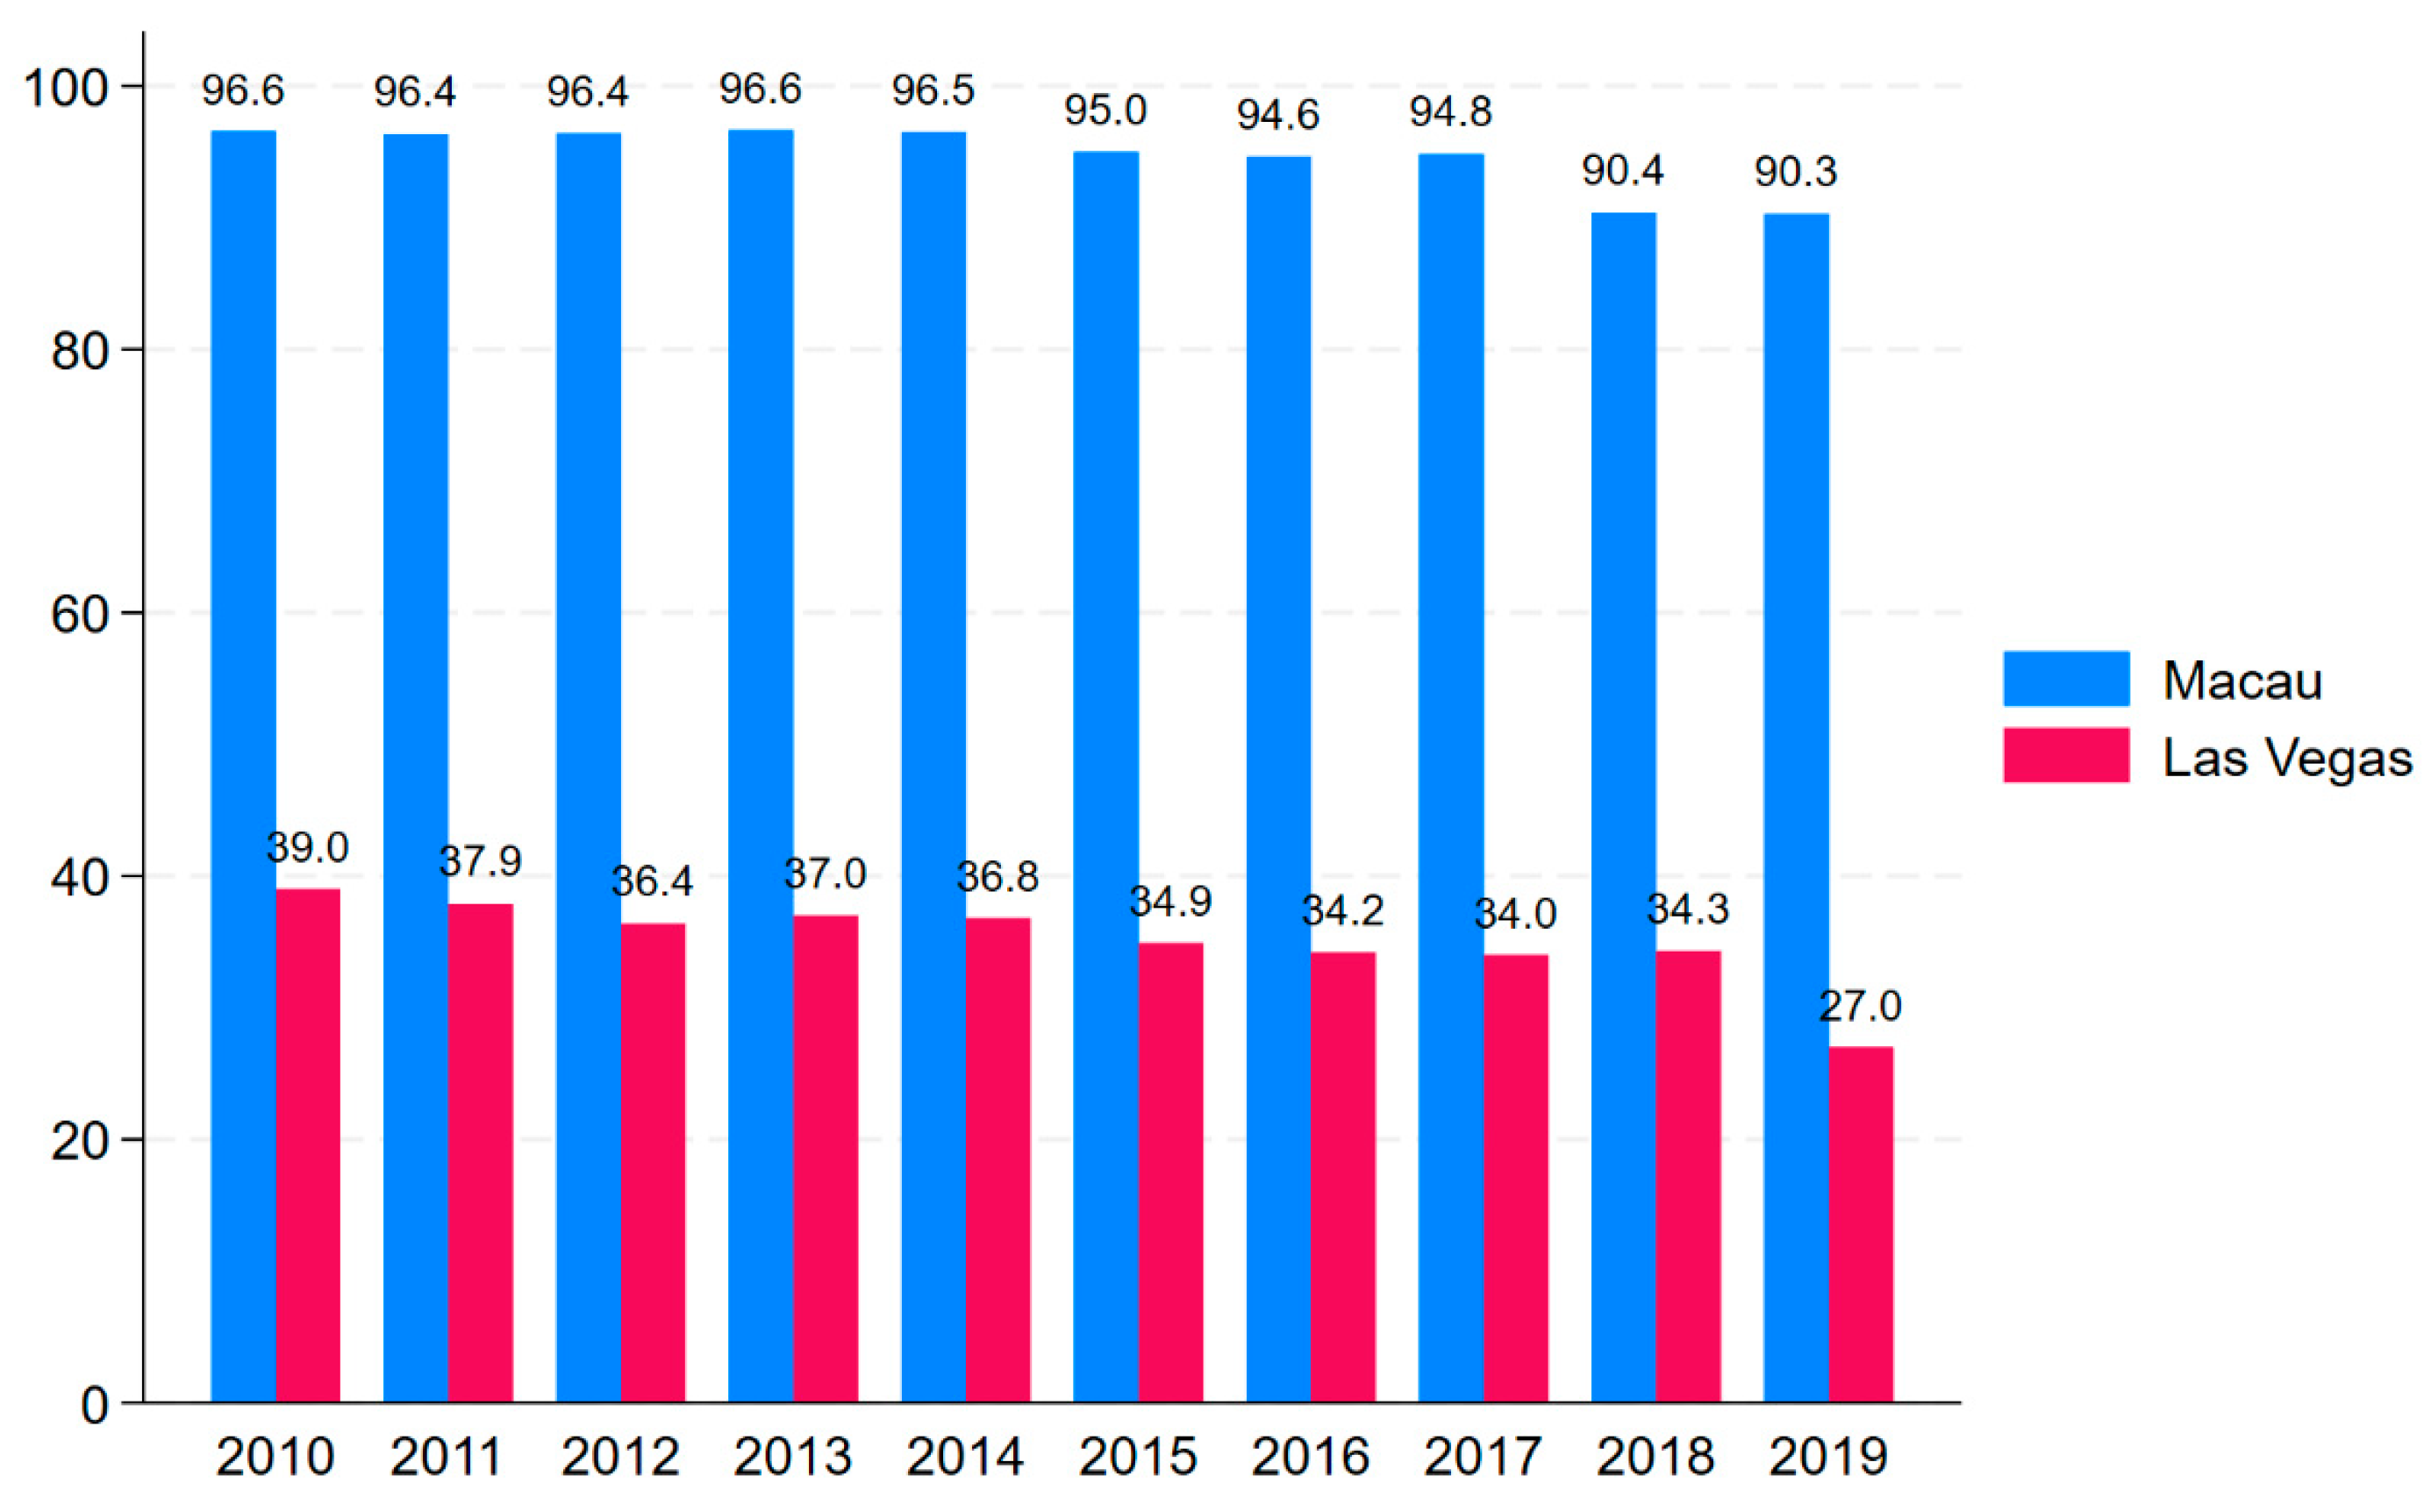
3.1. Data Sources
This study utilizes manually collected data from two primary sources: (1) official disclosures from Macau’s Gaming Inspection and Coordination Bureau (
DICJ, 2025), and (2) corporate annual reports obtained from company websites. As mandated by Macau’s regulatory framework, all six licensed gaming operators submit comprehensive annual reports to the DICJ. Where gaps exist in the DICJ records, we supplemented the dataset with information extracted directly from company filings (e.g.,
Sands China Ltd., 2025).
The analysis was focused on the period from 2010 to 2019 for several methodological reasons. First, this timeframe represents the first complete decade following the liberalization of Macau’s gaming market in 2002. Second, with the exception of SJM Holdings (established in 1962), all current operators commenced operations between 2000 and 2009 (MGM China in 2004, Galaxy Entertainment in 2002, etc.). Through beginning our sample in 2010, we obtained a balanced panel dataset that captures all six operators throughout the entire study period, while avoiding the initial volatility of their early operating years.
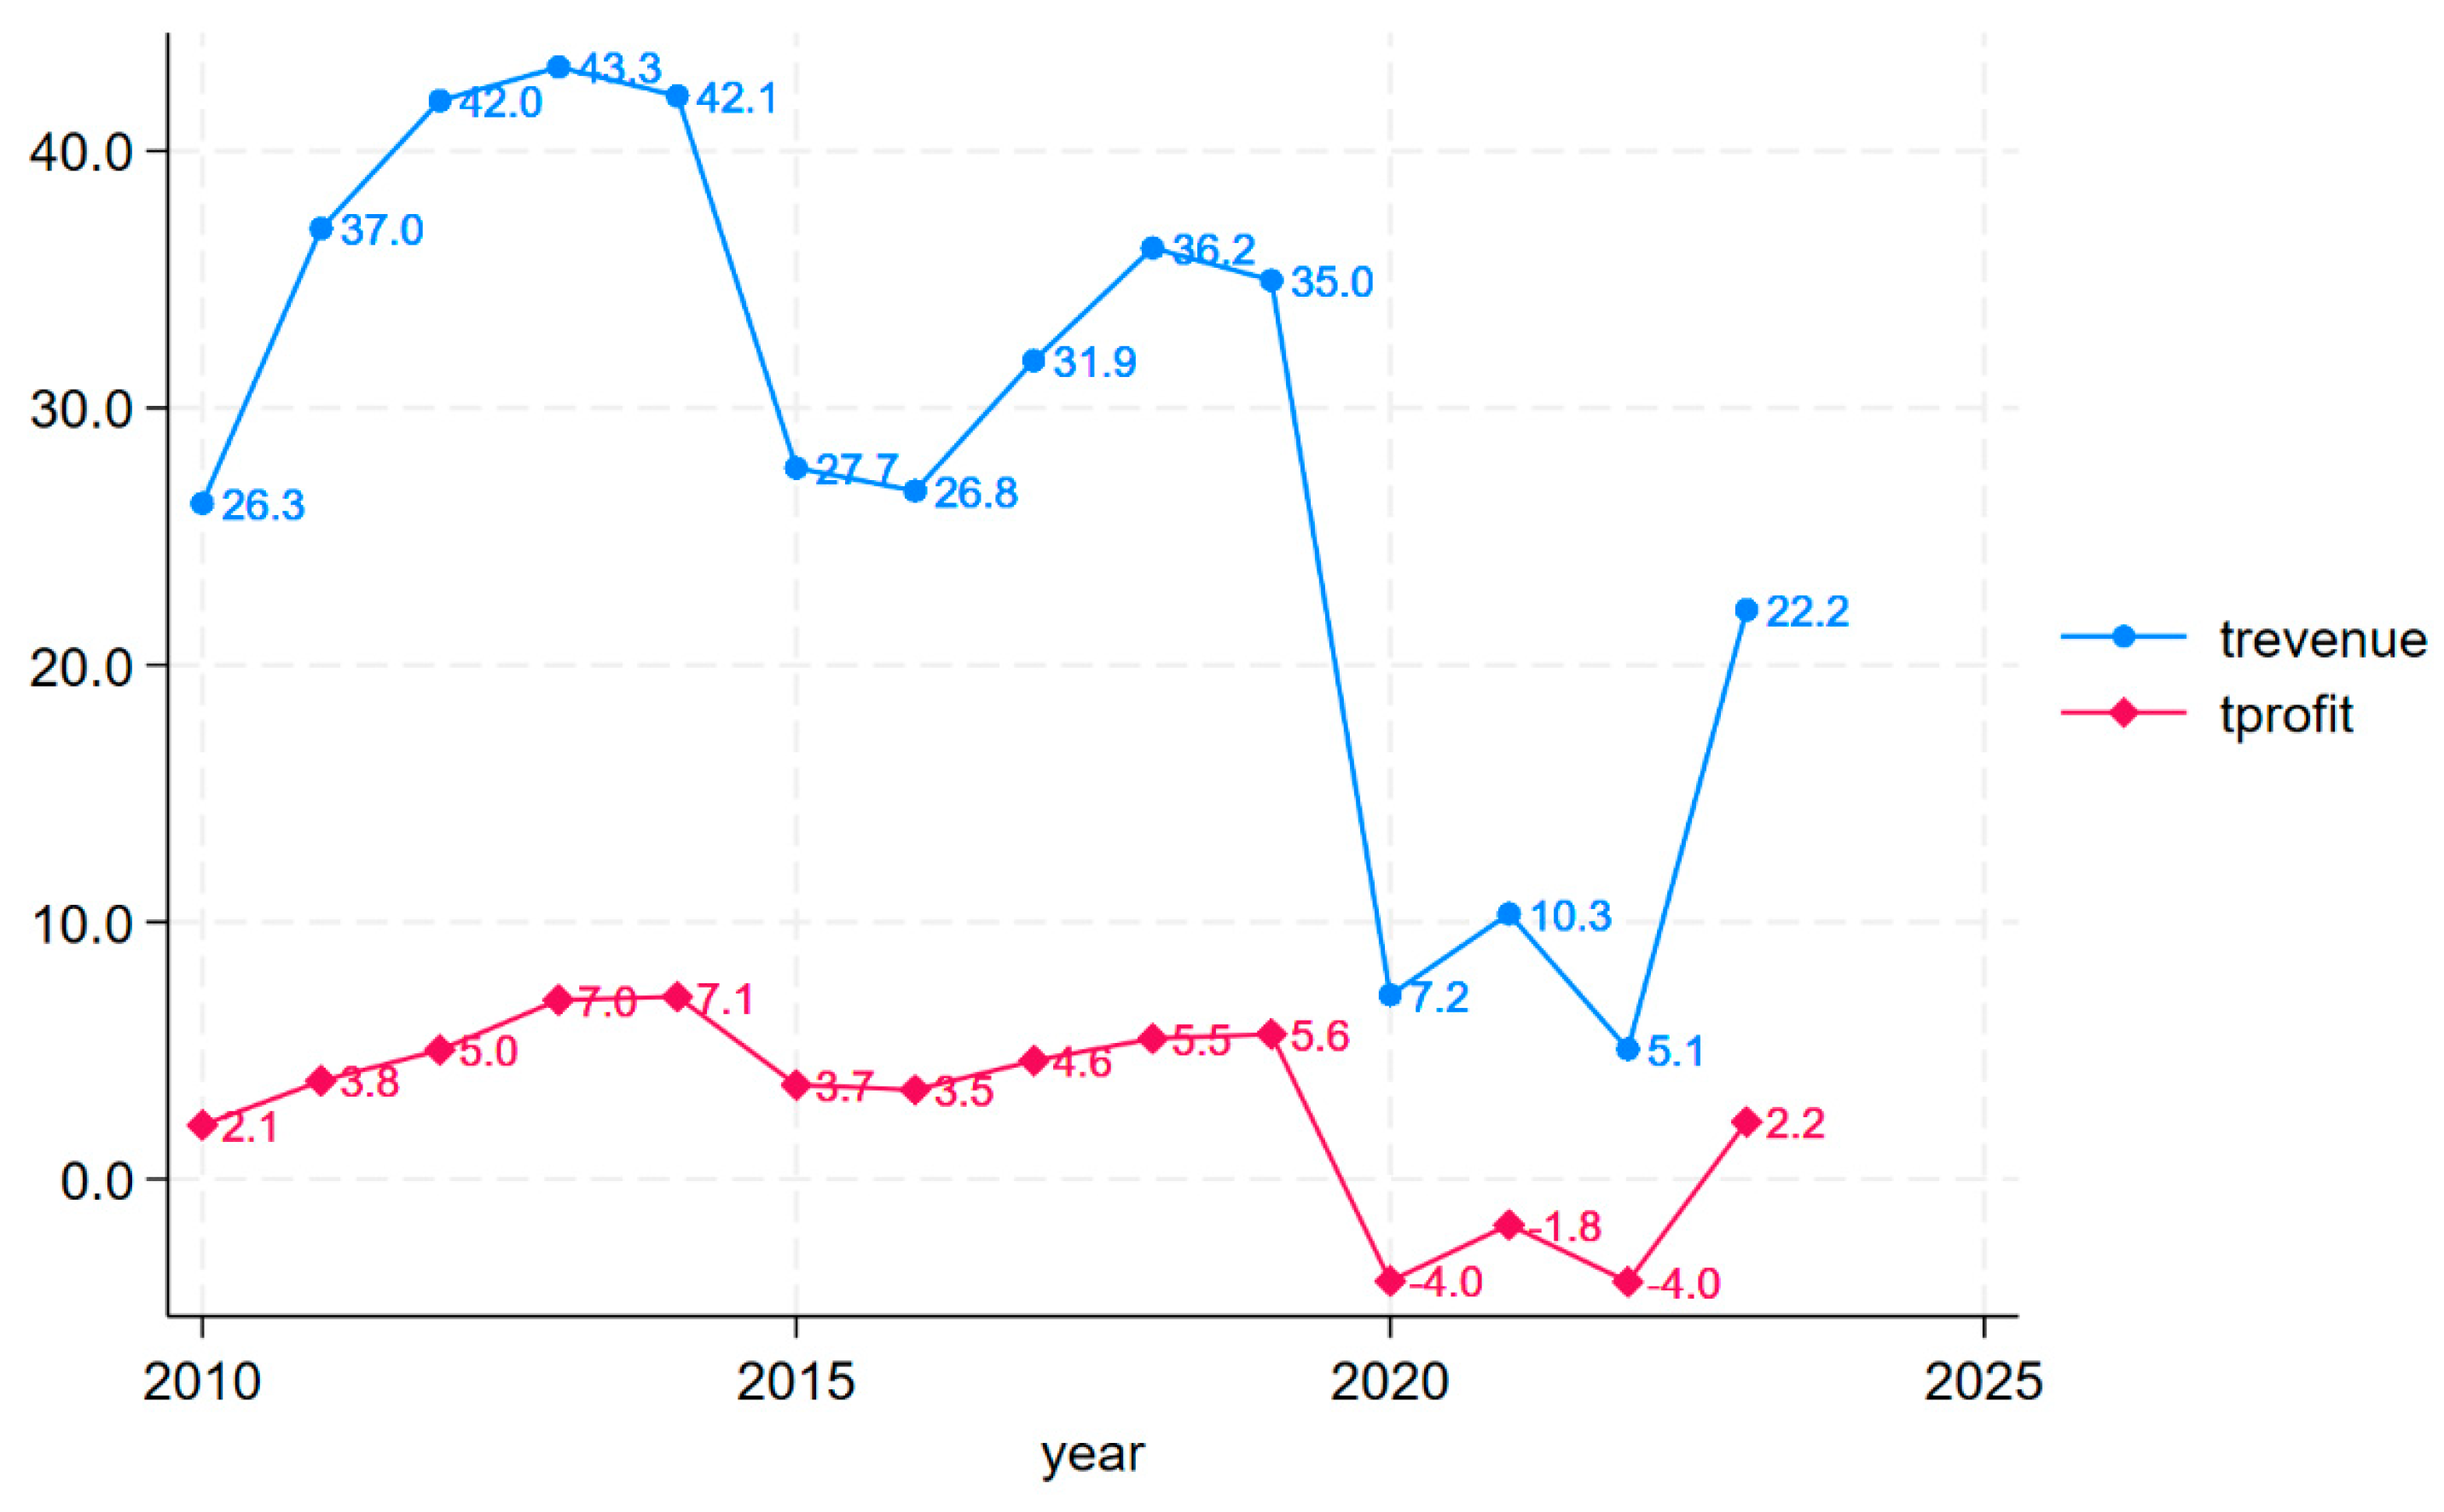
This study’s dataset covers 2010–2019 while excluding subsequent years due to the disruptive impacts of the COVID-19 pandemic on Macau’s gaming industry. This exclusion is justified by government-mandated casino closures (
Liang, 2022) and mainland China’s prolonged travel restrictions, which fundamentally altered market conditions and customer flows during the period 2020–2022. Although operations normalized in 2023 and partial 2024 data are emerging, we maintained the pre-pandemic timeframe to ensure comparability across our balanced panel of six operators (established between 1962 and 2009). While excluded from formal analysis,
Figure 3 illustrates post-2019 trends in key financial metrics (total revenue and total profit) to provide contextual continuity.
The analysis faced inherent data constraints due to Macau’s unique market structure. Unlike more transparent jurisdictions, Macau’s gaming operators (
n = 6) are only required to disclose company-level financials rather than casino-specific performance metrics. This resulted in a limited sample size of 60 firm-year observations (2010–2019). However, three factors mitigate this limitation: (1) these operators collectively represent 100% of the legal market, ensuring complete population coverage; (2) small-sample analyses are well established in gaming research, with comparable studies employing similar observation counts (
Kang et al., 2011); and (3) the dataset’s balanced panel structure (10 years × 6 firms) matches or exceeds the sample sizes used in peer-reviewed regional gaming studies (e.g.,
Phipps et al.’s (
2020) Illinois economic impact analysis). While granular casino-level data would offer additional insights, the available firm-level metrics provide sufficient power to test our hypotheses regarding the effects of diversification.
To address the small sample size (
N = 60), we employed bootstrapping techniques following
Freedman’s (
1981) foundational work. This resampling approach allowed for the generation of 300 synthetic datasets through random draws with replacement from our original observations, effectively creating an expanded sample that was five times larger than the original (
n = 300). We implemented this technique exclusively in our robustness checks, in order to (1) verify the stability of our core findings while (2) deliberately constraining the expansion factor to prevent over-distortion of the underlying data structure. The 300-replication threshold balances computational efficiency with statistical reliability, as established in comparable econometric applications (see, e.g.,
Efron & Tibshirani, 1994).
For the dependent variables, we used three profitability measures commonly applied in financial studies (
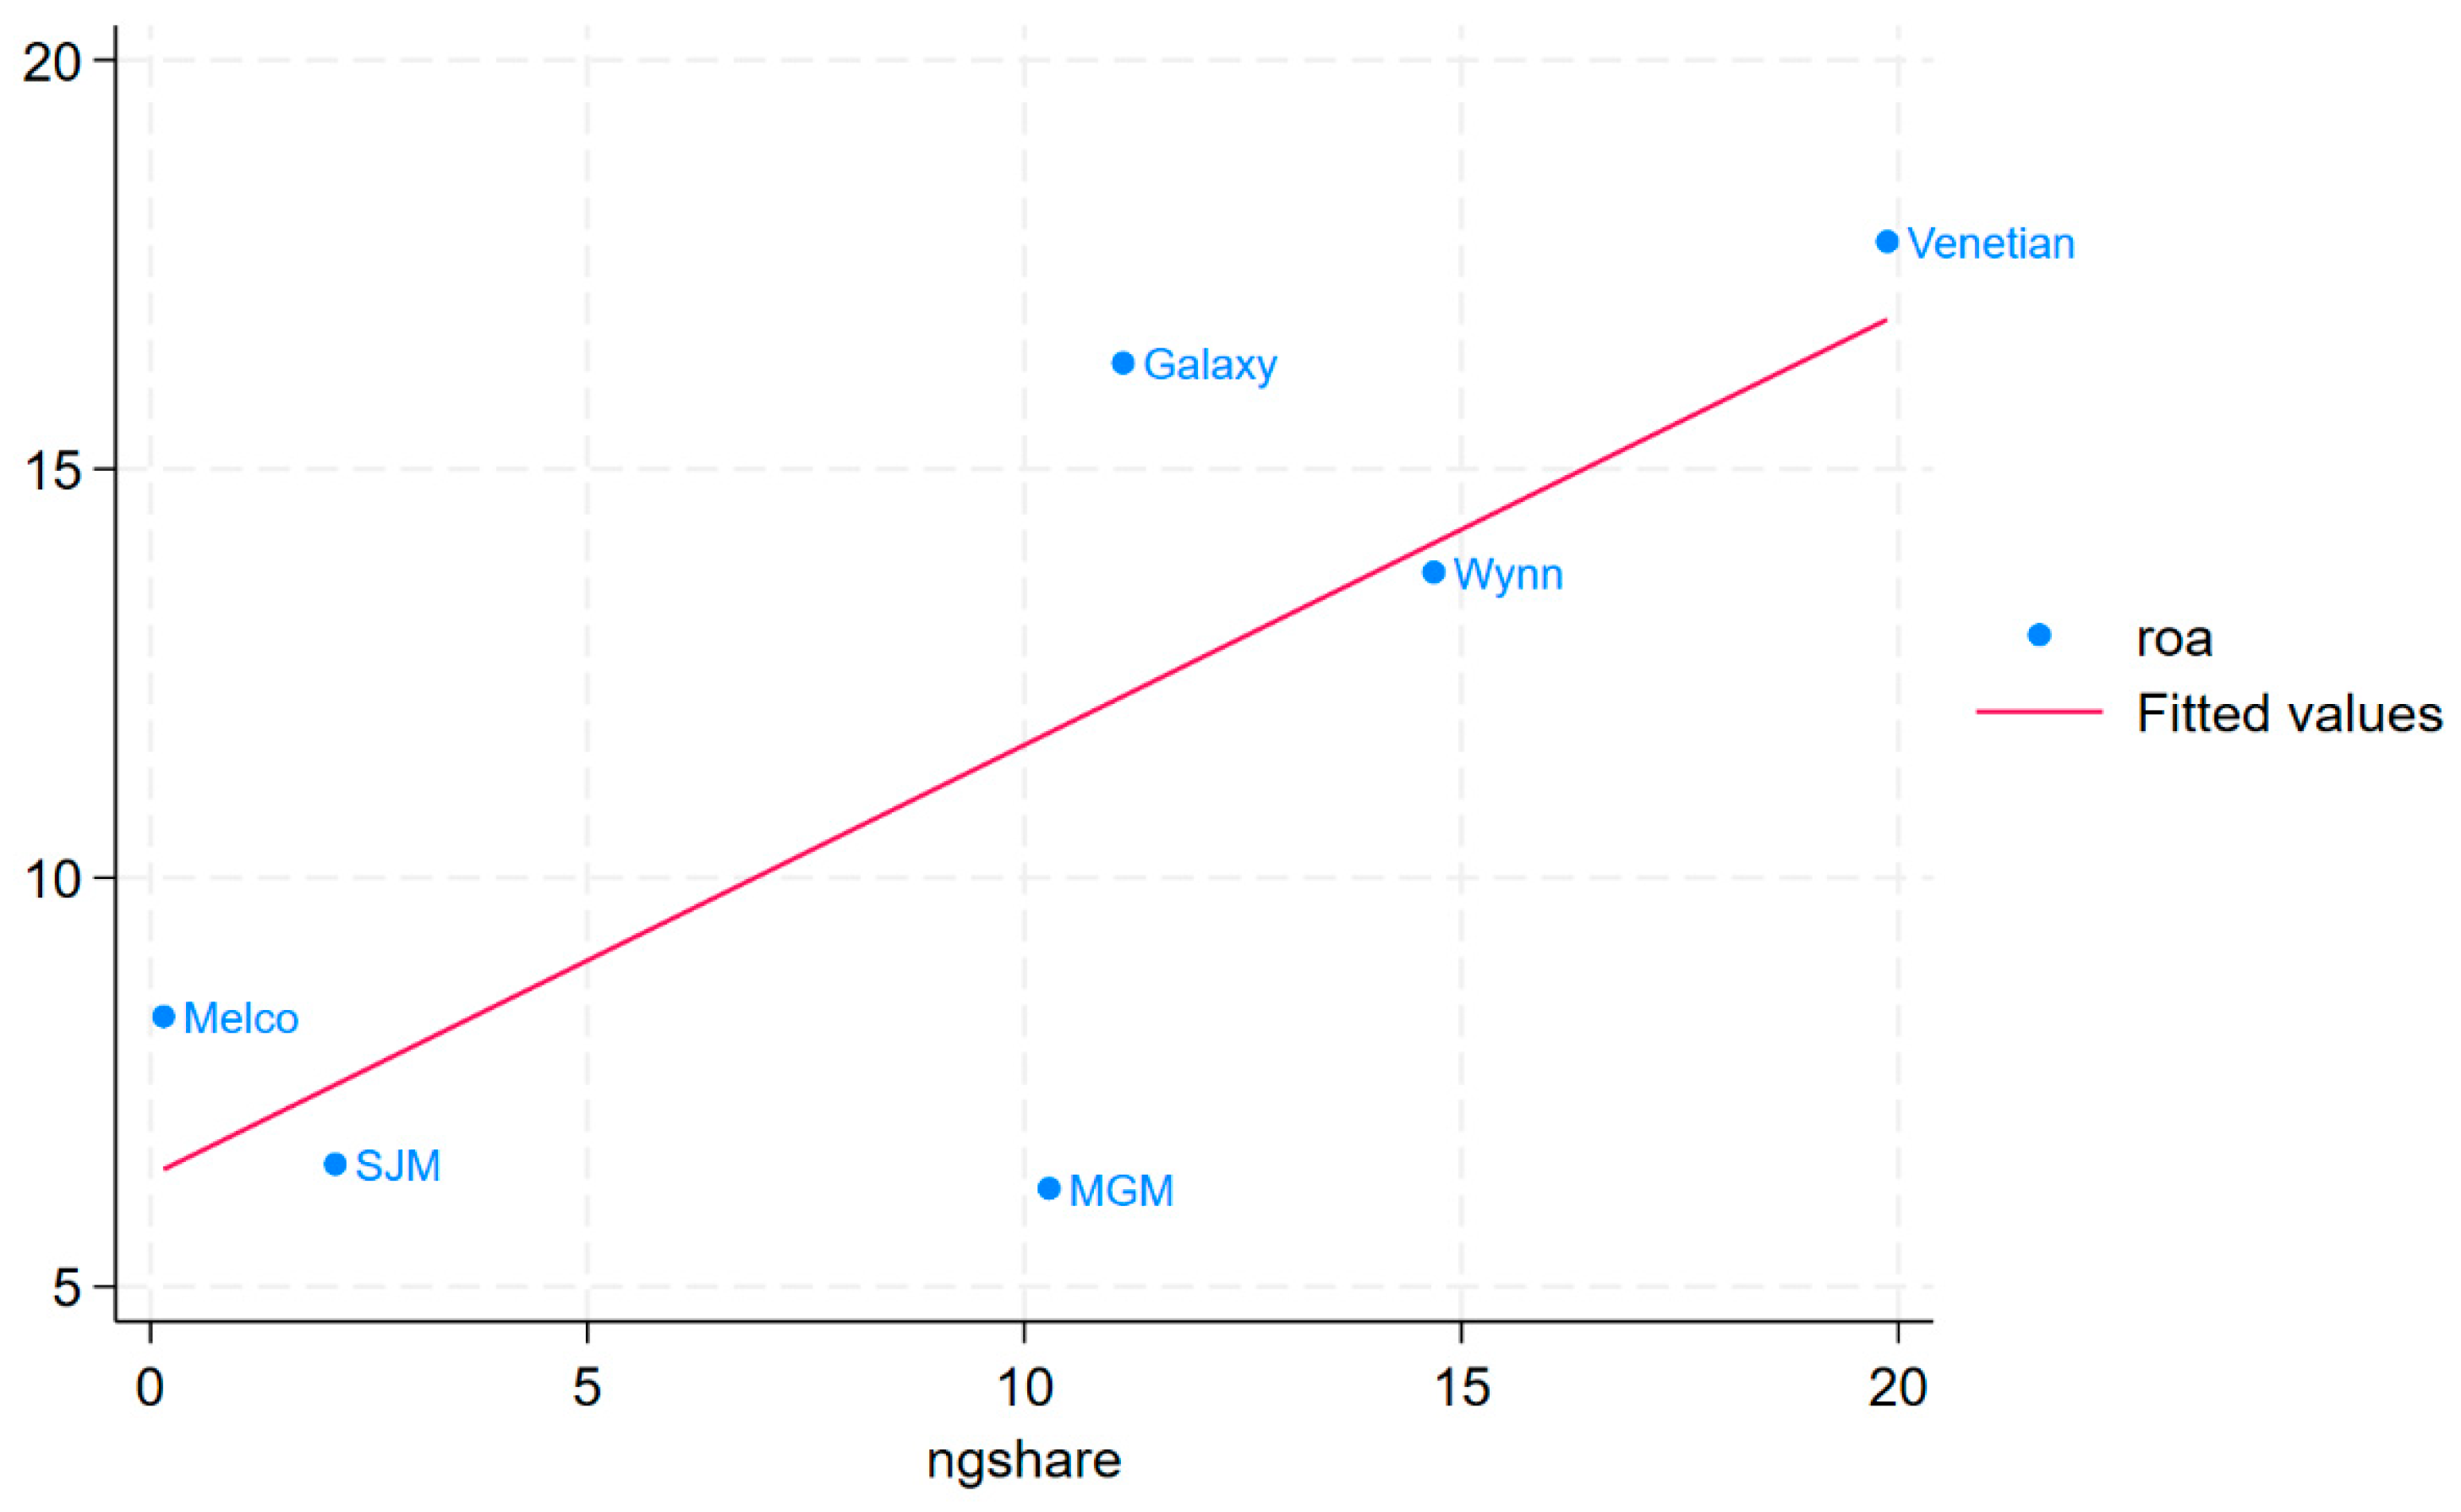
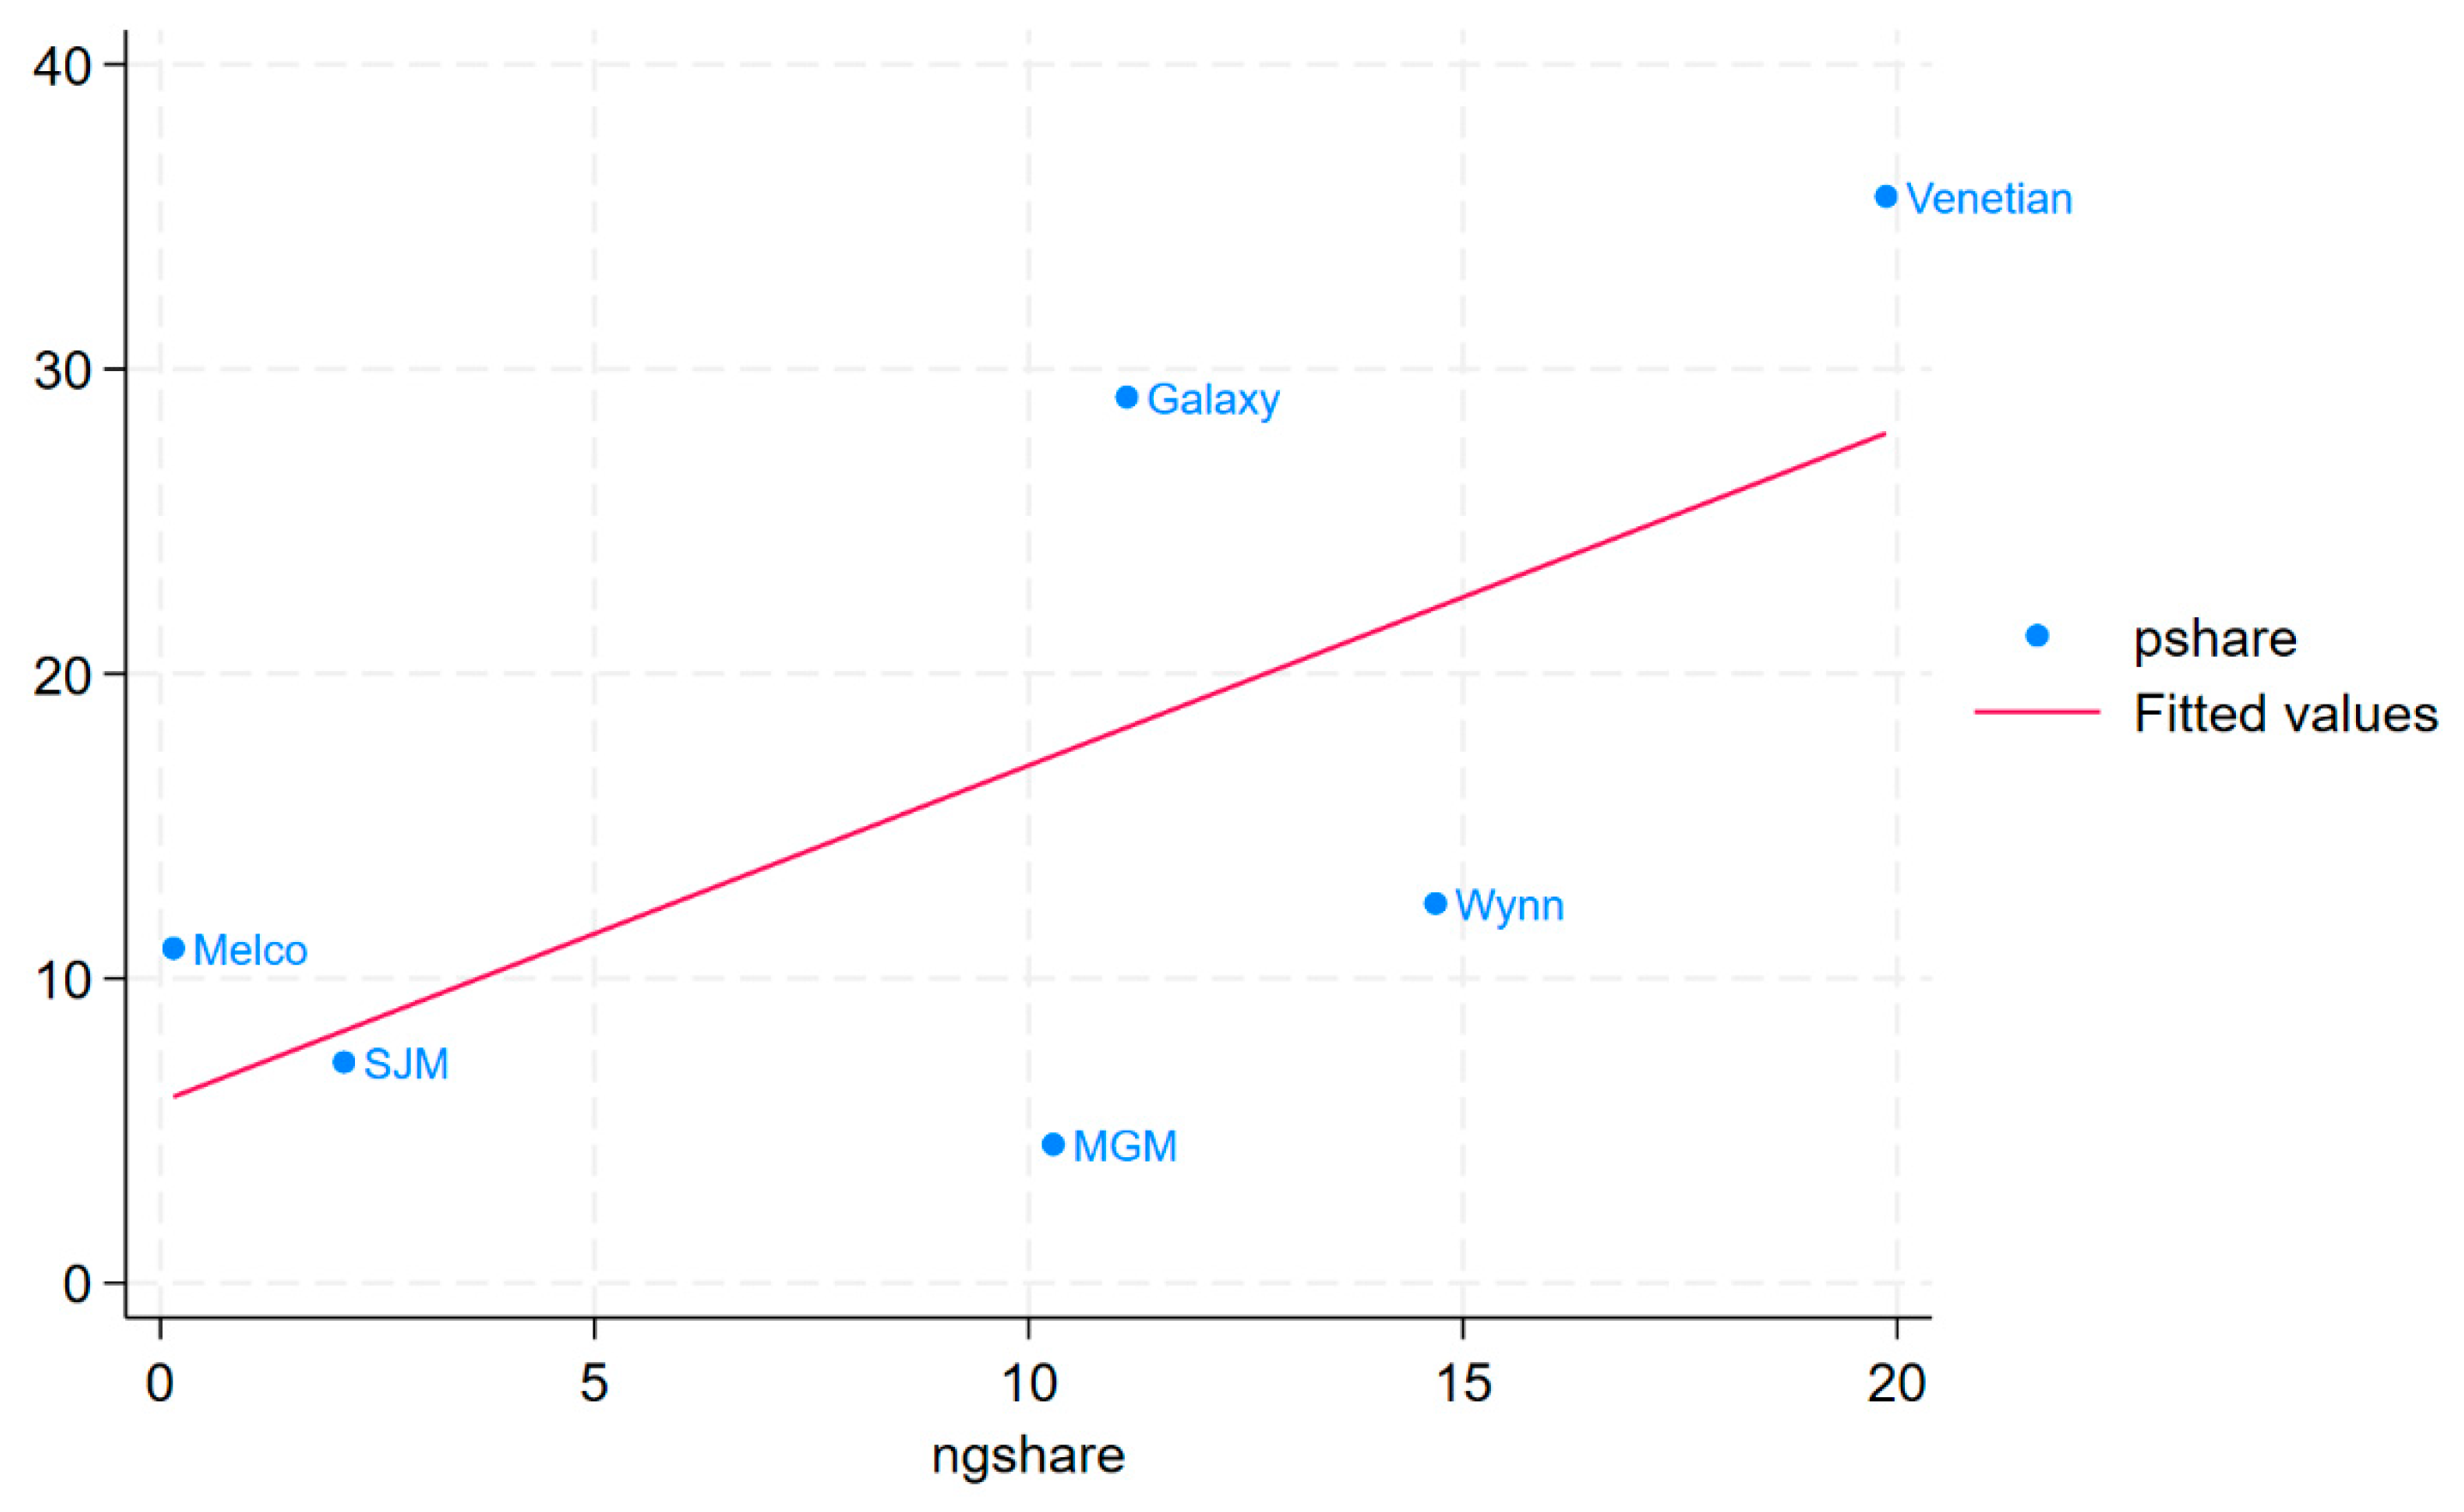
Giroud et al., 2012): net profit margin (NPM), return on assets (ROA), and profit share. We selected all independent and dependent variables as ratios, in order to ensure comparability across companies of different sizes. As these metrics are not directly reported by companies, we calculated them using data from financial statements. NPM and ROA are particularly relevant for gaming companies, as these businesses are asset-intensive and require long cycles to recover the costs of building casinos. Unlike the other two metrics, profit share is not calculated from a single company’s data but, instead, measures a company’s profit as a percentage of the total profit in Macau’s gaming market, with the sum being equal to 100%.
The independent variable of interest is the non-gaming share, calculated as non-gaming revenue divided by the total revenue of the company. This metric encompasses various non-gaming income streams, including hotels, restaurants, shopping malls, conventions, and other revenues. While non-gaming revenue is available from the consolidated financial statements provided on the DICJ website, the specific components of non-gaming revenue are not separately disclosed.
Control variables were used to control for company-specific characteristics as well as temporal trends. The number of casinos refers to how many casinos each company operates, with most companies operating between 2 and 10 casinos. SJM was the company with the most casinos—owning 22 as of 2019—although most are smaller satellite casinos that are fractional compared to its largest property, Grand Lisboa. Age is calculated by subtracting the establishment year from the observation year. All companies except SJM were founded after Macau’s gaming industry liberalization in 2002. The debt-to-equity (D/E) ratio is another control, as companies may take on more debt for large-scale developments, which can lower their return on assets.
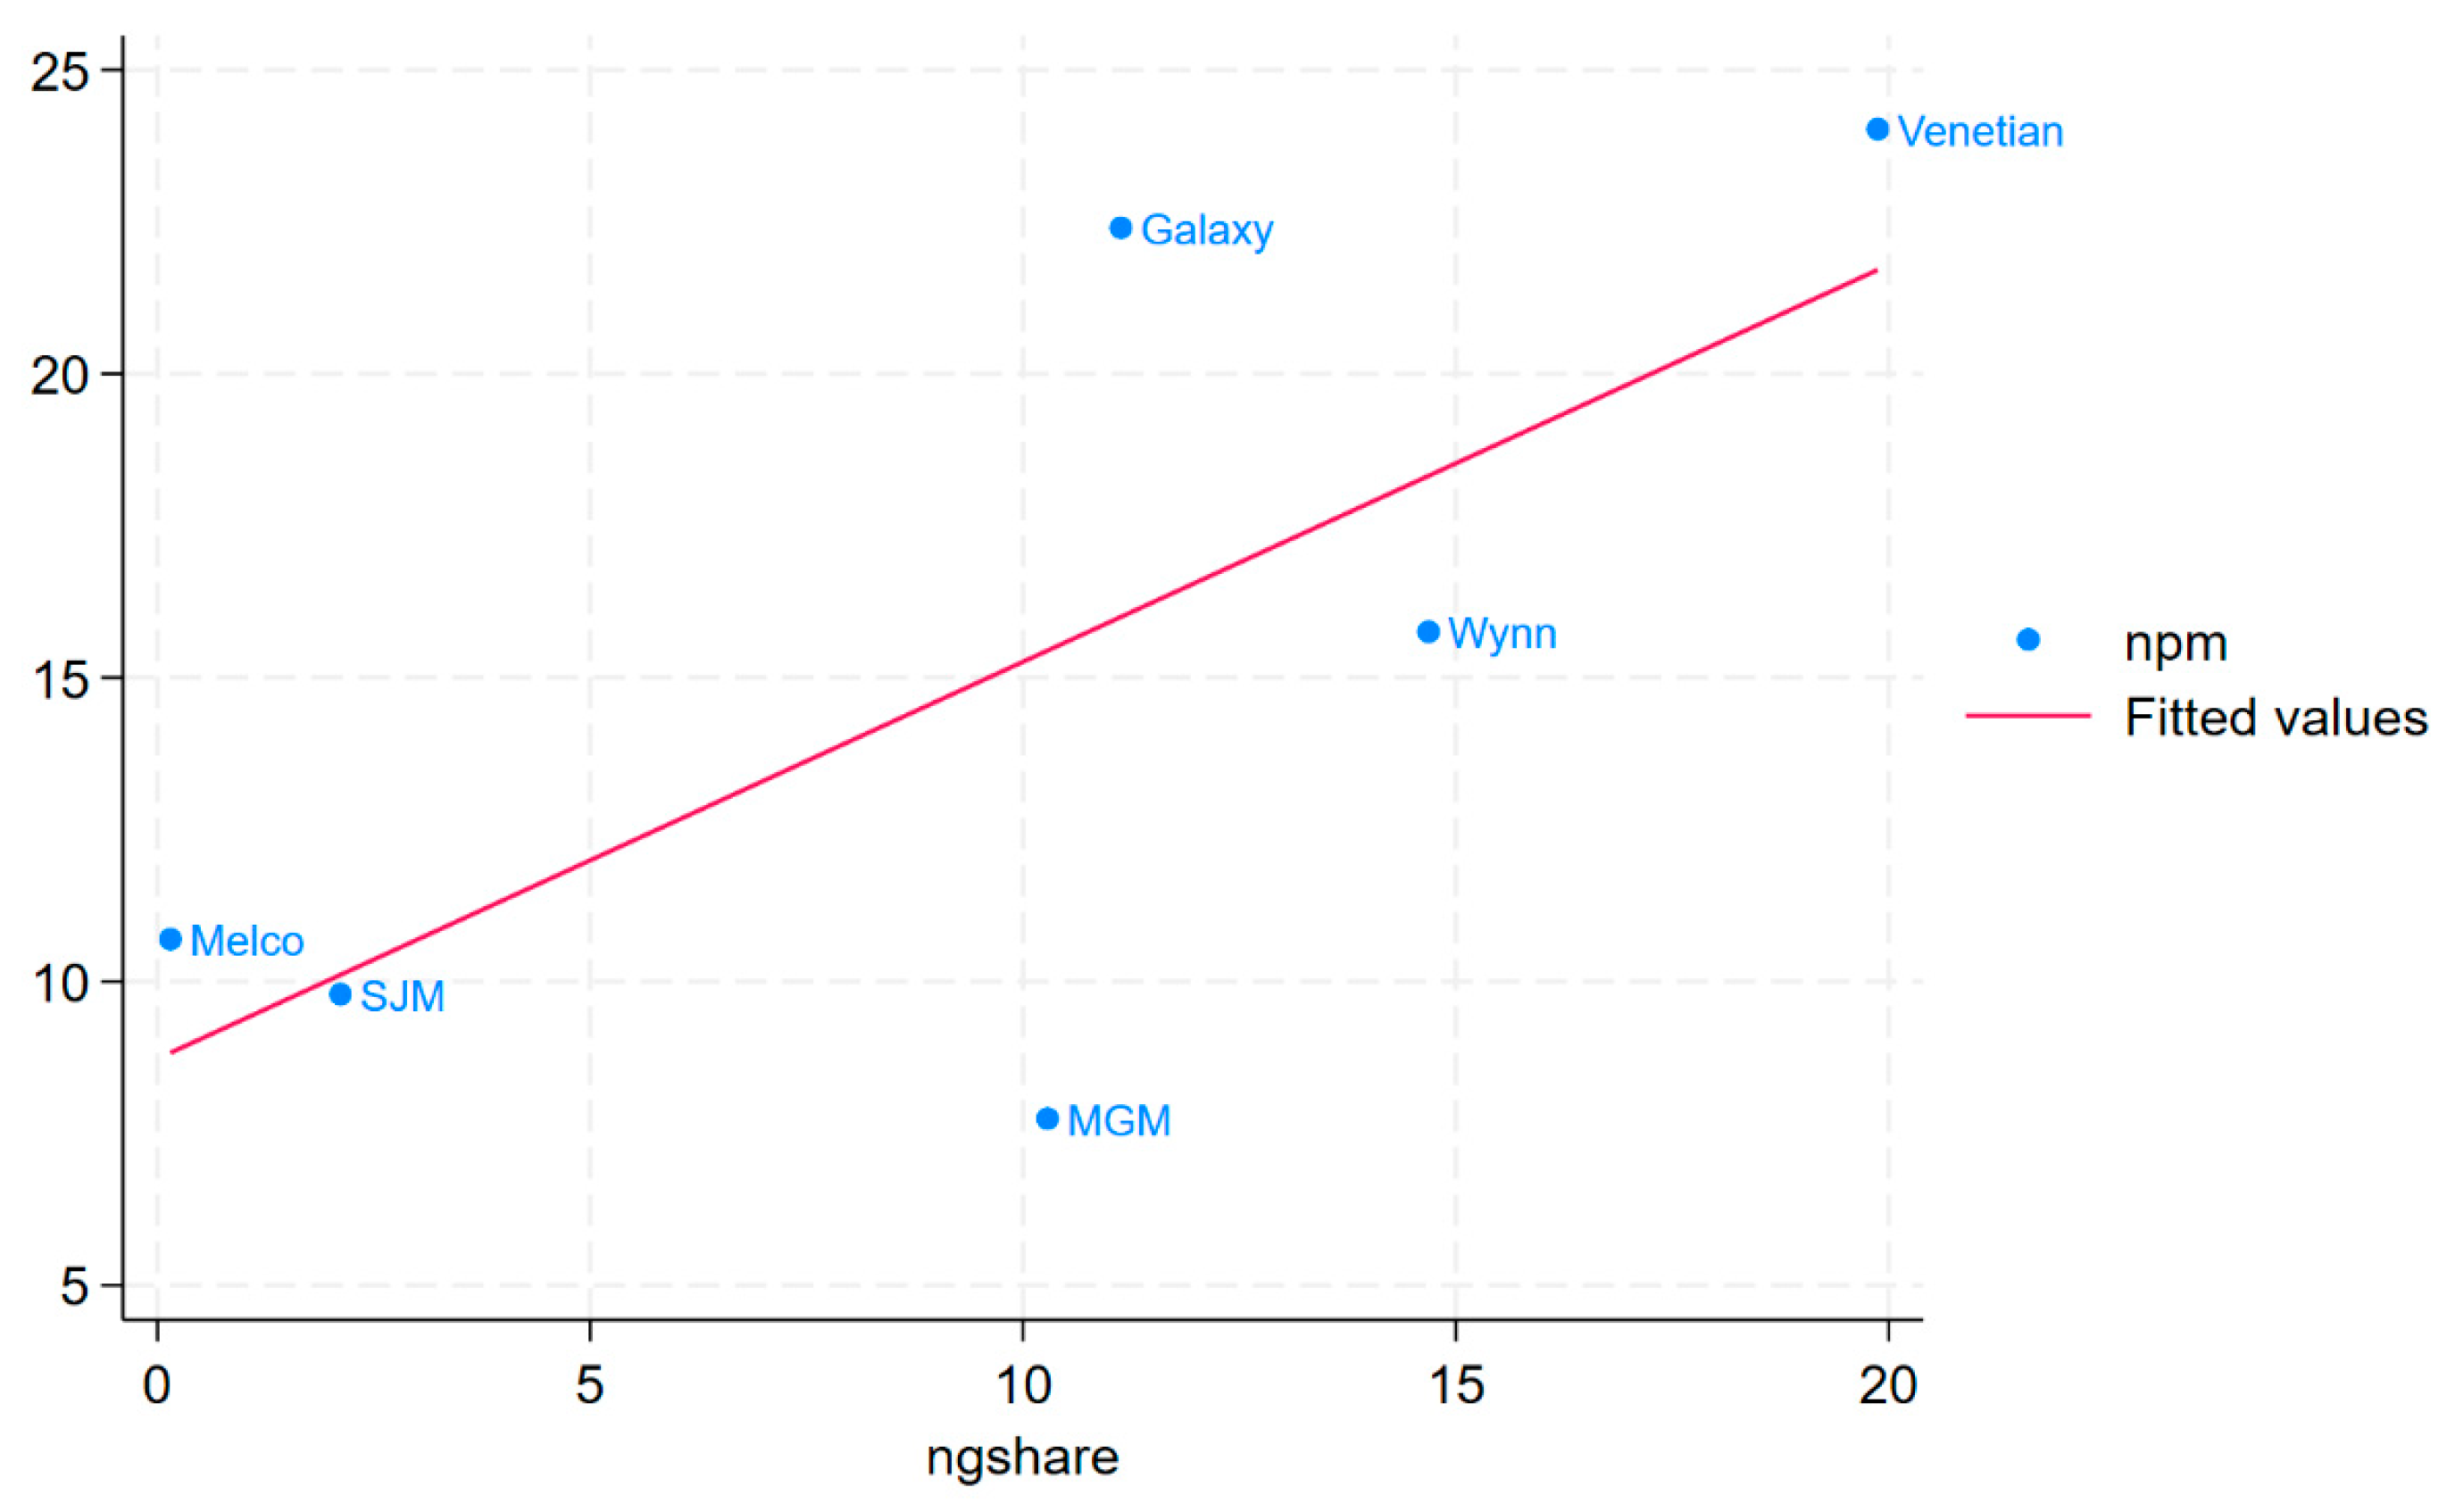
The international status is coded as a binary variable (1 = international). Of Macau’s six licensed operators, The Venetian, Wynn, and MGM represent international firms with Las Vegas headquarters, while SJM, Galaxy, and Melco constitute local companies controlled by Hong Kong and Macau investors. International operators generally maintain greater non-gaming revenue shares than their local counterparts. Although MGM’s chairmanship (held by Pansy Ho, daughter of Stanley Ho) might suggest local affiliation, the company retains its Las Vegas origins, with MGM International maintaining 56% ownership (
MGM China, 2016). Notably, while MGM presented the lowest proportion of non-gaming revenue among the international operators, it still exceeded the shares reported by SJM and Melco.
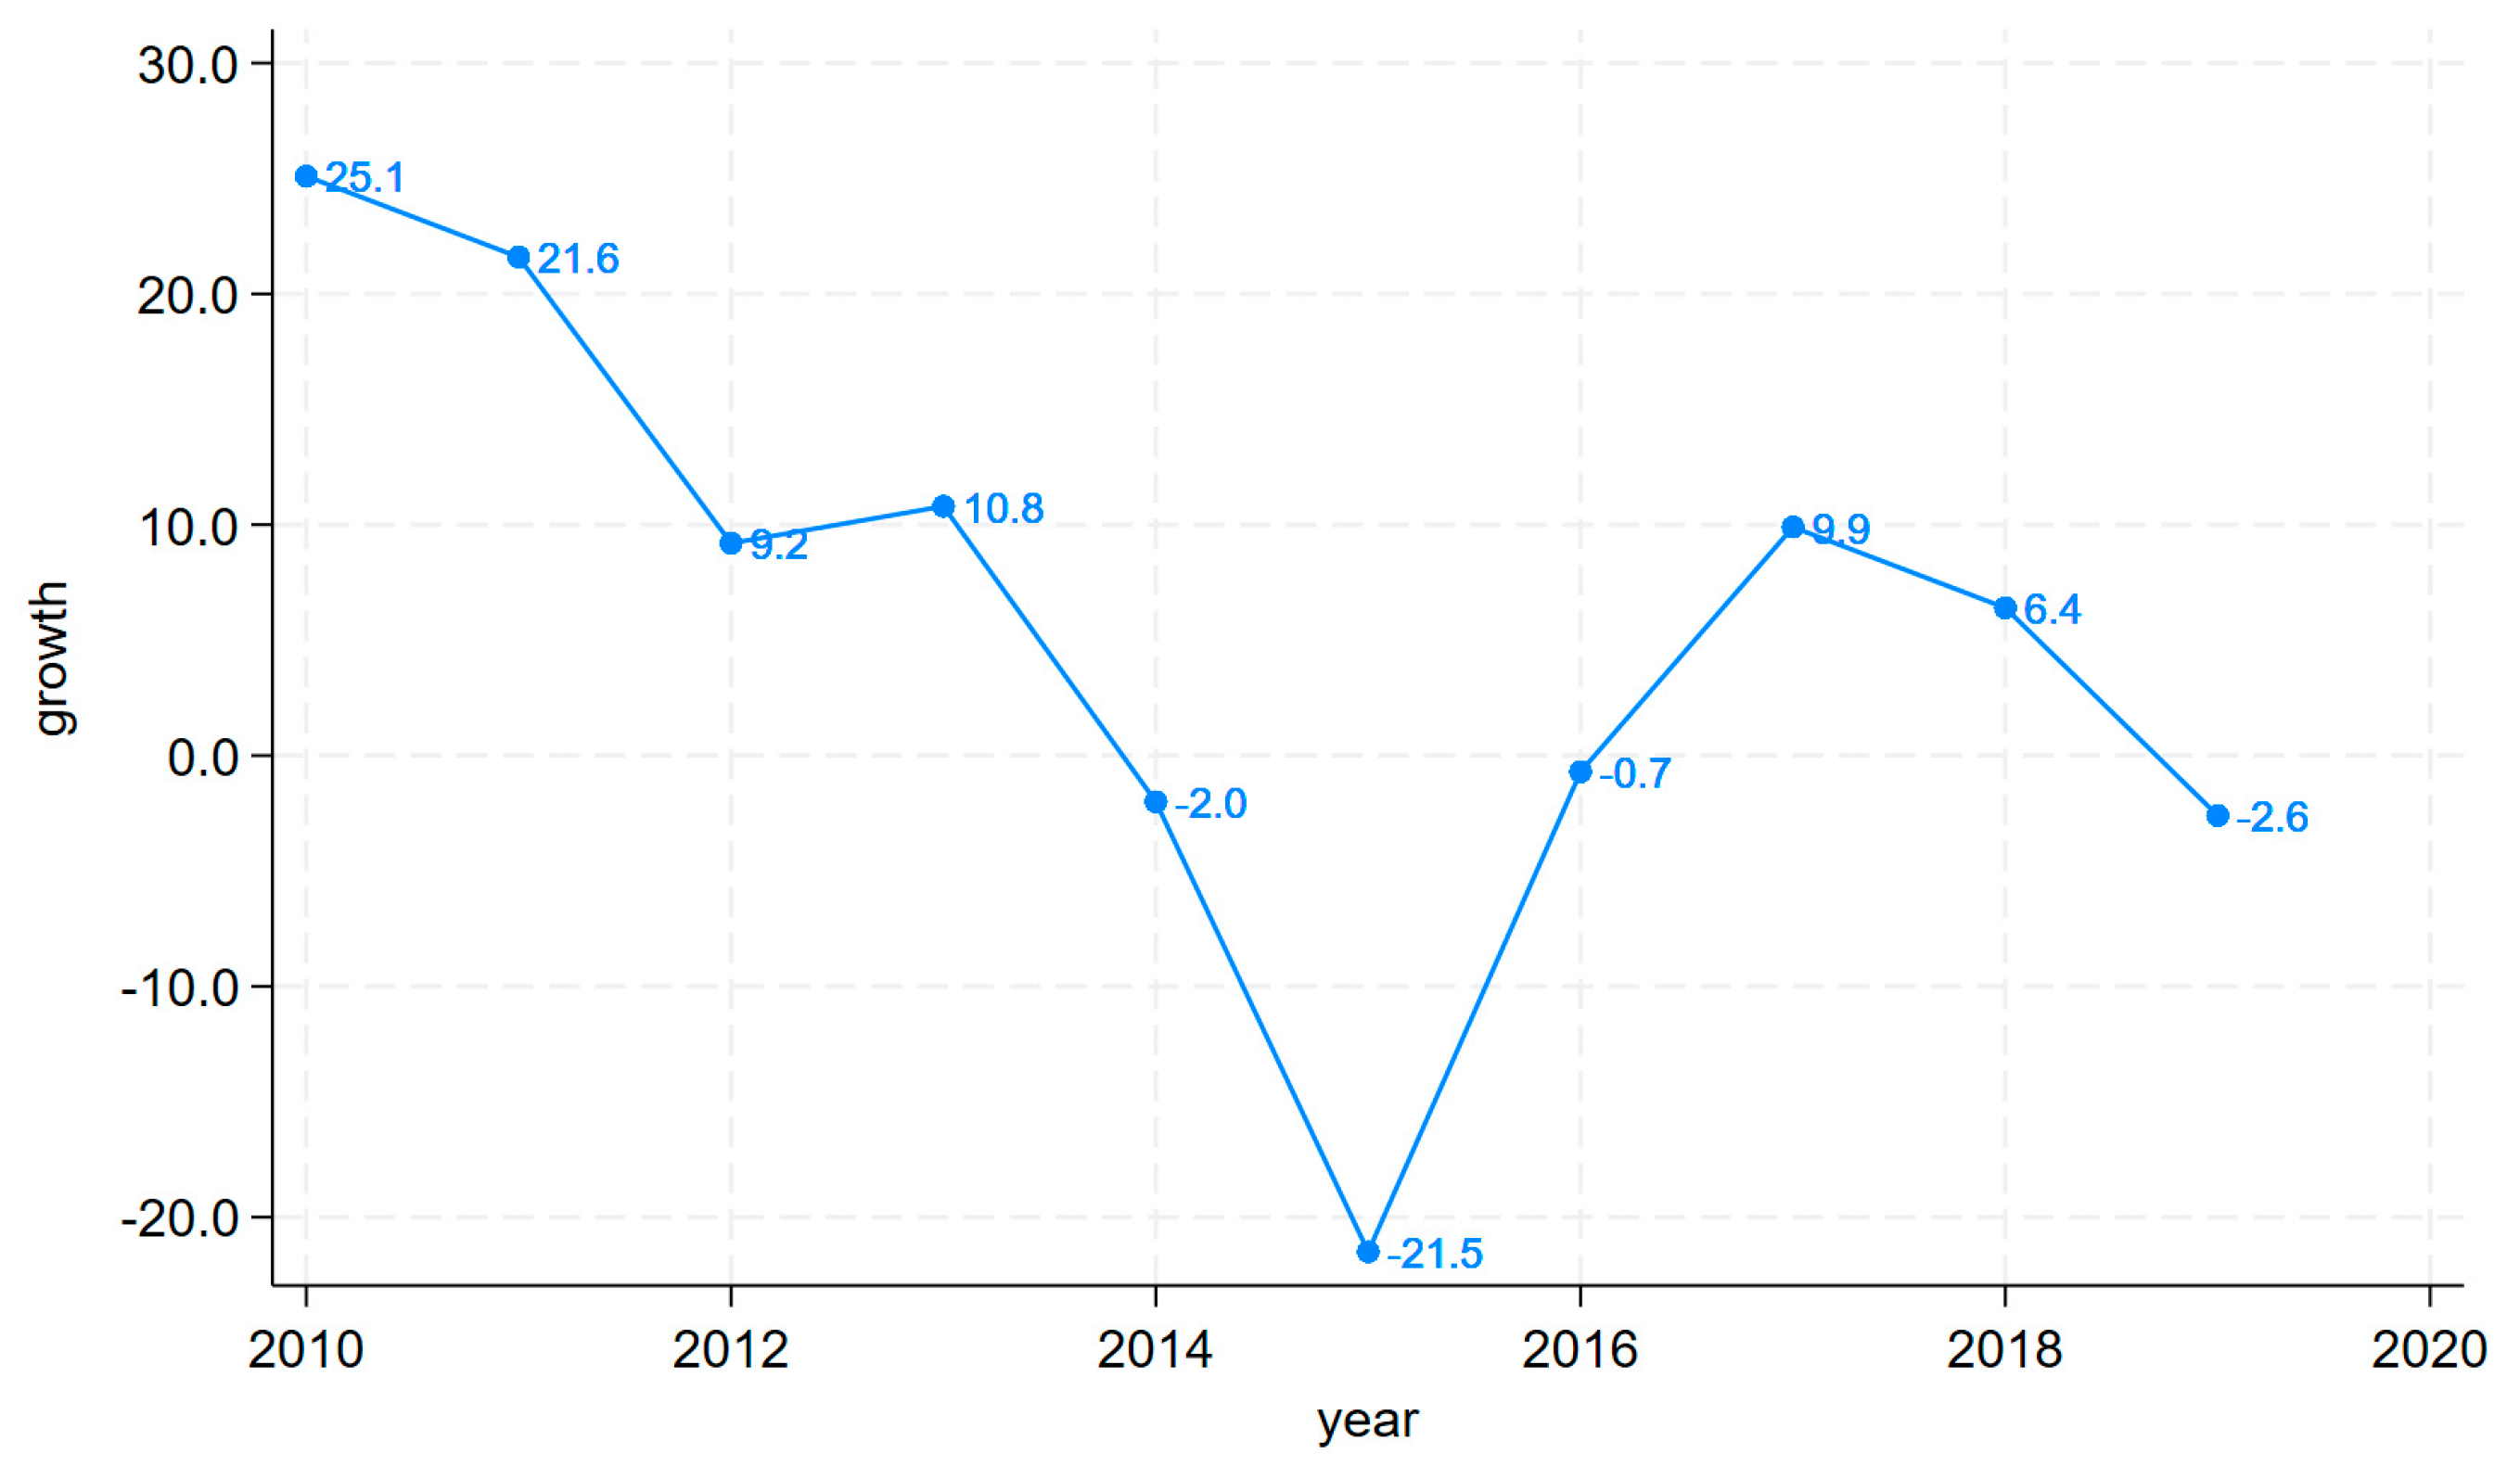
To account for temporal trends, we incorporated Macau’s annual GDP per capita growth rate as a control variable (see
Figure 4). This measure captures broader economic fluctuations that affect the gaming sector. Notably, past shocks—particularly China’s anti-corruption campaign from 2014—have significantly impacted Macau’s gambling revenues (
Chen, 2018;
Zhou et al., 2022b). We opted against annual fixed effects due to our limited sample size, as adding 10 yearly indicators would substantially reduce the degrees of freedom and statistical power. The GDP growth rate serves as an efficient alternative for temporal controls in small-sample studies (
Chen, 2018;
Phipps et al., 2020), balancing model specification with estimation efficiency.
The formulae used to calculate the ratios are given in
Table 1 and the summary statistics are given in
Table 2.
3.2. Identification Strategy
We employed a linear ordinary least squares (OLS) model for our analysis. OLS remains the most straightforward and widely used approach in quantitative research. While existing quantitative studies on Macau have primarily used autoregressive (AR) models with economy-level time-series data (
Zhou et al., 2022b), our manually collected panel dataset makes OLS particularly advantageous. The model provides high interpretability, with the coefficient
representing the percentage point change in the dependent variable (Y) associated with a one-percentage-point increase in the independent variable (X). The specific formula is as follows:
In this equation, represents our outcome variables: NPM, ROA, and profit share. The independent variable of interest is the non-gaming share, which varies across individual firms (i) and time periods (t). The model incorporates firm-level controls that also vary by firm (i) and time (t). The GDP per capita growth rate varies temporally (t). Furthermore, denotes the estimated coefficient of the non-gaming share, while captures the error terms.
Reverse causality concerns are substantially mitigated in our context, due to the physical and operational constraints of casinos. Gaming firms must finalize their development plans before construction, making post-construction modifications to casino floor plans exceptionally difficult. Macau’s casinos represent some of the world’s most capital-intensive and architecturally complex facilities, with designated spaces rigidly allocated for specific uses (
Jaschke & Ötsch, 2003).
We use bootstrapping for robustness checks. Bootstrapping is a powerful method for small sample size research because it allows for the estimation of the sampling distribution of a statistic by resampling with replacement from the original data. This approach does not rely on strict parametric assumptions, making it suitable when theoretical distributions are unreliable due to limited observations. Additionally, bootstrapping provides more robust confidence intervals and standard errors, enhancing the reliability of statistical inferences in small samples.
