Article

From Trust to Triumph: What Drives Tourists to Recommend Thailand’s Hidden Cultural Gems?

by
Mohamed Soliman
1,*,
Tawat Noipom
1,
Muhammadafeefee Assalihee
1,
Arunneewan Buaniew
1 and
Ahmad Albattat
2
1
Faculty of Islamic Sciences, Prince of Songkla University (PSU), Pattani Campus, Songkhla 90110, Thailand
2
School of Global Hospitality and Tourism, Asia Pacific University of Technology and Innovation, Kuala Lumpur 57000, Malaysia
*
Author to whom correspondence should be addressed.
Tour. Hosp. 2025, 6(2), 89; https://doi.org/10.3390/tourhosp6020089
Submission received: 5 April 2025 / Revised: 5 May 2025 / Accepted: 7 May 2025 / Published: 20 May 2025

Abstract

:
This study aims to explore the factors influencing word-of-mouth (WOM) intentions among cultural tourists in Thailand’s southern border provinces. This study develops a comprehensive framework predicting WOM intentions by combining the Stimulus–Organism–Response (S-O-R) model, the theory of planned behavior (TPB), and the cognitive–affective–conative (CAC) model, given the critical role of WOM in tourism marketing. Data were collected from 386 cultural tourists through purposive sampling using a self-administered questionnaire. The study employs structural equation modeling (PLS-SEM) to investigate relationships between trust, attitude, satisfaction, and WOM intentions. The findings reveal that trust, satisfaction, and attitude significantly impact WOM intentions. Social influence strongly predicts trust, while the perceived quality of behavior influences attitude. Satisfaction is driven by perceived value, the quality of the experience, the quality of the physical environment, and tourist engagement. This study contributes to cultural tourism literature by integrating different behavioral theories to provide a robust WOM model. This study’s theoretical contributions and practical implications for scholars, policymakers, tourism marketers, and cultural site operators will be further discussed.

1. Introduction

The tourist sector is fundamental to Thailand’s economy, making substantial contributions to government revenue. In recent years, the World Travel and Tourism Council (WTTC) declared that tourism has constituted roughly 15–20% of Thailand’s GDP, becoming one of the nation’s principal economic drivers (WTTC, 2023). Prior to the COVID-19 epidemic, the Tourism Authority of Thailand (TAT) stated that Thailand attracted approximately 40 million international tourists each year (2019), yielding over 1.9 trillion Thai baht (approximately 60 billion USD) in revenue (TAT, 2023). The Bank of Thailand (BOT) detailed that the business sustains millions of employees, both directly and indirectly, spanning sectors like hotels, transportation, and retail (BOT, 2021). The epidemic precipitated a significant downturn in tourism revenue; nevertheless, the sector is rebounding as foreign travel recommences. The Ministry of Tourism and Sports (MOTS) maintains a focus on tourism by implementing programs such as visa waivers, advertising campaigns, and infrastructural enhancements to draw visitors (MOTS, 2023). Tourism is a dynamic source of income for Thailand, playing a significant role in economic growth and employment (Simasathiansophon et al., 2020). The Tourism Authority of Thailand (TAT) reported that the number of foreign tourists visiting Thailand in 2023 was approximately 30 million people, traveling from China, ASEAN countries, India, the United States, and others, which generated 1.8 trillion baht (TAT, 2023).
One of the most exciting tourism sectors, besides natural tourism, is “cultural tourism”. Cultural tourism is tourism that uses the culture and tradition of each country as a product to differentiate itself from other types of tourism, which adds value to tourist destinations (Choeichuenjit & Sapsanguanboon, 2014). Cultural tourism accounts for the largest market size compared to other tourism sectors. Cultural tourism, as a niche market in the service-intensive tourism industry, has distinctive characteristics, experiences, and different individual consequences (Nanggong & Mohammad, 2024). Regarding the global level, the cultural tourism market is valued at approximately USD 900.00 billion, and it is expected to grow by 15% per year from 2014 to 2024, worth USD 3641.00 billion. Hence, it can be concluded that cultural tourism is more attractive due to the substantial global market and high growth rates (UNESCO, 2023). Cultural tourism in Thailand includes historical and religious sites, traditional festivals, local arts and crafts, cultural villages, and experiences. The Thai government has set many initiatives to promote cultural tourism through campaigns like “Amazing Thailand”, which highlights the country’s cultural diversity and heritage (TAT, 2023). Kasamsuk et al. (2018) define cultural tourism’s identity as architectural (chapels, pagodas, and walls), artistic (drawings in temples depicting Buddha’s life and teachings), sculptural (Buddha, angels, and gods), historical (references to Buddha’s life and teachings), and ritual and religious (i.e., Thai traditional dancing during Buddha days). Cultural tourism is important for many reasons, including economic and social benefits, identity creation and reinforcement, image construction, and cultural and historical preservation. It allows peaceful and understanding collaboration (Simasathiansophon et al., 2020).
Word of mouth (WOM) refers to informal communication among individuals who have experienced goods or services, sharing their evaluations (C. C. Li, 2024). WOM involves the transmission of opinions from one consumer to another, serving as a critical phase in the consumer decision-making process that persuades individuals to utilize specific products or services. This communication effectively penetrates the target audience, conveying credible messages that have been shown to influence behaviors and attitudes across various settings, including offices, homes, schools, blogs, and social networking sites (SNSs), wherever consumer discussions occur (Jalilvand et al., 2017). Baloglu and McCleary (1999) assert that WOM exerts a more favorable influence on a customer’s perceived image compared to professional advice, advertisements, and media sources such as books, movies, and news. Research has shown that word of mouth influences 76 percent of all purchasing decisions. Approximately 3.4 billion word-of-mouth conversations occur daily, with 2.3 billion focused on brands (Balter, 2008). Prior studies have sought to elucidate the impact of word of mouth on consumer behavior. Jalilvand and Samiei (2012) demonstrated that word-of-mouth communication can have a positive influence on tourists’ destination choices.
Furthermore, cultural tourism in Thailand significantly influences the decisions of both domestic and international tourists to visit. Cultural tourism destinations typically encompass historical sites, including chapels, pagodas, and walls, as well as museums or galleries, art performance events, and distinctive local lifestyles (Kasamsuk et al., 2018). However, Thai tourism exhibits a lower competitiveness relative to countries such as Japan, China, Myanmar, India, Cambodia, South Korea, and Vietnam. The primary concern is the insufficient organization and data integration of Thai culture among the relevant institutions (Simasathiansophon et al., 2020). Research by Rasoolimanesh et al. (2019) and Alrawadieh et al. (2019) indicates a positive correlation between tourist engagement and both destination loyalty and intentions to revisit. Although existing studies emphasize the important role of engagement in influencing tourist experiences and, in turn, tourism’s development at a destination, the impact of tourism engagement on the behavioral intentions of cultural tourists remains insufficiently explored in the current literature. Likewise, the effects of satisfaction, attitude, and trust on the behavioral intentions of cultural tourists have not adequately been addressed in the extant literature. Therefore, this study aims to address that gap by proposing a model that would depict the specific factors influencing culture tourists’ WOM.
Overall, the literature on cultural tourism is also somewhat limited. Moreover, the previous studies did not go into enough depth to explain tourism culture, especially on the uptake of their behavior preferences. This conclusion underscores the necessity for additional investigation to enhance our comprehension of cultural tourists’ experiences and participation, as well as to further elucidate word-of-mouth dynamics within the cultural tourism context. Consequently, this study examines the impact of many elements on behavioral intentions, specifically focusing on word-of-mouth (WOM) intention, by integrating the Stimulus–Organism–Response (S-O-R) framework, the cognitive–affective–conative model, and the theory of planned behavior (TPB). This study contributes to the existing literature on cultural tourism by creating a comprehensive depiction of the behavioral intentions of cultural tourists. The findings of the present study can aid cultural sites’ marketers and operators in formulating effective marketing strategies for tourism destinations by fostering or enhancing tourist engagement that encourages subsequent behavioral intentions. Hence, the research question that guides this study is, “What are the significant factors that can impact the word-of-mouth intention of cultural tourists?”

2. Literature Review

Word of Mouth (WOM), originating from marketing, is defined as verbal, interpersonal communication regarding a product or service (Lai et al., 2020). Similarly, Jalilvand et al. (2017) defined word of mouth (WOM) as informal communication occurring between consumers and individuals interested in products or services. WOM communication has emerged as a crucial concept in modern marketing (Kankhuni & Ngwira, 2021) due to consumers’ growing resistance to traditional advertising and other marketing communications. Positive word of mouth reflects customer loyalty and enhances the probability of purchasing the company’s products (Zhong et al., 2024). Previous studies suggest that word of mouth significantly impacts tourists’ behaviors and consumption choices (Jalilvand et al., 2017). The WOM concept is grounded in cognitive, emotive, and interactionist perspectives (Taheri et al., 2021). In the marketing literature, consumer engagement has long been thought to indicate the likelihood of WOM intention (S. Chen et al., 2021).
Zhong et al. (2024) explored the incentive needs influencing positive word of mouth (PWOM) among international travelers and analyzed the variation in these needs in relation to individualism and collectivist cultural orientations. Nanggong and Mohammad (2024) examined the essential elements of cultural tourism experiences to predict tourist behaviors, aiming to improve electronic word of mouth (e-WOM) and impact cultural destinations’ image. C. C. Li (2024) analyzed the determinants influencing visitors’ travel choices amid the COVID-19 pandemic. This research analyzed additional factors influencing travel plans, such as perceived risks, awareness, and interpersonal communication. Karim et al. (2024) identified factors affecting passengers’ behavioral intentions regarding beach resorts in Bangladesh. This study examines the moderating effects of the experience and satisfaction a destination offers on the relationship between destination service variables and travelers’ behavioral intentions. Arifah et al. (2024) examined the effect of AR, source credibility, information needs, and the quantity of e-WOM information on information’s usefulness and the effect of information’s usefulness on visiting intentions among TikTok social media users who are looking for information about tourist attractions in the Thousand Islands in Canada. Mathew et al. (2024) found that tourism destination development and visitor satisfaction are significantly enhanced by responsible tourism practices. This study is an effort to comprehend how responsible tourism practices affect visitor satisfaction, re-visit intention, and word of mouth.
Silaban et al. (2023) showed how e-WOM on Instagram affected travel behavior in Indonesia. The necessity for information is the main driver influencing the value of that information. Additionally, the credibility of sources and the quality of their arguments are essential in improving the practical value of information. Guo et al. (2022) examined the key variables influencing the use of automated buses and the intention to engage in word-of-mouth communication in Stockholm, Sweden. Users’ needs and travel demands significantly influence intentions to adopt a new public travel mode and to recommend the service to others. Stylidis and Quintero (2022) found that a place’s image influenced residents’ perceptions of economic, socio-cultural, and environmental impacts, whereas knowledge of tourism affected only the economic impacts. Furthermore, the placement of images and support for tourism influenced residents’ word-of-mouth intentions in Spain. Taheri et al. (2021) established a framework for WOM, identifying tourism factors, quality of service, and perceived value as significant antecedents influencing WOM referrals.
In order to evaluate the impact of e-WOM and personality traits on the decision to visit a certain Vietnamese tourist attraction, Tapanainen et al. (2021) used the Big Five personality traits and the Information Adoption Model (IAM). The results demonstrated that the attributes of agreeableness, extraversion, and imagination—which are components of personality—influenced the adoption of information about tourist locations. Research by Rasoolimanesh et al. (2021) examined word of mouth (WOM) as a result of visitor engagement, finding that a higher level of engagement significantly affects WOM intention. According to Teng (2021), tourists’ involvement was boosted by film tourism experiences, which had a beneficial impact on their behavioral intentions. In order to understand why park visitors binge-eat at Yanchep National Park in Australia, Esfandiar et al. (2021) used a combination of the norm activation model and the theory of planned behavior (TPB). It became clear from this that visitors’ binging behavior is primarily driven by their personal conventions. Hence, park officials should emphasize the importance of visitors’ prominent personal standards. The impact of tourist interaction dimensions on domestic heritage visitors’ intent to return to Kashan, Iran, and spread the word was studied by Seyfi et al. (2021). With the use of Instagram posts made by overland travelers to African places, Kankhuni and Ngwira (2021) studied the relationship between engagement, perceptions of soundscapes, satisfaction, MTEs, and e-WOM. Lai et al. (2020) examined the relationship between perceived trust, membership, and e-WOM intention for sports events. M. Ali et al. (2020) developed a framework for tourist satisfaction, loyalty, and WOM to select local foods in Pakistan.
N. C. Chen et al. (2018) conducted an empirical study in Shanghai, China, and Sydney, Australia, to motivate residents to communicate with potential tourists by investigating local residents’ positive word-of-mouth behavior about their destination region. Jalilvand et al. (2017) examined the antecedents that may influence tourists’ WOM about restaurants in Tehran, Iran. They found that the quality of the food, quality of personal interactions, quality of the physical environment quality, and perceived value influence WOM behavior. Using data collected from domestic visitors to Japanese heritage sites, Bryce et al. (2015) investigated the connections between cultural uniqueness, perception of authenticity, engagement, and the resulting behavioral implications. C.-F. Chen and Chen (2010) found that relationships between the quality of experiences, perceived value, satisfaction, and behavioral intentions appear to be evident in heritage tourism.
Kornsuphkit et al. (2024) investigated the antecedents the intention of revisiting of Thai cultural tourists in Thailand. They revealed that travel motivation, novelty seeking, the destination’s image, and memorable experiences positively affect the satisfaction, WOM, and revisit intentions of Thai cultural tourists in Thailand. Jaipong (2024) determined the relationship between social influence, electronic word of mouth (E-WOM), previous experience, and tour service purchase intentions among Thai tourists abroad. Wang (2024) investigated the influence of Chinese tourists’ data, tourist behavior, and information sources on Chinese tourists’ satisfaction with travel in Thailand. Punpairoj et al. (2023) identified the motivational factors that encourage travelers to adopt augmented reality (AR) applications when exploring tourism destinations and investigated the mediating effects of personal word of mouth (WOM) on the relationships between innovativeness and revisit intention outcomes among Thai travelers. Namahoot et al. (2023) proposed a model that examined innovativeness (i.e., service innovation and technology innovation) to use AR as the mediating role of attitude and word of mouth (WOM) in Thailand’s tourism industry. Cheunkamon et al. (2022) found that the factors of commitment, satisfaction, and trust directly impacted tourist loyalty to traveling via the domestic public transport system. Factors with a significant indirect impact on tourist loyalty are the service quality of tourism logistics and tourism supply chains. Khadiza and Tapachai (2022) found a significant direct relationship between Thai tourists’ attitudes, subjective norms, and perceived behavioral control with their travel intention to Bangladesh and a significant indirect relationship between the destination’s image and intention. Cheunkamon et al. (2020) found that satisfaction, attitudes, subjective norms, and perception can be used to control behavior, with a positive direct effect on domestic tourists’ intentions to use social media for travel planning. Simasathiansophon et al. (2020) indicated that personal factors (i.e., age and career) and tourist behaviors (i.e., provincial destinations, frequency of traveling, the reason for traveling, and accompaniers) affected the tourist’s decision to visit cultural attraction places in the central part of Thailand. Miao (2015) showed that e-WOM significantly affected Chinese tourists’ behavioral intention toward visiting Thailand by affecting their attitude, subjective norms, and perceived behavioral control.
To sum up, there is a lack of research in the literature that investigates what variables impact the WOM intention of cultural tourists visiting Thailand’s southern border provinces (i.e., Pattani, Yala, Narathiwat). As a last point, the literature does not reveal how to investigate WOM intention by combining the Stimulus–Organism–Response (S-O-R) theory, the theory of planned behavior (TPB), and the cognitive–affective–conative (CAC) model. This research adds to the literature by incorporating these three theories to predict WOM intention among travelers. That is to say, the increasing WOM intention among cultural tourists requires extensive research. In particular, studies focusing on the factors that significantly affect cultural tourists’ WOM intention can be used to increase the travel rate to Southern Thailand successfully. Accordingly, this research sets out to address such knowledge gaps.

2.1. Theoretical Background

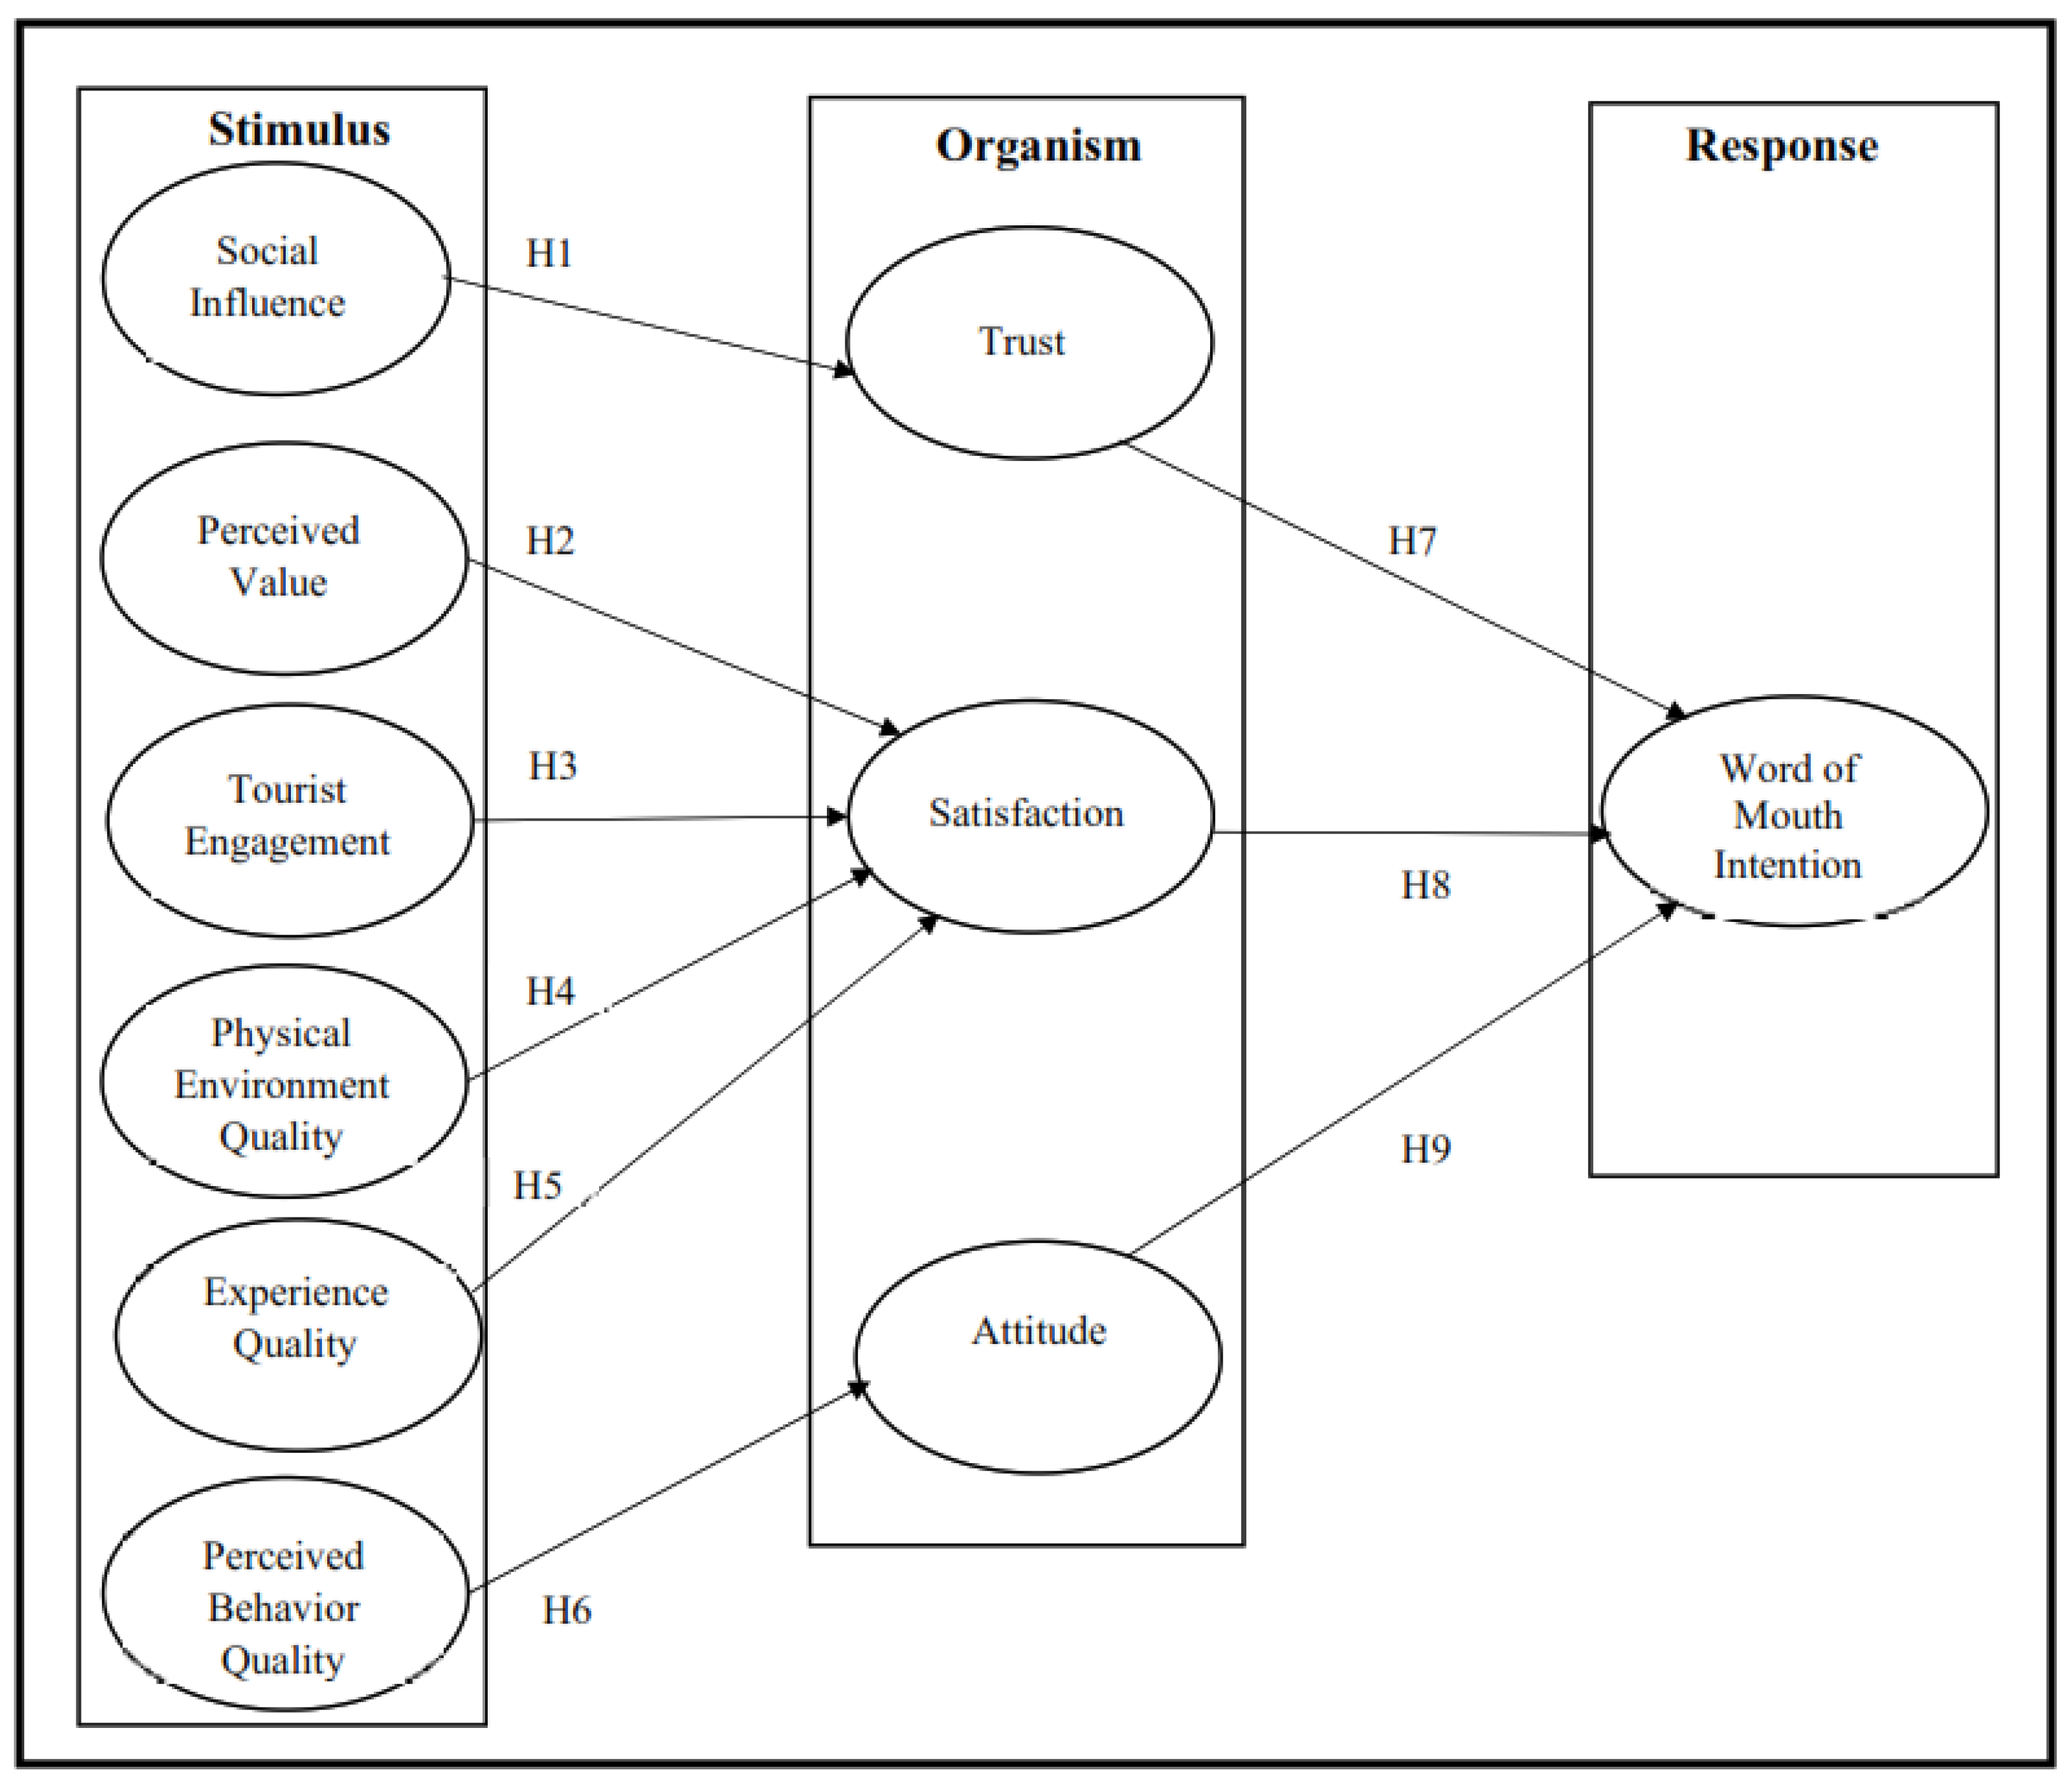
Based on the premise that people act rationally, the Stimulus–Organism–Response (S-O-R) theory evolved from the input–output model. In the classical S-O-R model, the stimulus is the external factor that has an effect on the individual’s internal states; in other words, it is an influence that stimulates the individual (Eroglu et al., 2001). On the other hand, the organism is the internal process or structure that mediates the relationship between the external stimulus and the person’s actions, reactions, or responses. Activities, including perception, physiology, emotion, and cognition, make up these intermediate processes and structures (Bagozzi, 1986). Customers may choose to approach or avoid a product or service in the end, and the reaction in the S-O-R model stands in for the results (Robert & John, 1982). According to this study, the S-O-R model may be able to explain people’s reactions. It prioritizes aspects related to the events occurring within the organism (see Figure 1). Although the S-O-R theory has changed and become much more adaptable over the years, it was originally primarily applied to in-site retail activity when it first emerged (Eroglu et al., 2001). Recent studies have employed SOR theory in the tourism and hospitality context (Jiang et al., 2024; H. Liu et al., 2024; H. Qiu et al., 2023; Qiuai et al., 2024). For example, Jiang et al. (2024) combined the S-O-R and experience economy theories to discover factors prompting users’ continuous intentions in cultural heritage virtual tourism. H. Liu et al. (2024) developed an integrative model based on the S-O-R framework to investigate destination loyalty.
The theory of planned behavior (TPB) states that the strongest predictor of action is whether a person intends to pursue a goal. Attitude, subjective norms, and perceived behavioral control affect behavior intention (Ajzen, 1991). This theory holds that a character’s power of intention drives their actions. This hypothesis is used to research people’s behavior. Critics like M. Ali et al. (2018b) say users’ action patterns depend on circumstances and demographics. He suggested that the TPB model needs empirical evidence and extensions to be broadly implemented. Pratiwi (2018) discovered that customer attitude and perceived behavior control strongly influence behavioral intentions but subjective norms do not. Based on earlier studies, scientists advised against interpreting the TPB model’s components too quickly. These results depend on the TPB model’s biased behavior intention determinants, and it is unclear how they connect to consumers’ behavior processes. This research updates the TPB model’s determinants by adding culture tourism-relevant components to the prior findings. Applying TPB to culture tourism explains WOM’s intention more fully. One shortcoming of TPB is that it only evaluates cognitive processes and not the individual’s needs or motivations before acting. Recent studies have adopted the TPB theory in the culture tourism context (Tamuliene et al., 2024; Zhang & Ran, 2024).
Furthermore, the cognitive–affective–conative (CAC) model utilizes cognitive, affective, and conative processes. It zeroes in on the connection between conative elements like WOM and cognitive factors like tourist engagement. Thus, Fishbein’s (1967) cognitive–affective–conative paradigm for explaining attitude serves as the conceptual framework for this study. Several prior research studies have employed this model to examine user engagement, behavioral intention, and word-of-mouth communications (Harrigan et al., 2017; Su et al., 2020). Agapito et al. (2013) validated that a conative image is the outcome of a cognitive image by testing and confirming the hierarchical nature of the interaction between the cognitive, affective, and conative components in the destination’s image. In the context of historical tourism, Fu (2019) looked into how cognitive loyalty affected conative loyalty. Also, according to Harrigan et al. (2017) and Koenig-Lewis et al. (2021), the outcome variable of consumer engagement is behavioral intention. Budiatmo and Listyorini (2025) investigated how a person’s perception of a place affects their likelihood of returning there. The behavior of visitors toward returning and recommending was studied by Yang et al. (2022).
In sum, the current research assumes that integrating two or more models could provide even more robustness than those models standing alone (Gillenson & Sherrell, 2002; Sigala et al., 2000). Viewing a discipline from multiple lenses, conceptual frameworks, or theories is argued to be pertinent as it could create valuable insights (Shook et al., 2009). Each model addresses a distinct component of behavioral intentions, where S-O-R captures environmental stimuli, TPB explains cognitive evaluations, and CAC accounts for emotional and conative dimensions. This integration reduces the conceptual overlap. Each model’s boundaries reflect that its effectiveness may vary by context, such as between cultural and mass tourism, and that it focuses on pre-behavioral intentions rather than actual behaviors. Recent studies by Jiang et al. (2024) and Zhang and Ran (2024) demonstrate the relevance of combining these models in tourism research. Hence, the literature reviewed lacks knowledge about the integrated S-O-R, TPB, and cognitive–affective–conative model to examine culture tourists’ WOM intention. In light of the current research, this study adds to it by suggesting a model that combines the S-O-R, TPB, and CAC theories to predict individuals’ WOM intention in the culture tourism setting.

2.2. Conceptual Framework and Hypotheses Development

By combining the S-O-R, TPB, and cognitive–affective–conative models, this study builds the research model. An individual’s mental drive to act is what drives WOM’s intention. A method for forecasting how likely culture tourists are to express their WOM intentions is based on their current availability to do so. Figure 1 portrays the proposed research framework.

2.3. Hypotheses Development

Social influence is the effect on travelers’ impressions and choices of recommendations and opinions from friends, relatives, and social networks. Seeing and copying the actions of their social groups helps people to build trust (Boto-García & Baños-Pino, 2022). Developing trust in a place depends very much on social influence. For visitors, trust is essential, since it lowers the apparent risk and uncertainty, thus increasing their likelihood of visiting and recommending the place. Recent research has repeatedly shown that trust is much influenced by social influence (Jalilvand et al., 2017; Lai et al., 2020; Seger-Guttmann & Gilboa, 2023). For example, Jalilvand et al. (2017) discovered that trust in the restaurant sector is influenced by social influence, implying that suggestions from social networks are vital in determining how guests view and make judgments. In a similar vein, Lai et al. (2020) underlined how trust in cultural tourism is mainly driven by social influence. Thus, the following hypothesis is put forward:
H1. 
Social influence positively influences trust.
Traveler satisfaction is significantly influenced by perceived value. Those who value their trip experiences highly are more likely to be happy, since they believe the advantages exceed the expenses. Recent studies repeatedly underline how important perceived value is in raising satisfaction (D. Chen, 2023; Lee et al., 2016; N. Qiu et al., 2024). In cultural tourism, for instance, C.-F. Chen and Chen (2010) revealed that perceived value significantly affects satisfaction, implying that visitors are more content when they believe they are getting good value for money. Comparably, Wu and Li (2017) underlined that in cultural tourism, contentment is mostly driven by perceived value. Consequently, the following theory is put forward:
H2. 
Perceived value has a significant positive influence on satisfaction.
The engagement of tourists in cultural events and interactions with the local population is known as tourist engagement (Seyfi et al., 2021). Because they feel more linked to the location, engaged visitors are more likely to be happy with their trip (Teng, 2021). Recent studies have repeatedly underlined the need for visitor participation in improving satisfaction (Patterson et al., 2006; Rasoolimanesh et al., 2019; Zhou & Yu, 2022). For instance, Patterson et al. (2006) discovered that in cultural tourism, tourist involvement greatly affects satisfaction, implying that active participation in cultural events improves tourists’ emotional and cognitive reactions. In historical tourism, similarly, Rasoolimanesh et al. (2019) underlined that a major factor influencing satisfaction is visitor involvement. Consequently, the following theory is put forward:
H3. 
Tourist engagement positively impacts satisfaction.
The physical surroundings of a destination, including its facilities, cleanliness, and beauty, are known as the quality of its physical environment. Clean and aesthetically appealing surroundings improve the whole experience and increase the likelihood of visitor satisfaction. A physical environment’s quality clearly influences satisfaction, according to recent studies (F. Ali et al., 2016; Fang et al., 2024; Jalilvand et al., 2017; Renganathan et al., 2024). For example, Jalilvand et al. (2017) discovered that satisfaction in the restaurant sector is much influenced by the quality of the physical environment, implying that it shapes visitors’ impressions and experiences. In line with this finding, Fang et al. (2024) underlined how well-maintained physical surroundings improve the whole travel experience. Consequently, the following theory is suggested:
H4. 
The quality of the physical environment has a significant positive impact on satisfaction.
Determining tourist satisfaction mainly relies on the quality of their experience. Excellent experiences marked by enjoyable and memorable activities help to shape a good assessment of the trip. Recent studies have repeatedly shown how the quality of experience shapes pleasure (Domínguez-Quintero et al., 2020; Hsieh & Chuang, 2020). For instance, as it directly affects tourists’ emotional and cognitive reactions, González-Rodríguez et al. (2020) showed that quality of experience greatly affects satisfaction in cultural tourism. Analogously, Hsieh and Chuang (2020) underlined that since it directly affects tourists’ emotional and cognitive reactions, quality of experience is a major factor determining satisfaction in cultural tourism. Thus, the following hypothesis is put forward:
H5. 
The quality of the experience has a significant positive impact on satisfaction.
The perceived quality of behavior—that of local residents and service providers—plays a major influence on visitors’ impressions of a place. Positive interactions, helpfulness, and friendliness help to create a good attitude that can improve general satisfaction and a chance to recommend the place (Pandža Bajs, 2015). Recent research repeatedly reveals that attitudes and satisfaction are much influenced by the perceived quality of behavior (Karim et al., 2024; Yasa et al., 2022). For example, Lee et al. (2016) observed that in cultural tourism, visitors’ opinions and satisfaction are influenced by the perceived quality of behavior. Likewise, Nam et al. (2016) underlined how perceived behavior of a good quality results in more positive sentiments, thereby impacting the customer decision-making process. Consequently, the following theory is put forward:
H6. 
The perceived quality of behavior positively influences attitude.
WOM activity is highly influenced by trust. Those who trust a place are more likely to share good experiences and suggest it to others. Recent studies repeatedly reveal that WOM behavior is much influenced by trust (Jalilvand et al., 2017; Lai et al., 2020; J. Liu et al., 2019). For example, Jalilvand et al. (2017) revealed that WOM behavior is much influenced by trust, implying that visitors who trust a location are more likely to propose it. In line with this finding, J. Liu et al. (2019) underlined that good WOM suggestions are driven mainly by trust. Thus, the following hypothesis is put forward:
H7. 
Trust has a significant positive impact on WOM.
WOM behavior is strongly influenced by satisfaction. Satisfied visitors are more likely to tell others about their good experiences and suggest the location (Rasoolimanesh et al., 2022). Recent studies repeatedly show how important pleasure is in influencing WOM behavior (Hossain et al., 2024; Ng et al., 2023). For instance, research by Santos and Meléndez (2016) indicates that WOM behavior in cultural tourism is much influenced by pleasure, implying that happy visitors are more likely to propose a location to others. Comparatively, Jalilvand et al. (2017) underlined that good WOM suggestions mostly depend on satisfaction. Thus, the following hypothesis is put forward:
H8. 
Satisfaction has a significant positive impact on WOM.
As the theory of planned behavior (Ajzen, 1991) suggests, attitude is a major driver of behavioral intentions. Positive WOM recommendations most certainly follow from a good attitude about a destination. Attitude clearly affects WOM behavior in travel environments, according to recent studies (Hasan et al., 2023; Porras-Bueno et al., 2023). For example, Kamata (2022) discovered that those who have positive opinions of a location are more likely to suggest it to others. Comparably, Shome (2021) underlined that WOM conduct is shaped in part by attitude. Positive opinions of a place or service inspire visitors to share their experiences with others (Rasoolimanesh et al., 2021). Consequently, the hypothesis that follows is put forward:
H9. 
Attitude has a significant positive impact on WOM.

3. Research Methodology

The research setting was in Thailand’s southern border provinces (i.e., Pattani, Yala, Narathiwat). Culturally integrated tourism is being promoted across the three southern border provinces as part of the government’s smart city “Triangle of Stability, Prosperity, and Sustainability” plan (SOUTH, 2017). In addition, the three southern border provinces have many cultural and ecotourism places worth visiting for their historical and cultural importance and outstanding natural beauty (Miao, 2015). Thais in the south are cosmopolitan and have their own culture. The government wants to boost cultural and ecotourism in the Thai South to highlight its distinctive charms. One example is Narathiwat’s Tak Bai district’s historic Buddhist shrine, also known as “Wat Phithak Phaen Din Thai”. Murals depicting the local culture and lifestyle and beautiful Southern Thai Buddhist buildings are there. The Lim Ko Neaw Goddess Shrine and Krue Se (Kersih) Mosque are two of Pattani’s many attractions. Visitors go to Yala’s Wat Khuha Phimuk cave temple, which includes an ancient reclining Buddha. The Betong district is known for its tourist attractions. In Yala, Aiyoe Weng’s sea of clouds is a new attraction (SOUTH, 2017).

3.1. Sampling Technique, Size, and Data Collection

This study adheres to ethical principles, including voluntary participation, informed approval, confidentiality, and privacy. The unit of analysis was cultural tourists of Thailand’s southern border provinces, since they represent the sample frame best. Data for the current research came from a survey that was administered in 2024; it followed a quantitative research method. A purposive sample method was used to pick the participants. This study adopted the self-administered questionnaire technique to collect the data. With this technique, the respondents could read the survey questions and record their honest answers freely, minimizing the tendency for social desirability bias to occur (Sekaran & Bougie, 2020). The minimum sample size was obtained using the G*Power tool (Faul et al., 2009). A medium effect size of 0.15, an error type of 0.05, a power of 0.95, and nine predictors are all part of the G*Power parameters. Because of this, the researchers concluded that 166 cases were the bare minimum for a representative sample. Only 398 questionnaires were successfully collected out of the 500 distributed. However, 12 of them were useless due to being unfilled (i.e., large sections of the questionnaire’s items were incomplete or had a repetitive number on all Likert scale items). To conclude, the ultimate usable sample was 386 responses, giving a response rate of 77.2 percent. Next, each variable’s missing data were analyzed. Data screening showed fewer than 5% missing data. Howell (2007) stated that missing data of up to 10% may not affect the interpretation of the findings. This study used IBM SPSS’s Expectation–Maximization (EM) algorithm to resolve missing data. Structural equation modeling was used with SmartPLS 4.0 software (Ringle et al., 2022) to analyze the direct and indirect interactions between the research variables. Descriptive data were also analyzed using IBM SPSS 26.

3.2. Variables Instruments

A thorough literature review informed this research’s instrument’s combination of validated measurements. The validated measures were slightly changed to fit the research population. Four academics from the tourism and hospitality disciplines and one tourist guide pre-tested the first study instrument. This was to verify the preliminary scales’ reliability and validity and check unidimensional ideas (Cooper & Schindler, 2003). The questionnaire items underwent testing in a pilot study to assess the scale’s reliability, employing the Cronbach alpha statistic. The results demonstrated that all the items exhibited reliability, as their values exceeded the threshold of 0.70 (Tavakol & Dennick, 2011). The initial portion of the survey was designed to gather demographic information from the participants. In Section 2, we measured the conceptual model’s constructs. We used a “7-point Likert scale” to quantify these variables. Items to measure PV, quality of physical environment, trust, satisfaction, and WOM were adopted from Jalilvand et al. (2017). The items used to assess quality of experience were taken from the works of C.-F. Chen and Chen (2010). We used items from Esfandiar et al. (2021) to measure social influence, perceived behavioral control, and attitude. Teng (2021) was referred to for the items of tourist engagement. Additionally, we selected three items adapted from Lin et al. (2015) as a marker variable that would be collected in the same survey, but they were not included in the model being tested: (1) “once I have come to a conclusion, I am not likely to change my mind”; (2) “I do not change my mind easily”; and (3) “my views are very consistent over time”.

3.3. Data Analysis

Using SmartPLS 4.0 and partial least squares (PLS) analysis, this study assessed the suggested research framework (Ringle et al., 2022). Analytical methods were classified by Anderson and Gerbing (1988) into two categories: testing postulated relationships and outer model assessment. Numerous recent studies models (Alam et al., 2022; Cortez et al., 2024; Guillén et al., 2022; Jaboob et al., 2024; Sitar-Taut & Mican, 2021) have made use of PLS-SEM for analyzing research models. The primary advantage of PLS-SEM is this discovery. In order to come up with theories, PLS-SEM examines causal–predictive model linkages (Chin et al., 2020). According to Y. Liu et al. (2022), maximizing the variation in a target construct makes it more predictable. According to Becker et al. (2023), Sharma et al. (2022), and Sarstedt et al. (2022), their approach outperforms factor-based SEM in terms of statistical power and successfully bridges the explanation–prediction gap. Scores for all indicators can be examined using ordinary least squares regressions (J. Hair & Alamer, 2022). For these reasons, PLS stands out as the ideal approach for this research.

3.4. Common-Method Variance (CMV)

PLS-SEM analysis does not consider CMV to be a major concern. The importance of CMV in PLS analysis is a matter of debate (F. Ali et al., 2018a; Ghasemy et al., 2020). According to Kock (2015), the VIF values of the inner model are less than 3.3, which means that the current model is free of CMV. At several levels, starting with study design and data collecting, it is possible to reduce the effects of CMV that arise from similarities in data-gathering procedures. This research looks at the statistical and procedural fixes made before and after data collection. So, following the work of Rönkkö and Ylitalo (2011), we used a marker variable approach to investigate the CMV problem. The PLS marker model and the baseline model are compared in this work (Miller & Simmering, 2023). With R2 values below 10%, we find small changes in word of mouth (2.7%), satisfaction (0.4%), trust (9.6%), and attitude (7.9%). It follows that CMV poses little threat to this study’s methodology (Soliman et al., 2024).

3.5. Profile of Respondents

Table 1 describes most respondents as males (53.1 percent), and the most common category is ages between 36 and 45 years old. Likewise, local tourists are dominant (52.8 percent). The touristic places mostly came from Pattani province (55.7 percent). Most tourists obtained their information about the destinations to visit from their families and friends (51%), then from social media (47.7%). They came to Southern Thailand with their families (56%) and friends (31%).

4. Research Findings

4.1. Measurement Model Assessment

J. Hair and Alamer (2022) and Shmueli et al. (2019) emphasize the necessity of evaluating the outer models in the process of developing the proposed model. The outer model, as detailed in Table 2, is evaluated using the average variance extracted (AVE), discriminant validity, composite reliability (CR), and factor loading metrics. PBQ.1, PBQ.3, PEnQ.4, T_Eng.6, and T_Eng.14 with low loadings were subsequently dropped to obtain a better AVE. They were removed due to low loadings and their overlap with other items capturing similar aspects of service provider interactions, ensuring the construct’s unidimensionality. These exclusions did not compromise the conceptual scope of the constructs, as the remaining items adequately captured the intended dimensions (e.g., tourist engagement’s multifaceted nature) (J. F. Hair et al., 2019). The AVE must be greater than 0.5, which will reflect at least 50% of the items, and the CR must be greater than 0.7 (J. F. Hair et al., 2019). However, other low loadings were kept, since their values were between 0.40 and 0.708. They can be retained once the measures of AVE and CR have already met the thresholds (J. Hair & Alamer, 2022).

4.2. Discriminant Validity

Table 3 displays discriminant measures using the HTMT procedure. To evaluate discriminant validity, the approach proposed by Henseler et al. (2015) was utilized. The discriminant validity was assessed in this study utilizing the methodology proposed by Ramayah et al. (2017). The HTMT values are below 0.90, indicating that discriminant validity is not an issue, as stated by Gold et al. (2001).

5. Structural Model Assessment

The analysis of the internal model constitutes the subsequent phase. This research examines the inner model through assessments of multicollinearity, R2, PLSpredict, path coefficients, and model fit metrics (J. Hair & Alamer, 2022).

5.1. Multicollinearity Test (VIF)

Prior to conducting the assessment, it is crucial to validate the inner model to ensure that collinearity does not undermine the integrity of the regression results (J. F. Hair et al., 2019). The partial regression scores of the latent variables linked to the predictor constructs produce a variance inflation factor (VIF). Multicollinearity arises when correlated predictors produce redundant information. Value was determined through the use of VIF. A low value of VIF suggests that the variables exhibit a minimal correlation with one another. A VIF value that is less than 3.3 is deemed acceptable (Kock, 2015). All VIF values are below 3.3 according to the research model. This signifies that multicollinearity is not present in the research model.

5.2. Coefficient of Determination (R2)

The impact level for R2 may range from 0 to 1. Cohen (1988) classified R2 values for endogenous variables as follows: 0.26 is considered substantial, 0.13 is regarded as fairly strong (moderate), and 0.02 is identified as weak. Table 4 shows a substantial level of predictive accuracy for trust, satisfaction, and WOM, while there is a moderate predictive accuracy for attitude. Together, PV, tourist engagement, quality of physical environment, and quality of experience explained 49.9% of the variation in satisfaction. A total of 37.7 percent of the variance in trust was reported by the social influence predictor. Likewise, 20.5 percent of the variance in perceived behavior control was accounted for by the attitude predictor. Finally, 58.4% of the variation in WOM was explained by trust, attitude, and satisfaction.

5.3. PLS Predictive Power

The model’s predictive capacity was assessed for endogenous constructs, which include attitude, contentment, trust, and word of mouth, utilizing tenfold iterations of the PLSpredict technique (Sharma et al., 2022). Initially, we verified that Q2predict was greater than zero. This scenario suggests that the PLS path model has demonstrated superior performance compared to the average values of the training data indicators. The root mean square error (RMSE) of a linear benchmark model was evaluated against the estimates derived from partial least squares structural equation modeling (PLS-SEM) as outlined by (J. F. Hair et al., 2019). The results of PLSpredict are displayed in Table 5. All indicators of the endogenous constructs display positive Q2predict values; there are no negative values present. Additionally, in comparison to the linear model (LM), PLS-SEM demonstrated consistently lower RMSE values. The aggregated findings demonstrate that the PLS route model exhibits a moderate level of predictive capability concerning the target endogenous constructs since the majority of all item differences (PLS-LM) is lower (Shmueli et al., 2019).

5.4. Path Coefficient

The proposed research model’s path coefficients were analyzed by estimating t-values through 10,000 resamples utilizing the bootstrap method (Henseler et al., 2009). The path coefficient may range from −1 to +1. A strong positive association occurs when the value approaches 1, while a negative relationship is indicated when it nears −1. The path coefficients must exhibit a significance level of no less than 0.05. At the 10%, 5%, and 1% significance levels, the critical values for a one-tailed test are 1.645, 1.96, and 2.33, respectively (Ramayah et al., 2014). The nine hypotheses proposed for the study were all completely significant (see Table 6). Cohen’s effect size estimation was used to calculate the effect size (Cohen, 1988). If the values are 0.01, 0.09, or 0.25, the effect sizes are categorized as small, medium, and large, respectively. Both social influence and perceived quality of behavior exhibit a sizable effect on attitude and trust, respectively, as shown in Table 6. Likewise, the effect size of satisfaction and trust on WOM is medium. However, the effect sizes of the other variables are small.

5.5. Model Fit and Goodness of Fit (GoF)

The initial step involved assessing the model’s accuracy through a detailed examination of its relationship with two adjustment variables: the normed fit index (NFI) and the standardized root mean square residual (SRMR) (see Table 7). A well-fitting model is characterized by an SRMR value, which is calculated from the discrepancy between the observed correlation matrix and the model-implied correlation matrix, resulting in a value lower than 0.08 (Hu & Bentler, 1998). Henseler et al. (2014) presented the SRMR as a metric for assessing goodness of fit aimed at reducing model misspecification in PLS-SEM. The second metric utilized for assessing a model’s adequacy is the normed fit index (NFI). This incremental fit metric evaluates the chi-square value of the proposed model against a relevant benchmark, offering a supplementary assessment of the model’s fitness (Ramayah et al., 2017). A Non-Normed Fit Index (NFI) value exceeding 0.90 typically signifies a favorable fit (Bentler & Bonett, 1980). The results derived from the estimation of the structural model and its alignment with the measurement model exhibited a notable similarity, attributed to the absence of free paths in the saturated measurement model. The data demonstrate a strong alignment with the model, evidenced by an SRMR value of 0.066, which is below the acceptable threshold of 0.08, and an NFI of 0.912, which exceeds the benchmark of 0.90. Furthermore, the GoF demonstrates the thorough alignment of the model. Tenenhaus et al. (2005) introduced a goodness-of-fit measure, which is calculated as the square root of the product of the mean of R2 and the mean of AVE. Wetzels et al. (2009) indicate that a value of 0.360 is appropriate. The GoF value for the proposed model is 0.539, which suggests that the model demonstrates a satisfactory level of fit. Figure 2 presents the results derived from the examination conducted in the final research model.

6. Discussion

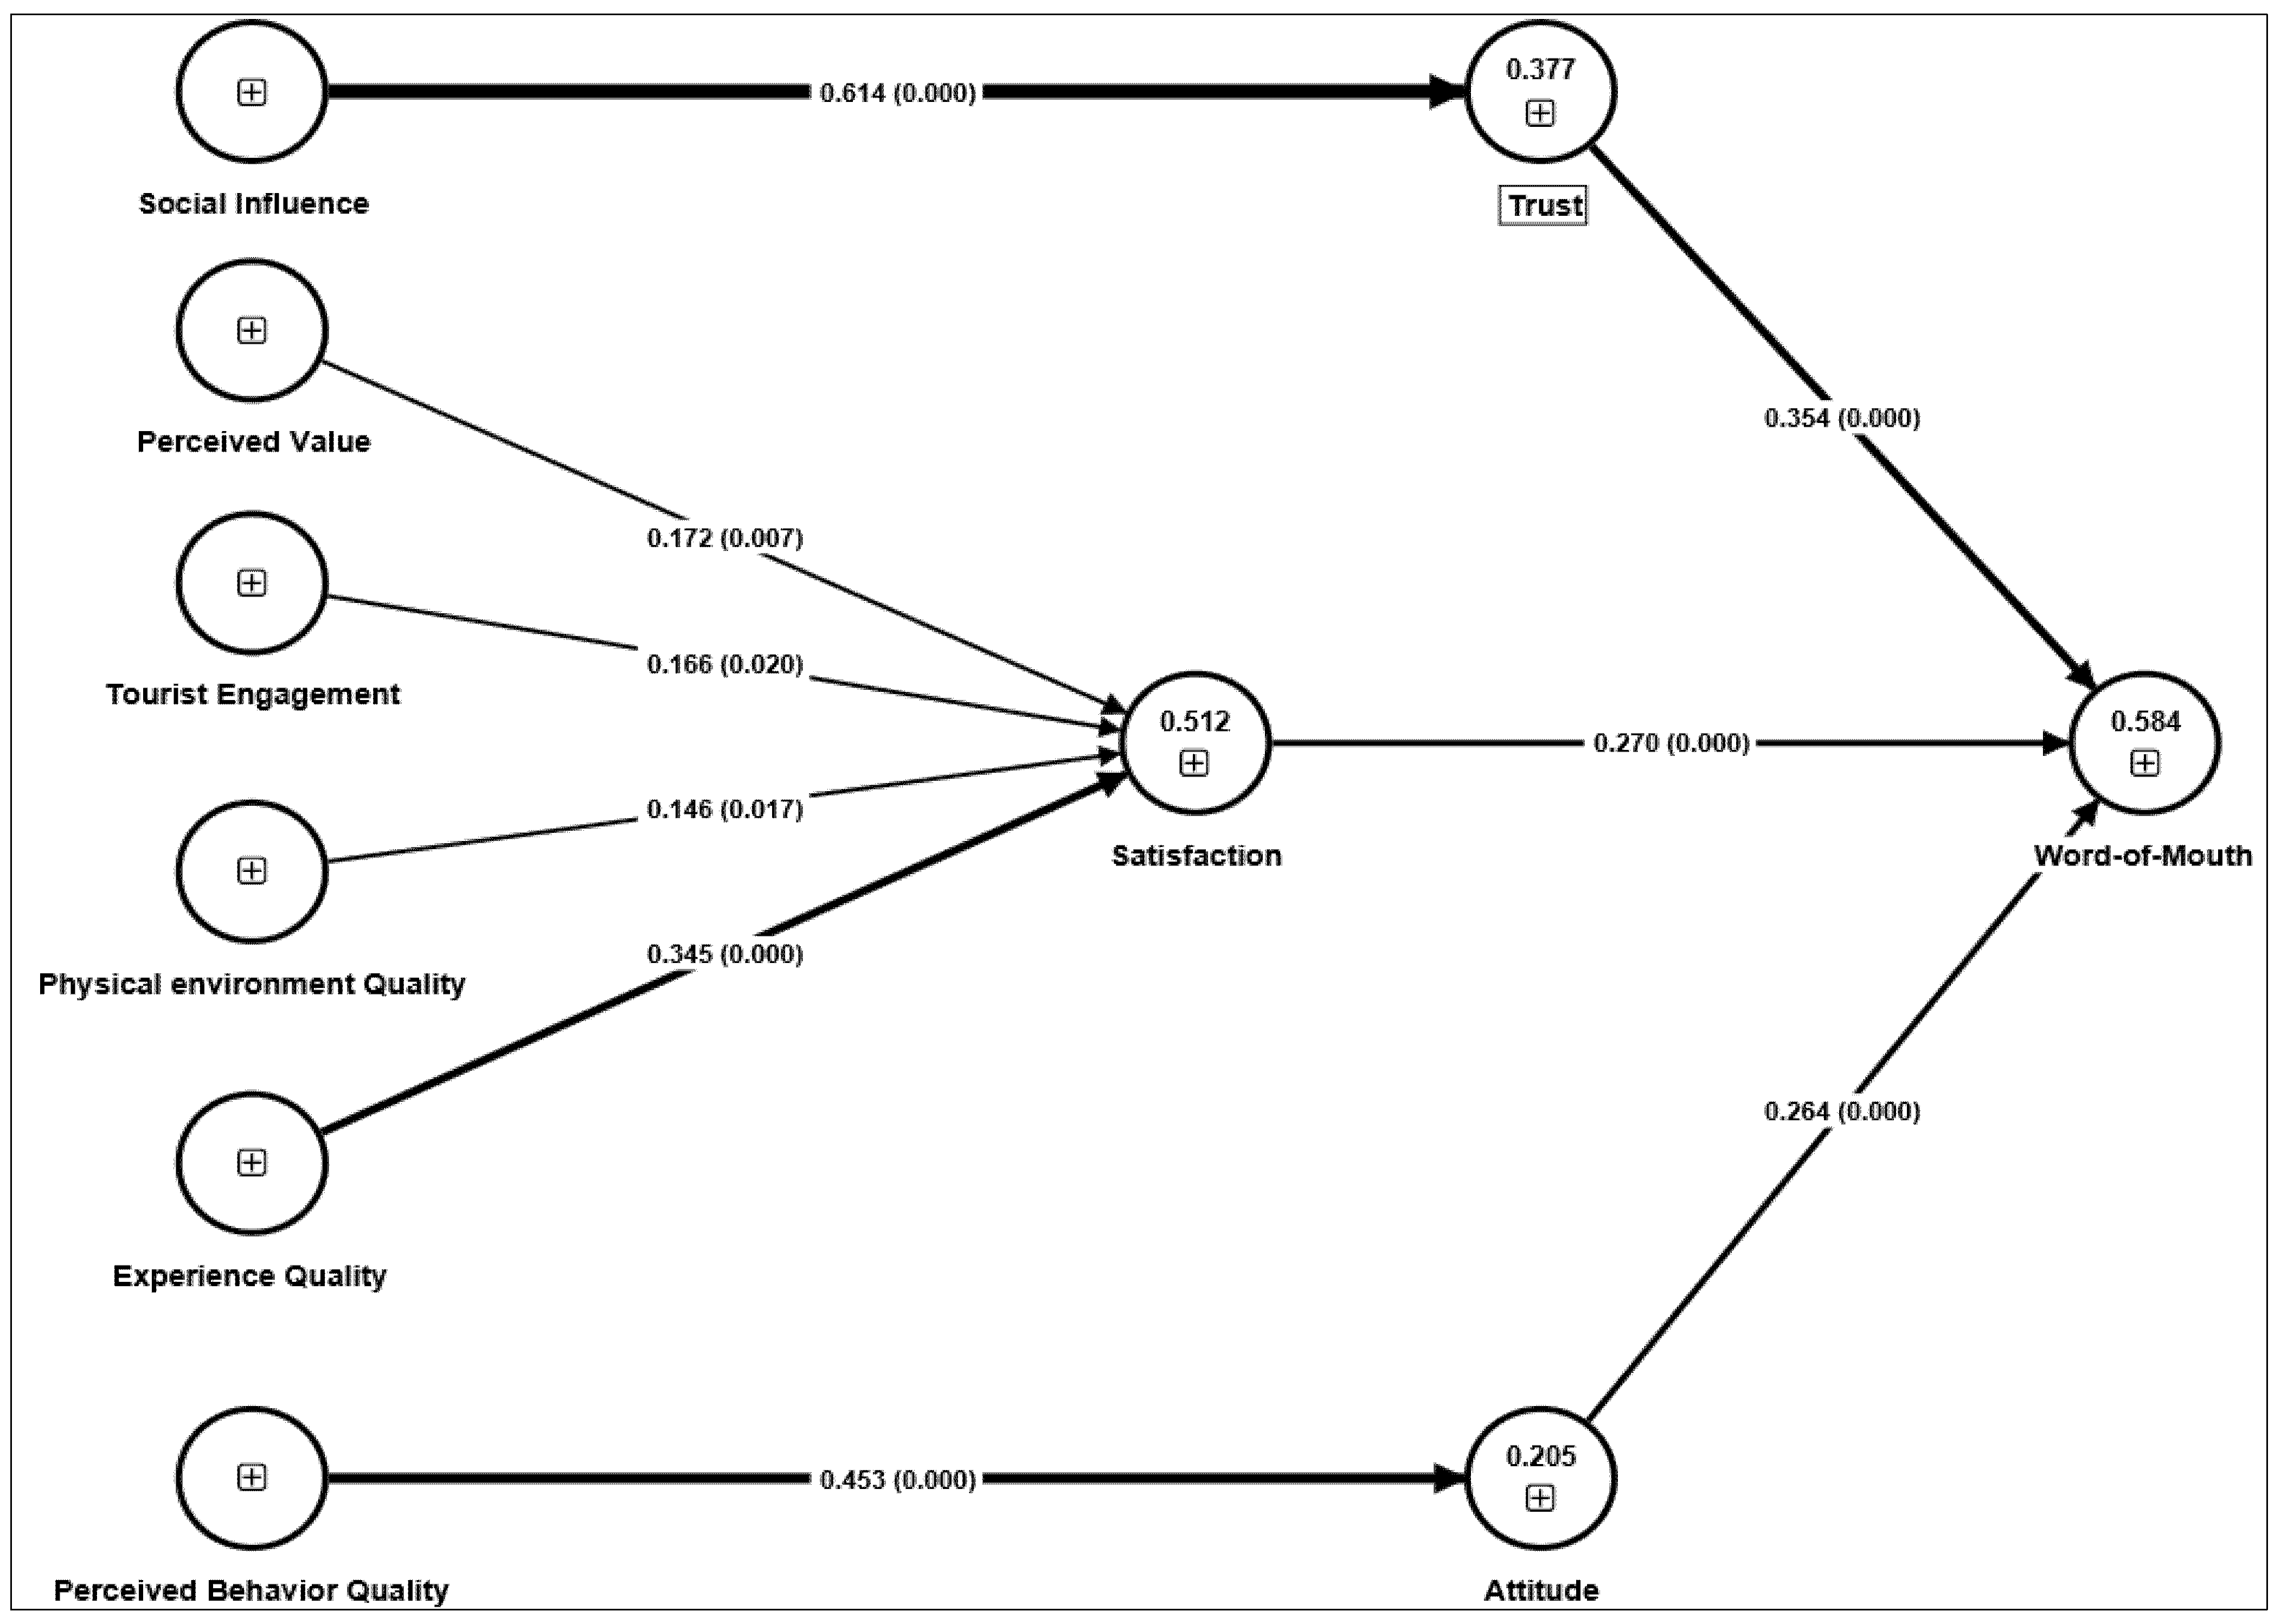
This study’s findings offer substantial insights into the determinants of tourist satisfaction and word-of-mouth (WOM) recommendations within the realm of cultural tourism in Thailand. The findings corroborate all the proposed hypotheses, emphasizing the significance of constructs including perceived value, quality of experience, quality of physical environment, perceived quality of behavior, tourist engagement, social influence, trust, and attitude in influencing tourist satisfaction and word-of-mouth behavior. This discussion section elucidates these findings, their consequences, and their congruence with the contemporary literature.
Trust was found to be highly influenced by social context (β = 0.614, p < 0.01), so supporting H1. This suggests that trust in a place is very much developed by the suggestions and opinions of friends, relatives, and social media. This result emphasizes the need to use social media and internet reviews to develop and preserve confidence in cultural tourist sites. For visitors, trust is essential, since it lowers the apparent risk and uncertainty, thus increasing their likelihood of visiting and recommending the place. This result is consistent with Jalilvand et al. (2017), Lai et al. (2020), and Seger-Guttmann and Gilboa (2023). People come to trust people by seeing and copying their actions. In tourism, primarily where visitors rely on social influences to create trust impressions, this is especially pertinent (Boto-García & Baños-Pino, 2022). Supporting H2, the data validated a noteworthy relationship between perceived value and satisfaction (β = 0.190, p < 0.01). This finding aligns with D. Chen (2023), Wu and Li (2017), and C.-F. Chen and Chen (2010), indicating that tourists who perceive a high value are more satisfied. The perception of value shapes expectations and assessments of the whole service experience, thus affecting satisfaction. Consumers who feel they have good value for money are more likely to be happy and participate in constructive activities, including WOM recommendations (Jalilvand et al., 2017). Those who value their trip experiences highly are more likely to be happy, since they believe the advantages exceed the expense. This emphasizes the need for value-for-money experiences for tourist providers, which can be attained by means of competitive pricing, premium services, and distinctive cultural presents.
Moreover, satisfaction was much influenced by tourist interaction (β = 0.208, p < 0.01), thereby supporting H3. This is consistent with studies by Patterson et al. (2006), and Rasoolimanesh et al. (2019), who maintained that tourist engagement raised satisfaction. This implies that the impact of engagement on satisfaction varies depending on the sector and the kind of travel destination. This emphasizes the need to generate chances for an active engagement in cultural tourism. Local celebrations, cultural events, and conventional craft workshops all help to improve engagement and add to a more fulfilling experience. Tourist satisfaction is substantially influenced by the quality of the physical environment (H4: β = 0.180, p < 0.01). This result conforms to recent research stressing the need for the physical environment in forming visitor experiences (Fang et al., 2024; Jalilvand et al., 2017). Maintaining clean and aesthetically pleasant surroundings improves the whole experience and increases the likelihood of visitors’ satisfaction. Maintaining the cleanliness and preservation of cultural monuments, together with offering sufficient facilities, is absolutely vital in Thailand to guarantee a good travel experience.
Furthermore, satisfaction (β = 0.262, p < 0.01) was shown to be very much correlated with quality of experience, so supporting H5. This is in line with research by Rahman et al. (2023) and Domínguez-Quintero et al. (2020), who discovered that high-quality events increase travel and hotel satisfaction. Quality of experience affects several aspects, including service interactions, ambiance, and emotional engagement, all of which, when taken together, influence satisfaction levels (Adhikari & Bhattacharya, 2016). This deduction could entail well-planned cultural trips, real-time local contacts, and immersive events that let visitors actively connect with Thai culture (Kornsuphkit et al., 2024). These findings emphasize the need to provide tourists with excellent experiences to raise their satisfaction. Supporting H6, this study revealed a considerable positive association between attitude (β = 0.453, p < 0.01) and perceived quality of behavior. This result supports earlier studies showing how individuals’ cognitive and affective reactions are shaped by the perceived quality of behavior (Ghorbanzadeh et al., 2021; Silva et al., 2024). According to the Expectancy–Value Theory (Fishbein & Ajzen, 1975), people create attitudes depending on their opinions about the qualities and expected results of an event. Consumers who experience an excellent quality of behavior are more likely to form positive opinions of a good or service (Y. Li et al., 2021; Passafaro, 2020). This result underlines the need for training and awareness campaigns for residents and service providers to guarantee favorable interactions with tourists.
Additionally, WOM was found to be much influenced by trust (β = 0.355, p = 0.01), so supporting H7. This result aligns with Jalilvand et al. (2017) and J. Liu et al. (2019). Trust builds consumers’ confidence in a business or location, which causes them to forward good opinions to others (Lai et al., 2020). However, our results contradict those of Gogoi (2021), who discovered that trust had no direct impact on positive WOM. The encouragement of WOM recommendations depends on developing trust via consistent, dependable service delivery, open communication, and enjoyable travel experiences. Supporting H8, this study validated a notable correlation between satisfaction and WOM (β = 0.270, p < 0.01). This is consistent with research by (Jalilvand et al., 2017), Kankhuni and Ngwira (2021), Ng et al. (2023), Hossain et al. (2024), and Santos and Meléndez (2016) showing that happy consumers are more likely to participate in positive WOM. Satisfaction strengthens customer loyalty and advocacy, leading to increased recommendations to others (Rasoolimanesh et al., 2022). Fostering good WOM depends on ensuring high degrees of satisfaction through value-for-money offers, quality experiences, and good contacts. Finally, WOM behavior was shown to be much influenced by attitude (β = 0.264, p < 0.001). Visitors who are positively inclined to a destination are more likely to tell others about it. This result corresponds with the theory of planned behavior, according to which attitudes affect behavioral intentions (Ajzen, 1991). Also, in line with Kamata (2022) and Shome (2021), this result encourages visitors to share their experiences, and this suggests that the location depends on developing a good attitude through entertaining and unforgettable events. Recent research has also shown how attitude shapes WOM behavior (Rambocas & Metivier, 2024; Sweeney et al., 2020). For instance, Rasoolimanesh et al. (2021) exposed that attitude greatly influences WOM behavior in cultural tourism, implying that a good attitude towards a location increases the possibility of recommending it to others.

7. Conclusions

In the culture tourism setting, cultural tourists’ word-of-mouth intentions have already left their mark. Conversely, there is a dearth of information on what motivates cultural tourists to positively recommend touristic places to others, both in Thailand and elsewhere. Therefore, the purpose of this research was to examine factors affecting cultural tourists’ word-of-mouth intention when visiting Thailand’s southern border provinces. The findings of this investigation intend to boost the effects of cultural tourism in that area. However, there is a dearth of research on that topic. No one has yet addressed word-of-mouth intention by utilizing PLS-SEM analysis in conjunction with the theories of the S-O-R model, TPB theory, and cognitive–affective–conative model. Consequently, it was necessary to study the factors that significantly affect cultural tourists’ word-of-mouth intention. As a result, by developing and testing an empirical model that combines the S-O-R, TPB, and cognitive–affective–conative theories, this research adds to the existing body of knowledge. It extends the existing WOM literature by capturing both external (S-O-R) and internal (TPB/CAC) drivers, unlike prior single-theory studies. Using a questionnaire, we solicited responses from cultural tourists during their visit to Thailand’s southern border provinces. The PLS-SEM method was employed to analyze the data.
Three key factors that cultural tourists considered when deciding whether or not to express their word-of-mouth intention positively were trust, attitude, and satisfaction. This study revealed that social influence had significance on the likelihood of their trust. Likewise, this study found that perceived behavior control was a significant predictor of attitude. Predictors of PV, tourist engagement, quality of physical environment, and quality of experience affect their satisfaction. Moreover, the findings uncover that social influence and perceived quality of behavior have large effects sizes on attitude and trust, respectively. Trust and satisfaction have medium effect sizes on WOM. In sum, this study adds to the overall context of culture tourism thanks to its findings. These findings make this study unique because of how they pertain to discussions about promoting cultural tourism in Southern Thailand. Academics, policymakers, entrepreneurs, and industry professionals involved in culture tourism will find this study intriguing. Thailand can keep becoming a top cultural tourism destination by concentrating on these important perspectives.

8. Research Implications

8.1. Practical Contributions

The study findings provide a basis for researchers who are interested in studying the factors affecting tourists’ decisions to visit cultural touristic places in Thailand’s southern border provinces. They can build their future research based on the current findings, trying to investigate more factors and policies that promote culture tourism in Southern Thailand in particular and the whole of Thailand in general. They can develop other models to better understand other significant factors of cultural tourists’ behavior towards visiting cultural touristic places. This study broadens the discussion of marketing strategies by showing how approaches like enhancing perceived value, improving physical environments, and fostering tourist engagement can be adapted to other cultural tourism destinations. These strategies should be tailored to fit the cultural and infrastructural context of each location, such as heritage sites in Southeast Asia or Europe. We also integrate sustainable tourism practices, including eco-friendly cultural events, community-led heritage preservation, and low-carbon marketing through social media, aligning with Thailand’s “Triangle of Stability, Prosperity, and Sustainability” plan (SOUTH, 2017). A practical roadmap is provided for stakeholders, recommending actions like forming partnerships with local communities to co-create authentic experiences and investing in sustainable infrastructure. We also link trust-building strategies to UNESCO’s sustainable tourism guidelines, emphasizing community-based engagement as a core component.
Given the significance of promoting cultural tourism, it is essential for entrepreneurs to comprehend the factors influencing tourists’ decisions to visit cultural attractions. This research offers advantages for entrepreneurs in managing activities associated with culture and tradition, including local products, tourism, housing characteristics, tourist attractions, traditional foods, and the lifestyle of villagers, to meet tourists’ expectations. The findings offer a valuable paradigm for understanding the influence of involvement on destination satisfaction and word-of-mouth recommendations, which have substantial implications for destinations’ marketing and development. Increased connections between tourists and the local population, together with chances for tourists to actively participate in destination-related activities, may stimulate their word-of-mouth communications. In addition, other stakeholders, such as the government and policymakers, can also utilize this study to help promote cultural tourism. First, high-quality services and competitive prices boost the perceived value and tourist satisfaction. Second, unique and engaging cultural events that highlight quality of experience can boost satisfaction and WOM. Thirdly, cultural places’ physical environments and infrastructures must be maintained to ensure a positive tourist experience. Fourthly, training residents and service providers to improve their quality of behavior may improve attitudes and satisfaction. Fifth, engaging visitors through interactive and participatory events boosts satisfaction and WOM. Finally, the social impact from online reviews and social media will build trust and attract visitors.
Moreover, cultural site managers may employ effective strategies in the design and development of their enterprises, such as organizing diverse large-scale events and offering distinctive educational experiences. A well-structured presentation of the cultural object, including its location, internal layout, pathways, lighting, and informational panels, may increase visitor interest and engagement. The interpretation and intangible aspects of cultural products can enhance visitors’ comprehension and experiences of cultural tourism. Improving visitors’ attention and engagement can enhance the quality of experience, leading to an increased perceived value and satisfaction among visitors. This inference promotes visitor loyalty. Enhancing the quality of the visitor experience as a management objective and ensuring that this quality translates into perceived value and satisfaction is essential for cultural site managers in the development of sustainability plans. Customer experience has become a significant concept in cultural tourism marketing, as the global experience gained often determines tourist satisfaction. Visitors seeking a comprehensive experience in cultural tourism may pursue leisure, culture, education, and social connections. Cultural site administrators must aim to meet visitors’ expectations regarding engagement, serenity, and educational value, as demonstrated by this study, to provide a holistic quality experience. This conclusion is clear, as many cultural organizations have prioritized public participation in their policies and programming.

8.2. Theoretical Contributions

This research contributes to the culture tourism and hospitality literature by integrating the theories of the S-O-R model, cognitive–affective–conative model, and TPB. This study extends the applicability of the S-O-R framework in integrating the role of the physical environment, perceived value, quality of experience, social influence, and attitudes in predicting WOM intention in the context of cultural tourism. Also, this study incorporates both internal and external aspects of cultural tourists that trigger their WOM intentions. Moreover, this research fills the gap in TPB by improving on its limitations by considering the unbiased determinant of behavior. Hence, this is one of the unique contributions of this study, as TPB was originally based on cognitive processing and ignored one’s needs/motivations before engaging in certain behaviors. In addition, this study also provides various determinants of the WOM intention of cultural tourists. This model was employed to forecast the cultural tourists’ word-of-mouth intentions in a country where limited research has been conducted on the subject. This study also helps to address a big gap in the literature by determining what factors impact their word-of-mouth intentions in this particular environment. This research presents a number of important conclusions about the elements that influence trust, attitude, and satisfaction. PV, tourist engagement, quality of physical environment, and quality of experience are the main findings regarding cultural tourists’ word-of-mouth intentions. It was found that trust was more dependent on social influence. Similarly, perceived behavior control significantly impacts attitude. We compare our findings with studies like Jalilvand et al. (2017) and Rasoolimanesh et al. (2021), noting that our model’s inclusion of tourist engagement and quality of physical environment as predictors of satisfaction adds new dimensions to WOM research. To conclude, the research presented in this study yields significant theoretical advances. This study enhances prior research by establishing a newfound mixed approach that integrates the S-O-R and cognitive–affective–conative models and TPB. Trust, attitude, and satisfaction are the exact determinants of WOM intentions.

9. Limitations and Suggestions for Future Research

This study has limits, notwithstanding its insights. This study mostly addresses Thai cultural tourism, so the findings might not be relevant to other travel or destinations. Future research could investigate these ideas under several conditions to validate the conclusions. Also, this study could be biased by self-reported data. Future research should employ other approaches and observational data to acquire a further understanding. This study employs a cross-sectional design and evaluates intentions at a specific point in time, constrained by temporal limitations. Individuals’ perspectives change as they acquire life experiences. As a result, the longitudinal method is the most effective. The use of purposive sampling, while effective for reaching cultural tourists in this specific region, may limit the generalizability of the results to other types of destinations or tourist segments. We emphasize the unique socio-cultural and geopolitical characteristics of the study area, including its distinct cultural heritage and ongoing stability efforts, and caution against applying these findings to other regions without considering contextual factors. To improve the generalizability, we suggest that future research adopt probability sampling or conduct comparative studies across varied tourism contexts. Future research may shed light on the whole country or extend to the Southern Asian region, too. These findings are most relevant to cultural tourism in heritage-rich, emerging destinations with contexts similar to Thailand’s southern border provinces. We recommend future cross-cultural studies to test the model’s robustness in different settings, such as European heritage sites or urban cultural tourism. This research may establish a foundation for the application of WOM intent within the tourism sector. A full comparison of data, information from other countries, and specifics on the actual application remains insufficient. In the future, scholars may want to investigate this further to elucidate the broader applications of cultural tourism. A more miscellaneous sample of individuals from different educational backgrounds, ages, clusters, and levels of discretionary money will deliver further precise findings. To better understand culture tourists’ interests and the factors that influence their WOM intention, future research should include more social and consumer behavior theories. This study evaluates the scale of word-of-mouth intentions within the framework of cultural tourism, namely in Southern Thailand. A potential avenue for future research is the comparative analysis of tourists to Thailand’s southern provinces vs. those in the northern and central regions, which may yield significant insights into the broader Thai tourism landscape. Additionally, subsequent research must replicate this work in various circumstances. A potential avenue for future research may be comparing tourist participation in heritage tourism with that in other tourism contexts. We have also posited that attitude, trust, and contentment might influence word-of-mouth intentions in a tourism context. Additional research is necessary to evaluate the magnitude of this link and its associations with other behavioral objectives of tourists. Finally, future studies should examine the model qualitatively. Participant interviews or focus groups can reveal more.

Author Contributions

Conceptualization, M.S.; methodology, M.S.; software, M.S.; validation, T.N., M.A. and A.B.; formal analysis, M.S.; investigation, T.N.; resources, A.B.; data curation, M.A.; writing—original draft preparation, M.S.; writing—review and editing, A.A. and T.N.; visualization, A.B.; supervision, M.A.; project administration, T.N.; funding acquisition, M.S. All authors have read and agreed to the published version of the manuscript.

Funding

This research was funded by the Fundamental Fund (FF66), and Fundamental Fund (FF67) National Budget for funding this research (Project Code: ISL6601273S & ISL6701349S).

Institutional Review Board Statement

The study was conducted in accordance with the Declaration of Helsinki, and the protocol was approved by the Research Ethics Committee for Humanities, Social Sciences and Education Prince of Songkla University, Pattani Campus (psu.pn.2-080/67) on [11 October 2024].

Informed Consent Statement

Informed consent for participation was obtained from all subjects involved in the study.

Data Availability Statement

The original contributions presented in this study are included in the article. Further inquiries can be directed to the corresponding author.

Conflicts of Interest

The authors declare no conflicts of interest.

References

  1. Adhikari, A., & Bhattacharya, S. (2016). Appraisal of literature on customer experience in tourism sector: Review and framework. Current Issues in Tourism, 19(4), 296–321. [Google Scholar] [CrossRef]
  2. Agapito, D., Oom do Valle, P., & da Costa Mendes, J. (2013). The cognitive-affective-conative model of destination image: A confirmatory analysis. Journal of Travel & Tourism Marketing, 30(5), 471–481. [Google Scholar]
  3. Ajzen, I. (1991). The theory of planned behavior. Organizational Behavior and Human Decision Processes, 50(2), 179–211. [Google Scholar] [CrossRef]
  4. Alam, S., Mahmud, I., Hoque, S. S., Akter, R., & Rana, S. S. (2022). Predicting students’ intention to continue business courses on online platforms during the Covid-19: An extended expectation confirmation theory. The International Journal of Management Education, 20(3), 100706. [Google Scholar] [CrossRef]
  5. Ali, F., Kim, W. G., & Ryu, K. (2016). The effect of physical environment on passenger delight and satisfaction: Moderating effect of national identity. Tourism Management, 57, 213–224. [Google Scholar] [CrossRef]
  6. Ali, F., Rasoolimanesh, S. M., Sarstedt, M., Ringle, C. M., & Ryu, K. (2018a). An assessment of the use of partial least squares structural equation modeling (PLS-SEM) in hospitality research. International Journal of Contemporary Hospitality Management, 30(1), 514–538. [Google Scholar] [CrossRef]
  7. Ali, M., Ismail, A., Alam, S., Makhbul, Z., & Omar, N. (2018b). Exploring the theory of planned behaviour (TPB) in relation to a halal food scandal: The Malaysia Cadbury chocolate case. International Food Research Journal, 25, S79–S86. [Google Scholar]
  8. Ali, M., Puah, C.-H., Ayob, N., & Raza, S. A. (2020). Factors influencing tourist’s satisfaction, loyalty and word of mouth in selection of local foods in Pakistan. British Food Journal, 122(6), 2021–2043. [Google Scholar] [CrossRef]
  9. Alrawadieh, Z., Prayag, G., Alrawadieh, Z., & Alsalameen, M. (2019). Self-identification with a heritage tourism site, visitors’ engagement and destination loyalty: The mediating effects of overall satisfaction. The Service Industries Journal, 39(7–8), 541–558. [Google Scholar] [CrossRef]
  10. Anderson, J. C., & Gerbing, D. W. (1988). Structural equation modeling in practice: A review and recommended two-step approach. Psychological Bulletin, 103(3), 411. [Google Scholar] [CrossRef]
  11. Arifah, M. S., Mariam, S., & Ramli, A. H. (2024). The influence of the usefulness of electronic word of mouth information on tourists’ visiting intentions. Jurnal Ilmiah Manajemen Kesatuan, 12(5), 1731–1746. [Google Scholar] [CrossRef]
  12. Bagozzi, R. P. (1986). Attitude formation under the theory of reasoned action and a purposeful behaviour reformulation. British Journal of Social Psychology, 25(2), 95–107. [Google Scholar] [CrossRef]
  13. Baloglu, S., & McCleary, K. W. (1999). A model of destination image formation. Annals of Tourism Research, 26(4), 868–897. [Google Scholar] [CrossRef]
  14. Balter, D. (2008). The word of mouth manual. BZZ Pubs. [Google Scholar]
  15. Becker, J.-M., Cheah, J.-H., Gholamzade, R., Ringle, C. M., & Sarstedt, M. (2023). PLS-SEM’s most wanted guidance. International Journal of Contemporary Hospitality Management, 35(1), 321–346. [Google Scholar] [CrossRef]
  16. Bentler, P. M., & Bonett, D. G. (1980). Significance tests and goodness of fit in the analysis of covariance structures. Psychological Bulletin, 88(3), 588. [Google Scholar] [CrossRef]
  17. BOT. (2021). The impact of COVID-19 on Thailand’s tourism sector. Available online: https://www.bot.or.th (accessed on 31 January 2025).
  18. Boto-García, D., & Baños-Pino, J. F. (2022). Social influence and bandwagon effects in tourism travel. Annals of Tourism Research, 93, 103366. [Google Scholar] [CrossRef]
  19. Bryce, D., Curran, R., O’Gorman, K., & Taheri, B. (2015). Visitors’ engagement and authenticity: Japanese heritage consumption. Tourism Management, 46, 571–581. [Google Scholar] [CrossRef]
  20. Budiatmo, A., & Listyorini, S. (2025). The role of place attachment as a mediator between destination image and revisit intention. International Journal of Applied Research in Business and Management, 6(1). [Google Scholar] [CrossRef]
  21. Chen, C.-F., & Chen, F.-S. (2010). Experience quality, perceived value, satisfaction and behavioral intentions for heritage tourists. Tourism Management, 31(1), 29–35. [Google Scholar] [CrossRef]
  22. Chen, D. (2023). How visitors perceive heritage value—A quantitative study on visitors’ perceived value and satisfaction of architectural heritage through SEM. Sustainability, 15(11), 9002. [Google Scholar] [CrossRef]
  23. Chen, N. C., Dwyer, L., & Firth, T. (2018). Residents’ place attachment and word-of-mouth behaviours: A tale of two cities. Journal of Hospitality and Tourism Management, 36, 1–11. [Google Scholar] [CrossRef]
  24. Chen, S., Han, X., Bilgihan, A., & Okumus, F. (2021). Customer engagement research in hospitality and tourism: A systematic review. Journal of Hospitality Marketing & Management, 30(7), 871–904. [Google Scholar]
  25. Cheunkamon, E., Jomnonkwao, S., & Ratanavaraha, V. (2020). Determinant factors influencing Thai tourists’ intentions to use social media for travel planning. Sustainability, 12(18), 7252. [Google Scholar] [CrossRef]
  26. Cheunkamon, E., Jomnonkwao, S., & Ratanavaraha, V. (2022). Impacts of tourist loyalty on service providers: Examining the role of the service quality of tourism supply chains, tourism logistics, commitment, satisfaction, and trust. Journal of Quality Assurance in Hospitality & Tourism, 23(6), 1397–1429. [Google Scholar]
  27. Chin, W., Cheah, J.-H., Liu, Y., Ting, H., Lim, X.-J., & Cham, T. H. (2020). Demystifying the role of causal-predictive modeling using partial least squares structural equation modeling in information systems research. Industrial Management & Data Systems, 120(12), 2161–2209. [Google Scholar]
  28. Choeichuenjit, W., & Sapsanguanboon, W. (2014). Foreign tourists’ demand on Thai cultural tourism supply chain. Journal of Thai Hospitality and Tourism, 9(2), 74–85. [Google Scholar]
  29. Cohen, J. (1988). Statistical power analysis for the behavioral sciences (2nd ed.). Academic Press. [Google Scholar]
  30. Cooper, D., & Schindler, P. (2003). Business research methods (8th ed.). McGraw-Hill Companies, Inc. [Google Scholar]
  31. Cortez, P. M., Ong, A. K. S., Diaz, J. F. T., German, J. D., & Jagdeep, S. J. S. S. (2024). Analyzing Preceding factors affecting behavioral intention on communicational artificial intelligence as an educational tool. Heliyon, 10(3), e25896. [Google Scholar] [CrossRef]
  32. Domínguez-Quintero, A. M., González-Rodríguez, M. R., & Paddison, B. (2020). The mediating role of experience quality on authenticity and satisfaction in the context of cultural-heritage tourism. Current Issues in Tourism, 23(2), 248–260. [Google Scholar] [CrossRef]
  33. Eroglu, S. A., Machleit, K. A., & Davis, L. M. (2001). Atmospheric qualities of online retailing: A conceptual model and implications. Journal of Business Research, 54(2), 177–184. [Google Scholar] [CrossRef]
  34. Esfandiar, K., Dowling, R., Pearce, J., & Goh, E. (2021). What a load of rubbish! The efficacy of theory of planned behaviour and norm activation model in predicting visitors’ binning behaviour in national parks. Journal of Hospitality and Tourism Management, 46, 304–315. [Google Scholar] [CrossRef]
  35. Fang, Z., Yao, J., & Shi, J. (2024). The influence of environmental factors, perception, and participation on industrial heritage tourism satisfaction—A study based on multiple heritages in Shanghai. Buildings, 14(11), 3508. [Google Scholar] [CrossRef]
  36. Faul, F., Erdfelder, E., Buchner, A., & Lang, A.-G. (2009). Statistical power analyses using G* Power 3.1: Tests for correlation and regression analyses. Behavior Research Methods, 41(4), 1149–1160. [Google Scholar] [CrossRef] [PubMed]
  37. Fishbein, M. (1967). Attitudes and the prediction of behavior. In M. Fishbein (Ed.), Readings in attitude theory and measurement. John Wiley & Sons, Inc. [Google Scholar]
  38. Fishbein, M., & Ajzen, I. (1975). Belief, attitude, intention and behavior: An introduction to theory and research. Addison-Wesley. [Google Scholar]
  39. Fu, X. (2019). Existential authenticity and destination loyalty: Evidence from heritage tourists. Journal of Destination Marketing & Management, 12, 84–94. [Google Scholar]
  40. Ghasemy, M., Teeroovengadum, V., Becker, J.-M., & Ringle, C. M. (2020). This fast car can move faster: A review of PLS-SEM application in higher education research. Higher Education, 80(6), 1121–1152. [Google Scholar] [CrossRef]
  41. Ghorbanzadeh, D., Shabbir, M. S., Mahmood, A., & Kazemi, E. (2021). Investigating the role of experience quality in predicting destination image, perceived value, satisfaction, and behavioural intentions: A case of war tourism. Current Issues in Tourism, 24(21), 3090–3106. [Google Scholar] [CrossRef]
  42. Gillenson, M. L., & Sherrell, D. L. (2002). Enticing online consumers: An extended technology acceptance perspective. Information & Management, 39(8), 705–719. [Google Scholar]
  43. Gogoi, B. J. (2021). Influence of service quality and trust in spreading positive WOM and increasing loyalty of a tourist location. Academy of Marketing Studies Journal, 25(2), 1–14. [Google Scholar]
  44. Gold, A. H., Malhotra, A., & Segars, A. H. (2001). Knowledge management: An organizational capabilities perspective. Journal of Management Information Systems, 18(1), 185–214. [Google Scholar] [CrossRef]
  45. González-Rodríguez, M. R., Domínguez-Quintero, A. M., & Paddison, B. (2020). The direct and indirect influence of experience quality on satisfaction: The importance of emotions. Current Issues in Tourism, 23(22), 2779–2797. [Google Scholar] [CrossRef]
  46. Guillén, M. E., Tirado, D. M., & Sánchez, A. R. (2022). The impact of COVID-19 on university students and competences in education for sustainable development: Emotional intelligence, resilience and engagement. Journal of Cleaner Production, 380, 135057. [Google Scholar] [CrossRef]
  47. Guo, J., Susilo, Y., Antoniou, C., & Pernestål, A. (2022). Word of mouth and behavioural intentions of the automated bus service. Cities, 126, 103668. [Google Scholar] [CrossRef]
  48. Hair, J., & Alamer, A. (2022). Partial Least Squares Structural Equation Modeling (PLS-SEM) in second language and education research: Guidelines using an applied example. Research Methods in Applied Linguistics, 1(3), 100027. [Google Scholar] [CrossRef]
  49. Hair, J. F., Risher, J. J., Sarstedt, M., & Ringle, C. M. (2019). When to use and how to report the results of PLS-SEM. European Business Review, 31(1), 2–24. [Google Scholar] [CrossRef]
  50. Harrigan, P., Evers, U., Miles, M., & Daly, T. (2017). Customer engagement with tourism social media brands. Tourism Management, 59, 597–609. [Google Scholar] [CrossRef]
  51. Hasan, M. K., Ray, R., & Neela, N. M. (2023). Tourists’ behavioural intention in coastal tourism settings: Examining the mediating role of attitude to behaviour. Tourism Planning & Development, 20(6), 955–972. [Google Scholar]
  52. Henseler, J., Dijkstra, T. K., Sarstedt, M., Ringle, C. M., Diamantopoulos, A., Straub, D. W., Ketchen, D. J., Jr., Hair, J. F., Hult, G. T. M., & Calantone, R. J. (2014). Common beliefs and reality about PLS: Comments on Rönkkö and Evermann (2013). Organizational Research Methods, 17(2), 182–209. [Google Scholar] [CrossRef]
  53. Henseler, J., Ringle, C. M., & Sarstedt, M. (2015). A new criterion for assessing discriminant validity in variance-based structural equation modeling. Journal of the Academy of Marketing Science, 43(1), 115–135. [Google Scholar] [CrossRef]
  54. Henseler, J., Ringle, C. M., & Sinkovics, R. R. (2009). The use of partial least squares path modeling in international marketing. In New challenges to international marketing (pp. 277–319). Emerald Group Publishing Limited. [Google Scholar]
  55. Hossain, M. S., Hossain, M. A., Al Masud, A., Islam, K. Z., Mostafa, M. G., & Hossain, M. T. (2024). The integrated power of gastronomic experience quality and accommodation experience to build tourists’ satisfaction, revisit intention, and word-of-mouth intention. Journal of Quality Assurance in Hospitality & Tourism, 25(6), 1692–1718. [Google Scholar]
  56. Howell, D. C. (2007). The treatment of missing data. In The sage handbook of social science methodology (pp. 208–224). SAGE Publications Inc. [Google Scholar]
  57. Hsieh, Y.-H., & Chuang, I.-C. (2020). Evaluation of key factors for service experience: A comparison of tourism factories and international tourism hotels. Tourism Economics, 26(3), 404–436. [Google Scholar] [CrossRef]
  58. Hu, L.-T., & Bentler, P. M. (1998). Fit indices in covariance structure modeling: Sensitivity to underparameterized model misspecification. Psychological Methods, 3(4), 424. [Google Scholar] [CrossRef]
  59. Jaboob, M., Hazaimeh, M., Al-Ansi, A. M., & Hazaimeh, M. (2024). Integration of generative AI techniques and applications in student behavior and cognitive achievement in arab higher education. International Journal of Human–Computer Interaction, 41(1), 353–366. [Google Scholar] [CrossRef]
  60. Jaipong, P. (2024). Modelling of social influence, electronic word-of-mouth, previous experience and abroad tour service purchase intentions among thai tourists. Advance Knowledge for Executives, 3(2), 1–10. [Google Scholar] [CrossRef]
  61. Jalilvand, M. R., Salimipour, S., Elyasi, M., & Mohammadi, M. (2017). Factors influencing word of mouth behaviour in the restaurant industry. Marketing Intelligence & Planning, 35(1), 81–110. [Google Scholar]
  62. Jalilvand, M. R., & Samiei, N. (2012). The impact of electronic word of mouth on a tourism destination choice: Testing the theory of planned behavior (TPB). Internet Research, 22(5), 591–612. [Google Scholar] [CrossRef]
  63. Jiang, S., Zhang, Z., Xu, H., & Pan, Y. (2024). What influences users’ continuous behavioral intention in cultural heritage virtual tourism: Integrating experience economy theory and stimulus–organism–response (SOR) model. Sustainability, 16(23), 10231. [Google Scholar] [CrossRef]
  64. Kamata, H. (2022). Tourist destination residents’ attitudes towards tourism during and after the COVID-19 pandemic. Current Issues in Tourism, 25(1), 134–149. [Google Scholar] [CrossRef]
  65. Kankhuni, Z., & Ngwira, C. (2021). Overland tourists’ natural soundscape perceptions: Influences on experience, satisfaction, and electronic word-of-mouth. Tourism Recreation Research, 47(6), 591–607. [Google Scholar] [CrossRef]
  66. Karim, R. A., Rabiul, M. K., & Arfat, S. M. (2024). Factors influencing tourists’ behavioural intentions towards beach destinations: The mediating roles of destination experience and destination satisfaction. Journal of Hospitality and Tourism Insights, 7(4), 2033–2054. [Google Scholar] [CrossRef]
  67. Kasamsuk, S., Bodthongtim, M., & Sookprung, W. (2018). Identity and cultural tourism business model for pilgrimage routes cultural in Ubon Ratchathani Province: A case of tour business. Suthiparithat, Special Issue, 223–234. [Google Scholar]
  68. Khadiza, B., & Tapachai, N. (2022). A study on the factors affecting thai tourist’s visit intention to travel to bangladesh. Rajapark Journal, 16(49), 1–19. [Google Scholar]
  69. Kock, N. (2015). Common method bias in PLS-SEM: A full collinearity assessment approach. International Journal of e-Collaboration (IJEC), 11(4), 1–10. [Google Scholar] [CrossRef]
  70. Koenig-Lewis, N., Palmer, A., & Asaad, Y. (2021). Linking engagement at cultural festivals to legacy impacts. Journal of Sustainable Tourism, 29(11–12), 1810–1831. [Google Scholar] [CrossRef]
  71. Kornsuphkit, T., Photchanachan, S., Charoernpornpanichkul, K., Shoosanuk, C., & Shoosanuk, A. (2024). Antecedents of revisit intention of thai cultural tourist in Thailand. Journal of Environmental Management and Tourism, 15(1), 129–143. [Google Scholar] [CrossRef] [PubMed]
  72. Lai, M.-Y., Fotiadis, A. K., Abu-ElSamen, A., & Beede, P. (2020). Analysing the effect of membership and perceived trust on sport events electronic word-of-mouth (eWOM) intention. Tourism Recreation Research, 47(1), 91–104. [Google Scholar] [CrossRef]
  73. Lee, S., Phau, I., Hughes, M., Li, Y. F., & Quintal, V. (2016). Heritage tourism in Singapore Chinatown: A perceived value approach to authenticity and satisfaction. Journal of Travel & Tourism Marketing, 33(7), 981–998. [Google Scholar]
  74. Li, C. C. (2024). Theory of planned behavior in determining factors influencing tourists’ travel intentions during the COVID-19 pandemic. International Journal of Economics, Management and Accounting, 32(1), 69–99. [Google Scholar] [CrossRef]
  75. Li, Y., Liu, B., Chen, P., & Huan, T.-C. (2021). Tourism service providers’ physical attractiveness and customers’ service quality evaluation: Is warmth or competence more important? Tourism Review, 76(6), 1260–1278. [Google Scholar] [CrossRef]
  76. Lin, T.-C., Huang, S.-L., & Hsu, C.-J. (2015). A dual-factor model of loyalty to IT product–the case of smartphones. International Journal of Information Management, 35(2), 215–228. [Google Scholar] [CrossRef]
  77. Liu, H., Park, K.-S., & Wei, Y. (2024). An extended stimulus-organism-response model of Hanfu experience in cultural heritage tourism. Journal of Vacation Marketing, 30(2), 288–310. [Google Scholar] [CrossRef]
  78. Liu, J., Wang, C., Fang, S., & Zhang, T. (2019). Scale development for tourist trust toward a tourism destination. Tourism Management Perspectives, 31, 383–397. [Google Scholar] [CrossRef]
  79. Liu, Y., Yu, C., & Damberg, S. (2022). Exploring the drivers and consequences of the “awe” emotion in outdoor sports–a study using the latest partial least squares structural equation modeling technique and necessary condition analysis. International Journal of Sports Marketing and Sponsorship, 23(2), 278–294. [Google Scholar] [CrossRef]
  80. Mathew, P. V., Cabral, C., & Mohandas, N. P. (2024). Influence of responsible tourism practices on the destination perceptions of tourists. International Journal of Tourism Research, 26(4), e2692. [Google Scholar] [CrossRef]
  81. Miao, Y. (2015). The influence of electronic-WOM on tourists’ behavioral intention to choose a destination: A case of chinese tourists visiting thailand. AU-GSB e-Journal, 8(1), 13–24. [Google Scholar]
  82. Miller, B. K., & Simmering, M. J. (2023). Attitude toward the color blue: An ideal marker variable. Organizational Research Methods, 26(3), 409–440. [Google Scholar] [CrossRef]
  83. MOTS. (2023). Thailand tourism recovery plan. Available online: https://www.mots.go.th (accessed on 31 January 2025).
  84. Nam, M., Kim, I., & Hwang, J. (2016). Can local people help enhance tourists’ destination loyalty? A relational perspective. Journal of Travel & Tourism Marketing, 33(5), 702–716. [Google Scholar]
  85. Namahoot, K. S., Punpairoj, W., Wattana, C., & Rattanawiboonsom, V. (2023). Augmented reality technology adoption in tourism using structural equation model. International Journal of Professional Business Review, 8(8), 61. [Google Scholar] [CrossRef]
  86. Nanggong, A., & Mohammad, A. (2024). Does tourism experience matter in cultural tourism destinations? Predicting future tourist behavior. Asian Management and Business Review, 4(1), 122–136. [Google Scholar] [CrossRef]
  87. Ng, K. S. P., Wong, J. W. C., Xie, D., & Zhu, J. (2023). From the attributes of smart tourism technologies to loyalty and WOM via user satisfaction: The moderating role of switching costs. Kybernetes, 52(8), 2868–2885. [Google Scholar] [CrossRef]
  88. Pandža Bajs, I. (2015). Tourist perceived value, relationship to satisfaction, and behavioral intentions: The example of the Croatian tourist destination Dubrovnik. Journal of Travel Research, 54(1), 122–134. [Google Scholar] [CrossRef]
  89. Passafaro, P. (2020). Attitudes and tourists’ sustainable behavior: An overview of the literature and discussion of some theoretical and methodological issues. Journal of Travel Research, 59(4), 579–601. [Google Scholar] [CrossRef]
  90. Patterson, P., Yu, T., & De Ruyter, K. (2006, December 4–6). Understanding customer engagement in services. Advancing Theory, Maintaining Relevance, Proceedings of ANZMAC 2006 Conference, Brisbane, Australia. [Google Scholar]
  91. Porras-Bueno, N., Haldón Hermoso, J. M., & Plaza-Mejía, M. Á. (2023). Modeling residents’ WOM behavior toward tourism through altruism and the theory of reasoned action. Leisure Sciences, 1–22. [Google Scholar] [CrossRef]
  92. Pratiwi, I. E. (2018). Halal food and young muslims’ purchase intention in Indonesia (case study in Jayapura, Papua Province). International Journal of Islamic Economics and Finance Studies, 4(3), 21–34. [Google Scholar] [CrossRef]
  93. Punpairoj, W., Namahoot, K. S., Wattana, C., & Rattanawiboonsom, V. (2023). The influence of innovativeness on revisit intention: The mediating role of word-of-mouth in augmented reality for tourism in Thailand. International Journal of Professional Business Review, 8(6), 30. [Google Scholar] [CrossRef]
  94. Qiu, H., Wang, X., Wu, M.-Y., Wei, W., Morrison, A. M., & Kelly, C. (2023). The effect of destination source credibility on tourist environmentally responsible behavior: An application of stimulus-organism-response theory. Journal of Sustainable Tourism, 31(8), 1797–1817. [Google Scholar] [CrossRef]
  95. Qiu, N., Li, H., Pan, C., Wu, J., & Guo, J. (2024). The study on the relationship between perceived value, satisfaction, and tourist loyalty at industrial heritage sites. Heliyon, 10(17), e37184. [Google Scholar] [CrossRef]
  96. Qiuai, H., Tongqian, Z., Guowei, W., & Liang, S. (2024). Understanding local people’s support intentions toward cultural heritage tourism: An examination through stimulus-organism-response perspective. Journal of Resources and Ecology, 15(3), 745–753. [Google Scholar] [CrossRef]
  97. Rahman, A., Farooq, N., Haleem, M., Shah, S. M. A., & El-Gohary, H. (2023). Exploring the pathways to tourist loyalty in pakistani tourism industry: The role of destination image, service quality, E-WOM, and social media. Sustainability, 15(24), 16601. [Google Scholar] [CrossRef]
  98. Ramayah, T., Chiun, L. M., Rouibah, K., & May, O. S. (2014). Identifying priority using an importance-performance matrix analysis (IPMA): The case of internet banking in Malaysia. International Journal of E-Adoption (IJEA), 6(1), 1–15. [Google Scholar] [CrossRef]
  99. Ramayah, T., Yeap, J., Ahmad, N. H., Halim, H. A., & Rahman, S. A. (2017). Testing a confirmatory model of facebook usage in smartpls using consistent PLS. International Journal of Business and Innovation, 3(2), 1–14. [Google Scholar]
  100. Rambocas, M., & Metivier, J. (2024). How does the influencers’ country of origin affect online brand advocacy among young consumers? Young Consumers, 25(6), 909–927. [Google Scholar] [CrossRef]
  101. Rasoolimanesh, S. M., Md Noor, S., Schuberth, F., & Jaafar, M. (2019). Investigating the effects of tourist engagement on satisfaction and loyalty. The Service Industries Journal, 39(7–8), 559–574. [Google Scholar] [CrossRef]
  102. Rasoolimanesh, S. M., Seyfi, S., Hall, C. M., & Hatamifar, P. (2021). Understanding memorable tourism experiences and behavioural intentions of heritage tourists. Journal of Destination Marketing & Management, 21, 100621. [Google Scholar]
  103. Rasoolimanesh, S. M., Seyfi, S., Rather, R. A., & Hall, C. M. (2022). Investigating the mediating role of visitor satisfaction in the relationship between memorable tourism experiences and behavioral intentions in heritage tourism context. Tourism Review, 77(2), 687–709. [Google Scholar] [CrossRef]
  104. Renganathan, S. A., Lodi, S. N., & Mohi, Z. B. (2024). The mediating role of perceived value on the effect of service quality on customer satisfaction in the hospitality sector in Malaysia. Library of Progress-Library Science, Information Technology & Computer, 44(3), 6442–6455. [Google Scholar]
  105. Ringle, C. M., Wende, S., & Becker, J.-M. (2022). SmartPLS 4. SmartPLS GmbH. [Google Scholar]
  106. Robert, D., & John, R. (1982). Store atmosphere: An environmental psychology approach. Journal of Retailing, 58(1), 34–57. [Google Scholar]
  107. Rönkkö, M., & Ylitalo, J. (2011, December 4–7). PLS marker variable approach to diagnosing and controlling for method variance. International Conference on Information Systems, ICIS 2011, Shanghai, China. [Google Scholar]
  108. Santos, M. J. C., & Meléndez, A. P. (2016). The role of satisfaction in cultural activities’ word-of-mouth. A case study in the Picasso Museum of Málaga (Spain). Tourism & Management Studies, 12(1), 145–152. [Google Scholar]
  109. Sarstedt, M., Radomir, L., Moisescu, O. I., & Ringle, C. M. (2022). Latent class analysis in PLS-SEM: A review and recommendations for future applications. Journal of business research, 138, 398–407. [Google Scholar] [CrossRef]
  110. Seger-Guttmann, T., & Gilboa, S. (2023). The role of a safe service environment in tourists’ trust and behaviors–the case of terror threat. Journal of Hospitality and Tourism Management, 55, 187–197. [Google Scholar] [CrossRef]
  111. Sekaran, U., & Bougie, R. (2020). Research methods for business: A skill-building approach. John Wiley & Sons, Inc. [Google Scholar]
  112. Seyfi, S., Rasoolimanesh, S. M., Vafaei-Zadeh, A., & Esfandiar, K. (2021). Can tourist engagement enhance tourist behavioural intentions? A combination of PLS-SEM and fsQCA approaches. Tourism Recreation Research, 49(1), 63–74. [Google Scholar] [CrossRef]
  113. Sharma, P. N., Liengaard, B. D., Hair, J. F., Sarstedt, M., & Ringle, C. M. (2022). Predictive model assessment and selection in composite-based modeling using PLS-SEM: Extensions and guidelines for using CVPAT. European Journal of Marketing, 57(6), 1662–1677. [Google Scholar] [CrossRef]
  114. Shmueli, G., Sarstedt, M., Hair, J. F., Cheah, J.-H., Ting, H., Vaithilingam, S., & Ringle, C. M. (2019). Predictive model assessment in PLS-SEM: Guidelines for using PLSpredict. European Journal of Marketing, 53(11), 2322–2347. [Google Scholar] [CrossRef]
  115. Shome, S. (2021). Intentions to use travel eWOM: Mediating role of Indian urban millennials’ attitude. International Journal of Tourism Cities, 7(3), 640–661. [Google Scholar]
  116. Shook, C. L., Adams, G. L., Ketchen, D. J., & Craighead, C. W. (2009). Towards a “theoretical toolbox” for strategic sourcing. Supply Chain Management: An International Journal, 14(1), 3–10. [Google Scholar] [CrossRef]
  117. Sigala, M., Airey, D., Jones, P., & Lockwood, A. (2000). The diffusion and application of multimedia technologies in the tourism and hospitality industries. In Information and communication technologies in tourism 2000 (pp. 396–407). Springer. [Google Scholar]
  118. Silaban, P. H., Chen, W.-K., Sormin, S., BP Panjaitan, Y. N., & Silalahi, A. D. K. (2023). How does electronic word of mouth on Instagram affect travel behaviour in Indonesia: A perspective of the information adoption model. Cogent Social Sciences, 9(1), 2163525. [Google Scholar] [CrossRef]
  119. Silva, R. S. d., Souki, G. Q., Oliveira, A. S. d., Vieira, L. S. G., & Serra, M. (2024). Cognitive, affective and behavioural repercussions of perceived quality in tourism vocational education: Insights from self-determination theory. International Journal of Educational Management, 38(6), 1710–1734. [Google Scholar] [CrossRef]
  120. Simasathiansophon, N., Jotikasthira, C., Onputtha, S., & Tiwasing, A. (2020). Tourist’s decision to travel to Thai cultural tourism destination in central part of Thailand. E3s Web of Conferences, 164, 10002. [Google Scholar] [CrossRef]
  121. Sitar-Taut, D.-A., & Mican, D. (2021). Mobile learning acceptance and use in higher education during social distancing circumstances: An expansion and customization of UTAUT2. Online Information Review, 45(5), 1000–1019. [Google Scholar] [CrossRef]
  122. Soliman, M., Ali, R. A., Khalid, J., Mahmud, I., & Ali, W. B. (2024). Modelling continuous intention to use generative artificial intelligence as an educational tool among university students: Findings from PLS-SEM and ANN. Journal of Computers in Education, 12(1), 1–32. [Google Scholar] [CrossRef]
  123. SOUTH, D. (2017). Cultural tourism and ecotourism in the three southern border provinces. Available online: https://thailand.prd.go.th/ewt_news.php?nid=4891&filename=index (accessed on 31 October 2021).
  124. Stylidis, D., & Quintero, A. M. D. (2022). Understanding the effect of place image and knowledge of tourism on residents’ attitudes towards tourism and their word-of-mouth intentions: Evidence from Seville, Spain. Tourism Planning & Development, 19(5), 433–450. [Google Scholar]
  125. Su, D. N., Nguyen, N. A. N., Nguyen, Q. N. T., & Tran, T. P. (2020). The link between travel motivation and satisfaction towards a heritage destination: The role of visitor engagement, visitor experience and heritage destination image. Tourism Management Perspectives, 34, 100634. [Google Scholar] [CrossRef]
  126. Sweeney, J., Payne, A., Frow, P., & Liu, D. (2020). Customer advocacy: A distinctive form of word of mouth. Journal of Service Research, 23(2), 139–155. [Google Scholar] [CrossRef]
  127. Taheri, B., Chalmers, D., Wilson, J., & Arshed, N. (2021). Would you really recommend it? Antecedents of word-of-mouth in medical tourism. Tourism Management, 83, 104209. [Google Scholar] [CrossRef]
  128. Tamuliene, V., Díaz Meneses, G., & Vilkaite-Vaitone, N. (2024). Understanding touristic accommodation choices through the lens of the theory of planned behavior. Sustainability, 16(22), 9947. [Google Scholar] [CrossRef]
  129. Tapanainen, T., Dao, T. K., & Nguyen, T. T. H. (2021). Impacts of online word-of-mouth and personalities on intention to choose a destination. Computers in Human Behavior, 116, 106656. [Google Scholar] [CrossRef]
  130. TAT. (2023). Tourism performance and projections for 2023. Available online: https://www.tourismthailand.org (accessed on 31 January 2025).
  131. Tavakol, M., & Dennick, R. (2011). Making sense of Cronbach’s alpha. International Journal of Medical Education, 2, 53. [Google Scholar] [CrossRef]
  132. Tenenhaus, M., Vinzi, V. E., Chatelin, Y.-M., & Lauro, C. (2005). PLS path modeling. Computational Statistics & Data Analysis, 48(1), 159–205. [Google Scholar]
  133. Teng, H.-Y. (2021). Can film tourism experience enhance tourist behavioural intentions? The role of tourist engagement. Current Issues in Tourism, 24(18), 2588–2601. [Google Scholar] [CrossRef]
  134. UNESCO. (2023). World heritage sites in Thailand. Available online: https://whc.unesco.org (accessed on 31 January 2025).
  135. Wang, K. (2024). Factors influencing satisfaction of chinese tourists traveling in Thailand in the new era.
  136. Wetzels, M., Odekerken-Schröder, G., & Van Oppen, C. (2009). Using PLS path modeling for assessing hierarchical construct models: Guidelines and empirical illustration. MIS Quarterly, 33(1), 177–195. [Google Scholar] [CrossRef]
  137. WTTC. (2023). Economic impact report: Thailand. Available online: https://wttc.org (accessed on 31 January 2025).
  138. Wu, H.-C., & Li, T. (2017). A study of experiential quality, perceived value, heritage image, experiential satisfaction, and behavioral intentions for heritage tourists. Journal of Hospitality & Tourism Research, 41(8), 904–944. [Google Scholar]
  139. Yang, S., Isa, S. M., Yao, Y., Xia, J., & Liu, D. (2022). Cognitive image, affective image, cultural dimensions, and conative image: A new conceptual framework. Frontiers in Psychology, 13, 935814. [Google Scholar] [CrossRef]
  140. Yasa, N., Piartrini, P., Telagawathi, N., Muna, N., Rahmayanti, P., Wardana, M., Wijaya, N. S., Ribek, P. K., & Suartina, I. (2022). The role of attitude to mediate the effect of trust, perceived behavior control, subjective norm and per-ceived quality on intention to reuse the COVID-19 website. International Journal of Data and Network Science, 6(3), 895–904. [Google Scholar] [CrossRef]
  141. Zhang, W., & Ran, H. (2024). Research on the driving mechanism of tourists’ ecological protection behavior in intangible cultural heritage sites. Frontiers in Psychology, 15, 1514482. [Google Scholar] [CrossRef]
  142. Zhong, L., Zhu, M., Li, X., Morrison, A. M., & Camilleri, M. A. (2024). What motivates international tourists’ positive word-of-mouth? The effect of individualist and collectivist cultural orientations. Tourism Review. ahead-of-print. [Google Scholar] [CrossRef]
  143. Zhou, M., & Yu, H. (2022). Exploring how tourist engagement affects destination loyalty: The intermediary role of value and satisfaction. Sustainability, 14(3), 1621. [Google Scholar] [CrossRef]
Figure 1. The proposed research framework.
Tourismhosp 06 00089 g001
Figure 2. The final research model.
Tourismhosp 06 00089 g002
Table 1. Demographic Information.
Respondents’ Profile FrequencyPercentage
Age
   18–25 years old5514.2%
   26–359223.8%
   36–4513936.0%
   46–558321.5%
   >55174.5%
Gender
   Male20553.1%
   Female18146.9%
Provinces visiting
   Pattani21555.7%
   Yala10928.2%
   Narathiwat6216.1%
Local or non-local tourist
   Local20452.8%
   Non-local18247.2%
Source of destination information
   Advertisement246.2%
   Family and friends19751.0%
   Social media16141.7%
   Others41.1%
Visiting group
   Alone256.5%
   With kids143.6%
   With friends11931.0%
   With family21656.0%
   With an organizer122.9%
Table 2. Factor loading, CR, and AVE.
ConstructsItemsLoadingsCRAVE
AttitudeAtt.10.7440.8410.570
Att.20.763
Att.30.740
Att.40.773
Experience QualityExQ.1 0.7370.8140.593
ExQ.2 0.790
ExQ.3 0.787
Perceived Behavior QualityPBQ.2 0.6330.7520.506
PBQ.40.670
PBQ.5 0.818
Physical Environment QualityPEnQ.1 0.7190.8060.510
PEnQ.2 0.758
PEnQ.3 0.686
PEnQ.5 0.691
Perceived ValuePV.10.7700.8330.625
PV.20.839
PV.30.760
Social InfluenceSI.10.7220.8060.509
SI.20.736
SI.30.690
SI.40.706
SatisfactionSat.1 0.7630.8120.590
Sat.2 0.771
Sat.3 0.770
Tourist EngagementT_Eng.1 0.6020.8980.504
T_Eng.2 0.647
T_Eng.3 0.700
T_Eng.4 0.634
T_Eng.5 0.614
T_Eng.7 0.671
T_Eng.8 0.645
T_Eng.9 0.661
T_Eng.10 0.633
T_Eng.11 0.678
T_Eng.12 0.577
T_Eng.13 0.603
T_Eng.15 0.583
TrustTut.10.6940.8300.549
Tut.20.762
Tut.30.770
Tut.40.736
WOMWom.10.7350.8300.505
Wom.2 0.716
Wom.3 0.729
Wom.4 0.727
Wom.5 0.604
Note. Items of PBQ.1, PBQ.3, PEnQ.4, T_Eng.6, and T_Eng.14 have been removed.
Table 3. Discriminant validity (HTMT).
AttitudeExperience QualityPerceived Behavior QualityPerceived ValuePhysical Environment QualitySatisfactionSocial InfluenceTourist EngagementTrustWOM
Attitude
Experience Quality0.799
Perceived Behavior Quality0.6430.656
Perceived Value0.8590.7440.559
Physical Environment Quality0.7400.8990.5710.729
Satisfaction0.8350.8220.8920.8270.839
Social Influence0.7350.7180.8180.6860.6780.650
Tourist Engagement0.8130.8990.6780.8250.8100.8340.808
Trust0.8690.8380.7230.8280.7280.7540.8610.898
WOM0.8040.8200.7190.8850.7310.8690.7440.8370.838
Table 4. Coefficient of determination.
Endogenous VariablesR Square
Attitude0.205
Satisfaction0.499
Trust0.377
WOM0.584
Table 5. Predictive power assessment using PLSpredict.
ItemsQ2predictPLS RMSELM RMSEPLS-LM
Att.10.0941.8391.7110.128
Att.20.1351.7881.792−0.004
Att.30.1141.8661.8440.022
Att.40.0921.9161.6740.242
Sat.10.2761.6470.0001.647
Sat.20.3161.5911.721−0.130
Sat.30.2741.5581.688−0.130
Tut.10.1791.7611.869−0.108
Tut.20.1961.8291.7860.043
Tut.30.2121.8291.860−0.031
Tut.40.2181.8401.903−0.063
Wom.20.2151.7141.715−0.001
Wom.30.2251.7921.922−0.130
Wom.40.2461.7281.741−0.013
Wom.50.1951.6981.717−0.019
Wom.10.2161.7641.819−0.055
Table 6. Path coefficient and hypothesis test result.
No.RelationshipStd. BetaStd Errort-Valuep Valuesf2Effect SizeVIFDecision
H1Social Influence -> Trust0.6140.0416.180.000.61large1.00supported
H2Perceived Value -> Satisfaction0.1900.072.700.000.03small2.11supported
H3Tourist Engagement -> Satisfaction0.2080.082.670.000.03small3.15supported
H4Physical Environment Quality -> Satisfaction0.1800.072.660.000.04small1.82supported
H5Experience Quality -> Satisfaction0.2620.074.010.000.07small2.07supported
H6Perceived Behavior Quality -> Attitude0.4530.0510.140.000.26large1.00supported
H7Trust -> WOM0.3550.065.520.000.14medium2.10supported
H8Satisfaction -> WOM0.2700.064.690.000.11medium1.57supported
H9Attitude -> WOM0.2640.073.960.000.07small2.34supported
Table 7. Testing model fit.
ParameterSaturated ModelEstimated Model
SRMR0.0610.066
NFI0.9180.912
Disclaimer/Publisher’s Note: The statements, opinions and data contained in all publications are solely those of the individual author(s) and contributor(s) and not of MDPI and/or the editor(s). MDPI and/or the editor(s) disclaim responsibility for any injury to people or property resulting from any ideas, methods, instructions or products referred to in the content.

