Article

Reviving from the Pandemic: Harnessing the Power of Social Media Reviews in the Sustainable Tourism Management of Group Package Tours

1
CBL Bristol Business School, University of the West of England, Bristol BS16 1QY, UK
2
College of Business, Abu Dhabi University, Abu Dhabi 59911, United Arab Emirates
3
UniSA Business, City West Campus (Y4-35), University of South Australia, Adelaide, SA 5001, Australia
*
Author to whom correspondence should be addressed.
Tour. Hosp. 2025, 6(1), 41; https://doi.org/10.3390/tourhosp6010041
Submission received: 21 January 2025 / Revised: 19 February 2025 / Accepted: 24 February 2025 / Published: 3 March 2025

Abstract

:
During the COVID-19 pandemic, the tourism sector encountered multiple challenges. Numerous governments chose to lock down their cities and countries. Despite this, many companies found their online businesses making the greatest leaps in their portfolios, and social media platforms became one of the most valuable sources of information for purchase decisions. There have been numerous studies on the effects of social media reviews—a form of electronic word-of-mouth (eWOM)—on consumer behavior. Few were found to be related to their impact on group package tours (GPTs) while considering mixed eWOM, that is, both the positive and negative forms present in word-of-mouth communication. As the tourism sector gradually revives, the need to further explore how tourism and hospitality service providers can adapt to changes in post-pandemic consumer behavior has become imperative. The influence of social media reviews on consumers’ value perceptions of a GPT to Japan, allowing for the influence of the marketing mix element of advertised price, was examined through online experiments in this study. Positive, negative, and mixed eWOM were examined. It was found that eWOM was more influential on consumers’ value perceptions than the advertised price for all price acceptability levels. Mixed eWOM was found to negatively affect consumers’ final price perceptions which override the impact of quality perceptions in value formations. The value perceptions of the GPT became less acceptable when eWOM was mixed compared to when eWOM was absent or was positive. Mixed eWOM had a negative effect on value perceptions but not as great as when negative eWOM was present, and this was consistently found to apply for all price acceptability levels of the GPT. This study’s contribution to eWOM research and implications for the post-pandemic recovery of tourism and hospitality service providers are made, together with suggested strategies using innovative technologies and communications to enhance their adaptive resilience in the new normal.

1. Introduction and Background

The COVID-19 pandemic significantly altered consumer behavior. People generally sought to minimize social contact (Long et al., 2022; Chou et al., 2020), leading to a surge in online shopping (UNCTAD, 2020). This shift was particularly pronounced in developing economies such as China and Turkey. Social media platforms have become one of the most valuable sources of information for purchase decisions. These changes are expected to outlive the pandemic. As the tourism sector gradually revives, the need to further explore how the adaptive resilience of tourism and hospitality service providers could be enhanced in the new normal has become imperative.
Analogous to more conventional marketing communications, such as personal selling and advertising, word-of-mouth (WOM) can be considered a kind of marketing communication, despite it being shared among consumers either in verbal or written format. It is generally perceived by consumers as more credible, strong in communicating the experience qualities of services, and is thus helpful for consumers’ evaluations (Kushcheva & Eilola, 2023; Mani et al., 2023; Zare et al., 2023; Pawar, 2022; Choi, 2022; Tien et al., 2019; Basri et al., 2016; Hennig-Thurau et al., 2015).
Aprilia and Kusumawati (2021) demonstrate the crucial function of positive eWOM in boosting traffic, fostering confidence in traveling destinations, building a favorable destination perception, and lowering promotional expenses. As information about destinations was gathered from eWOM, it substantially elevated traveling satisfaction, positive disconfirmation, and intents to return (Chang & Wang, 2019). Several comparable studies confirm consumers’ usage of eWOM for information about destinations, hotels, restaurants, and other tourism-related amenities, and this informs their choice processes (Loncaric et al., 2016; Singh & Kathuria, 2019).
This study aimed to explore the way electronic word-of-mouth (eWOM), in the form of social media reviews, and the antecedents of price and quality perceptions may influence the perceptions of value in different eWOM conditions. The perceptions of value are known to influence, and be the antecedents of, attitude formations and purchase intentions (Ding & Romainoor, 2022; Ho et al., 2022; Yu & Lee, 2019; Lacroix & Jolibert, 2017; Vinijcharoensri, 2016; Wu & Chang, 2016; Chena et al., 2012), but few studies of eWOM have included its effects on value perceptions. Therefore, to increase our understanding of the way eWOM may influence the purchase decisions that consumers make, we would like to look at changes in the value construct in response to various manifestations of eWOM.
Favorable reviews are shown to add to the performance of restaurants and hotels (Phillips et al., 2015; Vermeulen & Seegers, 2009). Empirical analyses show that positive (negative) eWOM has a positive (negative) influence on the recipient’s brand purchase probability (Vázquez-Casielles et al., 2013). The moderating factors in this relationship are the nature of the market and the degree to which consumers seek advice (East et al., 2016), but the general overall influence of eWOM valence on purchase probability stays the same. Most studies of eWOM only investigate the impact of positive or negative word-of-mouth (Banerjee & Chua, 2019; Rosario et al., 2016). EWOM being inconsistent is a common situation. Wang (2011) and the study reported here address this shortcoming.
There have been numerous studies on social media reviews, but few were found to be related to their impact on group package tours (GPTs). The role of eWOM in consumers’ value perceptions in the buying decision process for a GPT is the focus of this study. We conduct this study in the context of the decision process for buying a GPT to a popular destination. This is the first study to address the influence of eWOM on value perceptions in this process.
As a classic marketing mix element, advertised price has been a crucial factor in affecting customer acquisition. In the post-COVID-19 pandemic era, various members in the tourism supply chain have adopted a low-price strategy to encourage consumers to use their services (Catur Widayati et al., 2023; Czerny et al., 2021; Chen et al., 2022; Adinolfi et al., 2021). This study will also investigate how social media reviews interact with the effects of pricing on consumers’ value perceptions and its major antecedents. Dividing market offerings into either a good or a service is artificial (Vargo & Lusch, 2004). Therefore, our findings can be expected to apply to other markets in general.

Objectives and Significance of This Study

This study aimed to investigate how eWOM, in terms of social media reviews, may affect the perceptions of value for a GPT. We conduct this via examining the effects of two antecedents of value, price, and quality perceptions. In this examination, we allow for the influences of price acceptability levels among consumers. To determine price acceptability for potential purchasers of the GPT, we conducted an experiment based on a proposed GPT in Japan. The Research Questions for this study are as follows:
  • How are positive, negative, and inconsistent or “mixed” (both positive and negative present simultaneously) eWOM associated with consumers’ perceptions of value for a GPT?
  • What influence does eWOM have on the effects of the acceptability level of price on value perceptions for a GPT?
This research assesses for the first time the effects of negative versus positive eWOM on the important antecedents of perceived value, thus contributing to theory development. The results of this research can help others to add further elements in the development of a model of consumer choice for a tour service.
This study is also one of the first studies that empirically examines the moderating effects of eWOM on the marketing variable, advertised price, and its influence on value perceptions. This has practical implications for service providers.

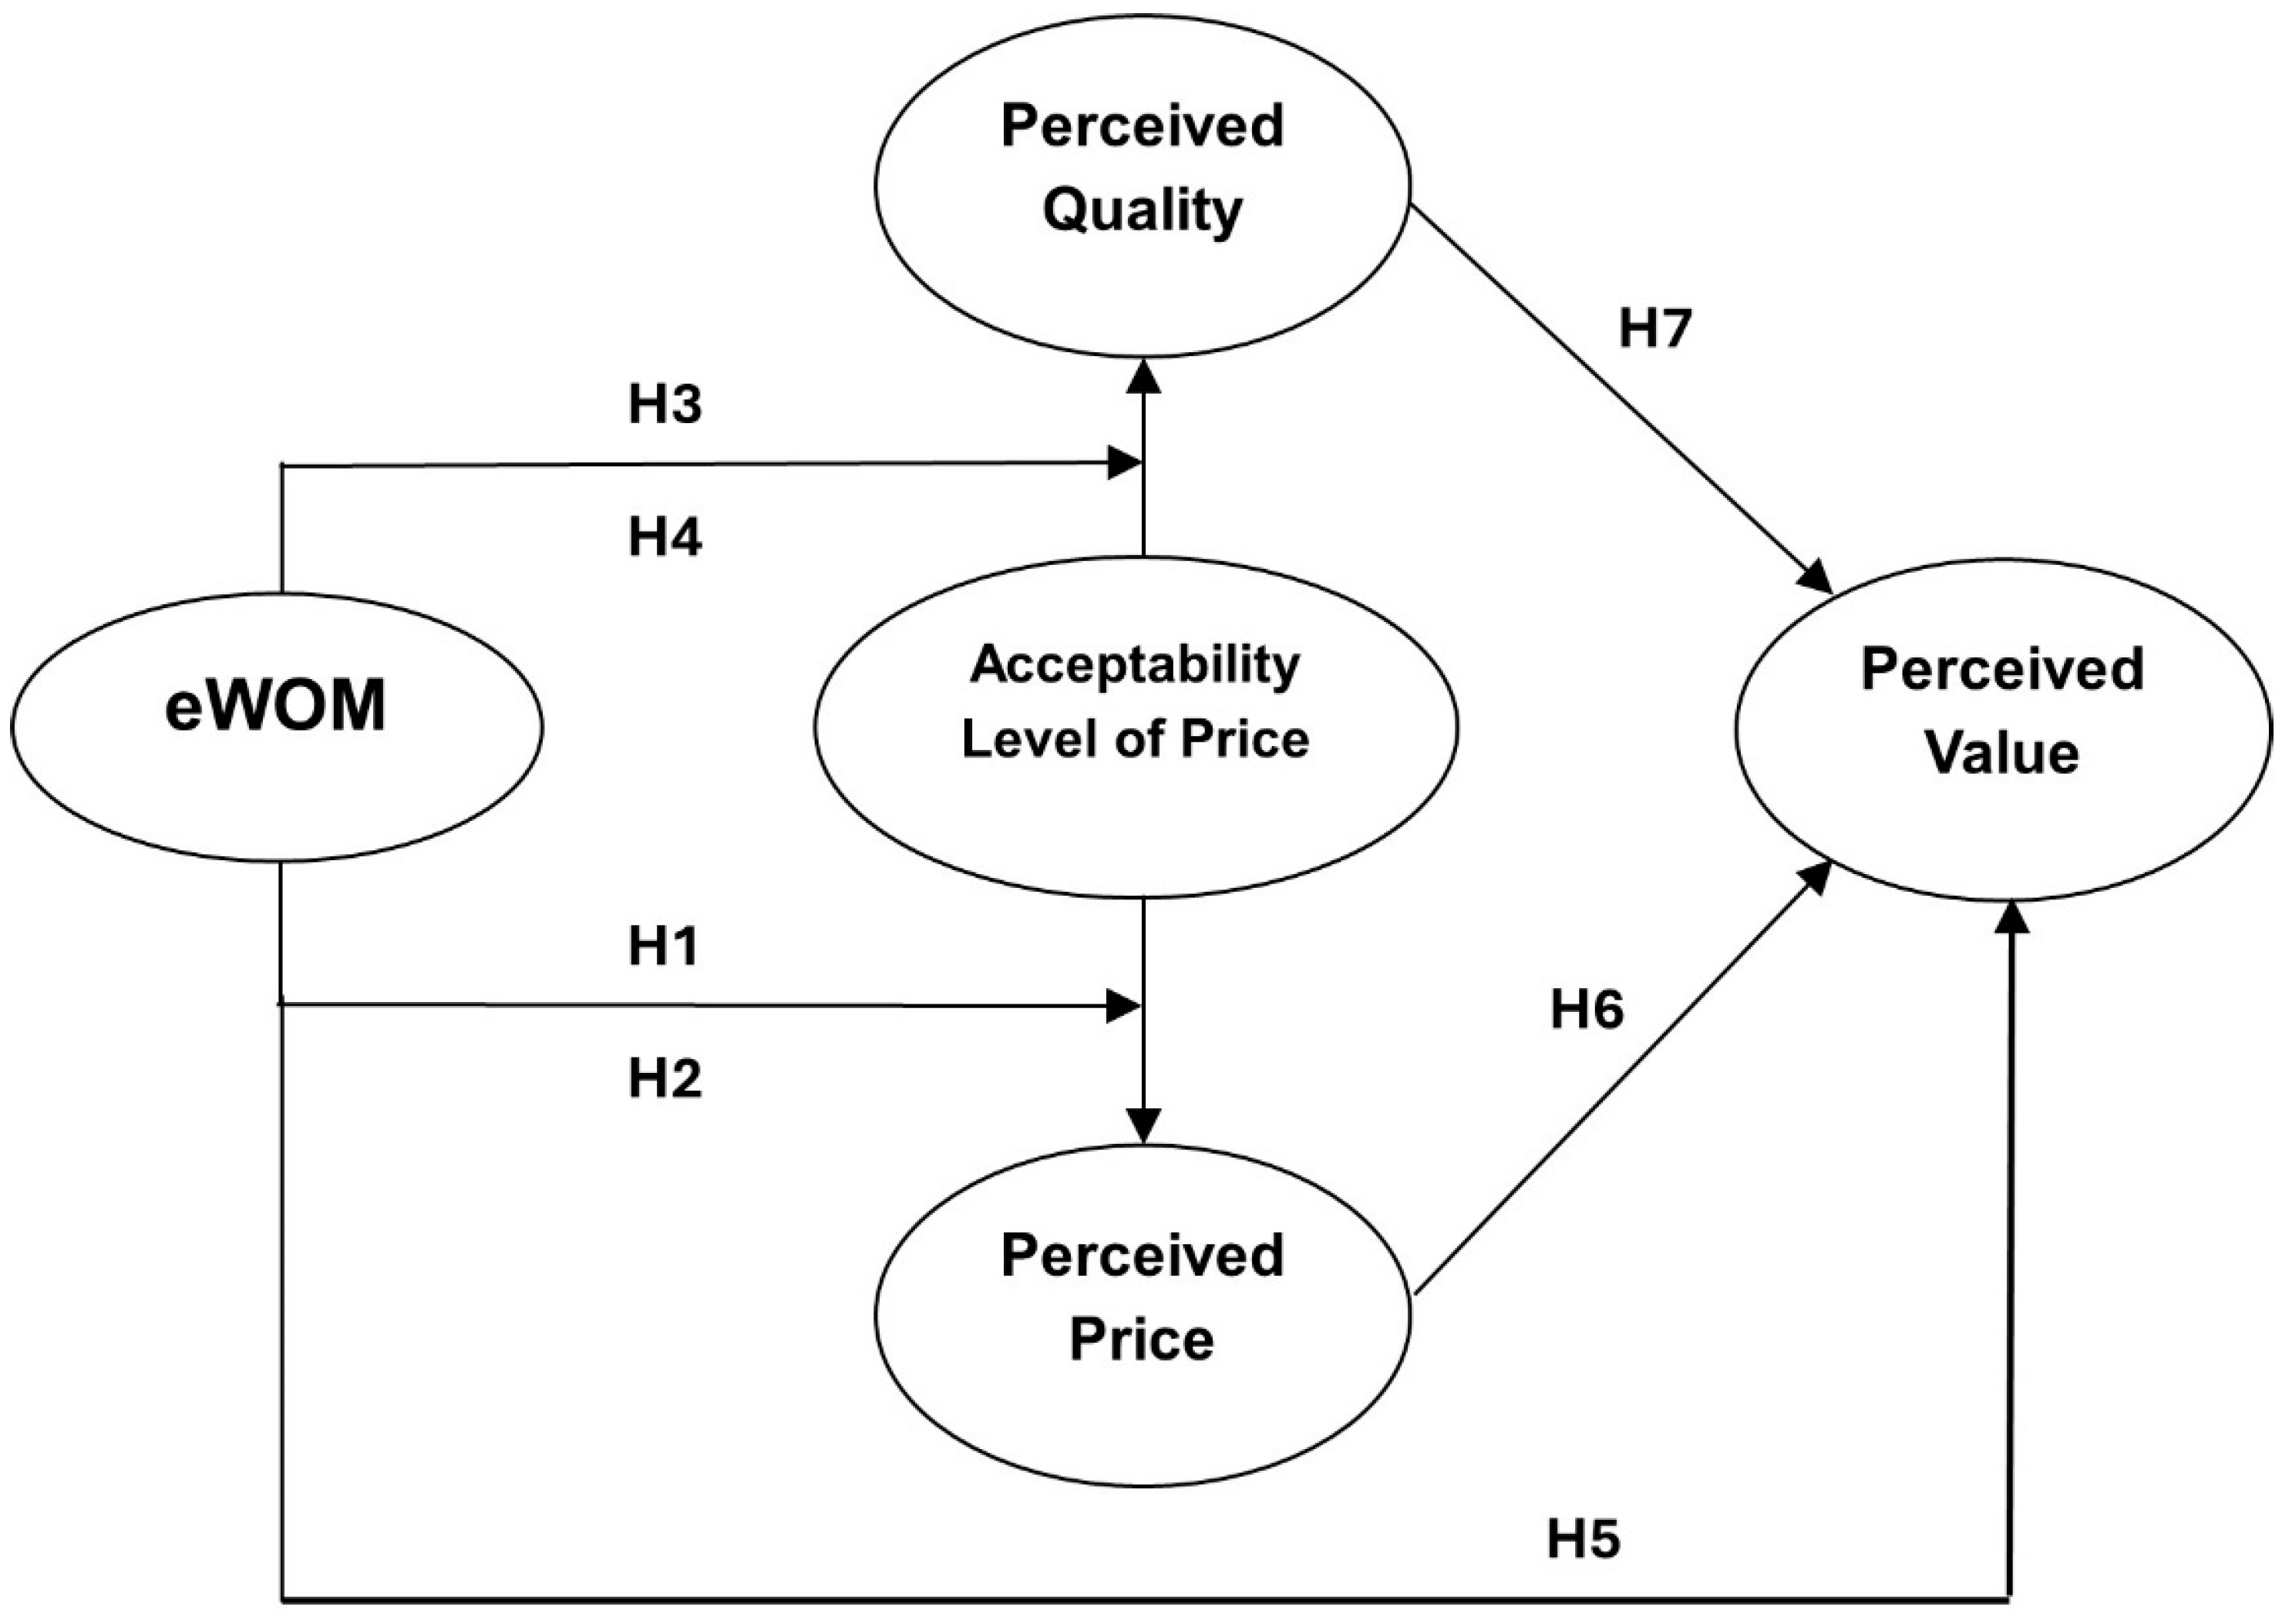
2. Literature Review and Hypothesis Development

2.1. Electronic Word-of-Mouth (eWOM)

The definition of word-of-mouth (WOM) in the literature is multifaceted. Arndt (1967) defines WOM as “oral, person-to-person communication between a perceived non-commercial communicator and a receiver concerning a brand, product, or service offered for sale.” Other researchers, such as Westbrook (1987), define WOM more broadly as “all informal communications directed at other consumers about the ownership, usage, or characteristics of particular goods or their sellers.” In a similar vein, Bone (1992) conceptualizes WOM as “an exchange of comments, thoughts, and ideas among individuals, none of whom represents a marketing source.” Anderson (1998) further defines WOM as “informal communications between private parties concerning the evaluation of products and services.” However, Buttle (1998) acknowledges the prevalence of companies incentivizing consumer’s WOM. Therefore, he suggests distinguishing between genuine WOM, which originates from independent sources, and incentivized WOM, which may be influenced by corporate interests.
Liu et al. (2021) underscores the important role of eWOM in shaping consumer travel decisions. Consumers increasingly depend on eWOM when selecting destinations, hotels, and restaurants and actively sharing their travel experiences. This trend has not gone unnoticed by tourism practitioners, as demonstrated by Verma and Yadav (2021). They emphasize the emerging interest of practitioners in leveraging eWOM to gain valuable insights into consumer behavior and preferences. The rise of eWOM can be attributed to developments in internet technology, the popularity of e-commerce, and the widespread use of social media platforms.
For the present study, WOM communications are defined as all interpersonal communications regarding products or services where the recipient considers the source as impartial and independent of the product or service under consideration. In our study, WOM is operationalized as occurring online and is part of the stream of eWOM research. Recent research has included social media reviews of products and services as eWOM (Ye et al., 2011), and we adopt this convention.

2.2. Perceived Value

There are also various models of value. Some are uni-dimensional (e.g., Zeithaml, 1988), whereas others argue that value is multi-dimensional in nature (e.g., Mathwick et al., 2001, 2002; Sweeney & Soutar, 2001). According to various researchers, the “value” concept has gradually developed throughout the years: (1) the benefit approach (e.g., Woodruff, 1997; Woodruff & Gardial, 1996; de Ruyter et al., 1997) and (2) the give–get trade-off approach are two examples (e.g., Slater & Narver, 2000; Teas & Agarwal, 2000; Zeithaml, 1988). This study investigates consumers’ perceived value, recognizing the trade-off between sacrifice and expected benefits (Srivastava & Thaichon, 2022; Kunkel et al., 2017; Boksberger & Melsen, 2011; Sánchez-Fernández & Iniesta-Bonillo, 2007; Lin et al., 2005; Gabbott, 2004; Lai, 1995; Zeithaml, 1988). Specifically, Zeithaml’s study (Zeithaml, 1988, p. 14) shows that the value construct may be summarized as “the customer’s overall assessment of the utility of a product based on perceptions of what is received and what is given.” It appears that Zeithaml captures the essence of most previous definitions of perceived value. It is therefore adopted in the present study.

2.3. Acceptability Level of Price and Final Perceived Price

The subjective representation of price internal to a consumer can be obtained from the perception of the advertised price, thus resulting in some meaning (e.g., expensive or inexpensive) to the consumer. It then becomes the consumer’s final perceived price (Jacoby & Olson, 1977)—a major antecedent of value.
Very often, consumers have a range of prices they consider acceptable (Erdmann et al., 2023; Jakuba et al., 2022; Sar, 2022). Previous behavioral pricing research shows that some consumers have lower and upper price thresholds in purchase decision-making (Marshall & Bee Leng, 2002; Han et al., 2001; Kalwani & Yim, 1992; Monroe, 1990; Monroe & Petroshius, 1981; Kalyanaram & Winer, 1995; Mazumdar & Jun, 1992). Thanks to advances in information technology and the transparency of price information on the internet, consumers can arrive at a perceived price for an online service offer that is more acceptable to them. This will be the case where the price has decreased from a level beyond their expectation but not at a level that is below their expectation. This study investigates how eWOM influences the final perceived price across three levels of the initial acceptability of the advertised price: below, within, and beyond consumer expectations.

2.4. The Moderating Effects of eWOM on the Influence of Price Acceptability Levels and Its Negativity Effect on Consumers’ Final Price Perceptions

Drawing from Prospect Theory (Kahneman & Tversky, 1979), we understand that decision-making often involves weighing potential gains against the risk of loss, with individuals exhibiting greater sensitivity to the latter. Consumers find that the risk of disappointing services can be lowered by making reference to relevant eWOM, and a trip can be planned quicker (Singh & Kathuria, 2019). According to Liang and Corkindale (2016), the strength of eWOM that consumers perceive for an online service offer relates negatively with their risk perception of the service for all price acceptability levels. They also show that, for all price acceptability levels, consumers’ risk perceptions increase when mixed eWOM is available, compared to eWOM being absent and the eWOM condition being positive. This risk element is included by many marketers to explain how consumers view price (Roy & Ortiz, 2023; Pascual, 2022; Liang & Corkindale, 2019). Consumers evaluate purchases not only based on the advertised price but also on potential future costs or consequences (Benavides Franco et al., 2022; Aurylaitè & Correia, 2022). This consideration significantly impacts how consumers perceive the stated price.
Previous research has shown a lower price sensitivity would be given by an increase in non-price-focused advertising for a brand (e.g., Sethuraman & Tellis, 2002). eWOM can be seen as a form of marketing communication that helps consumers anticipate future outcomes. A positive relationship can be expected between the valences of eWOM and consumers’ final price perceptions irrespective of their initial acceptability of the advertised price. The findings indicate that when mixed eWOM (both positive and negative) is available, regardless of the initial price acceptability level, consumers perceive the price as less acceptable compared to situations with only positive eWOM or no eWOM at all (Liang & Corkindale, 2019). In the context of a GPT, eWOM can be expected to moderate the influence of price acceptability levels on consumers’ final price perceptions, and a negative bias emerges in the mixed eWOM condition. From the above, the following hypotheses can be made:
Hypothesis 1 (H1):
The valence of eWOM perceived by a consumer about a GPT relates positively to the consumer’s price perceptions of the GPT in the presence of all price acceptability levels.
Hypothesis 2 (H2):
For all price acceptability levels, the impact of negative eWOM on consumers’ price perceptions for a GPT is greater than that produced by positive eWOM when both positive and negative eWOM are present.

2.5. Perceived Quality

Perceived quality differs from actual product quality. It is a broader, more subjective evaluation rather than a measure of specific attributes. In essence, it is a holistic assessment akin to an attitude. While perceived quality reflects a consumer’s subjective experience with a product, objective quality focuses on quantifiable factors such as material quality, manufacturing process, workmanship, design, and esthetics (Garvin, 1987, 1983; Jacoby & Olson, 1985). As defined by Zeithaml (1988), perceived quality refers to consumers’ perception of a product’s aggregate outstanding performance or supremacy. This convention is adopted in the present study.

2.6. The Moderating Effects of eWOM on the Influence of Price Acceptability Levels on Consumers’ Quality Perceptions

Recent studies (e.g., Roy et al., 2020; King et al., 2014; Mortimer & Pressey, 2013; Shen et al., 2012; King et al., 2014) have indicated that word-of-mouth (WOM) influences how customers perceive the quality of a service—another major antecedent of value. Blal and Sturman (2014) found that high volumes of electronic word-of-mouth (eWOM) with positive sentiment (high valence) have a strong influence on consumer perceptions of hotel service quality. Liang and Corkindale (2017) demonstrated that eWOM moderates the impact of price acceptability on perceived quality. Unlike price perceptions, where mixed eWOM generally leads to lower price acceptability, the effects of mixed eWOM on perceived quality appear to be largely neutral across all price acceptability levels. In the context of a GPT, the following is proposed:
Hypothesis 3 (H3):
The valence of eWOM perceived by a consumer about a GPT relates positively to the consumer’s quality perceptions of the offer in the presence of all price acceptability levels.
Hypothesis 4 (H4):
When both positive and negative eWOM are present, there is no significant difference between the influence of positive eWOM on the perceived quality of a GPT and that exerted by negative eWOM under all price acceptability levels.

2.7. The Moderating Effects of eWOM on the Influence of Price Acceptability Levels and Its Negativity Effect on Consumers’ Value Perceptions

Product evaluations and the need for purchase validation are key factors driving consumers to seek eWOM (Ngarmwongnoi et al., 2020). Vroom’s Expectancy Value Theory (Vroom, 1964) posits that individual motivation is driven by the perceived likelihood of achieving a desired outcome (expectancy) and the value placed on that outcome. Similarly, while traditionally focused on “value in exchange,” the concept of value has evolved towards “value in use” (Eggert et al., 2018). Vargo and Lusch (2008) emphasize that value is derived not from the transaction itself but from the actual use of a product or service. Anticipating future benefits, particularly when guided by positive social media reviews for first-time purchases, encourages potential customers to expect favorable outcomes.
As mentioned, perceived value can be conceptualized as a trade-off between sacrifice and expected benefits. In the travel industry, the core benefits for travelers when choosing a travel agent lies in the quality of service offered. Travelers perceive the final price as the necessary sacrifice to obtain the desired value. The more acceptable consumers find the price of the GPT, the higher the level of value that would be perceived. Likewise, the higher the quality of the offering perceived by consumers, the higher the perceived value would be. In view of H1 and H3 above, eWOM can be expected to relate positively with consumers’ value perceptions and moderate the influences of the price acceptability level on their value perceptions. In the context of a GPT, the following can be anticipated:
Hypothesis 5 (H5):
The valence of eWOM perceived by a consumer about a GPT relates positively to the consumer’s value perceptions of the offer in the presence of all price acceptability levels.
Considering H2 and H4 above, eWOM can be expected to lower consumers’ value perception mainly via its negativity influence on price perception (with quality perception remaining virtually neutral) when mixed eWOM is available for all price acceptability levels. Like eWOM’s effects on perceived price, the impact of negative eWOM on consumers’ price perceptions is expected to be greater than that produced by positive eWOM when both positive and negative eWOM are present for all price acceptability levels. From the above, the following hypotheses can be made:
Hypothesis 6 (H6):
For all price acceptability levels, the impact of negative eWOM on consumers’ value perceptions of a GPT is greater than that produced by positive eWOM when both positive and negative eWOM are present.
Hypothesis 7 (H7):
For all price acceptability levels, the effects of perceived price on the perceived value of a GPT will be larger than those imparted by perceived quality when both positive and negative eWOM are present.
Figure 1 illustrates the research framework proposed in this study.

3. Methodology

3.1. Experimental Research Design

By collecting data from respondents via a 3 (positive, negative, and mixed eWOM) × 3 (price below, within, and beyond expectation) between-subjects factorial experimental design, we tested the hypotheses. This is shown in Table 1. Letters in each cell refer to a contrived but, seemingly to respondents, real travel agent.
To simulate a realistic information environment, Information Acceleration (IA) procedures (Urban et al., 1997) were integrated into nine interactive websites designed for each of the nine comparison groups used in the experiments. These websites familiarized participants with the context of the tour service, prompting them to respond more authentically. The first part of the website presented a scenario highlighting the intangible nature of tour services and the potential risks associated with purchasing a GPT. Participants were then exposed to news articles about online travel websites featuring social media reviews of GPTs.
The second part of the website provided detailed information about the GPT, including identical itineraries offered by fictitious travel agents. This study manipulated the stated price of the travel agent’s services according to acceptable price ranges determined through an open-ended question prior to the actual experiment. For “Prices within respondents’ acceptable range,” the middle price point between the lowest and highest reported acceptable price limits was chosen. The manipulations of “Prices below respondents’ acceptable range” were conducted using price points that were 50% below the lowest allowable price limits as reported by the participants; prices that were 50% above the highest acceptable price limit were used for “Prices beyond respondents’ acceptable range.” These different price conditions were considered capable of creating sufficient differentiation in respondents’ final price perceptions.
Participants were then presented with fabricated social media reviews of the travel agent on imitated travel advice websites. These messages were largely based on real travel encounters identified in Wang et al.’s (2000) tourism study.
For the “All positive” and “All negative” experimental conditions, an equal number of eWOM messages was used. But for the mixed, “Both positive and negative present”, manipulation, half of the eWOM messages were negative and the other half positive. For each valence, the setting and emphasis of the message were identical.
Participants of an online group with an interest in traveling pre-tested the survey. Nine interactive webpages for the nine experimental groups were then designed using the revised questionnaire.

3.2. Data Collection and Sampling Method

Following the manipulations of eWOM and the advertised price, participants completed a questionnaire assessing eWOM, perceived price, perceived service quality, and perceived value using 7-point bipolar scales (Appendix A). To assess participants’ perceptions of the eWOM received, bipolar adjectives such as “good vs. bad,” “favorable vs. unfavorable,” and “positive vs. negative” were utilized (Bruner & Hensel, 1992). Participants’ subjective perceptions of the advertised price were measured using a single-item scale, assessing whether the price was perceived as acceptable, more than acceptable, or less than acceptable on a seven-point Likert scale (Al-Sabbahy et al., 2004). Perceived quality was measured using an adapted version of the SERVPERF scale (Cronin & Taylor, 1994). Finally, perceived value was measured using the acquisition value scale adapted from Al-Sabbahy et al. (2004). To ensure the successful manipulation of the experimental conditions of eWOM and price acceptability levels, additional questions for manipulation checks were included. Participants who did not answer the manipulation check questions appropriately were excluded from further analysis.
To ensure participant engagement and minimize biases, screening questions were used to select individuals who had recently traveled for leisure and expressed interest in this study’s destination (Japan). A convenience sampling method was adopted in this study given the difficulty in finding a perfect contact list of leisure travelers for drawing a random sample. Online invitations to participate were posted on nine online travel communities and emailed to leisure tourists through a direct marketing agency. A total of 198 valid responses were eventually obtained. An average of 22 completed questionnaires were received for each comparison group. Participants’ socio-demographic characteristics are summarized in Table 2 below.

3.3. Adequacy of Measurement

Table 3 presents the reliability of the measurement scales. As per Nunnally (1994), the values of both Cronbach’s Alpha (CA) and Composite Reliability (CR) should exceed the threshold of 0.7. The results indicate that this threshold for all the constructs’ CAs and CRs are met, except for price perception which employs a single-item measure. We can see that they exhibit sufficient internal consistency and reliability (Henseler et al., 2009). For convergent validity, an Average Variance Extracted (AVE) value exceeding 0.5 is required according to Bagozzi and Yi (1988). Table 3 shows that the lowest AVE in our study is 0.74. These results demonstrate the establishment of satisfactory convergent validity.
As shown in Table 4, the square roots of the AVEs of all constructs exceed inter-construct correlations. These results indicate that each construct’s items are dissimilar and show a high level of discriminant validity (Fornell & Larcker, 1981).
Drolet and Morrison (2001) have shown that trying to measure a concrete attribute by using several items likely leads to redundancy. In other words, it is not necessary to use more than a single item to measure a concrete attribute. Price perception is considered a typical example of a concrete attribute (Rossiter, 2002). It follows that using a single item is appropriate for measuring the construct of the final perceived price.
The scale item for the construct of price perception was re-tested three months after the initial data collection. Additional data collection was included for the manipulation of positive eWOM in different price acceptability levels (Comparison Groups 1, 4, and 7). According to the t-tests, there was no significant difference in the mean perceived price in the re-tests for all three comparison groups from that of the initial test data (Table 5), indicating that the measurement scale has good test–re-test reliability.

3.4. Analytic Procedures

A review on recent eWOM studies (e.g., Filieri et al., 2021; Naujoks & Benkenstein, 2020; Yan et al., 2018; Schijns & Bruggen, 2018) showed that experimental research design and inferential statistics like Analysis of Variance (ANOVA) and t-tests were commonly adopted in examining eWOM’s impact. Alternatively, as noted in the literature, a well-fitting Structural Equation Model (SEM) does not necessarily imply causal relationships between variables. For example, the directionality of the relationships (which variables influence others) may be reversed without significantly affecting the model’s fit (Raykov & Penev, 2002; Stelzl, 1983). Therefore, relying on model fit in an SEM may not be sufficient to establish causal relationships.
By adopting a research design with high internal validity like carefully administered experiments (Price et al., 2017), the present study identifies casual relationships among the variables of interest by manipulating the causes (independent variables) and then measuring the effects (dependent variables). Instead of relying on computational techniques and procedures like SEM, this study mainly employed ANOVA, post hoc Tukey tests, and t-tests to analyze and compare changes in the dependent variables. This was conducted to avoid the potential limitations of models judged to be well fitting and the inaccuracy of some commonly used rules of thumb involved in techniques like SEM (Tomarken & Waller, 2005; Nachtigall et al., 2003).

4. Findings

4.1. Effect of eWOM Versus Price Acceptability Level on Price and Quality Perceptions

Analyses were conducted across the nine comparison groups to examine participants’ price and quality perceptions. The ANOVA results revealed significant differences in mean price perceptions when both positive and negative eWOM were present compared to the following: (1) no eWOM in the same groups, (2) conditions with only positive eWOM, and (3) conditions with only negative eWOM (F (2, 191) = 64.48, p < 0.05). Tukey post hoc tests further indicated that perceived price was less acceptable when both positive and negative eWOM were available (M = 2.94, SD = 1.32) compared to conditions with only positive eWOM (M = 5.02, SD = 1.09, p < 0.05) and no eWOM (M = 4.17, SD = 1.78, p < 0.05). Price was perceived as less acceptable when only negative eWOM was present (M = 1.97, SD = 1.11) compared to the mixed eWOM condition (M = 2.94, SD = 1.32, p < 0.05).
Figure 2 shows that the mean price perceptions were found to be generally lower when both the positive and negative eWOM condition was available than when positive eWOM was available and when eWOM was absent. When price perceptions in all three eWOM conditions were plotted, negative slopes were found for all price acceptability levels. These results support H1 and H2.
For Comparison Groups 1 through 9, an ANOVA was conducted to investigate the impact of price acceptability level and eWOM on perceived quality. No significant interaction was found between eWOM and price acceptability level, F (4, 193) = 0.62, p = 0.65 (>0.05). The main effect of eWOM was found to be significant, F (2, 193) = 2416.84, p < 0.001, while that of the price acceptability level was not significant, F (2, 193) = 1.13, p = 0.33 (>0.05). This indicates that, in cases when pricing information and eWOM were available, it was eWOM that provided most of the quality information about the GPT, rather than price, providing empirical support for H3.
A further analysis revealed that, in the mixed eWOM condition (M = 3.23, SD = 0.33), participants’ mean quality judgments in Groups 3, 6, and 9 did not significantly differ from those in the eWOM absent condition (M = 3.36, SD = 0.38), t (130) = −1.79, p = 0.08. This indicates that perceived quality remained largely unaffected by the presence of both positive and negative eWOM, providing empirical support for H4. Notably, this result contrasts with that for price perceptions above.

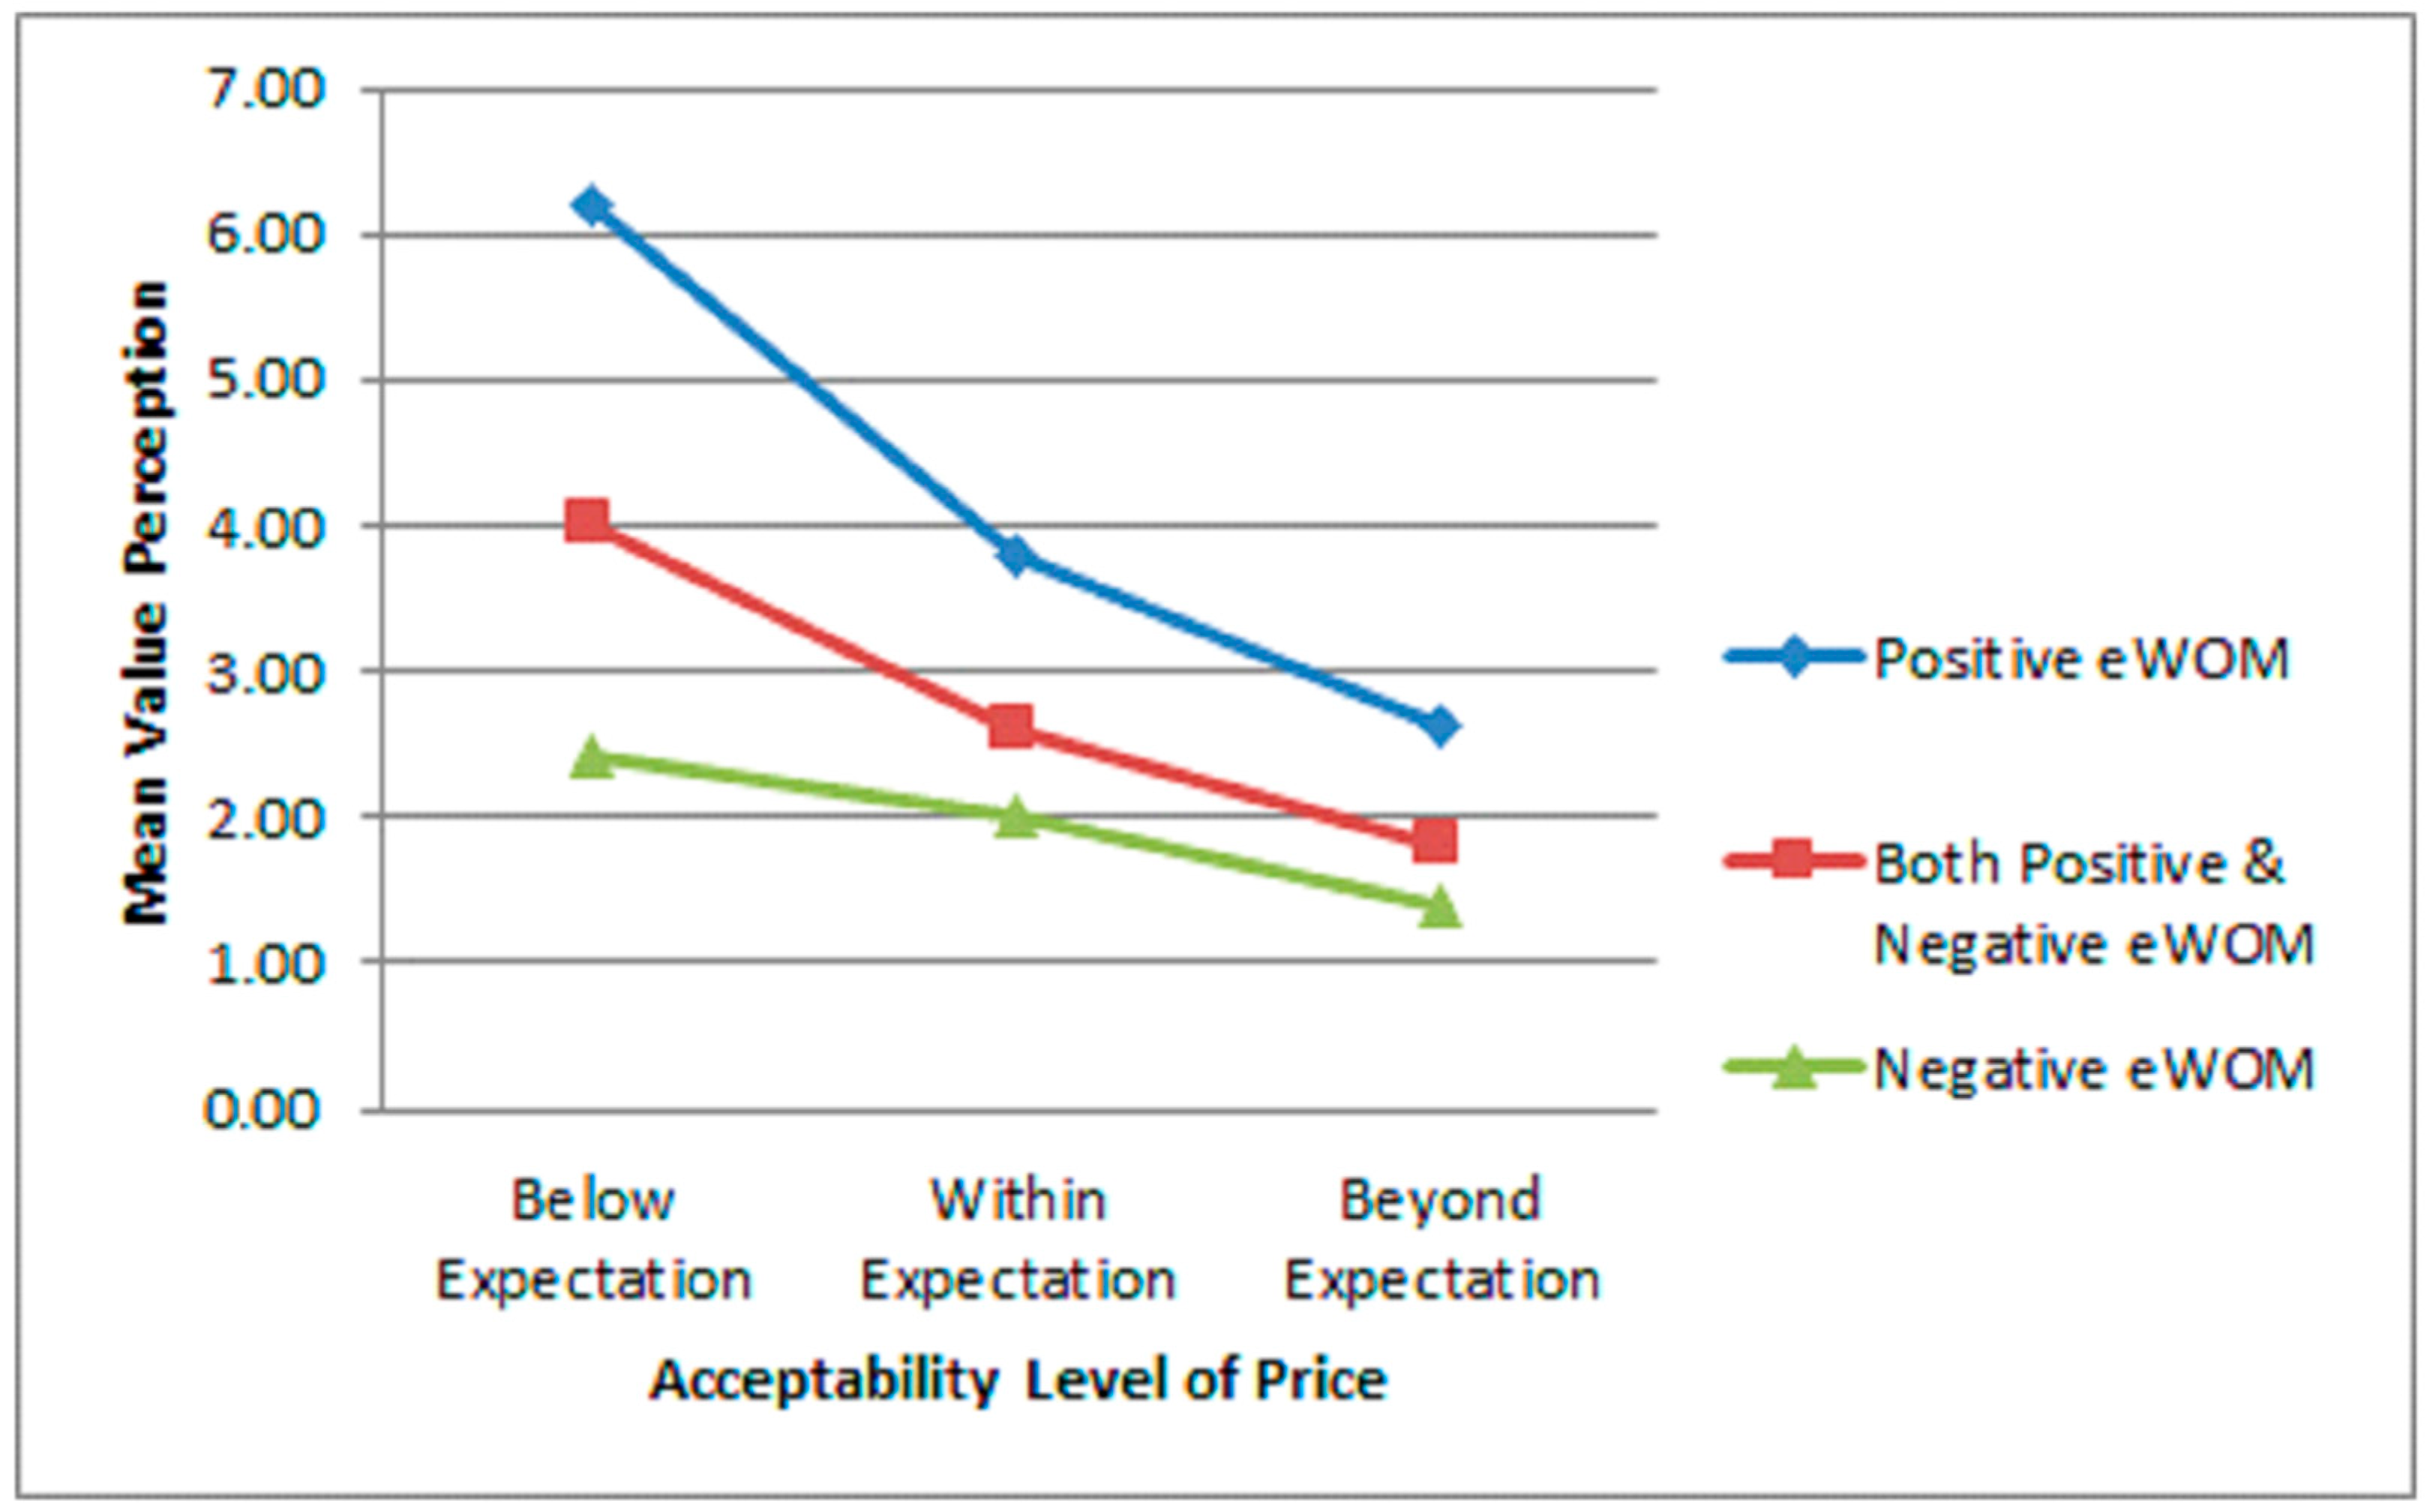
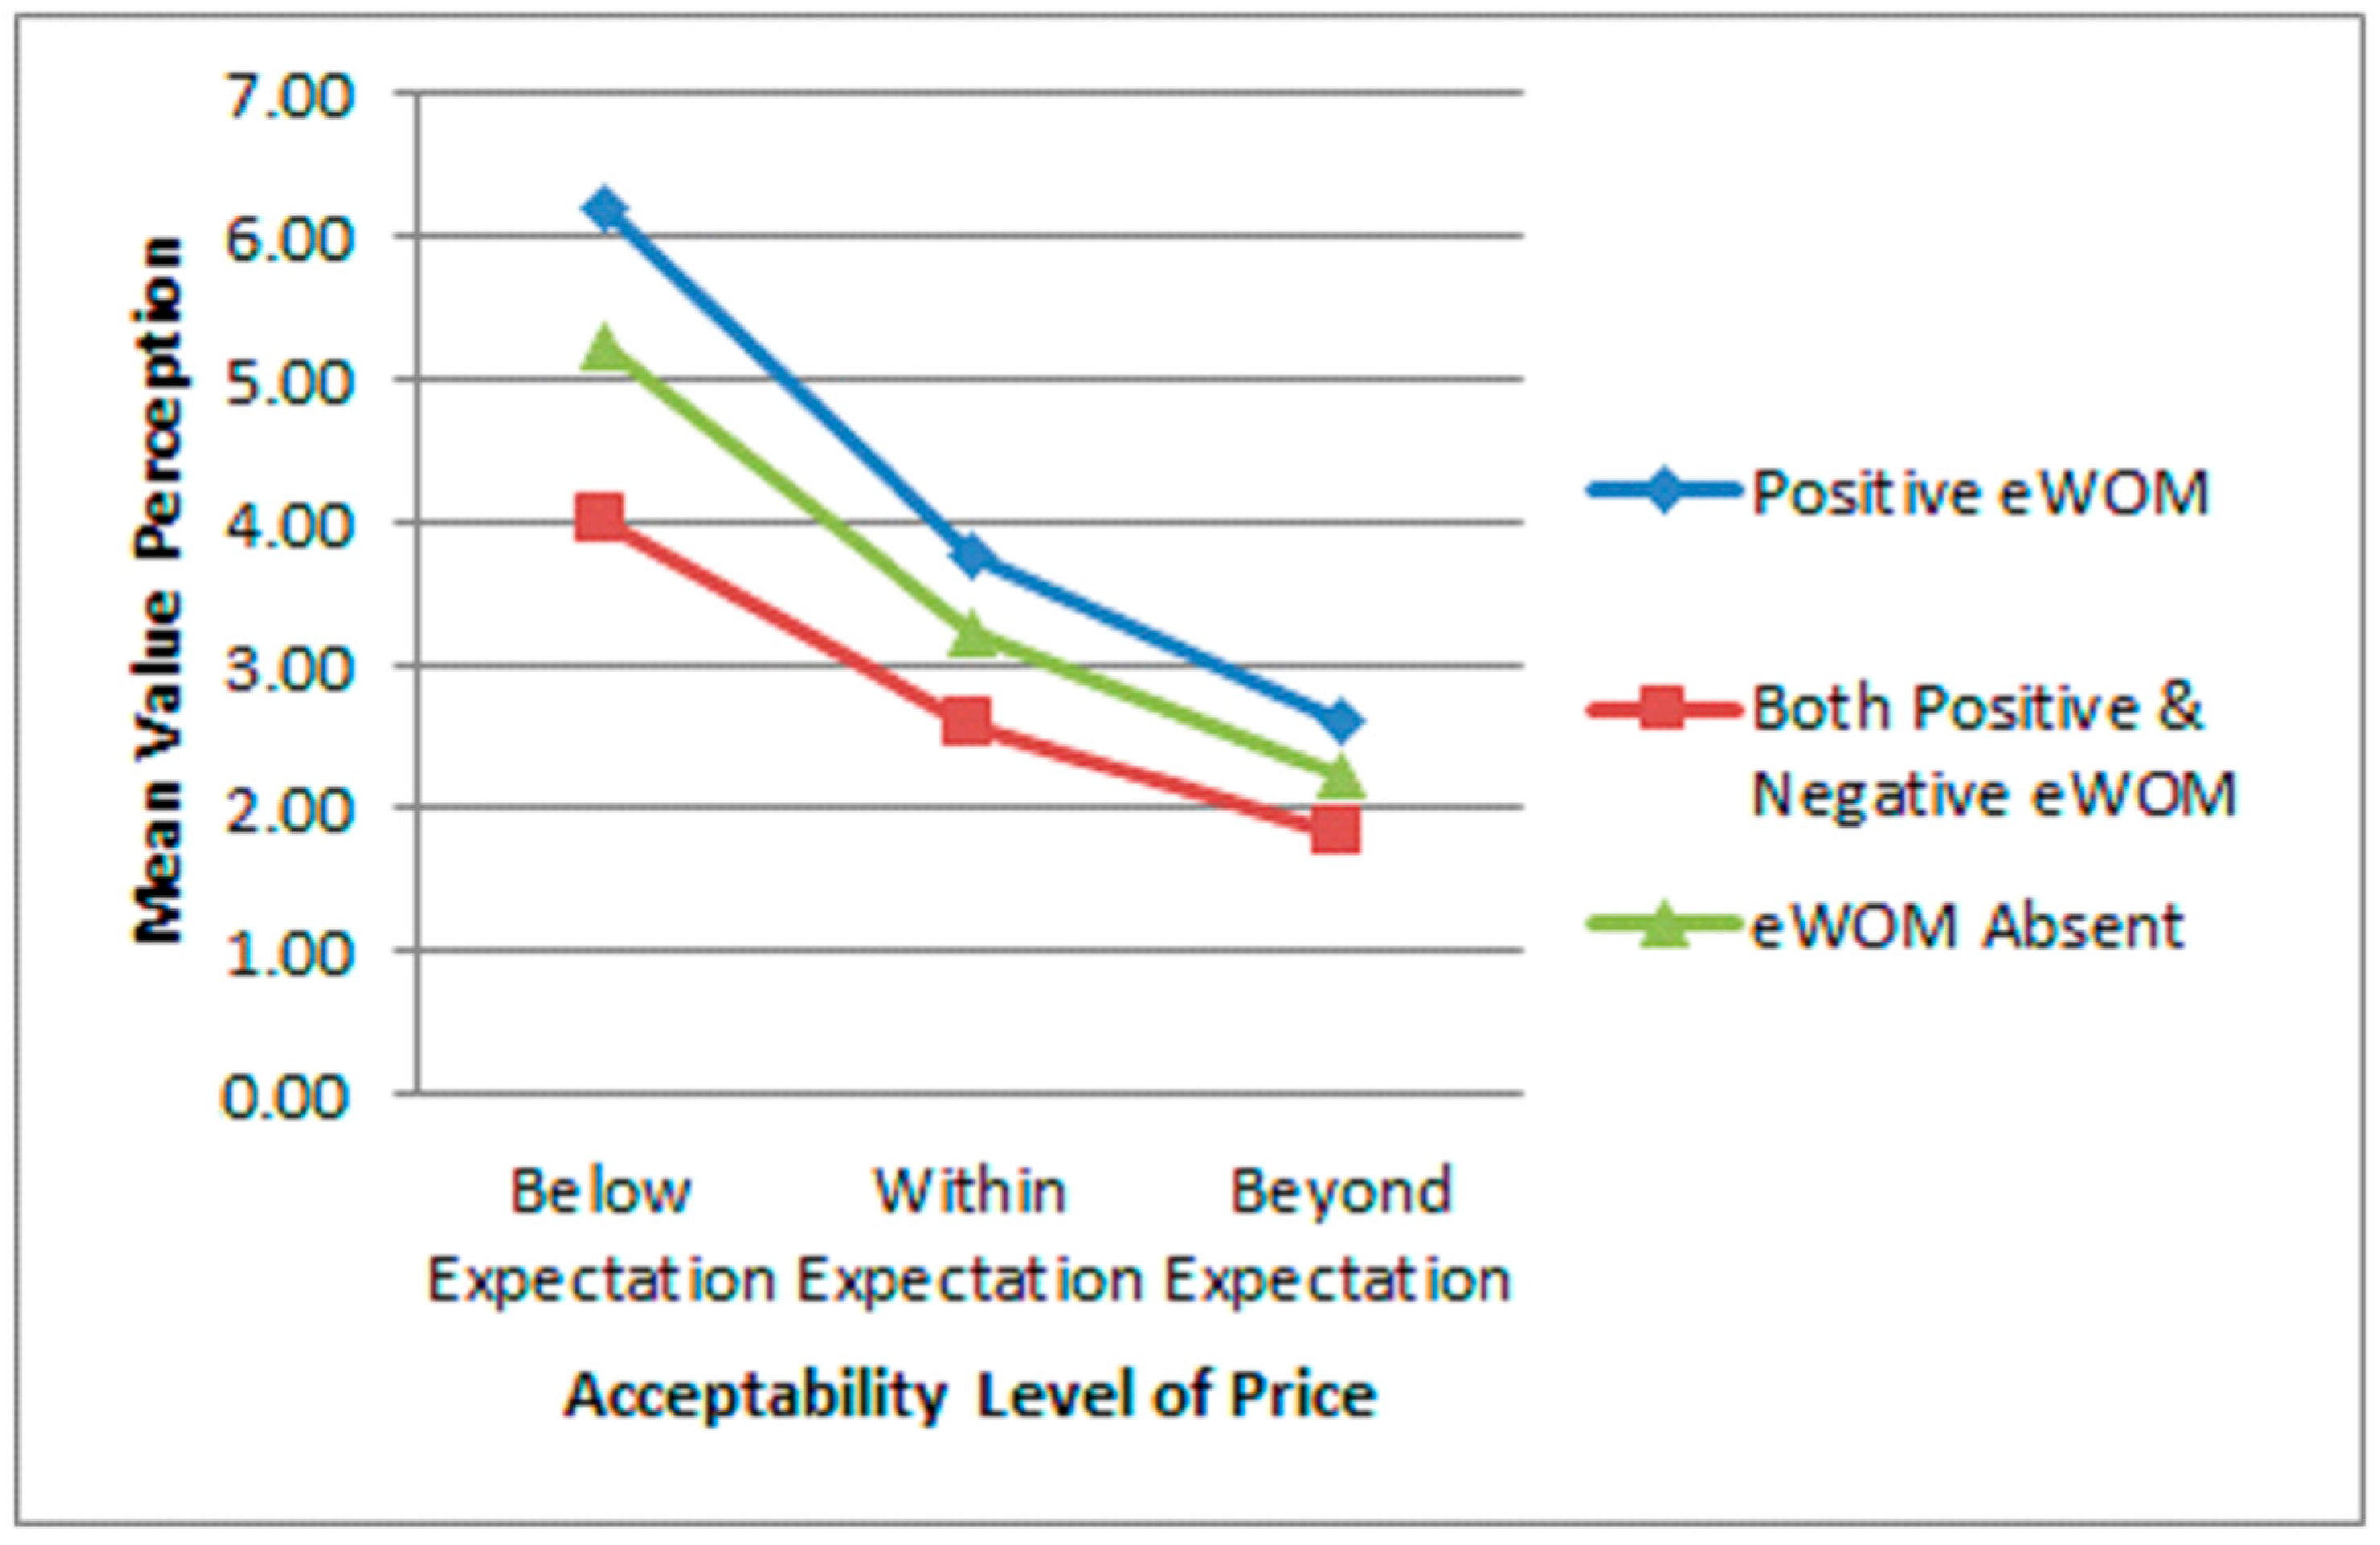
4.2. The Moderating Effects of eWOM on the Relationship Between Price Acceptability Level and Value Perception

In Comparison Group 7, a t-test revealed significantly higher perceived value in the only positive eWOM condition (M = 2.61, SD = 0.08) compared to no eWOM (M = 2.17, SD = 0.10), t (38) = 15.66, p < 0.001, d = 4.95. This difference persisted when the price acceptability level was beyond expectations in both conditions.
Conversely, in Comparison Group 2, a t-test showed significantly lower perceived value in the only negative eWOM condition (M = 2.44, SD = 0.26) compared to no eWOM (M = 5.28, SD = 0.27), t (42) = −35.89, p < 0.001, d = 10.82. This finding also held true when the price acceptability level was below expectations in both conditions. These results demonstrate that positive and negative eWOM, as distinct valences, moderate the influence of price acceptability level on perceived value.
An ANOVA comparing mean value perceptions across conditions with negative eWOM (Groups 2, 5, and 8), mixed eWOM (Groups 3, 6, and 9), and only positive eWOM (Groups 1, 4, and 7) revealed significant differences, F (2, 193) = 108.19, p < 0.05. Tukey post hoc tests showed that the perceived value was the lowest when only negative eWOM was present (M = 1.93, SD = 0.47) compared to the mixed eWOM condition (M = 2.84, SD = 0.96, p < 0.05) and the only positive eWOM condition (M = 4.26, SD = 1.54, p < 0.05) (Figure 3).
The mean value perceptions in terms of each of the three eWOM conditions and price acceptability levels are shown in Figure 4. The value of the GPT was generally perceived to be lower in the mixed eWOM condition than when positive eWOM was available, though it was not as low as when negative eWOM was available. This is true for all three price acceptability levels. In addition, when the price acceptability level increased from below the level of expectation to beyond the level of expectation, the mean value perception scores generally decreased. This is true for all three eWOM conditions, providing support for H5.

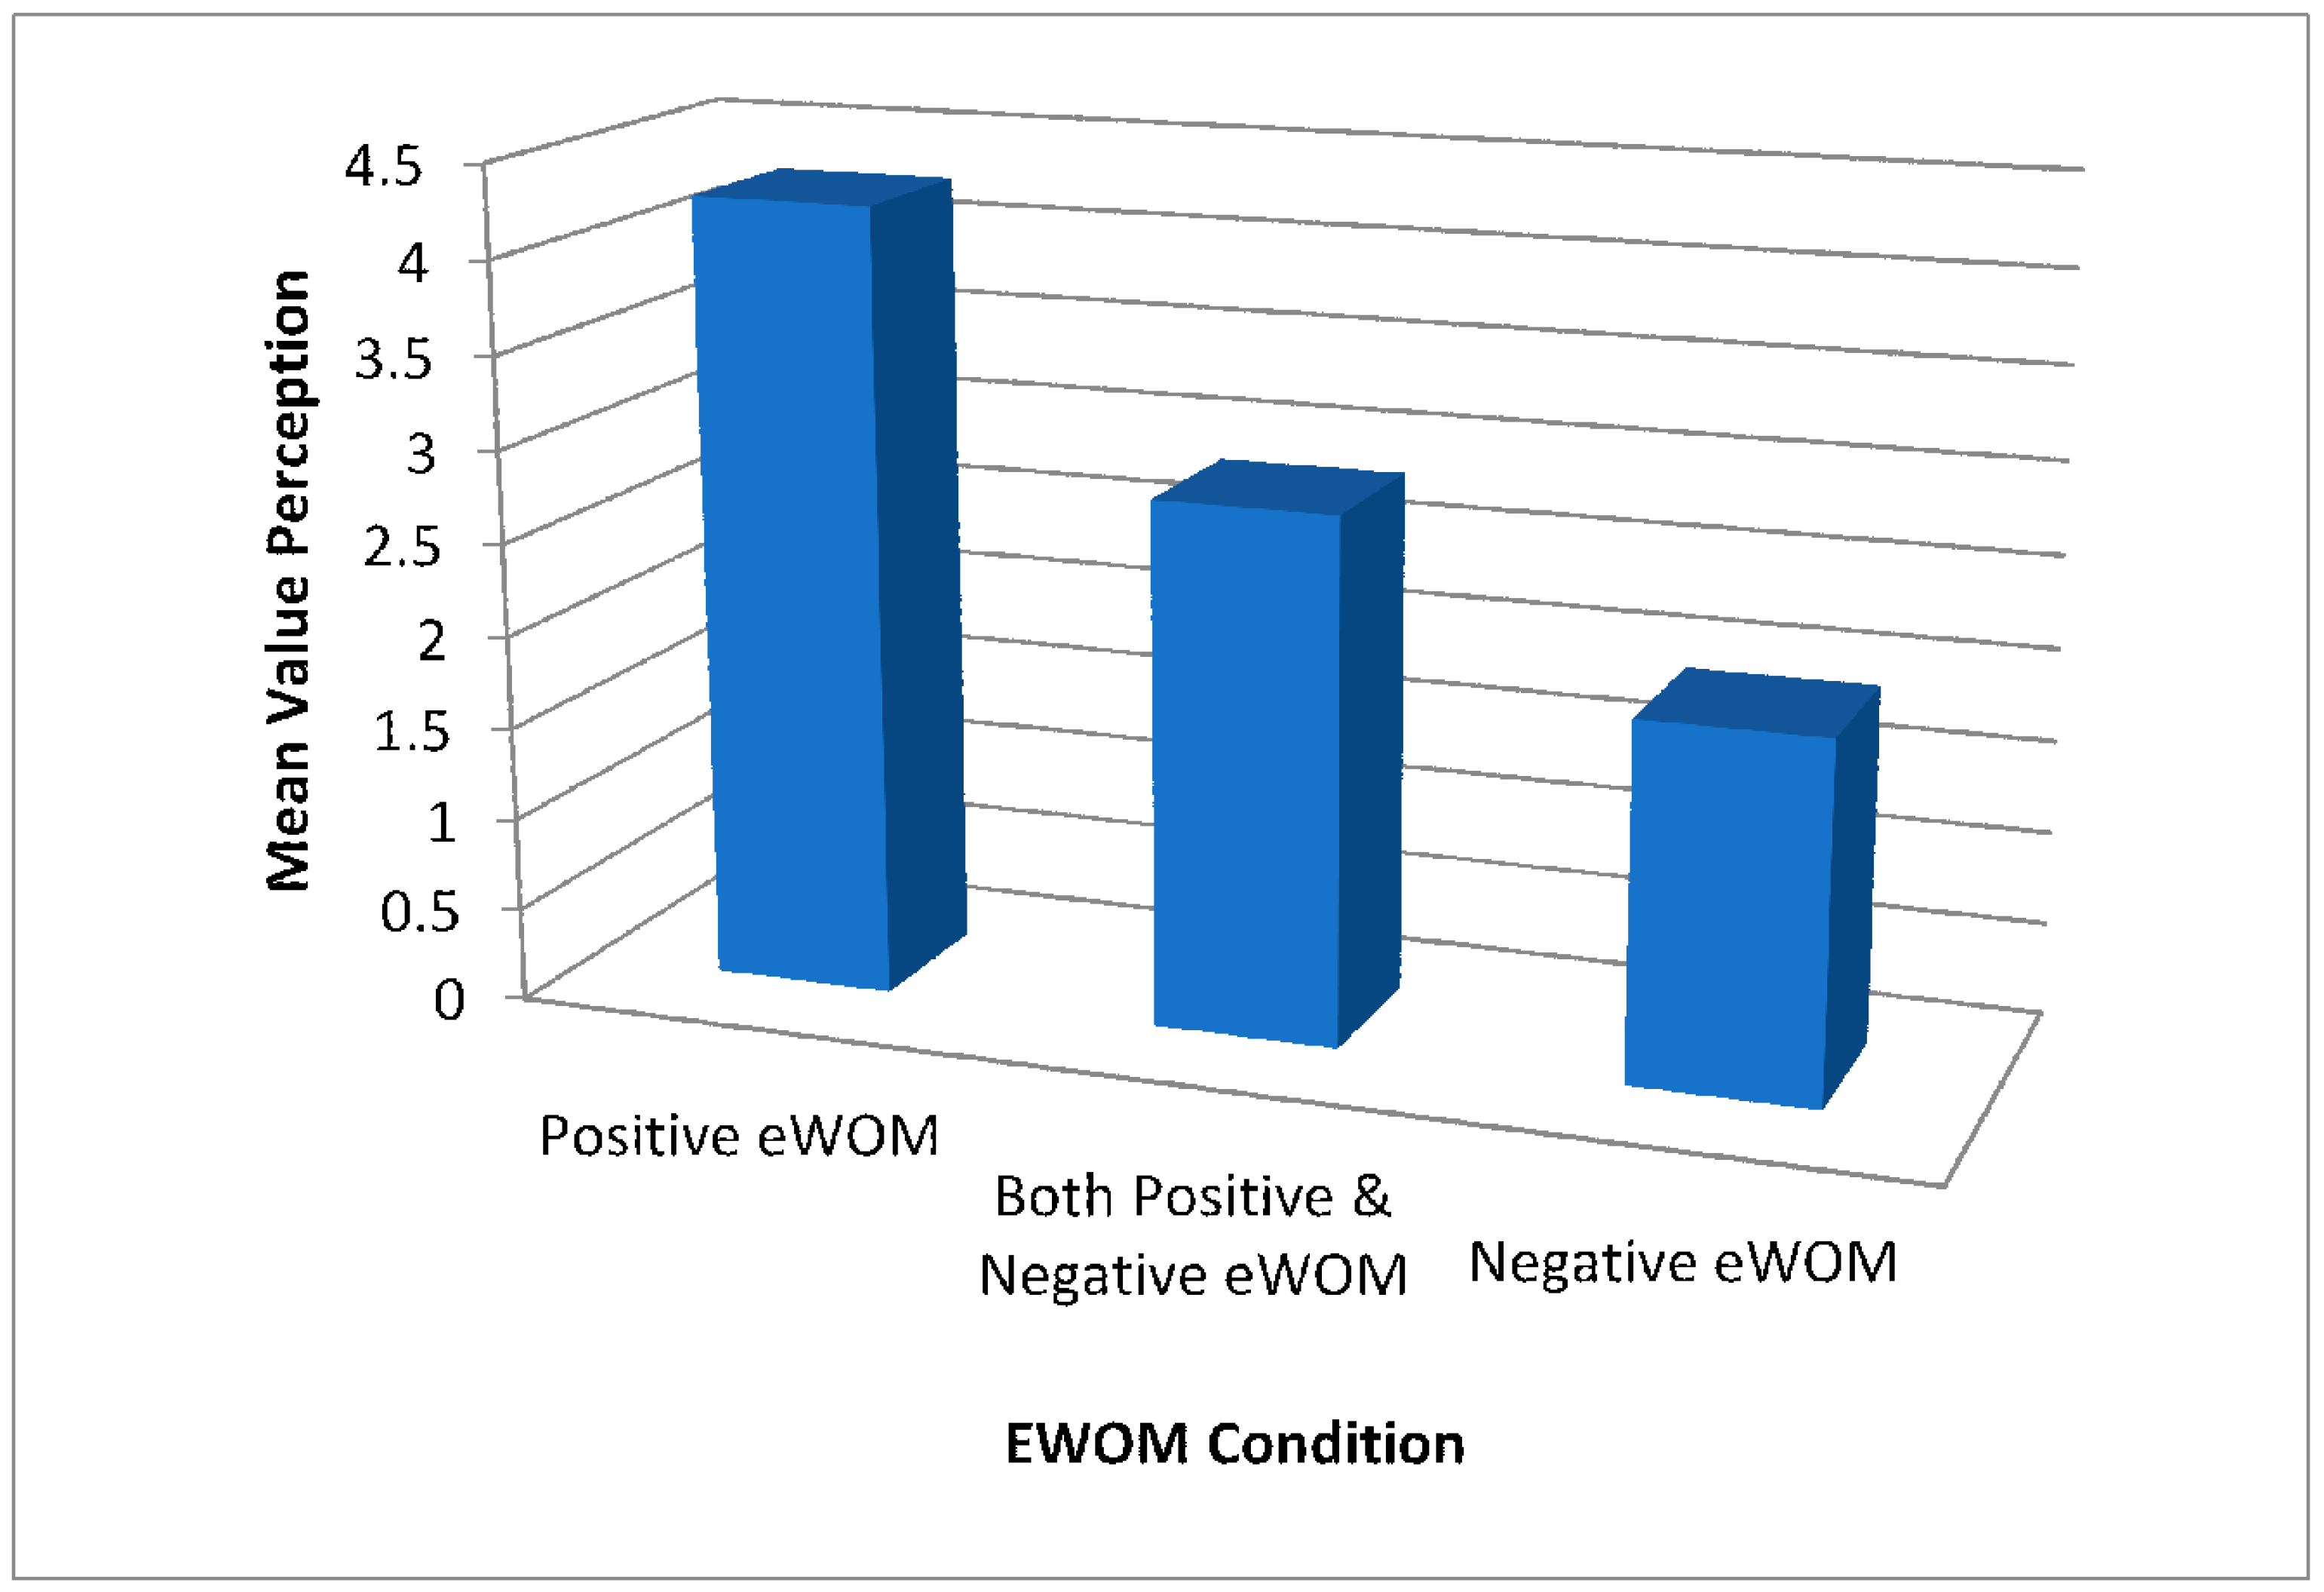
4.3. Negativity Effect of eWOM Valences on Value Perception

An ANOVA was used, followed by post hoc tests (Tukey tests), to compare the mean value, price, and quality perceptions in the mixed eWOM condition (Comparison Groups 3, 6, and 9) versus the following: (1) the eWOM absent condition in the same groups and (2) the positive eWOM condition (Comparison Groups 1, 4, and 7).
The ANOVA results revealed significant differences in mean value perceptions between the mixed eWOM condition, the only positive eWOM condition, and no eWOM, F (2, 191) = 19.86, p < 0.05. Tukey post hoc tests showed that the perceived value was lower in the mixed eWOM condition (M = 2.84, SD = 0.96) compared to the only positive eWOM condition (M = 4.26, SD = 1.54, p < 0.05) and no eWOM (M = 3.63, SD = 1.32, p < 0.05).
Figure 5 shows that the mean value perceptions were found to be lower in both the positive and negative eWOM conditions than those in the positive eWOM condition and the eWOM absent condition for all acceptability levels of price. When value perceptions in all three eWOM conditions were plotted, negative slopes were found, providing support for H6.
Figure 2 shows that the mean price perceptions were found to be generally lower when both the positive and negative eWOM condition was available than when positive eWOM was available and when eWOM was absent. When price perceptions in all three eWOM conditions were plotted, negative slopes were found for all price acceptability levels. The observed asymmetry in value perceptions (Figure 5) is found to mirror the pattern in the final perceived price.
An analysis of quality, price, and value perceptions across Comparison Groups 3, 6, and 9 provided empirical evidence for the significant influence of the final perceived price on value formation, when mixed eWOM is present, compared to perceived quality. Hierarchical Multiple Regression analysis (Table 6) for these groups demonstrated that over 80% of the variance in value perception can be explained by final price and quality perceptions (R2: 0.81–0.95). These results indicate a high goodness-of-fit for the data in the model used (Cohen, 1988). Notably, most of the explanatory power was given by price perception (R2: 0.81–0.94). A similar pattern is observable in the Betas of the final price perception versus quality perception when the price acceptability level decreased from below the participants’ expectations to beyond their expectations. It follows that the final price perception consistently exhibited a stronger predictive power than perceived quality across all three price acceptability levels.
This pattern further reinforces the observed bias in value perception resulting from the influence of both positive and negative eWOM on final price perception. Given the consistency of these findings across all price acceptability levels, it can be concluded that the presence of both positive and negative eWOM moderates the impact of price acceptability level on value perception. These results provide support for hypotheses H7 and H5.

5. Discussion and Conclusions

5.1. Implications for Industry Practitioners

The results of this study showed that eWOM moderates the influences exerted by the extrinsic cue of advertised price on consumers’ value perceptions and its major antecedents like price and quality perceptions. Competitive pricing is a marketing mix tactic commonly used in the travel industry (Dolnicar & Ring, 2014). This strategy has been heavily employed in the post-pandemic period to facilitate revival (Catur Widayati et al., 2023; Czerny et al., 2021; Chen et al., 2022; Adinolfi et al., 2021).
The findings of this research showed that low prices alone cannot enhance value perception if negative eWOM is also available. The usefulness of a low-price strategy in influencing consumers’ value perception of a GPT could therefore be quite limited for post-pandemic recovery. The findings of this study added to the body of knowledge that eWOM deserves special attention in value creation and facilitating tourism recovery in the new normal.
Instead of relying on a low-price strategy, industry practitioners are suggested to acquire new customers by emphasizing eWOM marketing activities and leveraging AI-powered recommendations in social media platforms. For example, a travel agent may construct some positive “seeding” messages in a company’s blogs, microblogs, and other popular online travel communities. These messages may aim to nudge people up their Hierarchies of Needs and offer compelling information on how the company’s tour service will help them to fulfill as many of their needs as it can. Individuals with high social networking potential (SNP) can be identified and invited to try the company’s service, now known as Influencer Marketing (Lou & Yuan, 2019). Rewards may then be administered to those who subsequently engage in positive eWOM about the company.
Tour service providers are also advised to not overlook the influence of mixed eWOM—a typical phenomenon in the real business world—as biased value perceptions are found to prevail under such a condition. Kuo and Nakhata (2019) highlight the crucial role of eWOM in fostering long-term consumer–product relationships. More emphasis is recommended on actively monitoring digital conversations and consumers’ sentiments about the company’s services, recently defined as Social Listening (Turban et al., 2018). Dissatisfactions from customers could then be identified and recovered at an early stage before they snowball.
It is very likely that COVID-19 or its variants might re-emerge and continue to spread soon. As a proactive business management approach, “adaptive resilience” entails the creation of novel competencies to deal with crisis conditions or events (Lee et al., 2013; Nilakant et al., 2014). Adaptive resilience also refers to the ability of an organization to initiate effective reactions and drive rapid recoveries from disruptive events (Nilakant et al., 2014). Given the delicate and susceptible nature of the tourism sector to epidemics and other disruptive events, tour service providers are recommended to adopt novel and inexpensive Mobile Instant Messaging (MIM) tools such as WhatsApp, Wechat, and Telegram to enhance their adaptive resilience. This strategy, defined as “Instant CRM,” allows service providers to stay connected with their clients in real time and give them quick information on catastrophes and service support, in addition to sending them promotional messages and invites related to other tour activities (Lo Presti et al., 2022). By incorporating soothing elements such as explanations, apologies, and compensations (Mattila & Patterson, 2004; Miller et al., 2000) in service disruptions, dissatisfactions could be turned into positive experiences, hence leading to positive WOM (Pai et al., 2019) and enhanced value perceptions for potential customers, as can be seen from this study’s findings.

5.2. Theoretical Contributions

The results of this study confirm the relationship between favorable (unfavorable) consumer reaction and positive (negative) WOM (Banerjee & Chua, 2019; Rosario et al., 2016; Vázquez-Casielles et al., 2013). Most studies of eWOM only investigate the impact of positive or negative word-of-mouth. EWOM being mixed is a common situation. Wang (2011) and the study reported here, which also examines eWOM’s impact on value perceptions, address this shortcoming. Researchers of eWOM are advised to include this third valence in their future studies to make sure they are complete.
It was empirically demonstrated in this study that eWOM affects value perceptions mainly through its antecedent of final price perceptions when mixed eWOM is present. This finding is consistent with recent research by ShabbirHusain and Varshney (2022) which shows that negative reviews from less credible sources will have a bigger impact than positive reviews from more credible sources. The results of this research added to the literature by helping researchers to comprehend the mental process behind consumers’ biased perceptions when mixed eWOM is available. In Sandberg and Alvesson (2021)’s typology, an “explaining theory” was generated. These findings can help future researchers to build more complete consumer choice models.
We manipulated the variables and isolated their effects for more accurate measurement by using an experimental approach. The internal validity of the research findings therefore became higher. As this study shows, experiments can be appropriate in eWOM research with an explanatory purpose. Our experimental methodology used Information Acceleration (IA) procedures, showing how the internal and external validities of explanatory eWOM research can be further enhanced, instead of relying on computational techniques and procedures like Structural Equation Modeling (SEM).

6. Limitations and Future Research

A limitation of this study is that there exist many other moderating factors that can influence responses to eWOM, for example, consumers’ previous experience with a tour service provider. Notably, pre-purchase positive eWOM will not always lead to positive results. If a consumer previously had a negative experience with a particular travel agent, pre-purchase positive eWOM can backfire and produce a high level of consumer dissatisfaction. Other potential moderating factors include whether consumers were really looking for advice about the product and had an interest in the product category.
The participants in this study were screened to make sure they were interested in the tour services used. This means that they were more likely to pay attention to eWOM. However, the data they provided were collected in artificial scenarios despite being made to look very realistic. Some WOM researchers (e.g., Fitzsimons & Lehmann, 2004) have found that if WOM recipients have a strong commitment to a brand or disagree with the values of the WOM senders, they may not fully accept negative WOM about that brand. Future researchers could replicate this study and incorporate the influences of other moderating factors, such as brand commitment, to add to the literature.

Author Contributions

Conceptualization, W.K.L.; methodology, W.K.L.; formal analysis, S.D.; investigation, S.D.; writing—original draft preparation, W.K.L.; writing—review and editing, D.R.C. and J.L.; supervision, D.R.C. All authors have read and agreed to the published version of the manuscript.

Funding

This research received no external funding.

Institutional Review Board Statement

The study was conducted in accordance with the Declaration of Wai Ki Liang, and approved by the Institutional Review Board (or Ethics Committee) of University of South Australia (protocol code P024/09GSB, 11th May 2022).

Informed Consent Statement

Informed consent was obtained from all subjects involved in the study.

Data Availability Statement

The datasets presented in this article are not readily available because the data are part of an ongoing study.

Conflicts of Interest

The authors declare no conflicts of interest.

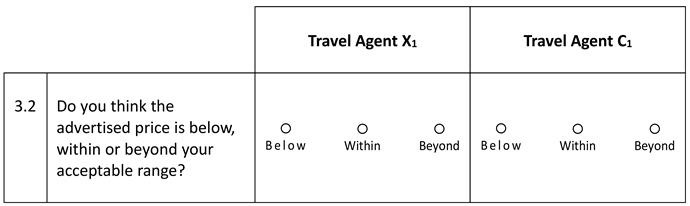
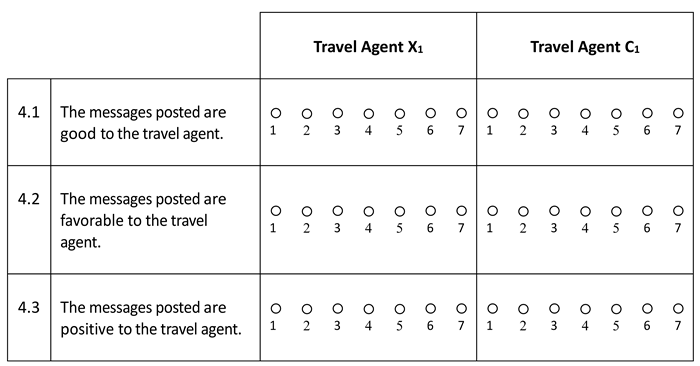
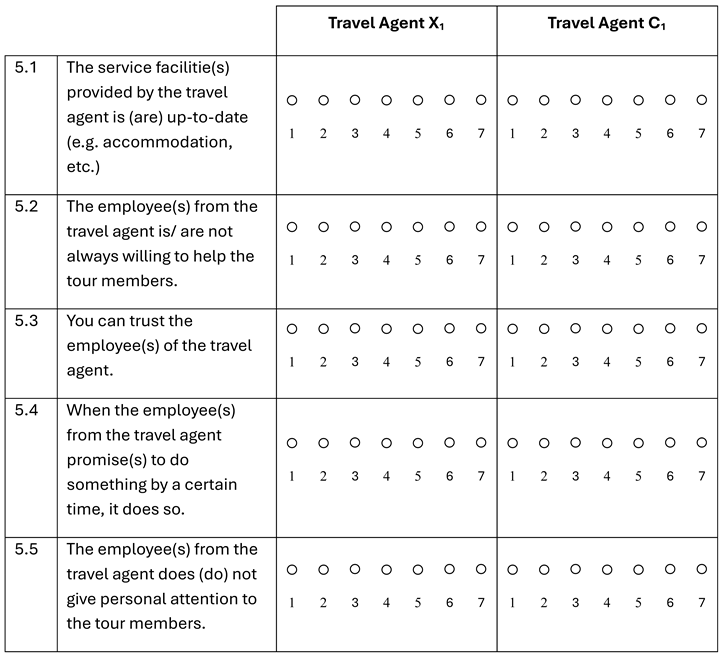
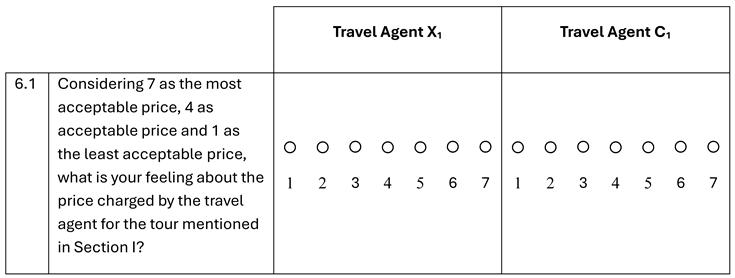
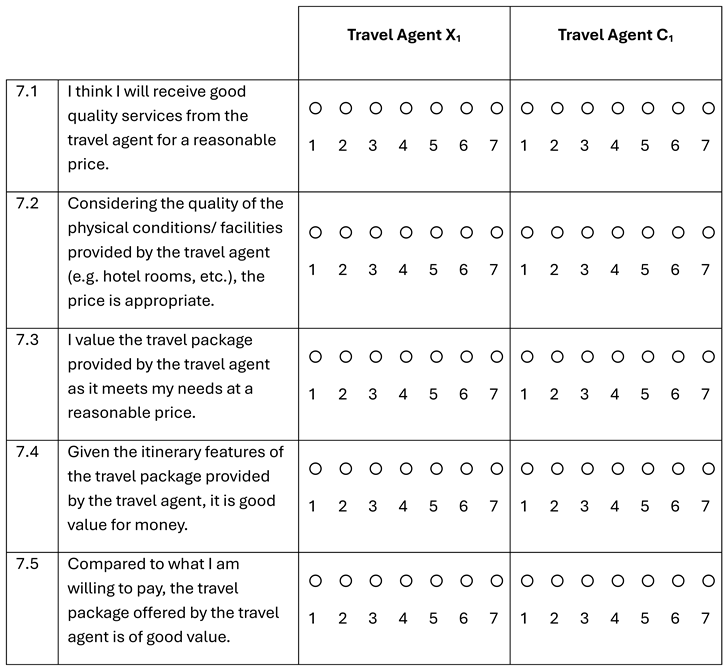
Appendix A. Sample Survey Questionnaire

  • Section I
A Group Package Tour (GPT) is offered by two local Travel Agents X1 and C1 with identical itineraries as follows. Please read carefully before proceeding to Section II.
JAPAN EXPERIENCE TOUR (5 DAYS)
Discover the key highlights on a short tour that encapsulates the powerful contradictions of Japan. Contrast the sophistication and energy of Tokyo with the imperial traditions of Kyoto/Nara, and the natural beauty of Nikko/Mt. Fuji/Hakone.
Highlights of Itinerary
  • Full 5 day trip: arrive at Tokyo in Day 1 early morning & depart in the evening of Day 5
  • Covering Tokyo, Nikko, Mt. Fuji, Hakone, Kyoto & Nara
  • Theme park: Tokyo DisneySea Park
  • Sightseeing: Toshogu Grand Shrine (World Heritage), Mt.Fuji, Nijo Castle, Kinkakuji Temple (Golden Pavillion), Gion Area, Horyuji Temple, Deer Park
  • Shopping: Ginza, Shinjuku
  • High quality accommodation: 4-star hotels (Grand Hotel Takanawa, Miyako Hotel)
  • High quality meals: renowned sushi/green tea in Ponto-cho restaurants/tea-houses and other famous local cuisines in restaurants en-route
  • Airline: Cathay Pacific
  • Section II
With respect to the features and the itinerary, please indicate the price range that you are willing to pay for the tour mentioned in Section I by inputting the amount in the spaces provided in the statements below.
2.1 What is the minimum level of price that you are willing to pay for the group package tour with exactly the same features and itinerary as the one mentioned in Section I? (single person, inclusive of all other charges such as airport taxes, insurance, tips, etc.)
(Assuming USD1 = HK$7.8)
HK$: ____________      (USD: ____________)
2.2 What is the maximum level of price that you are willing to pay for the group travel package with exactly the same features and itinerary as the one mentioned in Section I ? (single person, inclusive of all other charges such as airport taxes, insurance, tips, etc.)
(Assuming USD1 = HK$7.8)
HK$: ____________      (USD: ____________)
  • Section III
This section will show you the prices charged by Travel Agent X1 and C1 for the group package tour mentioned in Section I. Please note that the two travel agents charge the same price for the tour with exactly the same features and itinerary.
Tourismhosp 06 00041 i001
Note: As a recall, the minimum and maximum level of price for the tour that you indicated in the previous section were as follows:
  • Minimum price: HK$ ____________ (USD: ____________)
  • Maximum price: HK$ ____________ (USD: ____________)
Tourismhosp 06 00041 i002
  • Section IV
Next, you may like to look at independent social media reviews on the group package tours offered by the travel agents in a travel advice website provided here.
The following questions relates to your feelings about the messages posted for Travel Agent X1 and C1. For each statement, please show the extent to which you believe the messages have the feature described by the statement. A rating of “7” means that you strongly agree with the statement, and “1” means that you strongly disagree. You may choose any numbers in the middle that show how strong your feelings are.
Tourismhosp 06 00041 i003
  • Section V
This section relates to your feelings about the service quality of Travel Agent X1 and C1. For each statement, please show the extent to which you believe the travel agent has the feature described by the statement. A rating of “7” means that you strongly agree with the statement, and “1” means that you strongly disagree. You may choose any numbers in the middle that show how strong your feelings are.
Tourismhosp 06 00041 i004
  • Section VI
This section relates to your feelings about the prices of the tour charged by Travel Agent X1 and C1
Tourismhosp 06 00041 i005
  • Section VII
This section relates to your feelings about the value of purchasing the travel package from Travel Agent X1 and C1. For each statement, please show the extent to which you agree with the statement. A rating of “7” means that you strongly agree, and “1” means that you strongly disagree. You may choose any numbers in the middle that show how strong your feelings are.
Tourismhosp 06 00041 i006
                    End of Survey
            Thank you very much for your participation!

References

  1. Adinolfi, M. C., Harilal, V., & Giddy, J. K. (2021). Travel stokvels, leisure on lay-by, and pay at your pace options: The post COVID-19 domestic tourism landscape in South Africa. African Journal of Hospitality, Tourism and Leisure, 10(1), 302–317. [Google Scholar] [CrossRef]
  2. Al-Sabbahy, H. Z., Ekinci, Y., & Riley, M. (2004). An investigation of perceived value dimensions: IMPLICATIONS for hospitality research. Journal of Travel Research, 42, 226–234. [Google Scholar] [CrossRef]
  3. Anderson, E. W. (1998). Customer satisfaction and word of mouth. Journal of Service Research, 1(1), 5–17. [Google Scholar] [CrossRef]
  4. Aprilia, F., & Kusumawati, A. (2021). Influence of electronic word of mouth on visitor’s interest in tourism destinations. Journal of Asian Finance, Economics and Business, 8(2), 993–1003. [Google Scholar] [CrossRef]
  5. Arndt, J. (1967). Word-of-mouth advertising and informal communication. In D. Cox (Ed.), Risk taking and information handling in consumer behavior. Havard University. [Google Scholar]
  6. Aurylaitè, P., & Correia, R. (2022). The electric car charging market in Latvia: BUSINESS recommendations for new players in the market. European Journal of Applied Business Management, 2022, 1–16. [Google Scholar]
  7. Bagozzi, R. P., & Yi, Y. (1988). On the evaluation of structural equation models. Journal of the Academy of Marketing Science, 16(1), 74–94. [Google Scholar] [CrossRef]
  8. Banerjee, S., & Chua, A. Y. K. (2019). Trust in online hotel reviews across review polarity and hotel category. Computers in Human Behavior, 90, 265–276. [Google Scholar] [CrossRef]
  9. Basri, N. A.-H., Ahmad, R., Anuar, F. I., & Ismail, K. A. (2016). Effect of word of mouth communication on consumer purchase decision: Malay upscale restaurant. Procedia—Social and Behavioral Sciences, 222, 324–331. [Google Scholar] [CrossRef]
  10. Benavides Franco, J., Alonso Cifuentes, J. C., Carabalí Mosquera, J. A., & Sosa, A. (2022). On the feasibility of reverse mortgages in Colombia. International Journal of Housing Markets and Analysis, 15(5), 1195–1224. [Google Scholar] [CrossRef]
  11. Blal, I., & Sturman, M. C. (2014). The differential effects of the quality and quantity of online reviews on hotel room sales. Cornell Hospitality Quarterly, 55(4), 365–375. [Google Scholar] [CrossRef]
  12. Boksberger, P. E., & Melsen, L. (2011). Perceived value: A critical examination of definitions, concepts and measures for the service industry. Journal of Services Marketing, 25(3), 229–240. [Google Scholar] [CrossRef]
  13. Bone, P. F. (1992). Determinants of word-of-mouth communications during product consumption. Advances in Consumer Research, 19, 579–583. [Google Scholar]
  14. Bruner, G. C., II, & Hensel, P. J. (1992). Marketing scales handbook: A compilation of multi-item measures. American Marketing Association. [Google Scholar]
  15. Buttle, F. A. (1998). Word-of-mouth: Understanding and managing referral marketing. In Proceedings of the Academy of Marketing Annual Conference (pp. 100–106). Sheffield Hallam University. [Google Scholar]
  16. Catur Widayati, C., Yenita, Arijanto, A., Ayu Diporini, V., Edwina Oebit, C., & Suryaningrum, D. (2023). Antecedents and consequences of personal selling, price and product quality on buying incentive packages tour travel post-COVID-19 pandemic. KnE Social Sciences, 8(12), 596–608. [Google Scholar] [CrossRef]
  17. Chang, J.-H., & Wang, S.-H. (2019). Different levels of destination expectation: The effects of online advertising and electronic word-of-mouth. Telematics and Informatics, 36, 27–38. [Google Scholar] [CrossRef]
  18. Chen, I.-F., Kuo, P.-Y., & Tsaur, R.-C. (2022). Price risk strategy analysis for budget hotels in the post-pandemic era. Axioms, 11, 550. [Google Scholar] [CrossRef]
  19. Chena, H.-S., Chen, C.-Y., Chen, H.-K., & Hsieh, T. (2012). A study of relationships among green consumption attitude, perceived risk, perceived value toward hydrogen-electric motorcycle purchase intention. AASRI Procedia, 2(2012), 163–168. [Google Scholar] [CrossRef]
  20. Choi, C. (2022). Comparing word-of-mouth (WOM) and viral marketing: Behavior analysis of consumer consumption, information traits, and credibility. Hong Kong Journal of Social Sciences, 60, 326–333. [Google Scholar]
  21. Chou, W. P., Wang, P. W., Chen, S. L., Chang, Y. P., Wu, C. F., Lu, W. H., & Yen, C. F. (2020). Voluntary reduction of social interaction during the COVID-19 pandemic in Taiwan: Related factors and association with perceived social support. International Journal of Environmental Research and Public Health, 17(21), 8039. [Google Scholar] [CrossRef] [PubMed] [PubMed Central]
  22. Cohen, J. (1988). Statistical power analysis for the behavioral sciences (2nd ed.). L. Erlbaum Associates. [Google Scholar]
  23. Cronin, J. J., & Taylor, S. A. (1994). Servperf versus servqual: Reconciling performance-based and perceptions-minus-expectations measurements. Journal of Marketing, 58(1), 125–131. [Google Scholar] [CrossRef]
  24. Czerny, A. I., Fu, X.-W., Lei, Z., & Oum, T. H. (2021). Post pandemic aviation market recovery: Experience and lessons from China. Journal of Air Transport Management, 90(2021), 1019–1071. [Google Scholar] [CrossRef]
  25. de Ruyter, K., Wetzels, M., & Jos, M. (1997). The dynamics of the service delivery process: A value-based approach. international Journal of Research in Marketing, 14(3), 231–243. [Google Scholar] [CrossRef]
  26. Ding, L., & Romainoor, N. H. (2022). Examining factors affecting consumers’ purchase intentions for chinese museum’s cultural and creative products. Asian Journal of Arts, Culture and Tourism, 4(2), 1–11. [Google Scholar]
  27. Dolnicar, S., & Ring, A. (2014). Tourism marketing research: Past, present and future. Annals of Tourism Research, 47(7), 31–47. [Google Scholar] [CrossRef]
  28. Drolet, A., & Morrison, D. (2001). Do we really need multiple-item measures in service research? Journal of Service Research, 3(3), 196–204. [Google Scholar] [CrossRef]
  29. East, R., Uncles, M. D., Romaniuk, J., & Lomax, W. (2016). Measuring the impact of positive and negative word of mouth: A reappraisal. Australasian Marketing Journal, 24(1), 54–58. [Google Scholar] [CrossRef]
  30. Eggert, A., Ulaga, W., Frow, P., & Payne, A. (2018). Conceptualizing and communicating value in business markets: From value in exchange to value in use. Industrial Marketing Management, 69, 80–90. [Google Scholar] [CrossRef]
  31. Erdmann, A., Mas, J. M., & de Obesso, M. (2023). Disruptive technologies: How to influence price sensitivity triggering consumers’ behavioural beliefs. Journal of Business Research, 158, 1136–1145. [Google Scholar] [CrossRef]
  32. Filieri, R., Lin, Z., Pino, G., Alguezaui, S., & Inversini, A. (2021). The role of visual cues in eWOM on consumers’ behavioral intention and decision. Journal of Business Research, 135(2021), 663–675. [Google Scholar] [CrossRef]
  33. Fitzsimons, G. J., & Lehmann, D. R. (2004). Reactance to recommendations: When unsolicited advice yields contrary responses. Marketing Science, 23, 1–172. [Google Scholar] [CrossRef]
  34. Fornell, C., & Larcker, D. F. (1981). Evaluating structural equation models with unobservable variables and measurement errors. Journal of Marketing Research, 18(1), 39–50. [Google Scholar] [CrossRef]
  35. Gabbott, M. (2004). Introduction to marketing: A value exchange approach (pp. 35–59). Pearson Prentice Hall. [Google Scholar]
  36. Garvin, D. A. (1983). Quality on the line. Harvard Business Review, 61, 65–73. [Google Scholar]
  37. Garvin, D. A. (1987). Competing on the eight dimensions of quality. Harvard Business Review, 65, 101–109. [Google Scholar]
  38. Han, S., Gupta, S., & Lehmann, D. R. (2001). Consumer price sensitivity and price thresholds. Journal of Retailing, 77(4), 435–456. [Google Scholar] [CrossRef]
  39. Hennig-Thurau, T., Wiertz, C., & Feldhaus, F. (2015). Does twitter matter? The impact of microblogging word of mouth on consumers’ adoption of new movies. Journal of the Academy of Marketing Science, 43, 375–394. [Google Scholar] [CrossRef]
  40. Henseler, J., Ringle, C. M., & Sinkovics, R. R. (2009). The use of partial least squares path modeling in international marketing. In New challenges to international marketing (pp. 277–319). Emerald Group Publishing Limited. [Google Scholar]
  41. Ho, C.-L., Liu, Y., & Chen, M.-C. (2022). Antecedents and consequences of consumers’ attitudes toward live streaming shopping: An application of the stimulus–organism–response paradigm. Cogent Business & Management, 9(1), 2145673. [Google Scholar] [CrossRef]
  42. Jacoby, J., & Olson, J. C. (1977). Consumer response to price: An attitudinal, information processing perspective. In Y. Wind, & P. Greenberg (Eds.), Moving ahead with altitude research (pp. 73–86). American Marketing Association. [Google Scholar]
  43. Jacoby, J., & Olson, J. C. (1985). Perceived quality: How consumers view stores and merchandise. Lexington Books. [Google Scholar]
  44. Jakuba, K., Katarínab, R., & Máriaa, K. B. (2022). Price sensitivity testing as a basic tool for strategic pricing decisions. Strategic Management, 28(1), 20–32. Available online: https://scindeks.ceon.rs/article.aspx?artid=1821-34488800030K (accessed on 1 March 2025).
  45. Kahneman, D., & Tversky, A. (1979). Prospect theory: An analysis of decisionunder risk. Econometrica, 47(2), 263–291. [Google Scholar] [CrossRef]
  46. Kalwani, M. U., & Yim, C.-K. (1992). Consumer price and promotion expectations: An experimental study. Journal of Marketing Research, 29, 90–100. [Google Scholar] [CrossRef]
  47. Kalyanaram, G., & Winer, R. S. (1995). Empirical generalizations from reference price research. Marketing Science, 14(3), 161–169. [Google Scholar] [CrossRef]
  48. King, R. A., Racherla, P., & Bush, V. D. (2014). What we know and don’t know about online word-of-mouth: A review and synthesis of the literature. Journal of Interactive Marketing, 28(3), 167–183. [Google Scholar] [CrossRef]
  49. Kunkel, T., Doyle, J. P., & Berlin, A. (2017). Consumers’ perceived value of sport team games: A multidimensional approach. Journal of Sport Management, 31(1), 80–95. [Google Scholar] [CrossRef]
  50. Kuo, H. C., & Nakhata, C. (2019). The impact of electronic word-of-mouth on customer satisfaction. Journal of Marketing Theory and Practice, 27(3), 331–348. [Google Scholar] [CrossRef]
  51. Kushcheva, N., & Eilola, T.-M. (2023). Relevance of social media management in online reputation building in tourism and hospitality: Case of Finland. In R. Rialti, Z. Kvítková, & T. Makovník (Eds.), Online reputation management in destination and hospitality (pp. 163–174). Emerald Publishing Limited. [Google Scholar]
  52. Lacroix, C., & Jolibert, A. (2017). Mediational role of perceived personal legacy value between consumer agentic generativity and attitudes/buying intentions toward luxury brands. Journal of Business Research, 77(C), 203–211. [Google Scholar] [CrossRef]
  53. Lai, A. W. (1995). Consumer values, product benefits and customer value: A consumption behavior approach. Advances in Consumer Research, 22(1), 381–388. [Google Scholar]
  54. Lee, A. V., Vargo, J., & Seville, E. (2013). Developing a tool to measure and compare organizations’ resilience. Natural Hazards Review, 14(1), 29–41. [Google Scholar] [CrossRef]
  55. Liang, W. K., & Corkindale, D. R. (2016). The effect of online word of mouth on risk assessment for an experience service as price acceptability changes. Services Marketing Quarterly, 37(3), 156–170. [Google Scholar] [CrossRef]
  56. Liang, W. K., & Corkindale, D. R. (2017). Word of mouth or price matters in quality considerations? Asian Journal of Marketing, 11(1), 34–43. [Google Scholar] [CrossRef]
  57. Liang, W. K., & Corkindale, D. R. (2019). How eWord of mouth valences affect price perceptions. International Journal of Market Research, 61(1), 50–63. [Google Scholar] [CrossRef]
  58. Lin, C., Sher, P. J., & Shih, H. (2005). Past progress and future directions in conceptualizing customer perceived value. International Journal of Service Industry Management, 16(4), 318–336. [Google Scholar] [CrossRef]
  59. Liu, H., Osburg, V. S., Yoganathan, V., & Cartwright, S. (2021). Social sharing of consumption emotion in electronic word of mouth (eWOM): A cross-media perspective. Journal of Business Research, 132, 208–220. [Google Scholar] [CrossRef]
  60. Loncaric, D., Ribaric, I., & Farkas, V. (2016). The role of electronic word-of-mouth in tourism market. In Tourism & hospitality industry (pp. 188–203). Faculty of Tourism and Hospitality Management. Available online: https://www.researchgate.net/publication/305332025_THE_ROLE_OF_ELECTRONIC_WORD-OF-MOUTH_IN_THE_TOURISM_MARKET (accessed on 2 January 2022).
  61. Long, E., Patterson, S., Maxwell, K., Blake, C., Pérez, R. B., Lewis, R., Lewis, R., McCann, M., Riddell, J., Skivington, K., Wilson-Lowe, R., & Mitchell, K. R. (2022). COVID-19 pandemic and its impact on social relationships and health. Journal of Epidemiology and Community Health, 76, 128–132. [Google Scholar] [CrossRef] [PubMed]
  62. Lo Presti, L., Maggiore, G., & Marino, V. (2022). Chapter 19: Digital communication tools and tourism engagement: Instant CRM strategies through instant messaging apps. In Handbook on tourism and social media. Edward Elgar Publishing. [Google Scholar] [CrossRef]
  63. Lou, C., & Yuan, S. (2019). Influencer marketing: How message value and credibility affect consumer trust of branded content on social media. Journal of Interactive Advertising, 19(1), 58–73. [Google Scholar] [CrossRef]
  64. Mani, A., Balaji, A. L., Hari, A. S., & Sunny, B. (2023). How does customer rating affect product purchase? EPRA International Journal of Multidisciplinary Research (IJMR), 9(1), 94–96. [Google Scholar] [CrossRef]
  65. Marshall, R., & Bee Leng, S. (2002). Price threshold and discount saturation point in Singapore. Journal of Product & Brand Management, 11(3), 147–159. [Google Scholar] [CrossRef]
  66. Mathwick, C., Malhotra, N., & Rigdon, E. (2001). Experiential value: Conceptualization, measurement and application in the catalog and internet shopping environment. Journal of Retailing, 77(1), 39–56. [Google Scholar] [CrossRef]
  67. Mathwick, C., Malhotra, N., & Rigdon, E. (2002). The effect of dynamic retail experiences on experiential perceptions of value: An internet and catalog comparison. Journal of Retailing, 78(1), 51–60. [Google Scholar] [CrossRef]
  68. Mattila, A. S., & Patterson, P. G. (2004). Service recovery and fairness perceptions in collectivist and individualist contexts. Journal of Service Research, 6(4), 336–346. [Google Scholar] [CrossRef]
  69. Mazumdar, T., & Jun, S. Y. (1992). Effects of price uncertainty on consumer purchase budget and price thresholds. Marketing Letters, 3, 323–330. [Google Scholar] [CrossRef]
  70. Miller, J. L., Craighead, C. W., & Karwan, K. R. (2000). Service recovery: A framework and empirical investigation. Journal of Operations Management, 18(4), 387–400. [Google Scholar] [CrossRef]
  71. Monroe, K. B. (1990). Pricing: Making profitable decisions (2nd ed.). McGraw-Hill. [Google Scholar]
  72. Monroe, K. B., & Petroshius, S. M. (1981). Buyers’ perception of price: An update of the evidence. In H. H. Kassarjian, & T. S. Robertson (Eds.), Perspectives in consumer behavior (3rd ed., pp. 43–55). Scott, Foresman and Company. [Google Scholar]
  73. Mortimer, K., & Pressey, A. (2013). Consumer information search and credence services: Implications for service providers. Journal of Services Marketing, 27, 49–58. [Google Scholar] [CrossRef]
  74. Nachtigall, C., Kroehne, U., Funke, F., & Steyer, R. (2003). (Why) should we use SEM? Pros and cons of structural equation modeling. Methods of Psychological Research, 8(2), 1–22. [Google Scholar]
  75. Naujoks, A., & Benkenstein, M. (2020). Who is behind the message? The power of expert reviews on eWOM platforms. Electronic Commerce Research and Applications, 44, 101015. [Google Scholar] [CrossRef]
  76. Ngarmwongnoi, C., Oliveira, J. S., AbedRabbo, M., & Mousavi, S. (2020). The Implications of eWOM adoption on the customer journey. Journal of Consumer Marketing, 37(7), 749–759. [Google Scholar] [CrossRef]
  77. Nilakant, V., Walker, B., van Heugen, K., Baird, R., & De Vries, H. (2014). Research note: Conceptualising adaptive resilience using grounded theory. New Zealand Journal of Employment Relations, 39(1), 79–86. [Google Scholar]
  78. Nunnally, J. C. (1994). Psychometric theory (3rd ed.). Tata McGraw-Hill Education. [Google Scholar]
  79. Pai, C.-H., Ko, K.-M., & Santos, T. (2019). A study of the effect of service recovery on customer loyalty based on marketing word of mouth in tourism industry. Revista de Cercetare si Interventie Sociala, 64, 74–84. [Google Scholar] [CrossRef]
  80. Pascual, J. J. (2022). Non-monetary price perceived in e-peer-to-peer accommodation: Airbnb guests’ perspective. Tec Empresarial, 17(2), 82–94. [Google Scholar]
  81. Pawar, P. (2022). Era of influencer marketing: A review report. International Journal of Food and Nutritional Sciences, 11(1), 3258–3265. [Google Scholar]
  82. Phillips, P., Zigan, K., Santos, S. M. M., & Schegg, R. (2015). The interactive effects of online reviews on the determinants of Swiss hotel performance: A neural network analysis. Tourism Management, 50, 130–141. [Google Scholar] [CrossRef]
  83. Price, P. C., Jhangiani, R., Chiang, I.-C. A., Leighton, D. C., & Cuttler, C. (2017). Research Methods in Psychology (3rd American ed.). PB Press. [Google Scholar]
  84. Raykov, T., & Penev, S. (2002). Exploring structural equation model misspecifications via latent individual residuals. In G. A. Marcoulides, & I. Moustaki (Eds.), Latent variable and latent structure models (pp. 121–134). Lawrence Erlbaum. [Google Scholar]
  85. Rosario, A. B., Sotgiu, F., De Valck, C., & Bijmolt, T. H. A. (2016). The effect of electronic word of mouth on sales: A meta-analytic review of platform, product, and metric factors. Journal of Marketing Research, 53(3), 297–318. [Google Scholar] [CrossRef]
  86. Rossiter, J. R. (2002). The C-OAR-SE procedure for scale development in marketing. International Journal of Research in Marketing, 19(4), 305–335. [Google Scholar] [CrossRef]
  87. Roy, A., & Ortiz, M. (2023). Is it risky to subscribe? Perceived control and subscription choice. Psychology & Marketing, 40, 365–372. [Google Scholar]
  88. Roy, G., Datta, B., Mukherjee, S., & Basu, R. (2020). Effect of eWOM stimuli and eWOM response on perceived service quality and online recommendation. Tourism Recreation Research, 46(4), 457–472. [Google Scholar] [CrossRef]
  89. Sandberg, J., & Alvesson, M. (2021). Meanings of theory: Clarifying theory through typification. Journal of Management Studies, 58(2), 487–516. [Google Scholar] [CrossRef]
  90. Sar, A. K. (2022). Price estimation for amazon prime video in India. J Revenue Pricing Management, 22, 312–318. [Google Scholar] [CrossRef]
  91. Schijns, J., & Bruggen, N. V. (2018). The power of eWOM through social networking sites. Abstract from International Conference on Marketing, Tourism & Hospitality, Zurich, Switzerland. Available online: http://globalbizresearch.org/Swiss_Conference_2018_July3/docs/doc/4.%20Education/ZT862.pdf (accessed on 1 March 2025).
  92. Sethuraman, R., & Tellis, G. (2002). Does manufacturer advertising suppress or stimulate retail price promotions? Analytical model and empirical analysis. Journal of Retailing, 78, 253–263. [Google Scholar] [CrossRef]
  93. ShabbirHusain, R. V., & Varshney, S. (2022). Investigating combined effect of WOM and eWOM: Role of message valence. Journal of Consumer Marketing, 39(2), 180–190. [Google Scholar]
  94. Shen, Y., Li, S., & DeMoss, M. (2012). The effect of quantitative electronic word of mouth on consumer perceived product quality. International Journal of Management and Marketing Research, 5(2), 19–29. [Google Scholar]
  95. Singh, S. K., & Kathuria, L. M. (2019). Factors influencing e-word-of-mouth adoption among consumers availing travel services. International Journal of Tourism Policy, 9(2), 155–173. Available online: https://www.inderscienceonline.com/doi/abs/10.1504/IJTP.2019.102652 (accessed on 14 January 2022). [CrossRef]
  96. Slater, S. F., & Narver, J. C. (2000). Intelligence generation and superior customer value. Journal of the Academy of Marketing Science, 28(1), 120–128. [Google Scholar] [CrossRef]
  97. Sánchez-Fernández, R., & Iniesta-Bonillo, Á. M. (2007). The concept of perceived value: A systematic review of the research. Marketing Theory, 7, 427–451. [Google Scholar] [CrossRef]
  98. Srivastava, A., & Thaichon, P. (2022). What motivates consumers to be in line with online shopping?: A systematic literature review and discussion of future research perspectives. Asia Pacific Journal of Marketing and Logistics. Ahead-of-print. [Google Scholar] [CrossRef]
  99. Stelzl, I. (1983). Zur uneindeutigkeit von LISREL-lösungen: Überlegungen und beispiele. [On the ambiguity of LISREL solutions: Considerations and examples]. Psychologische Beiträge, 25(3–4), 315–335. [Google Scholar]
  100. Sweeney, J. C., & Soutar, G. N. (2001). Consumer perceived value: The development of a multiple item scale. Journal of Retailing, 77(2), 203–220. [Google Scholar] [CrossRef]
  101. Teas, R. K., & Agarwal, S. (2000). The effects of extrinsic product cues on consumers’ perceptions of quality, sacrifice, and value. Journal of the Academy of Marketing Science, 28(2), 280–292. [Google Scholar] [CrossRef]
  102. Tien, D. H., Amaya Rivas, A. A., & Liao, Y.-K. (2019). Examining the influence of customer-to-customer electronic word-of-mouth on purchase intention in social networking sites. Asia Pacific Management Review, 24(3), 238–249. [Google Scholar] [CrossRef]
  103. Tomarken, A. J., & Waller, N. G. (2005). Structural equation modeling: Strengths, limitations, and misconceptions. Annual Review of Clinical Psychology, 2005(1), 31–65. [Google Scholar] [CrossRef] [PubMed]
  104. Turban, E., Outland, J., King, D., Lee, J., Liang, T., & Turban, D. (2018). Electronic commerce 2018: A managerial and social networks perspective (9th ed.). Springer International Publishing. [Google Scholar]
  105. United Nations Conference on Trade and Development (UNCTAD). (2020). COVID-19 has changed online shopping forever, survey shows. United Nations. [Google Scholar]
  106. Urban, G. L., Hauser, J. R., Qualls, W. J., Weinberg, B. D., Bohlmann, J. D., & Chicos, R. A. (1997). Information acceleration: Validation and lessons from the field. Journal of Marketing Research, 34(1), 143–153. [Google Scholar] [CrossRef]
  107. Vargo, S. L., & Lusch, R. F. (2004). Evolving to a new dominant logic for marketing. Journal of Marketing, 68(1), 1–17. [Google Scholar] [CrossRef]
  108. Vargo, S. L., & Lusch, R. F. (2008). Service-dominant logic: Continuing the evolution. Journal of the Academy of Marketing Science, 36(1), 1–10. [Google Scholar] [CrossRef]
  109. Verma, S., & Yadav, N. (2021). Past, present, and future of electronic word of mouth (EWOM). Journal of Interactive Marketing, 53, 111–128. [Google Scholar] [CrossRef]
  110. Vermeulen, I. E., & Seegers, D. (2009). Tried and tested: The impact of online hotel reviews on consumer consideration. Tourism Management, 30(1), 123–127. [Google Scholar] [CrossRef]
  111. Vinijcharoensri, K. (2016). Luxury value perceptions and attitude toward purchase intention of luxury automobiles in Thailand. Human Behavior, Development and Society, 13(2), 46–56. [Google Scholar]
  112. Vroom, V. H. (1964). Work and motivation. Jossey-Bass. [Google Scholar]
  113. Vázquez-Casielles, R., Suárez-Á lvarez, L., & del Río-Lanza, A.-B. (2013). The word of mouth dynamic: How positive (and negative) WOM drives purchase probability. Journal of Advertising Research, 53, 43–60. [Google Scholar] [CrossRef]
  114. Wang, K. C., Hsieh, A. T., & Huan, T. C. (2000). Critical service features in group package tour: An exploratory research. Tourism Management, 21(2), 177–189. [Google Scholar] [CrossRef]
  115. Wang, X. (2011). The effect of inconsistent word-of-mouth during the service encounter. Journal of Services Marketing, 25(4), 252–259. [Google Scholar] [CrossRef]
  116. Westbrook, R. A. (1987). Product/consumption-based affective responses and postpurchase processes. Journal of Marketing Research, 24(3), 258–270. [Google Scholar] [CrossRef]
  117. Woodruff, R. (1997). Customer value: The next source for competitive advantage. Journal of the Academy of Marketing Science, 25(2), 139–153. [Google Scholar] [CrossRef]
  118. Woodruff, R., & Gardial, S. F. (1996). Know your customer: New approaches to customer value and satisfaction. Blackwell Publishers. [Google Scholar]
  119. Wu, S.-I., & Chang, H.-L. (2016). The model of relationship between the perceived values and the purchase behaviors toward innovative products. Journal of Management and Strategy, 7(2), 31–45. [Google Scholar] [CrossRef]
  120. Yan, Q., Wu, S., Zhou, Y., & Zhang, L. (2018). How differences in eWOM platforms impact consumers’ perceptions and decision-making. Journal of Organizational Computing and Electronic Commerce, 28(4), 315–333. [Google Scholar] [CrossRef]
  121. Ye, Q., Law, R., & Gu, B. (2011). the influence of user-generated content on traveler behavior: An empirical investigation on the effects of e-word-of-mouth to hotel online bookings. Computers in Human Behavior, 27(2), 634–639. [Google Scholar] [CrossRef]
  122. Yu, S., & Lee, J. (2019). The effects of consumers’ perceived values on intention to purchase upcycled products. Sustainability, 11, 1034. [Google Scholar] [CrossRef]
  123. Zare, R., Poursaeed, M. M., Azimizadeh, S., & Ghasemi, K. (2023). Toward a model of electronic word-of-mouth in instagram social network site (case study of restaurant industry). Public Management Researches, 17, 259–280. Available online: https://jmr.usb.ac.ir/article_8565.html?lang=en (accessed on 1 March 2025).
  124. Zeithaml, V. A. (1988). Consumer perceptions of price, quality and value: A mean-end model and synthesis evidence. Journal of Marketing, 52, 2–22. [Google Scholar] [CrossRef]
Figure 1. Research framework used in this study.
Tourismhosp 06 00041 g001
Figure 2. Contrasting mean price perceptions (both positive and negative vs. positive and eWOM absent condition) in different price acceptability levels.
Tourismhosp 06 00041 g002
Figure 3. Contrasting mean value perceptions (negative vs. both positive and negative and positive eWOM condition).
Tourismhosp 06 00041 g003
Figure 4. Contrasting mean value perceptions (positive vs. both positive and negative and negative eWOM condition) in different price acceptability levels.
Tourismhosp 06 00041 g004
Figure 5. Contrasting mean value perceptions (both positive and negative vs. positive and eWOM absent condition) in different price acceptability levels.
Tourismhosp 06 00041 g005
Table 1. Research design used in this study.
Group No.Travel AgentConditionsTravel AgentConditions
1X1All positive eWOM, advertised price below respondents’ acceptable rangeC1eWOM absent, advertised price below respondents’ acceptable range
2Y1All negative eWOM, advertised price below respondents’ acceptable rangeC1eWOM absent, advertised price below respondents’ acceptable range
3Z1Both positive and negative eWOM, advertised price below respondents’ acceptable rangeC1eWOM absent, advertised price below respondents’ acceptable range
4X2All positive eWOM, advertised price within respondents’ acceptable rangeC2eWOM absent, advertised price within respondents’ acceptable range
5Y2All negative eWOM, advertised price within respondents’ acceptable rangeC2eWOM absent, advertised price within respondents’ acceptable range
6Z2Both positive and negative eWOM, advertised price within respondents’ acceptable rangeC2eWOM absent, advertised price within respondents’ acceptable range
7X3All positive eWOM, advertised price beyond respondents’ acceptable rangeC3eWOM absent, advertised price beyond respondents’ acceptable range
8Y3All negative eWOM, advertised price beyond respondents’ acceptable rangeC3eWOM absent, advertised price beyond respondents’ acceptable range
9Z3Both positive and negative eWOM, advertised price beyond respondents’ acceptable rangeC3eWOM absent, advertised price beyond respondents’ acceptable range
Note: The letter in each cell represents the use of an individual, fictitious but real-looking, travel agent in that cell’s scenario.
Table 2. Participants’ socio-demographic profile.
MeasureFrequencyPercentage
Gender
Male9548.0
Female10151.0
Others21.0
Education level
Bachelor’s8542.9
Master’s6934.8
PhD4422.2
Social media usage
Every day16181.3
4–5 days per week189.1
Once or twice per week147.1
Very rarely52.5
Search for other people’s travel experience or comments
Very often5628.3
Often6633.3
Once in a while6834.3
Never84.0
Experience of purchasing a group package tour online
More than once in the past year9045.5
Once in the past year5829.3
Once in the past two years4623.2
Never42.0
Table 3. Reliabilities of constructs’ measurement.
ConstructsNumber of ItemsMeanStandard DeviationCronbach’s AlphaComposite ReliabilityAVE
WOM Perception33.90 1.98 0.97 0.98 0.94
Quality Perception53.40 1.66 0.98 0.99 0.95
Value Perception52.971.430.93 0.930.74
Price Perception13.241.76NANANA
NA—not available (because of one-item scale).
Table 4. Cross-correlations and square roots of AVEs of constructs’ measurement.
ConstructsWOM
Perception
Quality
Perception
Value Perception Price Perception *
Perceived WOM0.97
Perceived Quality0.950.97
Perceived Value0.660.580.86
Perceived Price *0.740.690.85NA
* Single-item measure; NA—not available.
Table 5. Contrasting test and re-test data of price perception measurement.
IndicatorComparison Group
1
(Price Below Acceptable Range and Positive eWOM)
4
(Price Within Acceptable Range and Positive eWOM)
7
(Price Beyond Acceptable Range and Positive eWOM)
t-statistic0.36−0.39−0.43
p-value
(Significance of difference)
0.72 *0.70 *0.67 *
d
(Difference between each pair of value)
0.100.120.13
* Not significant.
Table 6. Contrasting price against quality perceptions in value formation under mixed eWOM condition.
Key IndicatorsAcceptability Level of Price
Below
Expectation
Within
Expectation
Beyond
Expectation
Final Perceived Price and Quality as Predictors:
R20.950.930.81
Block 1: Final Perceived Price:
R20.940.930.81
F 343.20227.3783.81
p<0.001<0.001<0.001
Beta 0.970.960.89
t 18.5315.089.16
p<0.001<0.001<0.001
Block 2: Quality:
R2 0.010.01<0.001
F 3.400.990.002
p>0.05>0.05>0.05
Beta′0.16−0.120.01
t 1.84−0.990.04
p>0.05>0.05>0.05
(Dependent variable: perceived value).
Disclaimer/Publisher’s Note: The statements, opinions and data contained in all publications are solely those of the individual author(s) and contributor(s) and not of MDPI and/or the editor(s). MDPI and/or the editor(s) disclaim responsibility for any injury to people or property resulting from any ideas, methods, instructions or products referred to in the content.

