
Analysis of Latin American Theme Parks in a Tourism Context


Abstract
1. Introduction
2. Literature Review
2.1. Theme Parks Help to Improve Cities’ Economies and Tourism Activties
2.2. Air and Ground Means of Transport Play an Important Role in Theme Parks and Cities’ Tourism Supply
3. Methodology
Data Collection
4. Results of Research
Latin American Theme Parks Improve the Tourism Industry in Cities
5. Discussion and Conclusions
Funding
Institutional Review Board Statement
Informed Consent Statement
Data Availability Statement
Acknowledgments
Conflicts of Interest
References
- Elghonaimy, I.H.; AlSaeed, S. The role of theme parks in creating sustainable development. J.-Creat. Sustain. Dev. 2021, 3, 2. [Google Scholar] [CrossRef]
- Florido-Benítez, L. Film-induced tourism–the impact the of animation, cartoon, superhero, and fantasy movies. Tour. Rev. 2023, 78, 1298–1314. [Google Scholar] [CrossRef]
- Zheng, Y.; Weim, W.; Line, N.; Zhang, L. Integrating the tourist gaze with the social servicescape: Implications for creating memorable theme park experiences. Int. J. Hosp. Manag. 2021, 93, 102782. [Google Scholar] [CrossRef]
- Bodolica, V.; Spraggon, M.; Saleh, N. Innovative leadership in leisure and entertainment industry: The case of the UAE as a global tourism hub. Int. J. Islam. Middle East. Financ. Manag. 2022, 13, 323–337. [Google Scholar] [CrossRef]
- Tsang, N.K.; Lee, L.Y.; Wong, A.; Chong, R. THEMEQUAL—Adapting the SERVQUAL scale to theme park services: A case of Hong Kong Disneyland. J. Travel Tour. Mark. 2012, 29, 416–429. [Google Scholar] [CrossRef]
- Albayrak, T.; Cengizci, A.D.; Caber, M.; Fong, L.H.N. Big data use in determining competitive position: The case of theme parks in Hong Kong. J. Destin. Mark. Manag. 2021, 22, 100668. [Google Scholar] [CrossRef]
- TEA/AECOM. Theme Index Report. 2022. Available online: https://aecom.com/theme-index/ (accessed on 17 June 2023).
- TEA/AECOM. Global Attractions Attendance Report. 2021. Available online: https://aecom.com/wp-content/uploads/documents/reports/AECOM-Theme-Index-2021.pdf (accessed on 28 November 2023).
- Santos, S.C.S.; Da Cunha, M.B. Theme park, popularization and amazonic research: The proposal of the science Grove park/INPA. Educ. Rev. 2022, 38, e29448. [Google Scholar] [CrossRef]
- Duarte, R.H. Zoos in Latin America. In Oxford Research Encyclopedia of Latin American History; Oxford University Press: Oxford, UK, 2017. [Google Scholar] [CrossRef]
- Freitag, F.; Carlà-Uhink, F.; Anton-Clavé, S. Key Concepts in Theme Park Studies. Understanding Tourism and Leisure Spaces; Springer: Cham, Switzerland, 2023. [Google Scholar] [CrossRef]
- Florido-Benítez, L. Air connectivity and proximity airports as an added value for museums. Mus. Worlds 2023, 11, 136154. [Google Scholar] [CrossRef]
- Florido-Benítez, L. The impact of tourism promotion in tourist destinations: A bibliometric study. Int. J. Tour. Cities 2022, 8, 844–882. [Google Scholar] [CrossRef]
- Paiva, B.L.F. Da Teoria à Prática: Uma Análise Sobre as Estratégias de Marketing Utilizadas pelo Parque Beto Carrero World; Universidade de Brasilia: Brasília, Brazil, 2018. [Google Scholar]
- Abdin, F.; Fajardo, A.; Prudencio, J. Expansion of Disneyland to Brazil; ESCI, UPF International Business: Barcelona, Spain, 2016; pp. 1–63. Available online: https://repositori.upf.edu/handle/10230/27001 (accessed on 21 January 2024).
- Vargas-Hernández, J.G.; De la Cruz, P.M.A.; Er, C. The entertainment leader in Mexico: A strategic alliance. Int. J. Bus. Manag. Insight Transform. 2019, 3, 16–25. [Google Scholar]
- Vogel, H.L. Amusement/Theme Parks and Resorts. In Travel Industry Economics; Springer: Cham, Switzerland, 2021. [Google Scholar]
- Yip, A.C.Y.; Yiu, E. Corporate Social Responsibility (CSR) in Corporate DNA: A Case Study of Ocean Park Hong Kong. In International Dimensions of Sustainable Management. CSR, Sustainability, Ethics and Governance; Schmidpeter, R., Capaldi, N., Idowu, S., Stürenberg Herrera, A., Eds.; Springer: Cham, Switzerland, 2019. [Google Scholar]
- Weng, J.; Ding, Y.; Yu, L. Measuring demand spillover of vacation town—A case of Shanghai Disney Resort. Asia Pac. J. Tour. Res. 2021, 26, 95–108. [Google Scholar] [CrossRef]
- Li, B.; Zhang, T.; Hua, N.; Jahromi, M.F. Developing an overarching framework on theme park research: A critical review method. Curr. Issues Tour. 2021, 24, 2821–2837. [Google Scholar] [CrossRef]
- Liang, Z.; Li, X. What is a Theme Park? A Synthesis and Research Framework. J. Hosp. Tour. Res. 2022, 47, 1343–1370. [Google Scholar] [CrossRef]
- Fu, X.; Baker, C.; Zhang, W.; Zhang, R.E. Theme Park Storytelling: Deconstructing Immersion in Chinese Theme Parks. J. Travel Res. 2023, 62, 893–906. [Google Scholar] [CrossRef]
- United Nations. World Economic Situation and Prospects 2011. 2011. Available online: https://www.un.org/en/development/desa/policy/wesp/wesp_current/2011wespupdate.pdf (accessed on 18 January 2024).
- Dridea, C.R.; Strutzen, G. Theme Park: The main concept of tourism industry development. Ann. Univ. Oradea Econ. Sci. Ser. 2008, 17, 641–646. [Google Scholar]
- Chang, M.-Y.; Hsu, Y.-S.; Chen, H.-S. Choice Experiment Method for Sustainable Tourism in Theme Parks. Sustainability 2021, 13, 7146. [Google Scholar] [CrossRef]
- Antón-Clavé, S. The Global Theme Park Industry; CABI: Oxfordshire, UK, 2007. [Google Scholar]
- Zhang, Z.A.; Liang, Z.; Bao, J. From theme park to cultural tourism town: Disneyization turning of tourism space in China. Reg. Sustain. 2021, 2, 156–163. [Google Scholar] [CrossRef]
- Milman, A. Key attributes for evaluating the guest experience at theme parks. Int. J. Tour. Res. 2009, 11, 373–387. [Google Scholar] [CrossRef]
- Bruner, E.M.; Bruner, E.M. Culture on Tour: Ethnographies of Travel; University of Chicago Press: Chicago, IL, USA, 2005. [Google Scholar]
- Haneef, S.K.; Ansari, Z.; Bhavani, G. Attractions of Dubai and Expo 2020: An exploratory study. Worldw. Hosp. Tour. Themes 2019, 11, 266–278. [Google Scholar] [CrossRef]
- Florido-Benítez, L. Bridges: A tourist attraction and iconic element at urban cities’ tourism promotion websites. Int. J. Tour. Cities 2023, 9, 771–787. [Google Scholar] [CrossRef]
- Comerio, N.; Strozzi, F. Tourism and its economic impact: A literature review using bibliometric tools. Tour. Econ. 2019, 25, 109–131. [Google Scholar] [CrossRef]
- Butler, R.W. The concept of a tourist area cycle of evolution: Implications for management of resources. Can. Geogr. 1980, 24, 5–12. [Google Scholar] [CrossRef]
- Oh, J.E.; Kong, A. VR and Nostalgia: Using animation in theme parks to enhance visitor engagement. J. Promot. Manag. 2022, 28, 113–127. [Google Scholar] [CrossRef]
- Calero, C.; Turner, L.W. Regional economic development and tourism: A literature review to highlight future directions for regional tourism research. Tour. Econ. 2020, 26, 3–26. [Google Scholar] [CrossRef]
- Klijs, J.; Heijman, W.; Maris, D.K.; Bryon, J. Criteria for comparing economic impact models of tourism. Tour. Econ. 2012, 18, 1175–1202. [Google Scholar] [CrossRef]
- Roodbari, H.; Olya, H. An integrative framework to evaluate impacts of complex tourism change initiatives. Tour. Manag. 2024, 100, 104829. [Google Scholar] [CrossRef]
- Florido-Benítez, L. International mobile marketing: A satisfactory concept for companies and users in times of pandemic. Benchmarking Int. J. 2022, 29, 1826–1856. [Google Scholar] [CrossRef]
- Florido-Benítez, L. Constructing Spanish smart destinations: A new guide for the tourism industry. Int. J. Tour. Cities 2024. ahead of print. [Google Scholar] [CrossRef]
- Olya, H.G. Towards advancing theory and methods on tourism development from residents’ perspectives: Developing a framework on the pathway to impact. J. Sustain. Tour. 2023, 31, 329–349. [Google Scholar] [CrossRef]
- Ramkissoon, H. Perceived social impacts of tourism and quality-of-life: A new conceptual model. J. Sustain. Tour. 2023, 31, 442–459. [Google Scholar] [CrossRef]
- Tyrrell, T.J.; Johnston, R.J. A framework for assessing direct economic impacts of tourist events: Distinguishing origins, destinations, and causes of expenditures. J. Travel Res. 2001, 40, 94–100. [Google Scholar] [CrossRef]
- Yang, S.; Huang, G.Q.; Song, H.; Liang, L. Game-Theoretic Approach to Competition Dynamics in Tourism Supply Chains. J. Travel. Res. 2009, 47, 425–439. [Google Scholar] [CrossRef]
- Xiao, F.; Wang, J.; Xiong, M.; Mo, H. Does spatiotemporal heterogeneity matter? Air transport and the rise of high-tech industry in China. Appl. Geogr. 2024, 162, 103148. [Google Scholar] [CrossRef]
- Yirgu, K.W.; Kim, A.M. Airport choices and resulting catchments in the US Midwest. J. Transp. Geogr. 2024, 114, 103743. [Google Scholar] [CrossRef]
- O’Connell, J.F.; Avellana, R.M.; Warnock-Smith, D.; Efthymiou, M. Evaluating drivers of profitability for airlines in Latin America: A case study of Copa Airlines. J. Air Transp. Manag. 2020, 84, 101727. [Google Scholar] [CrossRef]
- OAG. Traffic Analyser, Subscription Database. 2017. Available online: https://analytics.oag.com/analyser-client/home (accessed on 18 January 2024).
- Wang, J.; Wang, Y.; Zhang, S.; Fan, C.; Zhou, N.; Liu, J.; Li, X.; Liu, Y.; Hou, X.; Yi, B. Accounting of aviation carbon emission in developing countries based on flight-level ADS-B data. Appl. Energy 2024, 358, 122600. [Google Scholar] [CrossRef]
- Logothetis, M.; Myyoshi, C. Network performance and competitive impact of the single hub—A case study on Turkish Airlines and Emirates. J. Air. Transp. Manag. 2018, 69, 215–223. [Google Scholar] [CrossRef]
- Pietrzak, K.; Pietrzak, O. Environmental Effects of Electromobility in a Sustainable Urban Public Transport. Sustainability 2020, 12, 1052. [Google Scholar] [CrossRef]
- Zhu, J.; Xie, N.; Cai, Z.; Wei Tang, W.; Xiqun, M.C. A comprehensive review of shared mobility for sustainable transportation systems. Int. J. Sustain. Transp. 2023, 17, 527–551. [Google Scholar] [CrossRef]
- UITP. Europe. EU Funds and Financing for Resilient Local Mobility. 2022. Available online: https://cms.uitp.org/wp/wp-content/uploads/2022/03/EU-Funds-and-Financing-policy-paper.pdf (accessed on 17 January 2024).
- Intelligent Transport. The Importance of Public Transport in Latin America. 2016. Available online: https://www.intelligenttransport.com/transport-articles/19098/importance-public-transport-latin-america/ (accessed on 19 January 2024).
- Le-Klähn, D.T.; Hall, C.M. Tourist use of public transport at destinations—A review. Curr. Issues Tour. 2015, 18, 785–803. [Google Scholar] [CrossRef]
- Albalate, D.; Bel, G. Tourism and urban public transport: Holding demand pressure under supply constraints. Tour. Manag. 2010, 31, 425–433. [Google Scholar] [CrossRef]
- Sarma, M.K. Towards positioning a tourist destination: A study of northeast India. J. Hosp. Tour. 2003, 2, 104–117. [Google Scholar]
- Bills, J. 19 Cities with the Best Public Transport in the World—According to Locals. 2023. Available online: https://www.timeout.com/travel/best-public-transport-in-the-world (accessed on 17 January 2024).
- Mandeno, T.G. Is Tourism a Driver for Public Transport Investment? Ph.D. Thesis, University of Otago, Dunedin, New Zealand, 2012. Available online: http://hdl.handle.net/10523/2222 (accessed on 27 January 2024).
- Tan, W.-K.; Huang, S.-Y. Why visit theme parks? A leisure constraints and perceived authenticity perspective. J. Retail. Consum. Serv. 2020, 57, 102194. [Google Scholar] [CrossRef]
- Duan, X.; Chan, C.-S.; Marafa, L.M. Does authenticity exist in cultural theme parks? A case study of Millennium City Park in Henan, China. J. Tour. Cult. Chang. 2019, 17, 321–338. [Google Scholar] [CrossRef]
- Campa, J.L.; Pagliara, F.; López-Lambas, M.E.; Arce, R.; Guirao, B. Impact of High-Speed Rail on Cultural Tourism Development: The Experience of the Spanish Museums and Monuments. Sustainability 2019, 11, 5845. [Google Scholar] [CrossRef]
- Aparicio, D.; Martín-Caro, M.S.H.; García-Palomares, J.C.; Gutiérrez, J. Exploring the spatial patterns of visitor expenditure in cities using bank card transactions data. Curr. Issues Tour. 2022, 25, 2770–2788. [Google Scholar] [CrossRef]
- Başarangil, I. The relationships between the factors affecting perceived service quality, satisfaction, and behavioral intentions among theme park visitors. Tour. Hosp. Res. 2018, 18, 415–428. [Google Scholar] [CrossRef]
- Bilal, U.; Alazraqui, M.; Caiaffa, W.T.; Lopez-Olmedo, N.; Martinez-Folgar, K.; Miranda, J.J.; Diez-Roux, A.V. Inequalities in life expectancy in six large Latin American cities from the SALURBAL study: An ecological analysis. Lancet Planet. Health 2019, 3, e503–e510. [Google Scholar] [CrossRef] [PubMed]
- Park, S.B.; Kim, J.; Lee, Y.K.; Ok, C.M. Visualizing theme park visitors’ emotions using social media analytics and geospatial analytics. Tour. Manag. 2020, 80, 104127. [Google Scholar] [CrossRef]
- Luo, J.L.; Vu, H.Q.; Li, G.; Law, R. Topic modelling for theme park online reviews: Analysis of Disneyland. J. Travel Tour. Mark. 2020, 37, 272–285. [Google Scholar] [CrossRef]
- Chen, H.; Wang, M.; Zheng, S. Research on the Spatial Network Effect of Urban Tourism Flows from Shanghai Disneyland. Sustainability 2022, 14, 13973. [Google Scholar] [CrossRef]
- Hua, Z.; Song, H.; Zou, K. Research on Disney’s Possible Expansion Strategy in Asian Market. In Proceedings of the 2021 3rd International Conference on Economic Management and Cultural Industry; Atlantis Press: Paris, France, 2021; pp. 2618–2625. [Google Scholar]
- Zhang, Y.; Li, X.; Cárdenas, D.A.; Liu, Y. Calculating Theme Parks’ Tourism Demand and Attractiveness Energy: A Reverse Gravity Model and Particle Swarm Optimization. J. Travel Res. 2022, 61, 314–330. [Google Scholar] [CrossRef]
- Florido-Benítez, L. Málaga Costa del Sol airport and its new conceptualisation of hinterland. Tour. Crit. Pract. Theory 2021, 2, 195–221. [Google Scholar]
- Florido-Benítez, L. The Pre/On/Post of Low-Cost carriers in Spanish tourist destinations. Rev. Tur. Estud. Práticas 2022, 11, 1–26. [Google Scholar]
- Florido-Benítez, L. The effects of COVID-19 on Andalusian tourism and aviation sector. Tour. Rev. 2021, 76, 829–857. [Google Scholar] [CrossRef]
- Sun, L.-H.; Uysal, M. The Role of Theme Parks in Tourism. Hosp. Rev. 1994, 12, 71–80. [Google Scholar]
- Griffin, E.; Ford, L. A Model of Latin American City Structure. Geogr. Rev. 1980, 70, 397–422. [Google Scholar] [CrossRef]
- Wendel, H.E.W.; Zarger, R.K.; Mihelcic, J.R. Accessibility and usability: Green space preferences, perceptions, and barriers in a rapidly urbanizing city in Latin America. Landsc. Urban Plan. 2012, 107, 272–282. [Google Scholar] [CrossRef]
- Google Map. Time from Airport to Center. 2022. Available online: https://www.google.es/maps/?hl=es (accessed on 9 December 2022).
- Florido-Benítez, L.; Lora-Castillero, E. Analysis of the value chain of Avanza Mobility ADO company. Rev. Transp. Territ. 2022, 26, 246–281. [Google Scholar]
- Giraud, T. Osrm: Interface Between R and the OpenStreetMap-Based Routing Service OSRM. J. Open Source Softw. 2022, 7, 1–7. [Google Scholar] [CrossRef]
- Iso4app Software. Iso4app Api. 2022. Available online: www.iso4app.net (accessed on 9 December 2022).
- Bao, J.G. Theme Park Studies in China; Science Press: Beijing, China, 2015. [Google Scholar]
- Kim, Y.; Kim, E.-J.; Jang, S.; Kim, D.-K. A comparative analysis of the users of private cars and public transportation for intermodal options under Mobility-as-a-Service in Seoul. Travel Behav. Soc. 2021, 24, 68–80. [Google Scholar] [CrossRef]
- Li, X.; Pan, B.; Law, R.; Huang, X. Forecasting Tourism Demand with Composite Search Index. Tour. Manag. 2017, 59, 57–66. [Google Scholar] [CrossRef]
- van der Borg, J.; Costa, P.; Gotti, G. Tourism in European heritage cities. Ann. Tour. Res. 1996, 23, 306–321. [Google Scholar] [CrossRef]
- Noonan, L. The role of culture as a determinant of tourism demand: Evidence from European cities. Int. J. Tour. Cities 2022, 9, 13–34. [Google Scholar] [CrossRef]
- Papastathopoulos, A.; Koritos, C.; Mertzanis, C. Effects of faith-based attributes on hotel prices: The case of halal services. Int. J. Contemp. Hosp. Manag. 2021, 33, 2839–2861. [Google Scholar] [CrossRef]
- Oklevik, O.; Gössling, S.; Hall, C.M.; Jacobsen, J.K.S.; Grøtte, I.P.; McCabe, S. Overtourism, optimisation, and destination performance indicators: A case study of activities in Fjord Norway. J. Sustain. Tour. 2019, 27, 1804–1824. [Google Scholar] [CrossRef]
- Lin, V.S.; Qin, Y.; Li, G.; Jiang, F. Multiple effects of “distance” on domestic tourism demand: A comparison before and after the emergence of COVID-19. Ann. Tour. Res. 2022, 95, 103440. [Google Scholar] [CrossRef]
- Wang, Q.; Lu, S. The influence of hybrid accessibility on tourism economy in prefecture-level cities: Evidence from China’s high-speed rail network. J. Transp. Geogr. 2022, 104, 103417. [Google Scholar] [CrossRef]
- Tennøy, A.; Knapskog, M.; Wolday, F. Walking distances to public transport in smaller and larger Norwegian cities. Transp. Res. Part D Transp. Environ. 2022, 103, 103169. [Google Scholar] [CrossRef]
- Camargo, B.A.; Winchenbach, A.; Vázquez-Maguirre, M. Restoring the dignity of indigenous people: Perspectives on tourism employment. Tour. Manag. Perspect. 2022, 41, 100946. [Google Scholar] [CrossRef]
- Mohri, S.S.; Mortazavi, S.; Nassir, N. A clustering method for measuring accessibility and equity in public transportation service: Case study of Melbourne. Sustain. Cities Soc. 2021, 74, 103241. [Google Scholar] [CrossRef]
- Xu, W.; Yang, L. Evaluating the urban land use plan with transit accessibility. Sustain. Cities Soc. 2019, 45, 474–485. [Google Scholar] [CrossRef]
- White, D. Tourism as economic development for native people living in the shadow of a protected area: A North American case study. Soc. Nat. Resour. 1993, 6, 339–345. [Google Scholar] [CrossRef]
- TEA/AECOM. Global Attractions Attendance Report 2014. 2014. Available online: https://aecom.com/content/wp-content/uploads/2015/10/2014_Theme_Index.pdf (accessed on 29 January 2023).
- Pan, H.; Bahja, F.; Cobanoglu, C. Analysis of U.S. theme park selection and international implications. J. Transnatl. Manag. 2018, 23, 22–38. [Google Scholar] [CrossRef]
- Canh, N.P.; Thanh, S.D. Domestic tourism spending and economic vulnerability. Ann. Tour. Res. 2020, 85, 103063. [Google Scholar] [CrossRef] [PubMed]
- Roberts, B.R. Globalization and Latin American cities. Int. J. Urban Reg. Res. 2005, 29, 110–123. [Google Scholar] [CrossRef]
- UNTWO. International Tourism Highlights 2019. 2019. Available online: https://www.e-unwto.org/doi/pdf/10.18111/9789284421152 (accessed on 6 January 2023).
- Mulder, N. The Impact of the COVID-19 Pandemic on the Tourism Sector in Latin America and the Caribbean, and Options for a Sustainable and Resilient Recovery. 2020. Available online: https://repositorio.cepal.org/handle/11362/46502 (accessed on 13 March 2023).
- Florido-Benítez, L. The accessibility of beaches for blind people and their guide dogs: Accessible tourism and inclusion in Spain. Tour. Rev. 2023; ahead of print. [Google Scholar] [CrossRef]
- Paget-Seekins, L.; Tironi, M. The publicness of public transport: The changing nature of public transport in Latin American cities. Transp. Policy 2016, 49, 176–183. [Google Scholar] [CrossRef]
- Di Pasquale, G.; dos Santos, A.S.; Leal, A.G.; Tozzi, M. Innovative public transport in Europe, Asia and Latin America: A survey of recent implementations. Transp. Res. Procedia 2016, 14, 3284–3293. [Google Scholar] [CrossRef][Green Version]
- IATA. Global Outlook for Air Transport. A Local Sweet Spot. 2023. Available online: https://www.iata.org/en/iata-repository/publications/economic-reports/global-outlook-for-air-transport---december-2023---report/#:~:text=Despite%20a%20decline%20in%20cargo,surpassing%20their%20pre%2DCovid%20levels (accessed on 6 January 2024).
- Falavigna, C.; Hernández, D. Assessing inequalities on public transport affordability in two Latin American cities: Montevideo (Uruguay) and Córdoba (Argentina). Transp. Policy 2016, 45, 145–155. [Google Scholar] [CrossRef]
- Macdonald, G.F.; Alsford, S. Museums and theme parks: Worlds in collision? Mus. Manag. Curatorship 1995, 14, 129–147. [Google Scholar] [CrossRef]
- Vecchio, G.; Tiznado-Aitken, I.; Hurtubia, R. Transport and equity in Latin America: A critical review of socially oriented accessibility assessments. Transp. Rev. 2020, 40, 354–381. [Google Scholar] [CrossRef]
- IATA. Airline and Airport Code Search. 2024. Available online: https://www.iata.org/en/publications/directories/code-search/ (accessed on 6 January 2024).
- Mexico City Airport. Statistics of International Benito Juarez Ciudad de Mexico Airport. 2021. Available online: https://www.aicm.com.mx/categoria/estadisticas (accessed on 1 June 2023).
- Mastercard. 10 Years Later: The Cities in Latin America and the Caribbean Taking Cross Border Travel to New Levels. 2019. Available online: https://www.mastercard.com/news/latin-america/en/newsroom/press-releases/pr-en/2019/september/10-years-later-the-cities-in-latin-america-the-caribbean-taking-cross-border-travel-to-new-levels/ (accessed on 5 June 2023).
- Gobierno de Mexico. Statistics of Mexico Airports. 2021. Available online: http://www.sct.gob.mx/index.php?id=2306 (accessed on 6 June 2023).
- Baker, C. The prevalence of storyworlds and thematic landscapes in global theme parks. Ann. Tour. Res. Empir. Insights 2023, 4, 100080. [Google Scholar] [CrossRef]
- Toro, E.E.M.; van der Krogt, A.; Vallejo, J.S. Challenges to the Mobility and Integration of Public Transport Systems in Latin America. In Proceedings of the CVISP 2020: 2020 4th International Conference on Vision, Image and Signal Processing, Bangkok, Thailand, 9–11 December 2020; Volume 52, pp. 1–7. [Google Scholar]
- Yang, L.; Zhou, J.; Shyr, O.F.; Huo, D. Does bus accessibility affect property prices? Cities 2019, 84, 56–65. [Google Scholar] [CrossRef]
- Bertoncello, R.V.; Iuso, R. Turismo urbano en contexto metropolitano: Tigre como destino turístico en el Área Metropolitana de Buenos Aires (Argentina). Cuad. Geogr. Rev. Colomb. Geogr. 2016, 25, 107–125. [Google Scholar] [CrossRef]
- The World Bank. International Tourism, Number of Arrivals—Latin America and Caribbean. 2020. Available online: https://data.worldbank.org/indicator/ST.INT.ARVL?end=2019andlocations=ZJandstart=1995andview=chart (accessed on 12 June 2023).
- UNTWO. 145 Key Tourism Statistics (Tourism Industries). 2021. Available online: https://www.unwto.org/tourism-statistics/key-tourism-statistics (accessed on 1 May 2023).
- TEA/AECOM. Theme Index Report. 2019. Available online: https://aecom.com/wp-content/uploads/documents/reports/AECOM-Theme-Index-2019.pdf (accessed on 17 December 2023).
- Samunderu, E. Tourism Development in Sub-Sahara Africa and Impact on Regional Airline Business Models. In African Air Transport Management. Advances in African Economic, Social and Political Development; Springer: Cham, Switzerland, 2023. [Google Scholar] [CrossRef]
- Istiak, K. Psychological Factors of Canadian and Mexican tourists and the US tourism sector. Tour. Econ. 2023, 29, 1328–1354. [Google Scholar] [CrossRef]
- Cota, I. Political Turbulence Limits Latin America’s Economic Prospects. 2023. Available online: https://english.elpais.com/economy-and-business/2023-10-20/political-turbulence-limits-latin-americas-economic-prospects.html# (accessed on 12 January 2024).
- Lee, S.; Jeong, E.; Qu, K. Exploring Theme Park Visitors’ Experience on Satisfaction and Revisit Intention: A Utilization of Experience Economy Model. J. Qual. Assur. Hosp. Tour. 2020, 21, 474–497. [Google Scholar] [CrossRef]
- IAAPA. IAAPA Theme and Amusement Parks at a Glance: Latin America. 2023. Available online: https://amusementlogic.com/general-news/iaapa-theme-and-amusement-parks-at-a-glance-latin-america/ (accessed on 19 January 2024).
- United Nations. An Epidemic on the Move: The Shifting Landscape of Citizen Security in Latin America and the Caribbean. 2023. Available online: https://www.undp.org/latin-america/blog/epidemic-move-shifting-landscape-citizen-security-latin-america-and-caribbean (accessed on 19 January 2024).
- Milman, A. The global theme park industry. Worldw. Hosp. Tour. Themes 2010, 2, 220–237. [Google Scholar] [CrossRef]
- Richard, B.; Kaak, K.; Orlowski, M. Theme Park Tourism; SAGE Publications: Thousand Oaks, CA, USA, 2017; Volume 1–4, pp. 1218–1221. [Google Scholar] [CrossRef]
- Florido-Benítez, L. COVID-19 and BREXIT Crisis: British Isles must not kill the goose that lays the golden egg of tourism. Gran Tour. 2022, 25, 61–100. [Google Scholar]
- Malacane, C.A. Preliminary Design of a Public Transportation System to Support a Theme Park. Master’s Thesis, Faculty of the Virginia Polytechnic Institute and State University, Blacksburg, VA, USA, 1992. Available online: http://hdl.handle.net/10919/45226 (accessed on 19 January 2024).
- Gutiérrez, A.; Miravet, D. The Determinants of Tourist Use of Public Transport at the Destination. Sustainability 2016, 8, 908. [Google Scholar] [CrossRef]
- Dang, Y.; Wang, C.; Chen, P. Identification and Optimization Strategy of Urban Park Service Areas Based on Accessibility by Public Transport: Beijing as a Case Study. Sustainability 2022, 14, 7112. [Google Scholar] [CrossRef]
- Florido-Benítez, L. The location of airport an added value to improve the number of visitors at US museums. Case Stud. Transp. Policy 2023, 11, 100961. [Google Scholar] [CrossRef]
- Babić, D.; Kalić, M.; Janić, M.; Dožić, S.; Kukić, K. Integrated Door-to-Door Transport Services for Air Passengers: From Intermodality to Multimodality. Sustainability 2022, 14, 6503. [Google Scholar] [CrossRef]
- Kirova, V.; Thanh, T.V. Smartphone use during the leisure theme park visit experience: The role of contextual factor. Inf. Manag. 2019, 56, 742–753. [Google Scholar] [CrossRef]
- Cornelis, P.C.M. Impact of new attractions on theme park attendance. Worldw. Hosp. Tour. Themes 2010, 2, 262–280. [Google Scholar]
- Pereira, A.Q.; Dantas, E.W.C. Theme and Water Parks in Brazil. GEOUSP 2021, 25, e182522. [Google Scholar]


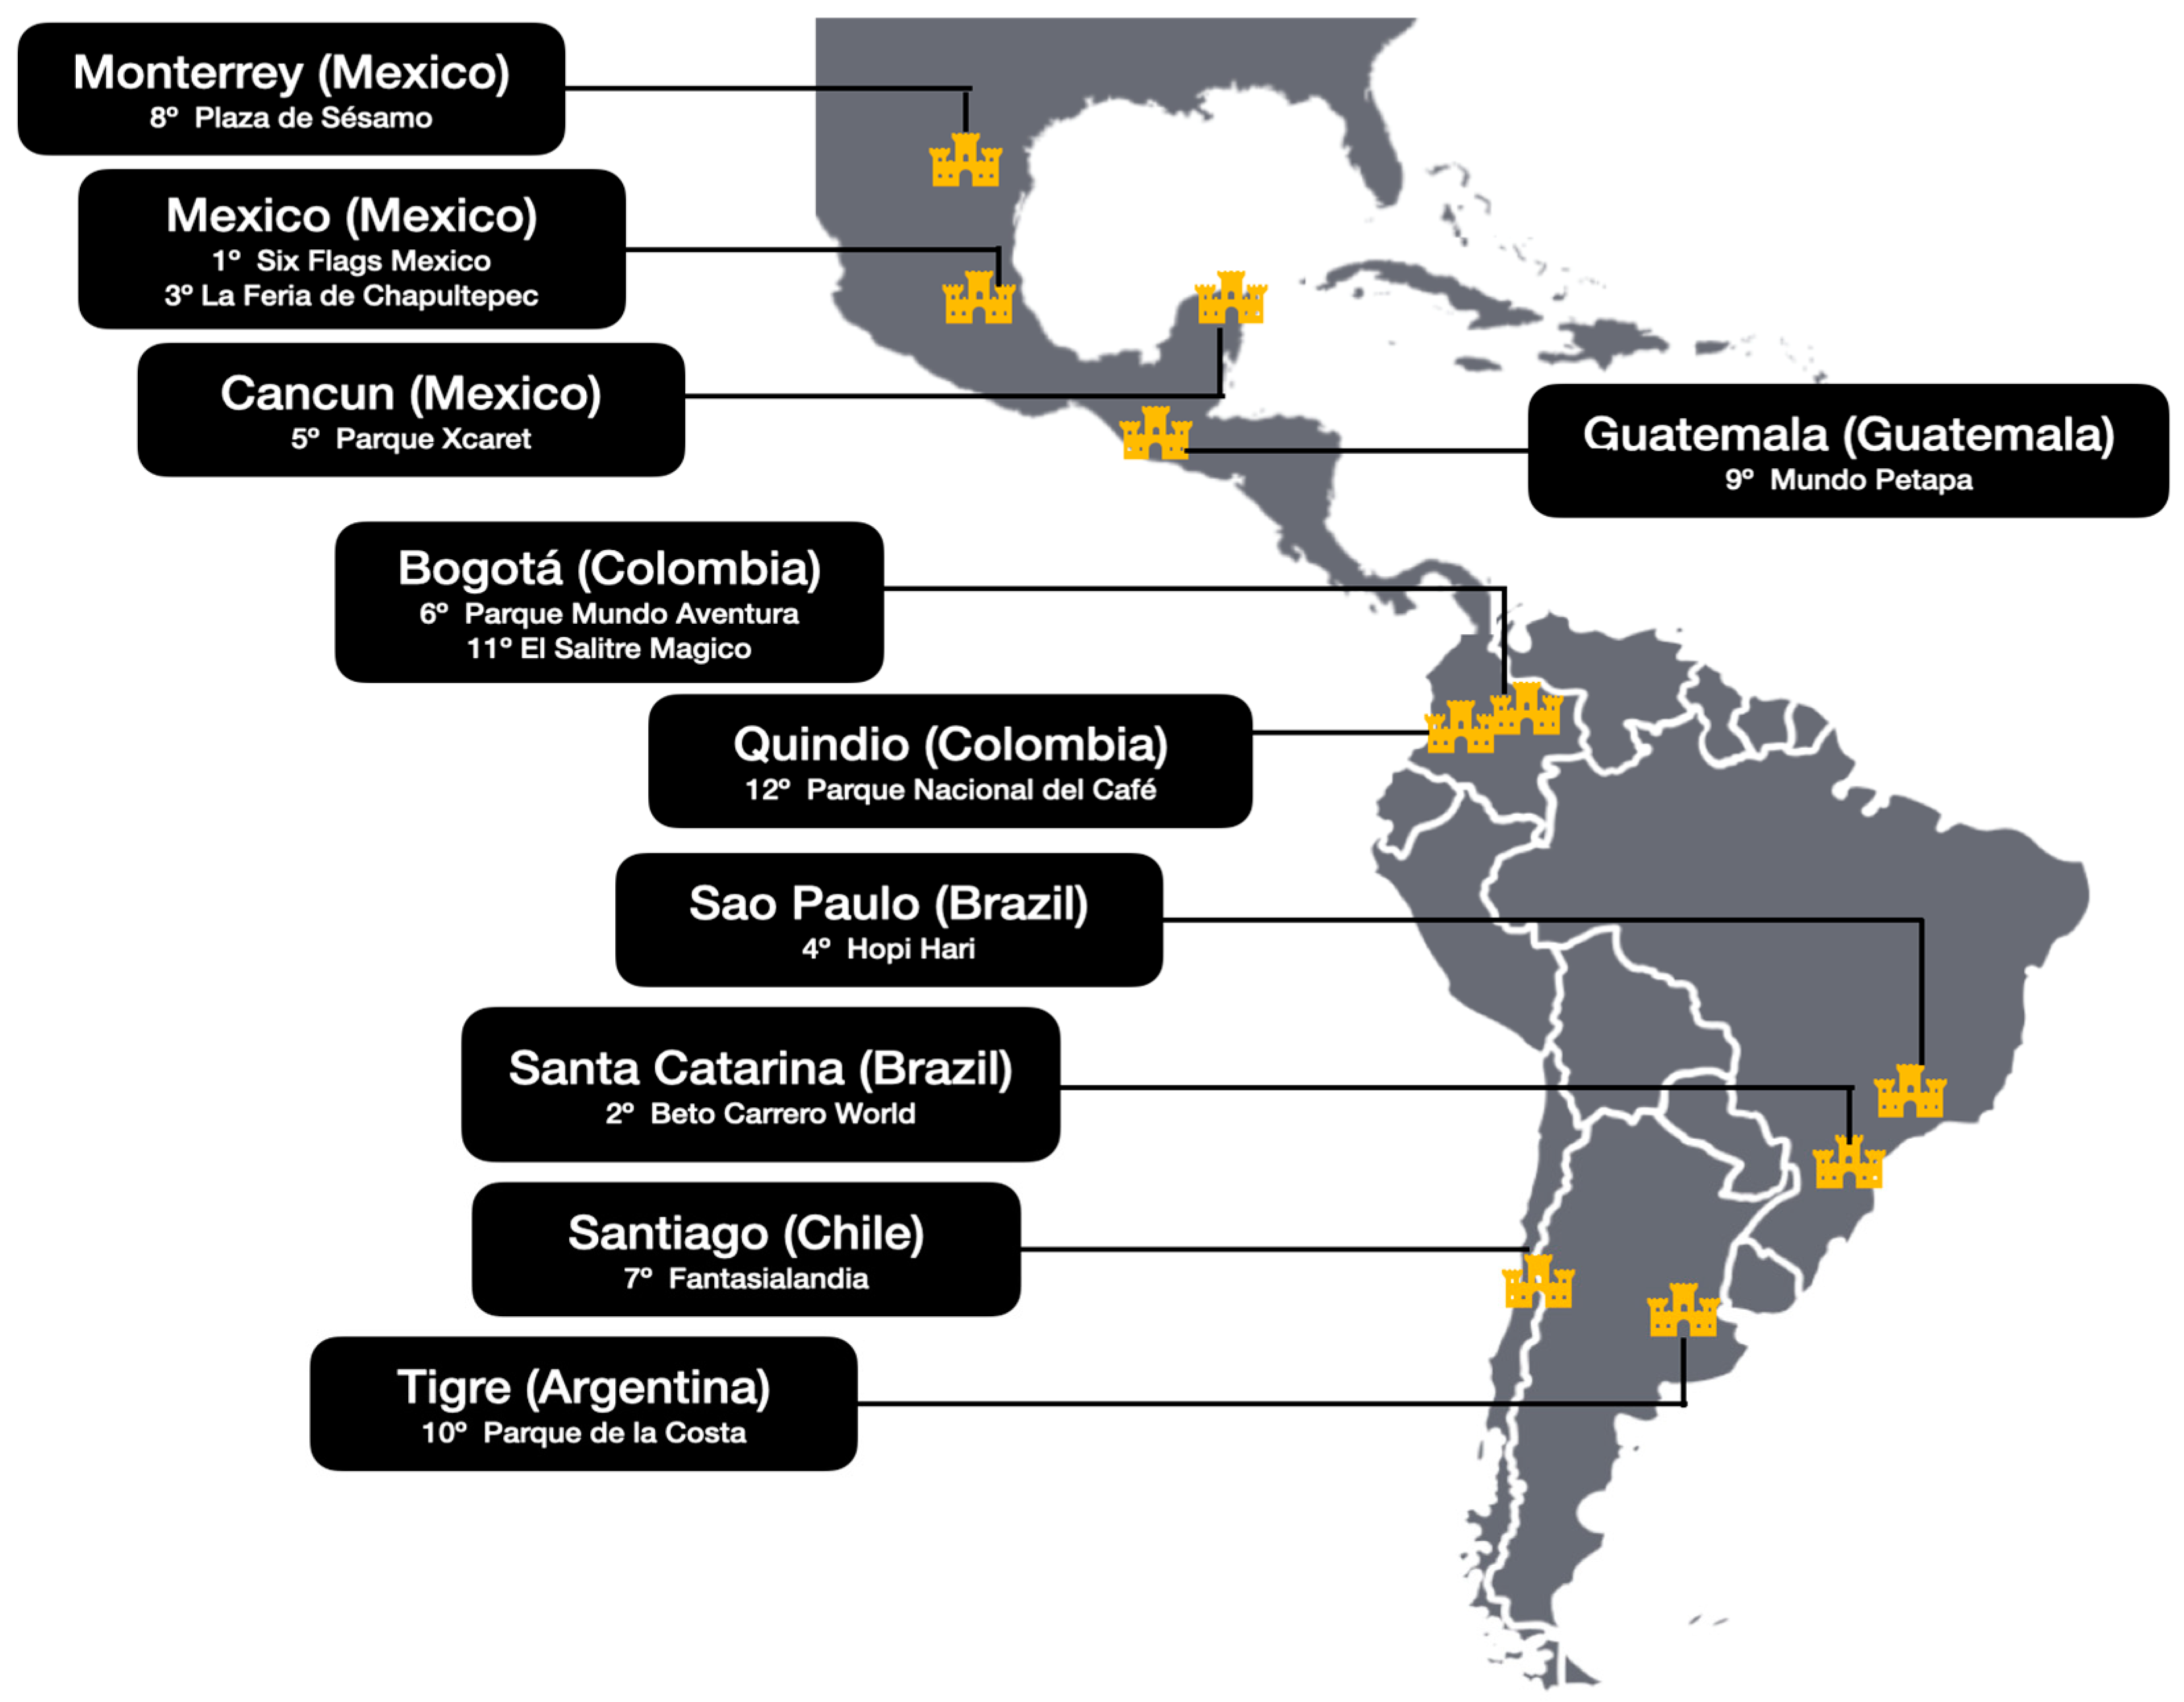
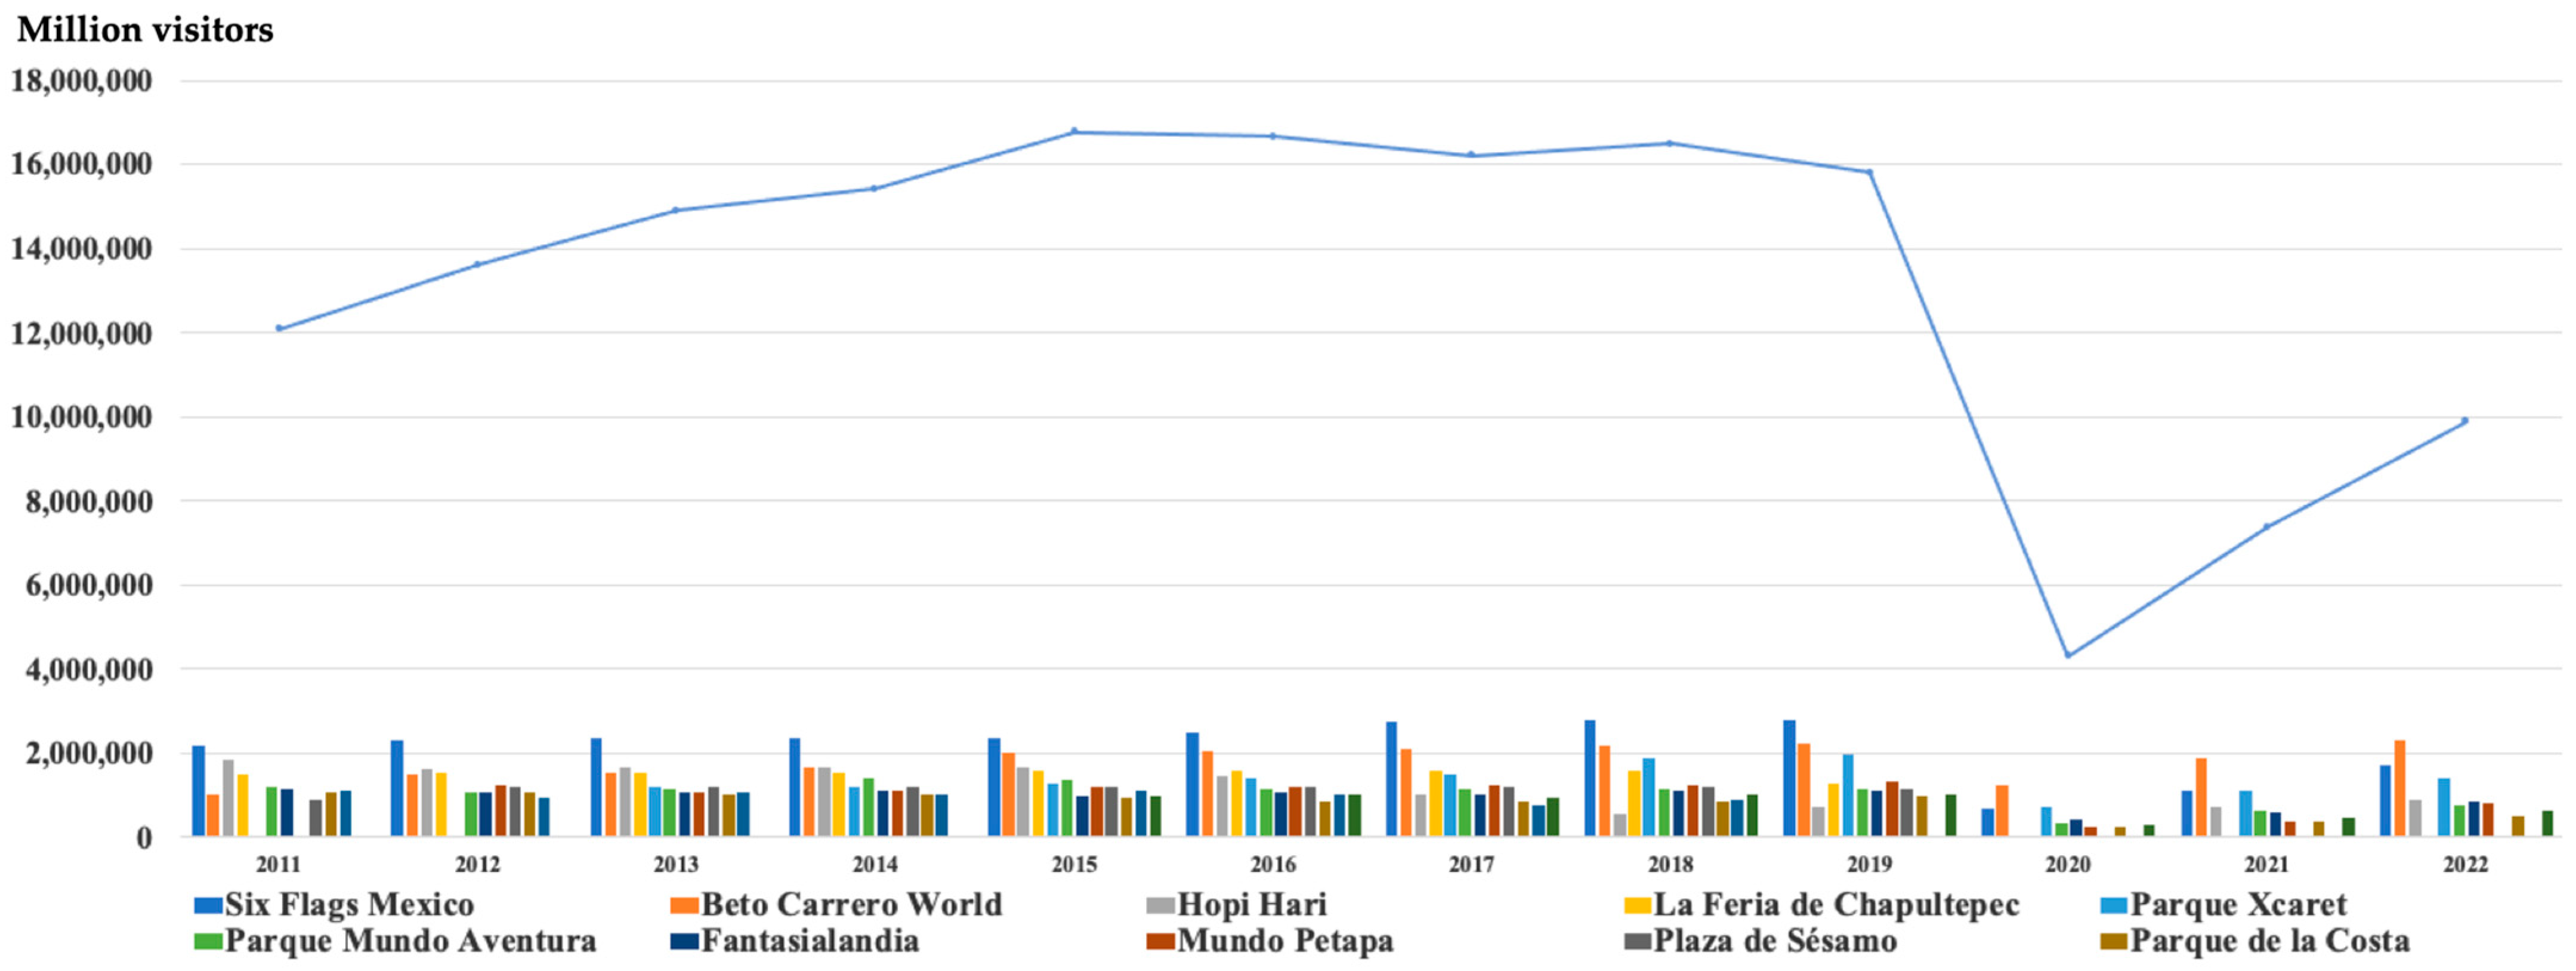
| Rank | Theme Park | Location | Total Visitors (2011–2022) | Total % (2011–2022) |
|---|---|---|---|---|
| 1 | Six Flags Mexico | Mexico City, Mexico | 25,956,000 | 16.3% |
| 2 | Beto Carrero World | Peña (Santa Catarina), Brazil | 21,880,000 | 13.7% |
| 3 | Hopi Hari | Sao Paulo, Brazil | 13,914,321 | 8.7% |
| 4 | La Feria de Chapultepec | Mexico City, Mexico | 13,798,000 | 8.6% |
| 5 | Parque Xcaret | Cancún, Mexico | 13,687,000 | 8.6% |
| 6 | Parque Mundo Aventura | Bogotá, Colombia | 12,606,000 | 7.9% |
| 7 | Fantasilandia | Santiago, Chile | 11,680,000 | 7.3% |
| 8 | Mundo Petapa | Guatemela City, Guatemala | 11,131,000 | 7.0% |
| 9 | Plaza de Sésamo | Monterrey, Mexico | 10,523,000 | 6.6% |
| 10 | Parque de la Costa | Tigre, Argentina | 9,958,000 | 6.2% |
| 11 | El Salitre Magico | Bogotá, Colombia | 7,913,000 | 5.0% |
| 12 | Parque Nacional del Café | Quindio, Colombia | 6,516,000 | 4.1% |
| Total visitors | 159,562,321 | 100.0% |
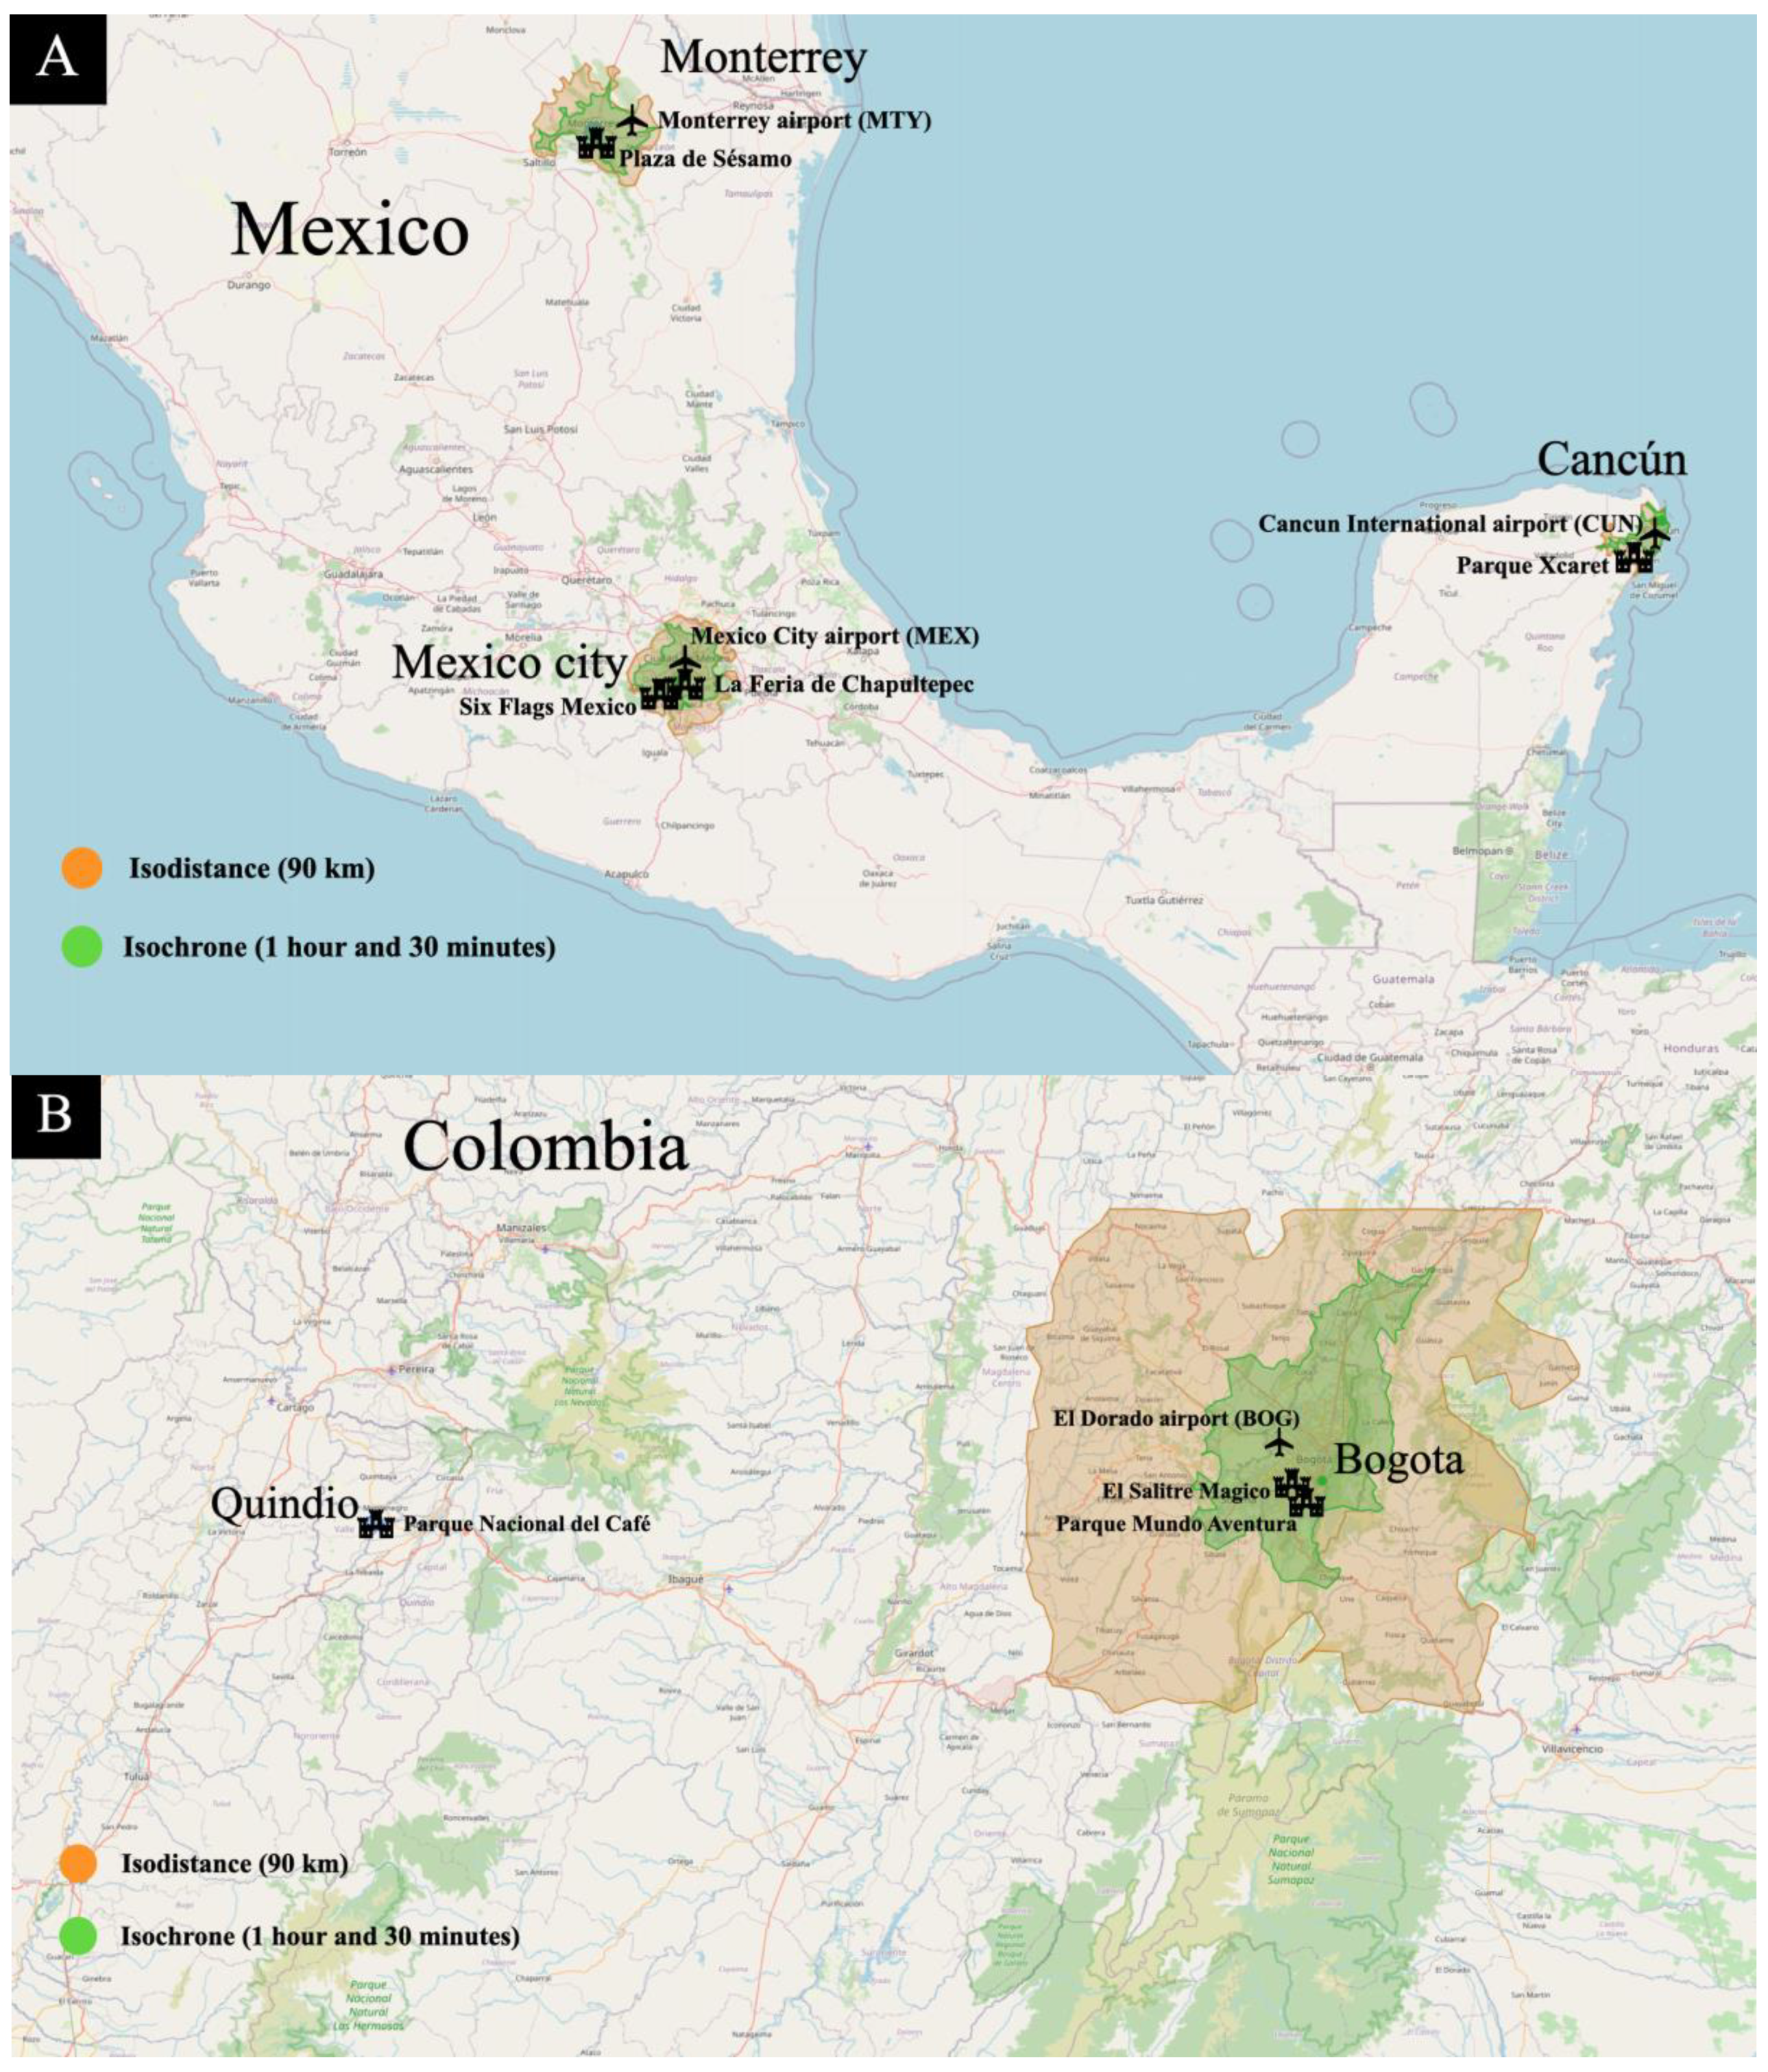
| Country | Theme Park | Location of Theme Park | Airport Near City Centre | Time for Public Transport from Airport to City Centre | Population of City |
|---|---|---|---|---|---|
| Mexico | Six Flags Mexico | Mexico City | Benito Juárez Ciudad de México airport (MEX) | MEX airport: Shuttle 6 min | 9.2 million people |
| La Feria de Chapultepec | Mexico City | ||||
| Parque Xcaret | Cancun | Cancun airport (CUN) | CUN airport: Bus 35 min | 1 million people | |
| Plaza de Sésamo | Monterrey city | Monterrey airport (MTY) | MTY airport: Bus 1 h 15 min | 1.1 million people | |
| Colombia | Parque Mundo Aventura | Bogotá city | El Dorado airport (BOG) | BOG airport: Bus 7 min | 11.3 million people |
| El Salitre Magico | Bogotá city | ||||
| Parque Nacional del Café | Quindio city | El Dorado airport (BOG) | BOG airport: Bus 9 h | 560 thousand people | |
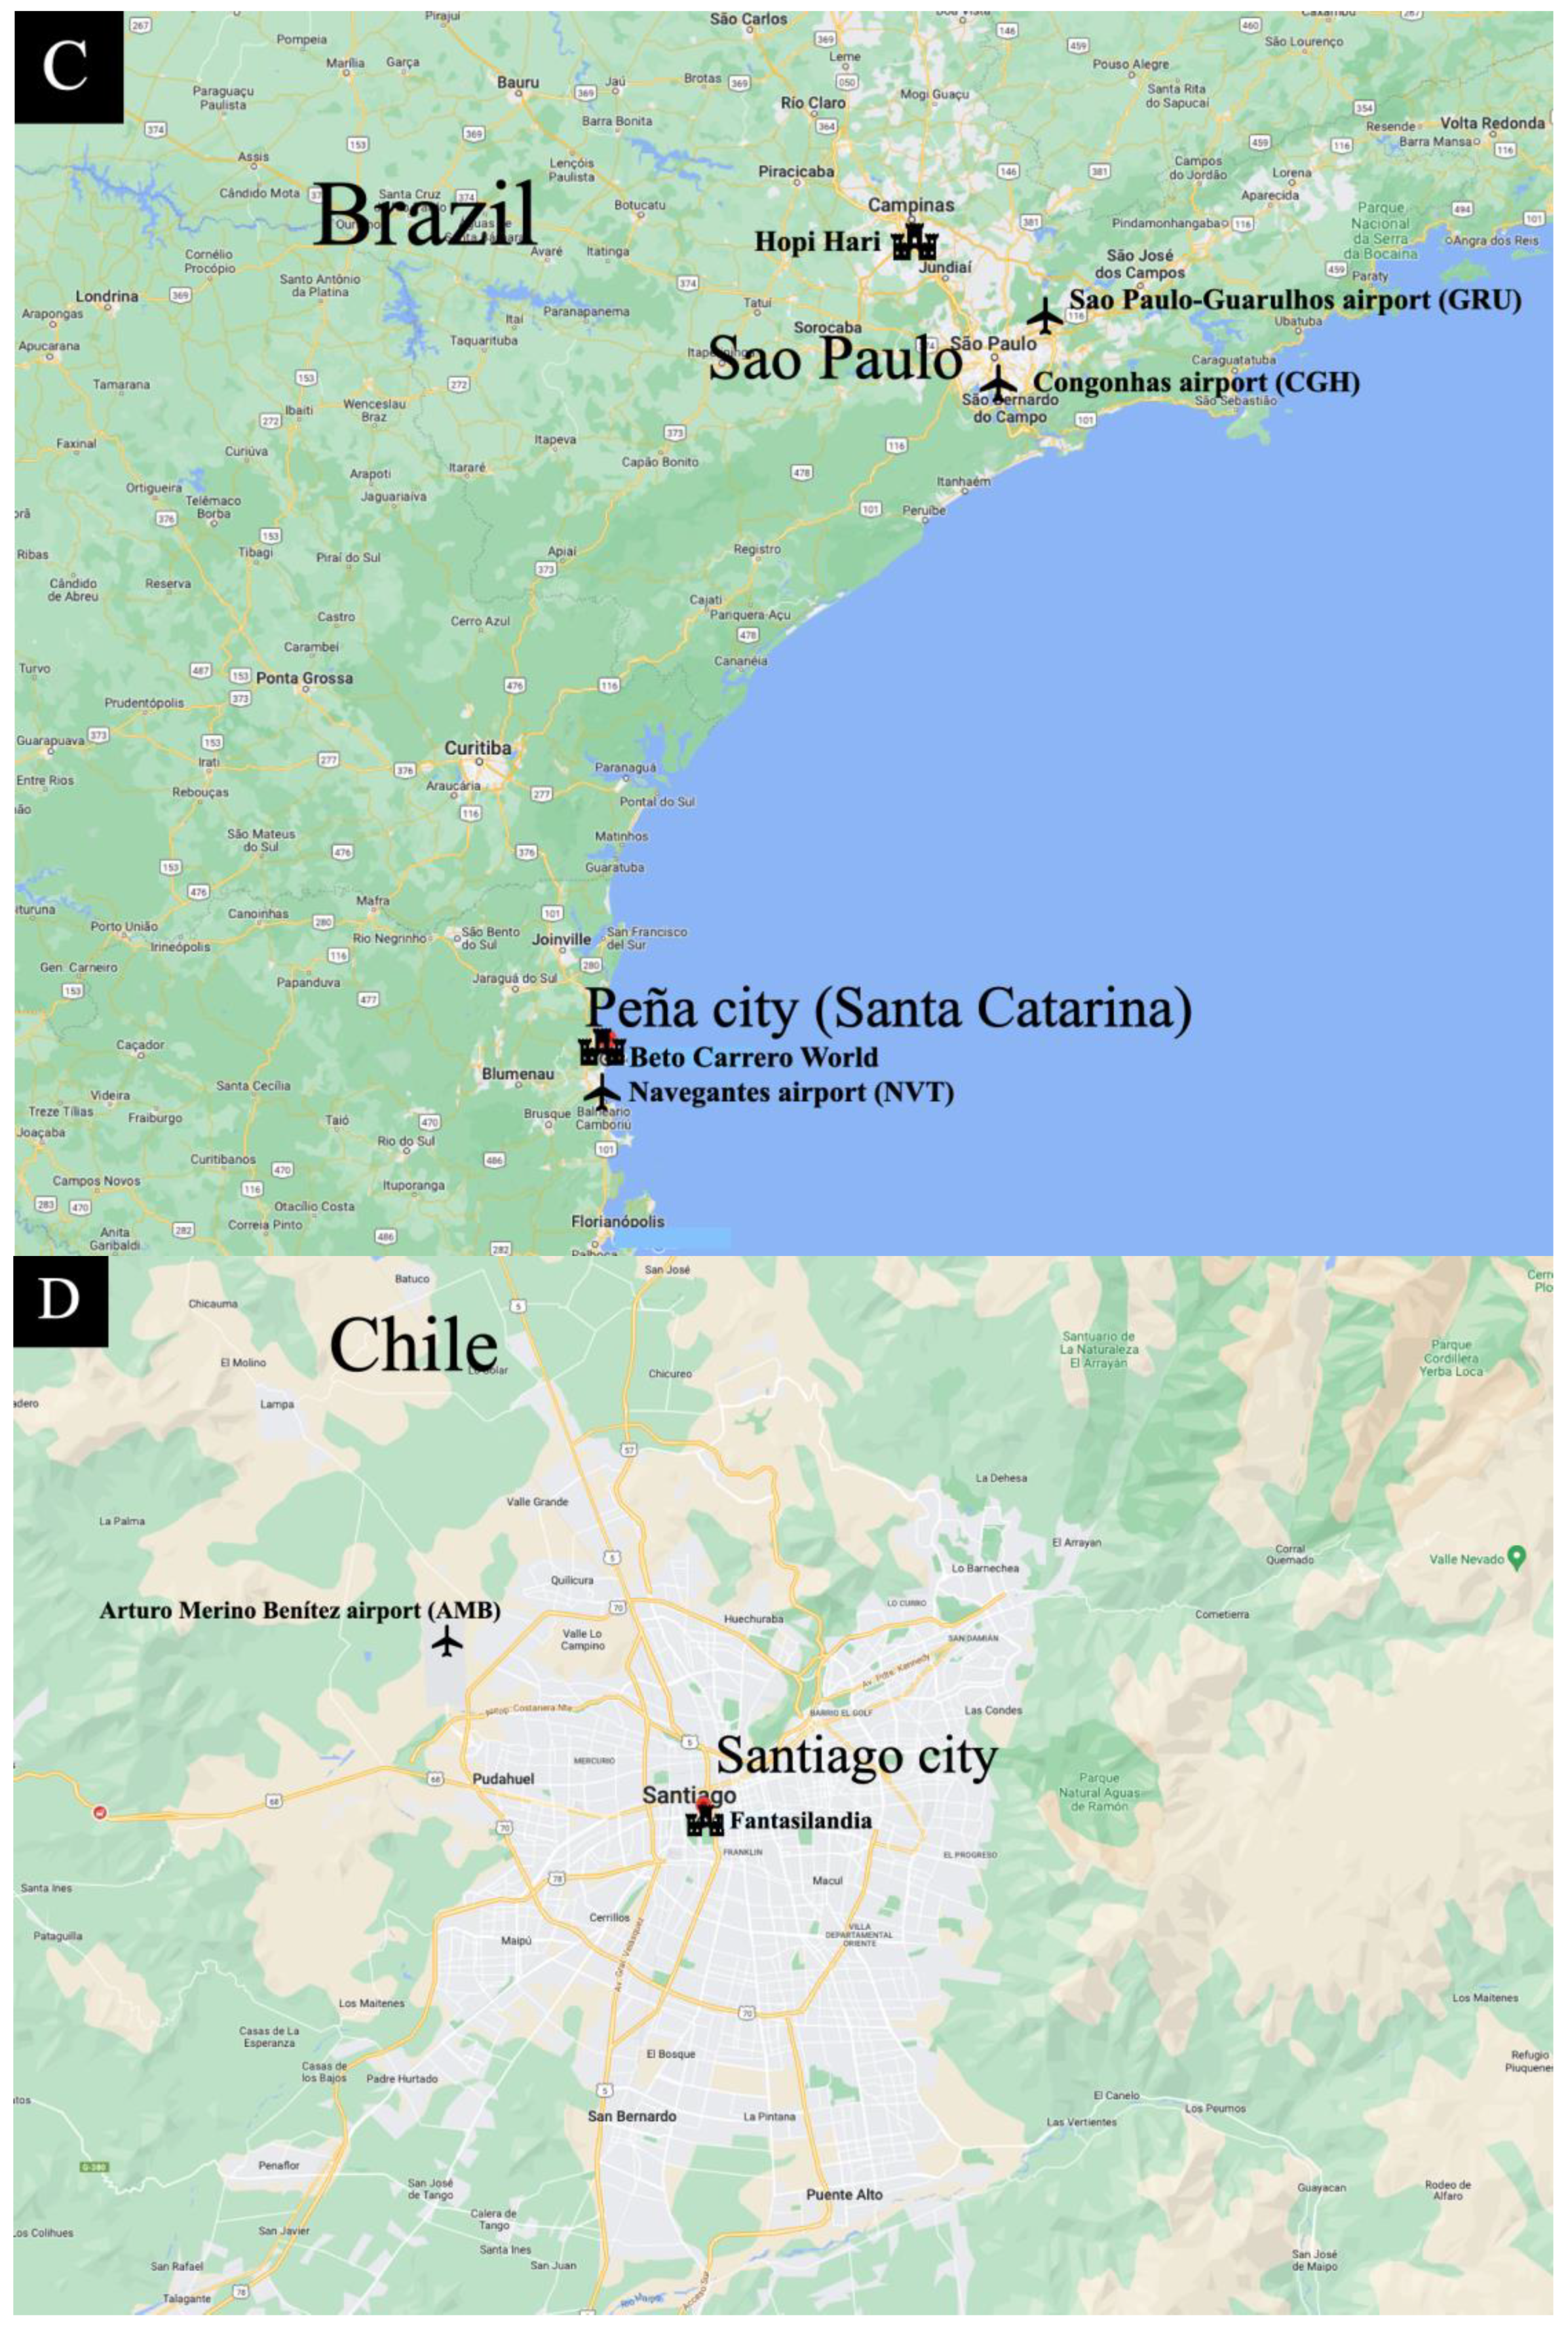
| Brazil | Beto Carrero World | Peña city (Santa Catarina) | Navegantes airport (NVT) | NVT airport: Taxi 10 min | 7.3 million people |
| Hopi Hari | Sao Paulo | Sao Paulo-Guarulhos airport (GRU) Congonhas airport (CGH) | CGH airport: Subway 41 min GRU airport: Subway 1 h 13 min | 12.3 million people | |
| Chile | Fantasilandia | Santiago city | Arturo Merino Benítez airport (AMB) | SCL airport: Bus 20 min | 6.3 million people |
| Guatemala | Mundo Petapa | Guatemala City | La Aurora airport (GUA) | GUA airport: Bus 14 min | 3 million people |
| Argentina | Parque de la Costa | Tigre city | San Fernando airport (FDO) Inter. Ministro Pistarini airport (EZE) | FDO airport: Train 27 min EZE airport: Train 2 h 38 min | 290 thousand people |
Disclaimer/Publisher’s Note: The statements, opinions and data contained in all publications are solely those of the individual author(s) and contributor(s) and not of MDPI and/or the editor(s). MDPI and/or the editor(s) disclaim responsibility for any injury to people or property resulting from any ideas, methods, instructions or products referred to in the content. |
© 2024 by the author. Licensee MDPI, Basel, Switzerland. This article is an open access article distributed under the terms and conditions of the Creative Commons Attribution (CC BY) license (https://creativecommons.org/licenses/by/4.0/).
Share and Cite
Florido-Benítez, L. Analysis of Latin American Theme Parks in a Tourism Context. Tour. Hosp. 2024, 5, 124-147. https://doi.org/10.3390/tourhosp5010009
Florido-Benítez L. Analysis of Latin American Theme Parks in a Tourism Context. Tourism and Hospitality. 2024; 5(1):124-147. https://doi.org/10.3390/tourhosp5010009
Chicago/Turabian StyleFlorido-Benítez, Lázaro. 2024. "Analysis of Latin American Theme Parks in a Tourism Context" Tourism and Hospitality 5, no. 1: 124-147. https://doi.org/10.3390/tourhosp5010009
APA StyleFlorido-Benítez, L. (2024). Analysis of Latin American Theme Parks in a Tourism Context. Tourism and Hospitality, 5(1), 124-147. https://doi.org/10.3390/tourhosp5010009