1. Introduction
The arts, entertainment, and recreation sector in the tourism industry (hereinafter referred to as AER) is vulnerable to external shocks such as the COVID-19 pandemic [
1]. On 13 March 2020, a national COVID-19 emergency was declared in the United States, due to the outbreak of the COVID-19 pandemic. In April of 2020, AER’s unemployment rates skyrocketed, increasing from 8.6% in March 2020 to 47.2% in April 2020 [
2]. Low-preparation jobs in the leisure and hospitality industry were the hardest hit and the slowest to recover [
3]. As the economy in many parts of the world has reopened and adapted, how have consumers’ beliefs and preferences changed after experiencing this global pandemic? What are the theoretical and practical implications for understanding consumers’ intentions to purchase in the context of a pandemic?
There has been a growing interest in understanding what exogenous factors affect consumers’ spending behavior in fast-evolving pandemic situations. For example, research has shown the perceived crowding of leisure activity spaces was found to have a direct influence on consumers’ participation in leisure activities [
4], indicating that a growing number of people have been prioritizing leisure activities that can ensure a safe social distance (e.g., private leisure events). Safety violations in restaurants have been positively associated with COVID-19 cases [
5]. Williams [
6] indicated that cleaning, sanitizing, limited capacity, social distancing, and mask requirements, were key factors influencing consumers’ intentions to visit thematic parks. However, questions have been raised regarding whether the regained physical access to the AER services would affect consumers’ desires for digital experiences that gained popularity during the crisis [
7,
8,
9]. How would the empirical studies shed light on consumers’ planned behaviors in patronizing AER services?
The contribution of this paper is twofold. First, it identifies the emergent factors which expand existing theoretical models to explain and predict consumers’ intentions and behaviors in the AER industry. Specifically, it advances the application of the theory of planned behavior posited by Ajzen and Driver [
10], for predicting leisure participation by propounding contextual, attitudinal, and environmental factors. Second, it highlights the operational, emotional, technological, and social aspects emerging from consumers’ experiences during the COVID-19 pandemic. Identifying consumers’ new intentions and behaviors towards AER products and services sheds light on strategies for enhancing organizational resilience and consumers’ satisfaction during and after external shocks or crises.
Theoretical Foundation
This study is built upon the theory of planned behavior (TPB), to advance our understanding of the factors that predict consumers’ intentions and actions towards AER services during/after external shocks (e.g., COVID-19). According to the TPB [
10], leisure behaviors can be explained by three general determinants: (a) attitudes towards the behavior, or behavioral beliefs and/or positive and negative affective experiences; (b) subjective norms, or normative beliefs related to the likelihood that referent individuals or groups approve/disapprove the behavior; and (c) perceived behavioral control, or perceived difficulty/easiness of performing the action in question. In short, the TPB centers on consumers’ beliefs (intrinsic conditions) that facilitate certain performances.
Nevertheless, as evidenced by the COVID-19 pandemic, extrinsic conditions and factors can also play an important role in shaping consumers’ purchasing decisions [
11]. Therefore, the analysis of consumers’ lived experiences could shed light on emerging factors influencing the intentions/decisions to access AER services. This study fills this research niche through a qualitative method. TPB is modified to encompass the factors (e.g., environmental factors) identified in this study.
2. Materials and Methods
We used data collection and analysis principles of phenomenology to collect and analyze consumers’ past behaviors and experiences in AER services. Data on 22 consumers’ spending behaviors and experiences during the first two waves of COVID-19 were collected through semi-structured, in-depth interviews. Consumers residing in the United States were recruited through a snowball sampling method [
12]. The first five interviewees were identified from the researchers’ diverse contacts, to ensure sample diversification, as seed variation can significantly enhance sample diversity [
13]. Twenty participants were included in the interviews. Considering that the present study used a non-probabilistic sample, we included 22 participants, in order to surpass the minimum recommended sample size of 12 to reach data saturation [
14], defined as the point when the researcher cannot find any additional information to develop new themes [
14]. Each interview had an average length of 23 min. The interviewees were shown an informed consent specifying the research objectives and interview modalities. All participants were also informed of data confidentiality and voluntary participation. Because COVID-19 infections were still considerably high at the time of the data collection, all interviews were conducted remotely and audio-recorded.
The 22 participants were asked broad general questions about their experiences of consuming AER services during the COVID-19 pandemic, and the contexts and situations that influenced or affected their experiences. Exemplary questions included: (a) How do you feel your spending behavior on art, entertainment, or recreation, is different now compared to the year before the COVID-19 pandemic?; (b) What kind of art, entertainment, or recreation services did you use during the pandemic and why?; and (c) What factors/aspects did you value the most when experiencing arts, entertainment, or recreation products/services? A researcher conducted the interviews, made descriptive field notes [
15], and audio-recorded the interactions. All the data were transcribed and organized by question/case in a dataset, to facilitate the analyses.
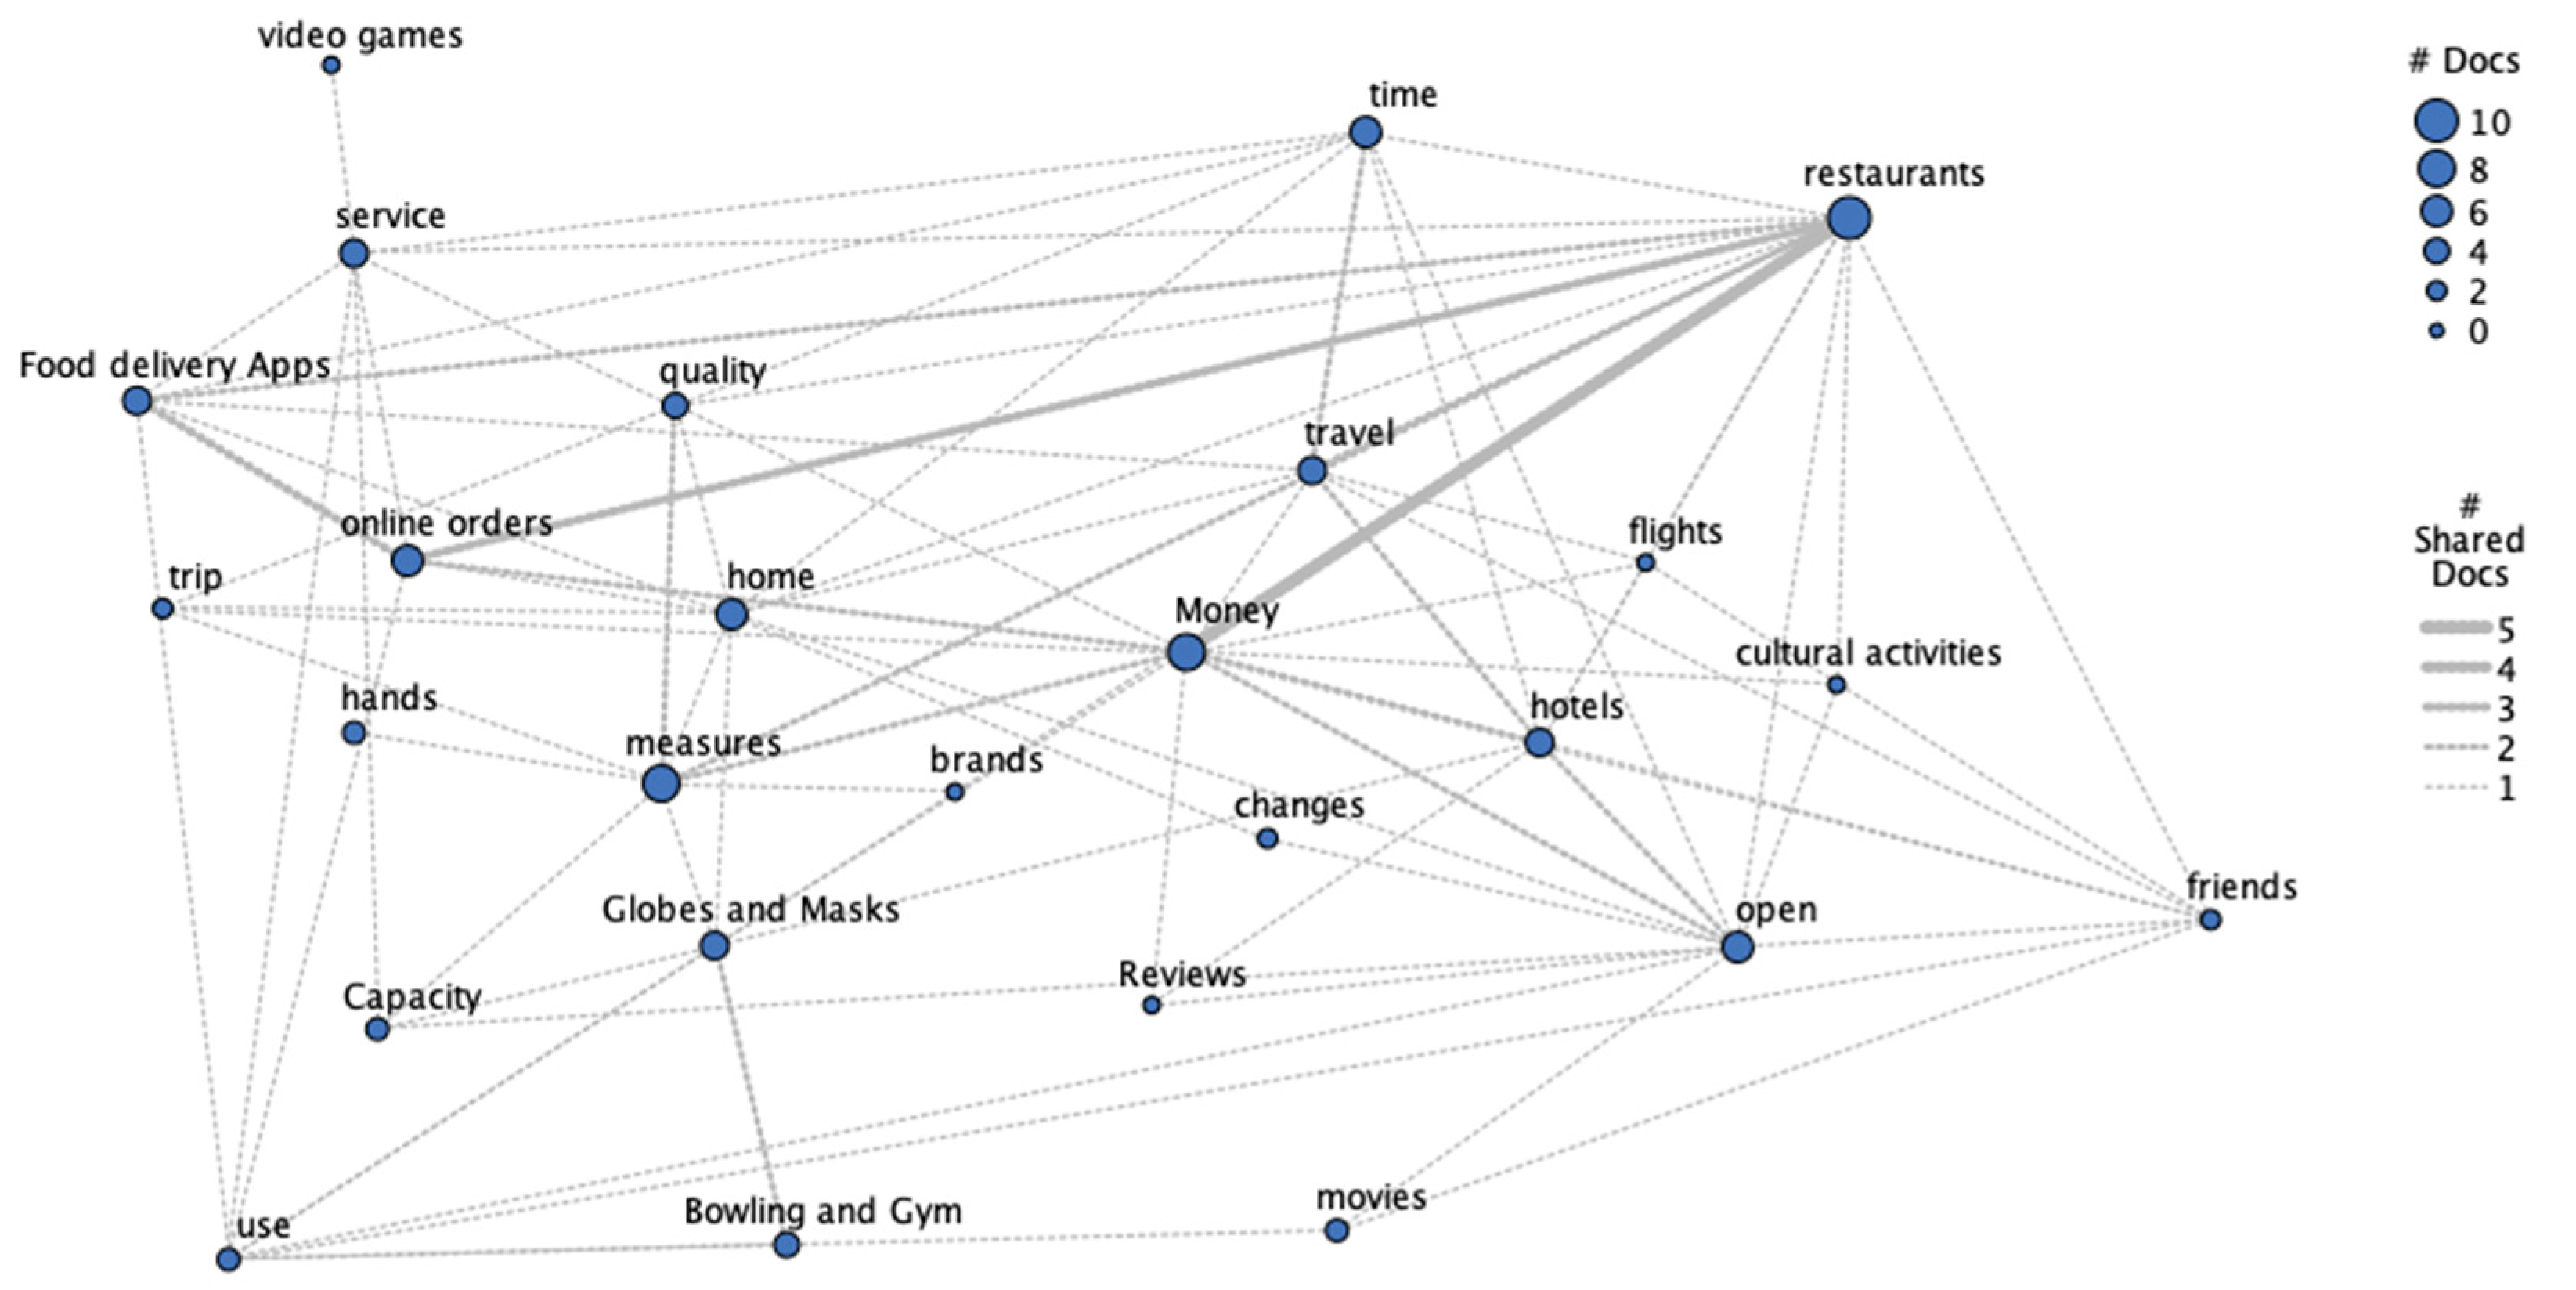
We implemented a mixed-method approach to identify the emerging contextual factors affecting AER behaviors during pandemics. We applied computer-based methods and human-based based methods, to derive a richer view of the factors affecting consumer behavior. First, the computer-based analysis consisted of generating (a) a cluster map and (b) a relationship map. Both maps were created using the SPSS modeler tool and were based on the open-ended data concentrated in the dataset. The cluster map was generated using algorithms that examine how often concepts occur and how frequently the concepts appear together. Similarly, the relationship map used algorithms to provide a visual representation of the connections and potential influences that each variable (i.e., node) might have over other variables. The relationship maps also provided insight into the strength of the link between variables, where lines that are thicker for stronger connections.
The human-based data analysis consisted of applying a thematic analysis to identify the implicit and explicit factors that affected consumers’ habits. We conducted phases of thematic analysis suggested by Clark et al. [
16]. First, we read the data to identify the general patterns that occur. Then, we generated initial codes, by collapsing data into labels (codes) based on the participants’ utterances and meanings. Last, the codes were combined into overarching themes that accurately depict the data. The themes were then posited as potential factors influencing AER behavioral intentions, and the codes subsumed to each team were considered sub-factors. Together, the clustering map, relationship map, and thematic analysis, were used to posit a revised TPB model.
Table 1 summarizes the interviewees’ backgrounds. The data on gender and marital status were more evenly distributed. The states of residence covered different US regions. In addition, 90% of the interviewees were partially or fully vaccinated against COVID-19.
3. Results
The initial computer-based analysis of the 22 participants showed key themes and relationships between variables related to the consumption of AER services during the COVID-19 pandemic. The cluster map (
Figure 1) revealed three clusters (e.g., themes): (a) in the upper-left side, spending preferences that include restaurants, food, and traveling, associated with a combination of dine-ins and online ordering; (b) in the upper-right, potential inhibitors of AER consumption (e.g., family not able to come); and (c) in the bottom, the interest in safety measures, including cleanliness, use of hand sanitizer, and staff’s hand-washing. Complementarily, the relationships map (
Figure 2) shows a notable importance and relationship between money and restaurants, restaurants and online orders, and between food delivery apps and online orders.
Figure 2 also shows that “measures” appeared in a relatively high number of cases, suggesting its potential influence on consumer intentions during the COVID-19 pandemic. Although both maps present some insight into the potential relationships and co-occurrence of variables affecting AER consumption, a more fine-grained analysis is needed. Manual coding and thematic analyses were completed to further examine the contextual factors, and are reported in the following section.
The thematic analysis suggests that participants accessed indoor venues, including movie theaters, bars, sports bars, clubs, museums, polls, ping-pong rooms, darts rooms, breweries, distilleries, casinos, aquariums, and indoor concert venues, during the COVID-19 pandemic. The outdoor venues included theme parks, boat tours, zoos, Ferris wheel cabins, excursions (e.g., stargazing or cave explorations), kayaking, scuba diving, golf, drive-in movie theaters, and skiing. Five major themes that effected their spending behaviors were derived from the interviews: safety measures, touchless solutions, social environment, enjoyment, and digital services.
3.1. Safety Measures
Most participants indicated the importance of safety measures. However, only 8 out of 22 expressed their willingness to pay more for hospitality or tourism services that adopt increased safety measures. Additionally, most of the consumers mentioned they did not check whether there were safety measures in place, as they took it for granted. However, some strong restrictions in some venues, such as mandatory mask mandates, might prevent people from using specific AER services (e.g., gyms). Moreover, consumers’ behaviors related to safety measures tends to change, depending on the type of AER venue. For example, one participant who admitted not going to movie theaters for safety reasons, was fine with visiting bars and clubs:
“I don’t feel comfortable bowling or going to movie theaters but ever since I got vaccinated, I’ve been going to bars and clubs. Oh, I don’t, I don’t wear my mask there, so it doesn’t make sense I know”.
(Respondent 21)
One of the most controversial safety measures regarding AER venues was the mask mandate. Respondents showed different consumption behaviors affected by mask-wearing mandates. Nine interviewees said that they would rather not wear a mask in venues, whether outdoor or indoor. Four participants indicated that they would wear it only indoors. One respondent clarified that, although he is comfortable now experiencing hospitality services without a mask, he still wears one “out of respect”. Some participants thought that masks should still be a requirement in indoor places, given the uncertainty of the pandemic.
In addition, some respondents explained that they prefer going to venues that accept only a limited number of attendees, and that have safety distance measures in place. Several participants are still avoiding places where safety distance is not guaranteed, such as sporting events. Others prefer going to events or entertainment venues that are organized outdoors, as they can better keep a safe distance. Similarly, some reported that they have not visited theme parks, due to crowding concerns.
Respondents who visited indoor AER activities during the pandemic expressed that they felt safe in these environments because they were able to keep a safe distance. For example, one consumer explained that he had been to a convention inside a hotel conference room, specifying that he did not fear the virus because the area was big, although it was indoors. Another respondent said that she went to an industry event and that she felt comfortable because there were a limited number of attendees, and the booths were spaced 10 feet apart. Similarly, another person explained that she feels comfortable in movie theaters only because her state’s law requires a five-seat gap between different groups of people. The willingness to keep a safe distance from strangers has increased the popularity of private activities, as this respondent reported:
“We booked one of the cabins on the Ferris wheel. We had only our family on it and nobody else […] We have tried to avoid indoor places with other people”.
(Respondent 8)
3.2. Touchless Solutions
Touchless solutions were another topic addressed by the participants. Several respondents mentioned that various touchless solutions are good practices that can increase the level of trustworthiness of hospitality and tourism locations during pandemics. The first types of no-touch functionalities identified in the interviews, were those related to the hospitality facilities’ appliances, equipment, and/or furniture, as explained by one participant:
“I kind of like when some places have bathrooms where you can open the door with your foot on the ground instead of holding handles. And those are cool. Like no-touch, like beverage things where you can just put your cup under instead of touching something. A lot of those kind of no-touch functionalities, I think it’s good”.
(Respondent 6)
Another topic was related to digital solutions that reduce human contact during different touchpoints of the consumer journey. In the restaurants’ ordering/reservation stage, we found a trend of consumers utilizing online ordering through the service provider’s website, remote ordering/picking-up through the restauranteurs’ mobile app, or mobile apps for booking/reserving seats in advance, as stated by two participants:
“If restaurants have online ordering on their native website or apps will use those, like for example blaze pizza they have an online ordering system where you can customize everything and then you go and pick up your order. I sometimes do that kind of online service”.
(Respondent 4)
“I use the Fandango movie app to order movie tickets to go to the point Plaza right here next to rose because I live right here by Rosen [College], and on the app you can see what seats you select and then it automatically blocks off the two on this side and the two on this side”.
(Respondent 11)
For the dining phase, some interviewees reported that sensing technologies which can help consumers not to be in touch with “doors and things”, are a valuable asset for AER venues. The rationale for preferring touchless solutions over conventional face-to-face interactions was associated with increased safety, convenience, and better use of resources (e.g., printing, paper), for the consumer. Participants mentioned their preferences and intentions to use several touchless solutions after the COVID-19 pandemic, including but not limited to: QR codes for consumers to visualize digital menus on their cellphones, mobile payments enabled through QR codes, and virtual queue apps that facilitate social distancing and allow consumers to save time. Two representative opinions are shown below:
“…the little QR code for menus or you can just tap your phone and do it you know, and look at the menu, rather than giving you a physical menu since the virus can live on anything”.
(Respondent 6)
“I would say there’s one thing that is very cool. It’s the virtual queue. You can use the app and they tell you how many minutes later you can come back. So this is not just for social distance, but also to save time because people can come back later”.
(Respondent 10)
3.3. Social Environnment
Families’ and travel companions’ attitudes/decisions related to the COVID-19 pandemic might have affected consumers’ spending behaviors on AER services. Several respondents reported consulting with their spouse before deciding to resume their AER experiences, and informing their decisions based on what hotels, restaurants, or attractions, appeared to be the safest, as reported by two participants:
“my wife and I were talking about this the other day like yeah when we start traveling again, we’re going to have to call ahead to the hotel and just find out what measures they’re taking to keep everything is sanitary as possible…”
(Respondent 8)
“my husband refuses to go on a cruise because he is worried that someone will be on the boat with COVID and everybody will have to quarantine in your rooms”.
(Respondent 9)
Another participant noted that she was not able to attend an event because some of her friends were not vaccinated.
“We ended up not going because a couple of the people in my group hadn’t been vaccinated. So they would have had to test and if they were positive, then the whole thing would fall apart. So we decided not to go”.
(Respondent 9)
Similarly, another respondent reported that her spending on AER started increasing only once her husband got vaccinated. However, she added that he got his vaccine two months after herself; thus, the resumption of certain activities was delayed for both. The same person explained that she has traveled by car rather than by airplane, because her mother-in-law and husband did not want to travel via airplane due to the fear of infection, and that she has not been on a cruise because her husband fears catching the virus.
“We will be staying in Airbnb and will be driving they’re not flying, because my husband doesn’t want to get on an airplane stil“.
(Respondent 11)
Respondents also reported that their AER behaviors were influenced by their awareness of the presence of older people (who may be more vulnerable), in certain AER locations. By contrast, others decided to travel during the pandemic for two reasons, (a) because the absence of children and fewer visitors made the service quicker and more peaceful, or (b) to enable their children to feel they were not confined to a closed space during the pandemic. Such contrasting stances are exemplified below:
“There are older people that go there and I don’t know who has not or has it so I just feel better”.
(Respondent 4)
“So the reason why we did it in July was so that they felt like they had a summer, that was just not confined to the house. So, really, our spending and how we do it is all based on the children”.
(Respondent 13)
“You could just like pretty much go wherever you want it, like it wasn’t like so much boys there was pretty peaceful. In hotels if there are less people they can attend to you, if you need something. Same thing for restaurants when you’re a tourist you like to get your service like right away. So it’s kind of better to sort of be like one of the only people there”.
(Respondent 13)
3.4. Enjoyment
The majority of interviewees indicated that they wanted to enjoy life more, to make up for the time spent at home during the peak of the pandemic. The willingness to enjoy life might increase the expenditure on AER services. Retaining the entertainment component in AER services is critical. Two respondents reported their willingness to spend more money on tourism and hospitality services once COVID-19 subsides, including on theme parks, excursions, museums, movie theaters, and bowling alleys. They highlighted that their expenditure in all of these venues has increased, since they wanted to continue enjoying life, although some acknowledged that there are still some risks in going out:
“Now I spend more because I realized that we have to, like, enjoy life more”.
(Respondent 2)
“I may be risking it by going out, but like at the same time I also really want to just enjoy my life, you know, not be in fear of everything”.
(Respondent 17)
Some respondents evidenced that their need for enjoyment in hospitality services increased after being vaccinated. Tolerance for the uncertainty during the peaks of the COVID-19 pandemic, could have led some consumers to be intentionally more open to engaging in new experiences:
“Yeah, definitely, because now that I’m vaccinated, it’s like, it feels more like, okay, cool, like I’m vaccinated. Now it’s time to get back out and do stuff. I think I would be more open to new experiences now, because we are back to normal”.
(Respondent 1)
Others communicated feelings of desperation to continue enjoying cruises and international travel, or a need to visit their favorite restaurants. In such cases, it is apparent that attachment to certain hospitality or travel consumption habits was potentially associated with a stronger need to resume enjoyment, as evidenced by the following quotes:
“Okay we haven’t been doing it for such a long time so we want to enjoy it. And let’s try everything, not everything but I mean like let’s have a fun time”.
(Respondent 1)
“Yeah I miss going out and I think we’re starting to do it now. But if this was three months ago, I miss going out, I miss going to my restaurants”.
(Respondent 14)
“Yes, yes. I desperately miss cruises. I desperately miss traveling internationally. I miss going to Europe, I miss that. Very much so”.
(Respondent 11)
3.5. Digital Services
Our findings reveal that the participants have used or showed an interest in subscribing to streaming platforms (e.g., Netflix, Disney+) during the pandemic. Several respondents suggested that going to movie theaters makes them feel unsafe, and that they were not planning to go back to a movie theater anytime soon. Most respondents noted their plans to keep all of their subscriptions to streaming platforms, or at least most of them, after the pandemic. The respondents who planned to visit movie theaters in the future, indicated that they would still keep most streaming services. Others clarified that they would not go back to the movie theater because it is more convenient to watch movies on streaming platforms at home, as reflected in the following statements:
“We used to go [to the movie theater], but now it doesn’t make sense because you can buy them [the movies] for $15, and maybe you go to the movie theater and it’s going to be $20/25, so it’s better to be home watching the movie in the comfort of your house. We have a big TV and we have a good sound too. What’s the point?”
(Respondent 2)
“If it’s available with no extra cost on the streaming platform, I will probably use the streaming platform just to save money”.
(Respondent 3)
Two types of apps in AER services were mentioned during the interviews: the Fandango movie app, and virtual queueing apps. One respondent specified that she feels safe going to movie theaters, as she books her seats through the Fandango movie app, which allows users to select the seats, and then it automatically blocks off the two seats on either side.
“On the app you can see what seats you select and then it automatically blocks off the two on the left side and the two on the right side and the seats are reclining seats”.
(Respondent 11)
Other digital services that the participants have purchased during the pandemic include TV packages (e.g., the football package), TV Apps (e.g., the paramount App), video games, YouTube, audiobooks from Amazon, and smart TVs with incorporated apps. However, none of the respondents reported experiencing virtual museums, virtual guided tours, or online concerts. One responded specified that these services are ineffective and do not replace the energy of real-life experiences:
“I don’t think any alternative like concerts and museums can truly replicate the experience. I don’t think those online virtual museums or virtual events would really help so I’m not spending any money on those”.
(Respondent 3)
4. Theoretical Contributions
We leveraged the insight from our interview study to expand the theory of planned behavior (TPB).
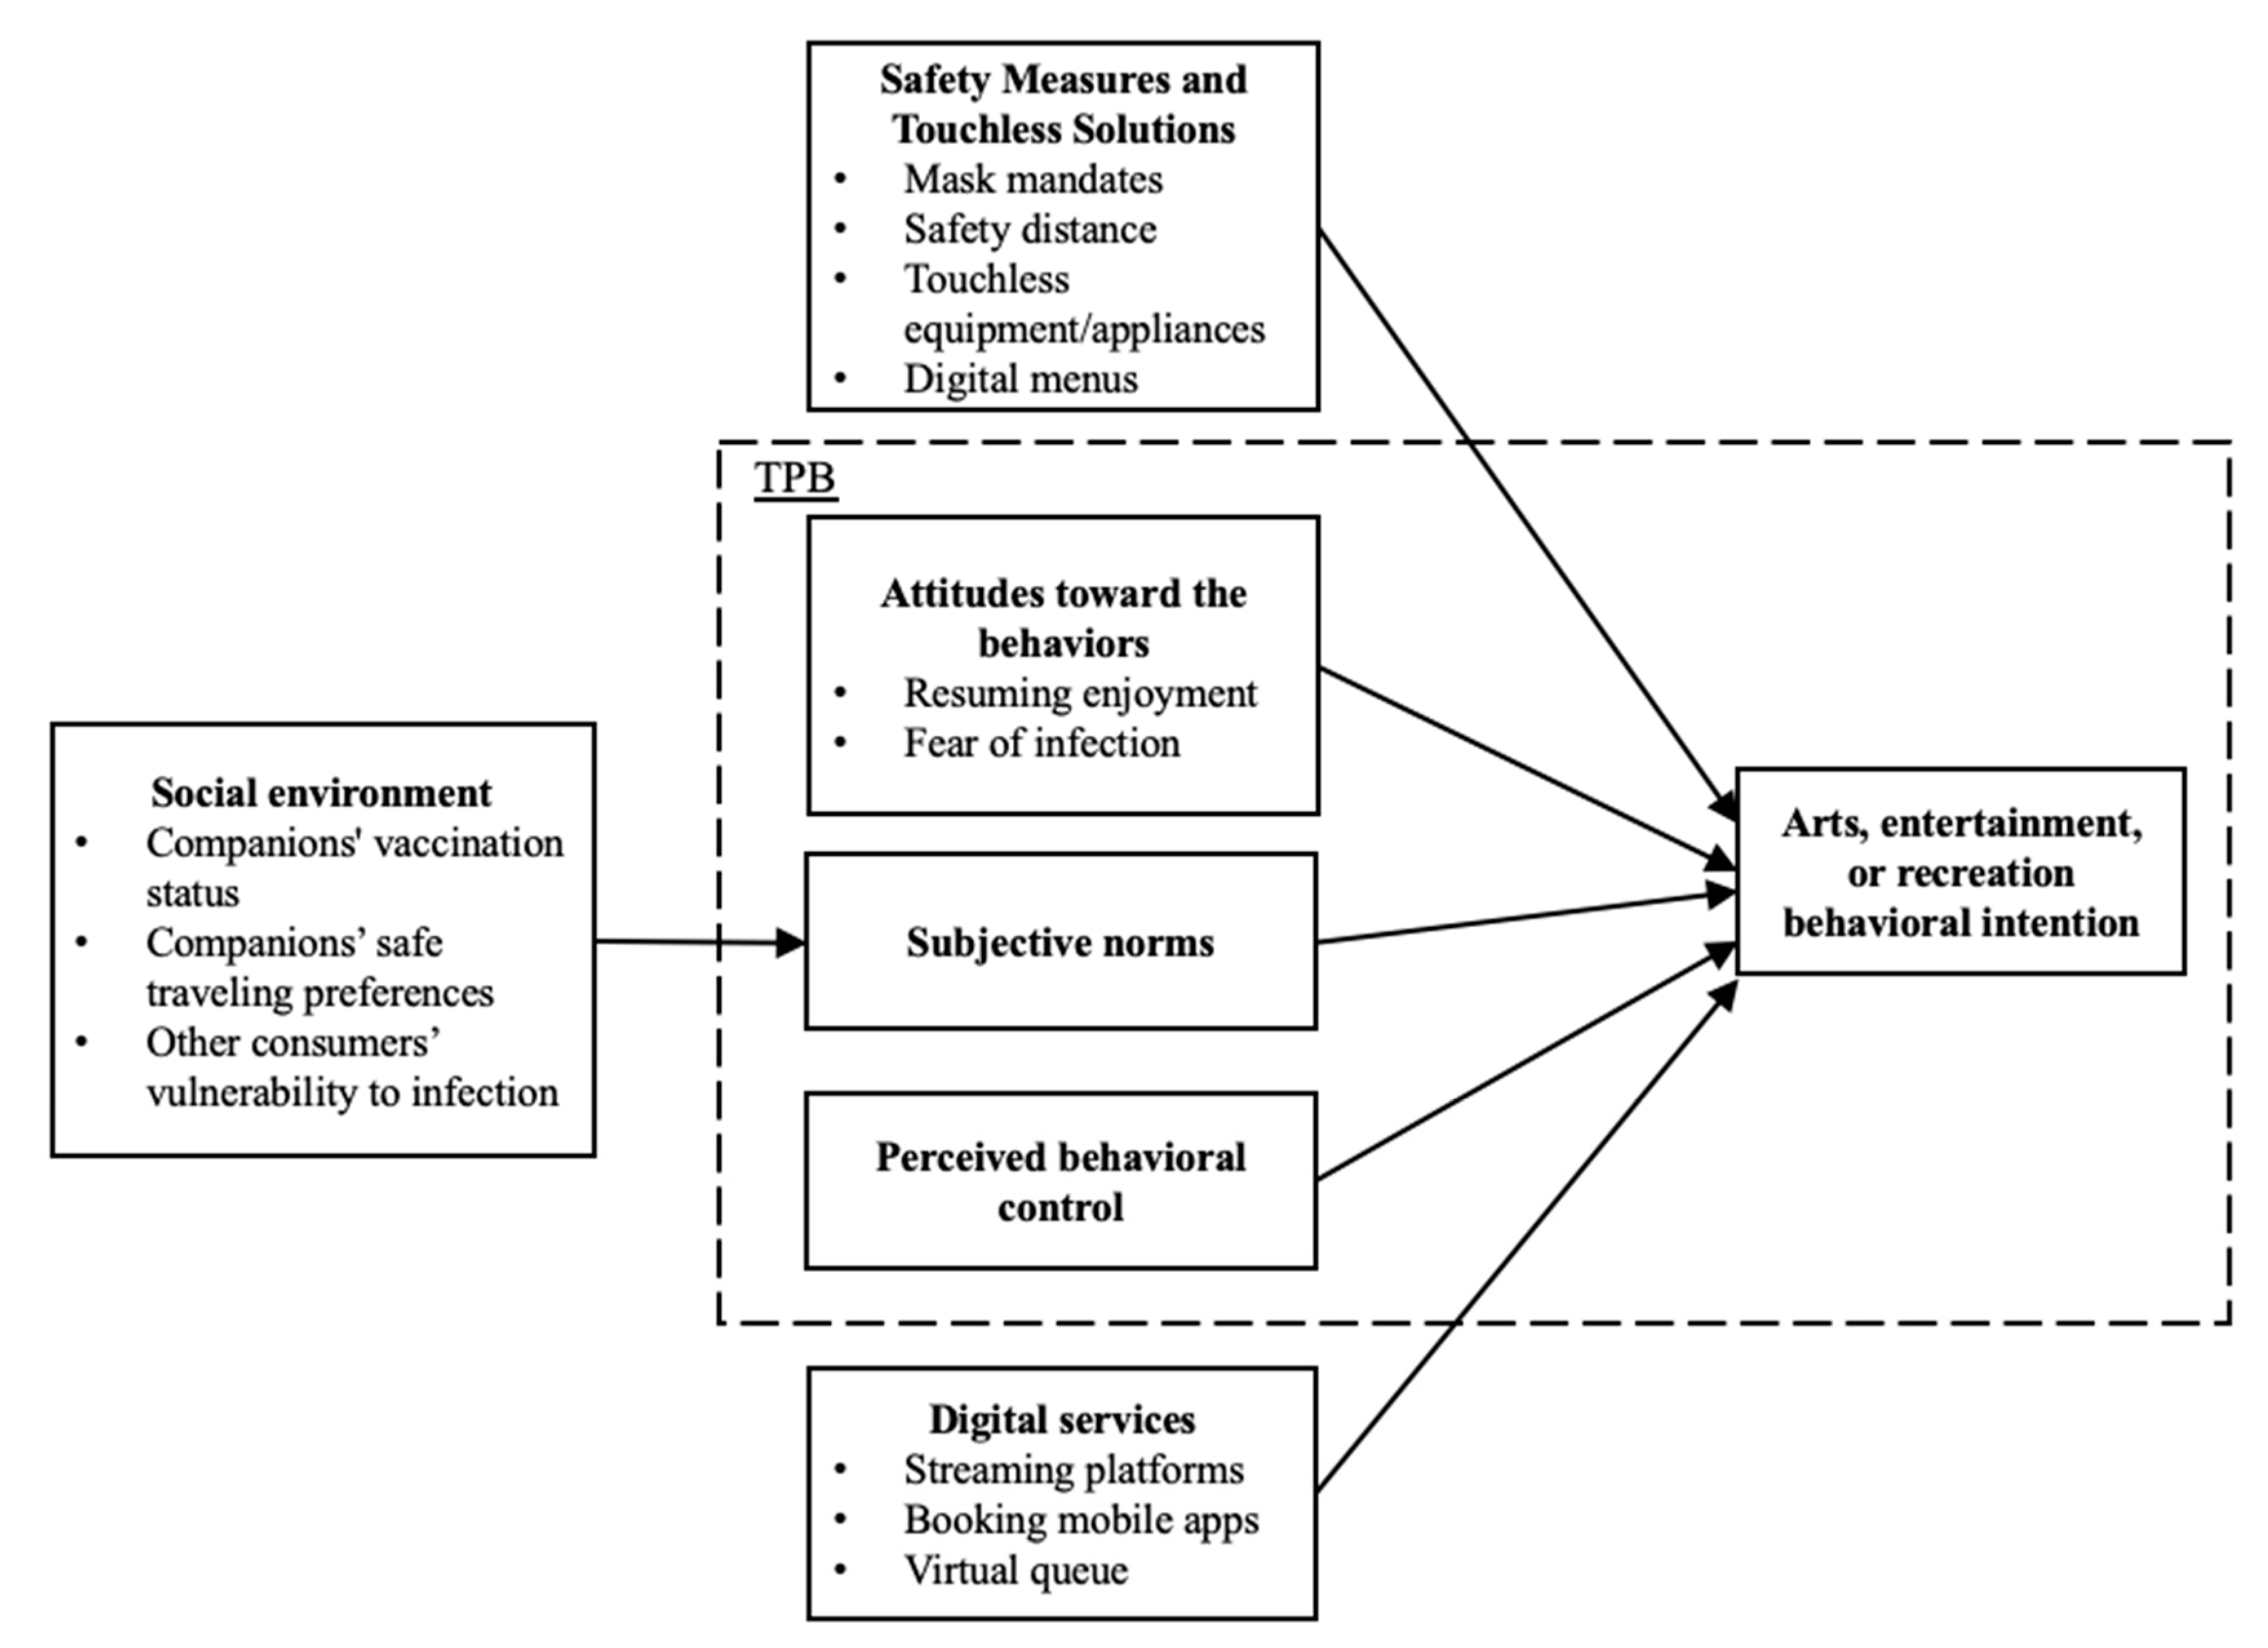
Figure 1 categorizes the factors considered during the COVID-19 pandemic that may affect consumption patterns. External factors such as the social environment (e.g., others’ vaccination statuses, and companions’ preferences for safe travel) might influence consumers’ social pressures (i.e., subjective norms). For instance, consumers’ relatives, friends, or acquaintances’ vaccination statuses, beliefs, safety preferences, or vulnerabilities to sickness, might limit or increase the engagement with AER behaviors. As evidenced in our findings, the impact of social environmental factors on subjective norms may vary based on the individual’s marital status, or on whether they have dependents.
Another factor distilled from our findings, is the availability of comparable/alternative digital services. The existence of digitally enriched applications to engage with AER experiences (e.g., streaming TV apps) during pandemics, could affect consumers’ desire to consume in-person events and venues. For example, users consistently reported their unwillingness to resume their visits to movie theaters, for fear of infection and also due to convenience. Similarly, AER businesses that provide/allow the use of mobile apps that enhance the booking, ordering, and queue processes, might also influence consumers’ intentions to purchase AER during health emergencies. In particular because mobile apps were perceived as functional tools for social distancing, payment convenience, order personalization, saving time, and reduction in the use of resources by the service providers.
The theoretical model presents elements of the physical environment that could facilitate the intention to participate in AER, including mask-wearing policies, safety distance, touchless equipment and appliances, and digital menus, to decrease the risk of infection. Leveraging touchless technologies to reduce physical contact in key stages of the consumer journey, such as ordering, payment, food delivery, and restroom usage, might be positively related to AER behavioral intentions during pandemics. Last but not least, our findings improve the TBP theoretical framework by considering consumers’ attitudes, such as resuming enjoyment and the fear of being infected, as key factors in the model. Of note, our findings revealed that COVID-19 restrictions and lockdowns might have led to consumers’ reflection and awareness of the need to enjoy life. Our findings also showed that after pandemics, consumers might be desperately willing to resume travel and entertainment, and be more receptive to new AER experiences. Further empirical research (e.g., surveys) is needed to turn the social, physical, and digital factors noted in
Figure 1, into measurable, reliable, valid instruments, that can be further tested.
5. Conclusions
This study leverages qualitative analysis to derive new knowledge about the antecedents of consumers’ behavioral changes during the COVID-19 pandemic. Five main themes and factors shaping consumers’ spending behavior in the AER sector emerged. First, safety measures can positively or negatively affect consumer spending behavior, depending on the individual’s perception of risk and the type of entertainment venue in question. Mask mandates are the most controversial measure, as consumers are divided on the topic. Second, touchless solutions have become increasingly accepted by consumers. Third, the social environment, including the vaccination statuses and fears of family members and travel companions, may have a significant influence on consumers’ expenditures. Fourth, the willingness to resume pre-COVID spending (i.e., enjoying life) also affects consumers’ expenditure behaviors. Consumers are divided between those who are trying to save money, and those who are increasing their expenses in the hospitality and tourism sector to make up for the time wasted during the peak of the pandemic. However, among those willing to enjoy life more, the majority are increasing their expenses at dine-in restaurants, while only a few indicated they spent more on AER services. Last, online services are expected to have a significant influence on consumers’ spending behaviors on AER services.
Our study has implications for AER business practices. The findings help AER managers identify and apply environmental, social, and digital interventions during pandemics and similar disruptive events. Specifically, business practices such as increased table spacing, continuous cleaning, and staff safety behaviors (e.g., mask usage), could make AER establishments, events, and venues, be perceived as more secure and safe. Tactics and touchless technologies to reduce physical contact during dining/engagement stages (such as automated faucets and doors, mobile payments, automated pick-up kiosks, chatbots, and face recognition) might increase consumers’ intentions to consume AER products and services. Such tactics and technologies could also enable brick-and-mortar providers to compete with alternative AER services more effectively (e.g., streaming platforms). AER businesses can provide digital solutions such as QR code digital menus, virtual queues, and mobile ordering/booking, which are perceived as enablers of consumers’ purchase intentions. In addition, AER firms and businesses are advised to deliver targeted marketing campaigns that meet consumers’ urgency to resume their enjoyment after pandemics, providing newer, more innovative, and more exciting, AER experiences.
The present study is not without limitations. Since (a) the severity of the COVID-19 pandemic differed in each US city, (b) the control measures applied by the governments also varied, and (c) the participants’ places of residence were distinct, the results of our qualitative analyses may have been influenced by the three above-cited conditions. Therefore, our conclusions need to be viewed with caution. Additionally, our revised model of the theory of planned behavior amid pandemics needs further empirical validation. Future studies could conduct our theoretical model verification by adapting an existing TPB measurement instrument, increasing the sample size, and using multivariate statistical analysis (e.g., SEM) to analyze the structural relationships between the variables depicted in
Figure 3.


