Article

AERQ: Leveraging IoT and HPC for Urban Air Quality Monitoring

CRS4, Center for Advanced Studies, Research and Development in Sardinia, Località Piscina Manna Edificio 1, 09050 Pula, Italy
*
Author to whom correspondence should be addressed.
Gases 2025, 5(4), 25; https://doi.org/10.3390/gases5040025
Submission received: 14 September 2025 / Revised: 2 November 2025 / Accepted: 10 November 2025 / Published: 17 November 2025

Abstract

Emerging technologies such as the Internet of Things (IoT), big data, mobile devices, high-performance computing, and advanced modeling are reshaping urban management. When integrated with conventional tools, these innovations enable smarter governance—particularly in air quality control—improving public health and quality of life. Yet, urban expansion driven by economic growth continues to worsen pollution and its health impacts. This study presents AERQ, a decision support system (DSS) designed to address urban air quality challenges through real-time sensor data and the AERMOD dispersion model. Applied to Cagliari (Italy), AERQ is used to evaluate key traffic-related pollutants (CO, PM, NO2) and simulate mitigation scenarios. Results are delivered via a user-friendly web-based platform for policymakers, technicians, and citizens. AERQ supports data-driven planning and near real-time responses, demonstrating the potential of integrated digital tools for sustainable urban governance. In the case study, it achieved 10 m spatial and 1 h temporal resolution, while reducing simulation time by 99%—delivering detailed five-year scenarios in just 15 h.

1. Introduction

1.1. Advances in Air Pollution Monitoring Technologies

Air pollution remains one of the leading environmental health risks worldwide, with nitrogen dioxide (NO2), carbon monoxide (CO), and particulate matter (PM2.5, PM10) strongly linked to respiratory, cardiovascular, and neurological diseases [1]. Populations living or working near major roads are particularly exposed, with children, older adults, and those with preexisting cardiopulmonary conditions at higher risk [2]. Accurate monitoring of these pollutants is essential for policy development, public health protection, and compliance with the forthcoming 2030 EU air quality limits (EEA, 2023) [3]. Traditional monitoring stations provide precise measurements but remain spatially sparse and costly, limiting their effectiveness in capturing local variability or on-road emissions.
To overcome these limitations, hybrid approaches combining remote sensing, low-cost sensors, and dispersion modeling are increasingly adopted. Satellite instruments such as TROPOMI on Sentinel-5P provide near-daily NO2 column data at high spatial resolution, supporting exposure assessments [4,5]. De Santis et al. (2023) [6] showed that the relationship between Sentinel-5P tropospheric NO2 and ground-level concentrations varies with season and location, highlighting the need for integrated modeling and validation frameworks [5]. Low-cost sensor networks (e.g., AirQino, PurpleAir) extend spatial coverage but show variable accuracy, particularly for PM10 [7]. Dispersion models, including the AERMOD system [8,9], complement monitoring by simulating pollutant dispersion and population exposure across urban areas.
In Italy, one of Europe’s most extensive monitoring networks is coordinated by the National System for Environmental Protection (SNPA) through ISPRA and regional ARPA/APPA agencies, operating about 650 stations and producing over 25 million validated data points annually [10]. Recent efforts have introduced low-cost sensors to improve coverage in complex or under-monitored regions such as the Po Valley [7]. National reports indicate steady progress—PM10 and PM2.5 concentrations declined by 13% between 2013 and 2022—but persistent exceedances remain in cities such as Turin, Milan, Rome, and Naples [11,12]. Despite these improvements, spatial gaps persist in regions with limited monitoring density, including Sardinia, where complex meteorology and sparse stations hinder accurate assessment. These challenges motivate the development of hybrid modeling–monitoring systems capable of integrating sensor data, meteorology, traffic, and satellite observations to support air quality assessment and management across diverse territorial contexts.

1.2. Aim of the Research, Practical Relevance and Scientific Significance

The 2022 revision of the EU Air Quality Directive, entering into force in 2025 and fully implemented by 2030, will tighten annual limits to align with WHO guidelines. Reductions include PM2.5 from 25 to 10 µg/m3 (−60%), PM10 from 40 to 20 µg/m3 (−50%), NO2 from 40 to 20 µg/m3 (−50%), and CO from 10 to 5 mg/m3 (−50%) (Table 1). Hourly and daily NO2 and PM10 limits remain unchanged, though stricter enforcement is expected [13].
Meeting these limits will require profound changes in mobility, heating, and industry.
This work develops AERQ, a data-driven Decision Support System (DSS) designed to complement conventional monitoring and fill spatial and temporal gaps in urban air quality assessment. The system integrates heterogeneous data sources—including IoT sensors, traffic flow, meteorological observations, and satellite information—within a dispersion-modeling framework to simulate pollutant dynamics and evaluate alternative scenarios. By enabling evidence-based planning and clear risk communication, AERQ DSS supports the design of locally tailored mitigation strategies, particularly in areas with limited monitoring infrastructure.
Applied to Cagliari, the largest city in Sardinia (Italy), it proves effective in assessing traffic-related pollution and provides a replicable model for medium-sized coastal cities. Moreover, simultaneous analysis of PM, CO, and NO2—often co-emitted from traffic and heating—captures synergistic health effects overlooked in single-pollutant studies [14,15]. Given that PM levels in Cagliari already exceed EU-2030 targets [16], such multi-pollutant assessments underscore public health implications. Cagliari averages ~30 µg/m3 PM10 (needing ~33% reduction), PM2.5 near 10–15 µg/m3 (close to the new limit), and NO2 around 30 µg/m3 (also requiring ~33% reduction). The DSS integrates AERMOD dispersion modeling with IoT sensors, traffic data, and meteorology, producing hourly analysis at ~10 m resolution. Its user-friendly interface enables specialists to design scenarios and policymakers to access actionable insights. By leveraging HPC resources, simulation time for a five-year scenario is reduced by over 99%, enabling near-real-time decision-making. AERQ allows both expert and non-specialized users to access reports and assessments, facilitating effective management and regulatory compliance.
Scientifically, the system innovates by combining heterogeneous data sources (traffic, meteorology, satellites, GIS) into a unified, automated pipeline. Traditionally regulatory in scope, AERMOD is here adapted for dynamic urban applications. In the AERQ framework, it is executed iteratively using hourly varying meteorological and traffic emission data, allowing the generation of temporally indexed concentration maps. These maps represent varying dispersion states rather than regulatory maxima.

2. Materials and Methods

The core computational engine of the AERQ DSS is the AERMOD modeling system [17,18], an advanced atmospheric dispersion model developed to simulate the transport and fate of air pollutants across a wide range of meteorological and topographical conditions. Grounded in boundary-layer meteorology, AERMOD incorporates parameterizations of atmospheric turbulence to represent the dispersion of emissions from various source types—point, area, and volume—located either at ground level or elevated. The model integrates a suite of algorithms that describe the key atmospheric processes governing pollutant behavior, including dispersion, advection, and both dry and wet deposition, dynamically responding to evolving meteorological conditions.
AERMOD accounts for complex terrain and urban morphology and includes simplified routines for NO → NO2 partitioning when required [19]. However, as a steady-state dispersion model, AERMOD does not simulate secondary aerosol formation or complex photochemical reactions and is typically coupled with regional chemistry models (e.g., CMAQ) when detailed transformations are required. Grounded in boundary-layer meteorology, AERMOD parameterizes atmospheric turbulence to simulate dispersion, advection, and deposition processes under both convective and stable conditions. It represents point, area, and volume sources and accounts for terrain and building effects that modify plume behavior. Boundary-layer parameters such as Monin–Obukhov length, friction velocity, surface roughness, and mixing height are derived using the AERMET preprocessor [20], which structures the meteorological inputs required by AERMOD. Pollutant concentrations are estimated using a steady-state Gaussian plume approach, refined to reflect terrain features through a combination of horizontal and terrain-following dispersion paths. The model distinguishes between rural and urban settings and can factor in the aerodynamic disruption caused by built structures. In the AERQ framework, it is executed iteratively using hourly varying meteorological and traffic emission data, allowing the generation of temporally indexed concentration maps. These maps represent varying dispersion states rather than regulatory maxima.
The model supports simulation of a broad spectrum of air pollutants, including Nitrogen Dioxide (NO2), Carbon Monoxide (CO), Sulfur Dioxide (SO2), Particulate Matter (PM), and Non-Methane Hydrocarbons (NMHCs). Its applications range from regulatory compliance analyses and air quality planning to environmental impact assessments and public health risk evaluations. Widely validated and officially recommended by the U.S. EPA, AERMOD is a cornerstone tool in atmospheric sciences and particularly effective for modeling linear sources such as road traffic [21].
Within the AERQ framework, the unmodified AERMOD version 16216r is executed iteratively using hourly meteorological and traffic data. This external orchestration produces temporally indexed concentration maps that describe evolving dispersion states rather than regulatory maxima.

2.1. Model Inter-Comparison

Numerous studies have compared air dispersion models (e.g., CALINE4, ADMS, CALPUFF) to assess their predictive reliability [22,23,24].
Askariyeh et al. [22] evaluated AERMOD’s ability to simulate near-road dispersion using SF tracer data from the General Motors Sulfur Dispersion Experiment. AERMOD reproduced steep concentration gradients within ~250 m of the roadway and performed well when high-resolution receptor grids and appropriate source representations were applied. Rezaali et al. [23] compared AERMOD and ADMS for NOₓ dispersion from line (road) and point (industrial) sources against passive NO2 measurements over 2 weeks, 2 months, and 3 months. Both models underestimated concentrations, but AERMOD showed greater sensitivity to surface and meteorological inputs and a stronger underprediction tendency. Nath et al. [24] highlighted key differences between CALINE4 and AERMOD. While both are Gaussian models, CALINE4—developed specifically for roadway emissions—aligned better with observed concentrations due to its simplified structure, near-road focus, and limited data requirements. AERMOD, by contrast, offers broader applicability with refined treatment of boundary layer processes and terrain effects, but requires high-resolution meteorological and geophysical data, longer setup, and more computational effort. Thus, CALINE4 is advantageous for quick, data-limited near-road assessments, whereas AERMOD is better suited for regulatory and industrial applications.
CALPUFF, a non-steady-state Lagrangian puff model, accounts for time- and space-varying meteorology, making it well suited for long-range transport and complex terrain. In Zonguldak (Turkey), ZEYDAN et al. (2021) [25] found CALPUFF slightly outperformed AERMOD [26]. By contrast, AERMOD assumes steady meteorology over short intervals, which enhances computational efficiency and ease of use. Its strengths include reliable performance in near-field assessments (<50 km), refined turbulence treatment, and global regulatory acceptance [27]. While CALPUFF better handles variable meteorology and terrain, AERMOD remains widely used for compliance, screening, and permitting, aided by GIS integration and regular EPA updates.
Compared to more complex Eulerian models such as CMAQ [28], WRF-Chem [29], and LOTOS-EUROS [30], which simulate chemistry and long-range transport, AERMOD is limited to simpler local-scale dispersion and does not account for secondary formation. However, these advanced models demand detailed emission inventories, extensive meteorological inputs, and significant computational resources. In contrast, AERMOD offers a balance of usability, reliability, and regulatory credibility for practical applications.
Kim et al. (2023) [31] reviewed 2021–2022 Environmental Impact Assessment reports and found AERMOD used in 89% of cases. Among these, 25% showed version mismatches with its meteorological preprocessor AERMET, and ~50% exhibited discrepancies between actual and modeled operational hours (e.g., 24 h emissions but 8 h modeling). These inconsistencies led to concentration underestimations of 32–74% for area sources and 32–54% for point sources. The study underscores the need for improved transparency in emission data, strict version control, and stronger oversight to ensure reliable dispersion assessments. In our case study, we verified that the model setup, version compatibility, and operational parameters were correctly implemented within the AERQ DSS, ensuring accurate and reliable results.

2.2. The Sardinian Case

The Sardinian Island, located in the middle of the western Mediterranean, differs from mainland Italy due to its insular geography, low mountains, favorable winds (Maestrale—north-west wind; Ponente—west wind), and mild climate, which disperse pollutants and limit smog episodes [32,33]. Overall emissions are relatively low due to limited industry (mainly in Sarroch and Porto Torres), modest traffic congestions concentrated in medium-sized cities such as Cagliari, Sassari, and Olbia, and mild winter heating demand. Agriculture contributes to emissions seasonally (e.g., Arborea plain) but with limited long-term impact.
Sardinia remains under-monitored, and national models often overlook its specific wind regimes. Despite recording some of the lowest pollution levels in Italy (ARPAS 2020–2023) [34], applying national thresholds designed for dense urban areas may misrepresent local risks.
Instead, regionally adapted frameworks and improved monitoring may produce a more effective governance.

The Cagliari Metropolitan Area

The metropolitan city of Cagliari includes 17 municipalities, with the city of Cagliari as its main urban center. This latest has approximately 148,866 inhabitants within an area of 85 square kilometers. The city is characterized by a complex orography, featuring flat zones alongside several hills such as Colle San Michele, Tuvixeddu, Castello, and Monte Claro. Urban development predominantly occurs horizontally, with a few buildings exceeding ten floors.
Cagliari presents a heterogeneous landscape, where densely populated and heavily industrialized areas coexist with sparsely populated rural zones and ecologically significant humid regions, including permanent lagoons such as Santa Gilla and Molentargius. The vibrant coastal area, Poetto, is a key social and recreational hub. The industrial sector is concentrated in three zones—Elmas, Macchiareddu, and Sarroch—covering roughly 9244 hectares. The Industrial Consortium of Cagliari (CASIC), founded in 1961, coordinates these activities, which include a waste-to-energy plant (Macchiareddu) and an oil refinery (Sarroch).
Public transport is operated mainly by CTM S.p.A., which manages a fleet of 239 buses—including 13 articulated and 32 trolleybuses—serving eight municipalities with a combined population of over 331,000 across 402 km2. ARST S.p.A., Sardinia’s largest public transport company, provides extensive extra-urban connections throughout the island, playing a crucial role in regional mobility.
Cagliari is a significant destination for both residents and tourists, especially during spring and summer. Key transport hubs are the Cagliari Port and Mameli Airport. The airport, situated just outside the city, handled approximately 24,000 flights and 2.7 million passengers in 2021, demonstrating sustained traffic compared to the 2004 figures (SOGAER [35]). The Port of Cagliari, one of the Mediterranean’s largest seaports, handles approximately 50 million tons of cargo annually. While cargo vessel calls decreased from 1009 in 2014 to 385 in 2021, vehicle arrivals increased from 128,016 to 163,499 in the same period (Port Authority, Cagliari) [36]. Table 2 shows main statistics.

2.3. Application of AERMOD to Cagliari

Cagliari’s road network consists of 1645 main and secondary roads. According to 2017 data from the Italian Ministry of Infrastructure and Transport (MIT) [37], 131,742 vehicles are registered in Cagliari, with 90,881 actively circulating and insured. Figure 1 highlights the main roads (shown in blue), which represent the primary sources of traffic-related emissions. In the analysis, these roads are modeled as linear emission sources. The fleet is notably aged: about 50% of cars exceed 15 years and fall below Euro 4 emissions standards, highlighting an environmental concern for urban air quality.
To estimate harmful emissions’ spatial and temporal distribution, emissions from individual vehicles must be linked with detailed traffic flow data. Real-time traffic monitoring relies on 167 sensors across 98 stations, which classify vehicles into motorcycles, short vehicles, and long vehicles These monitoring stations are indicated as gray points in Figure 1. Data is accessible via the Municipality of Cagliari’s open data portal [38]. However, sensor reliability varies over time, and the accompanying metadata provide information on maintenance periods and detected anomalies.
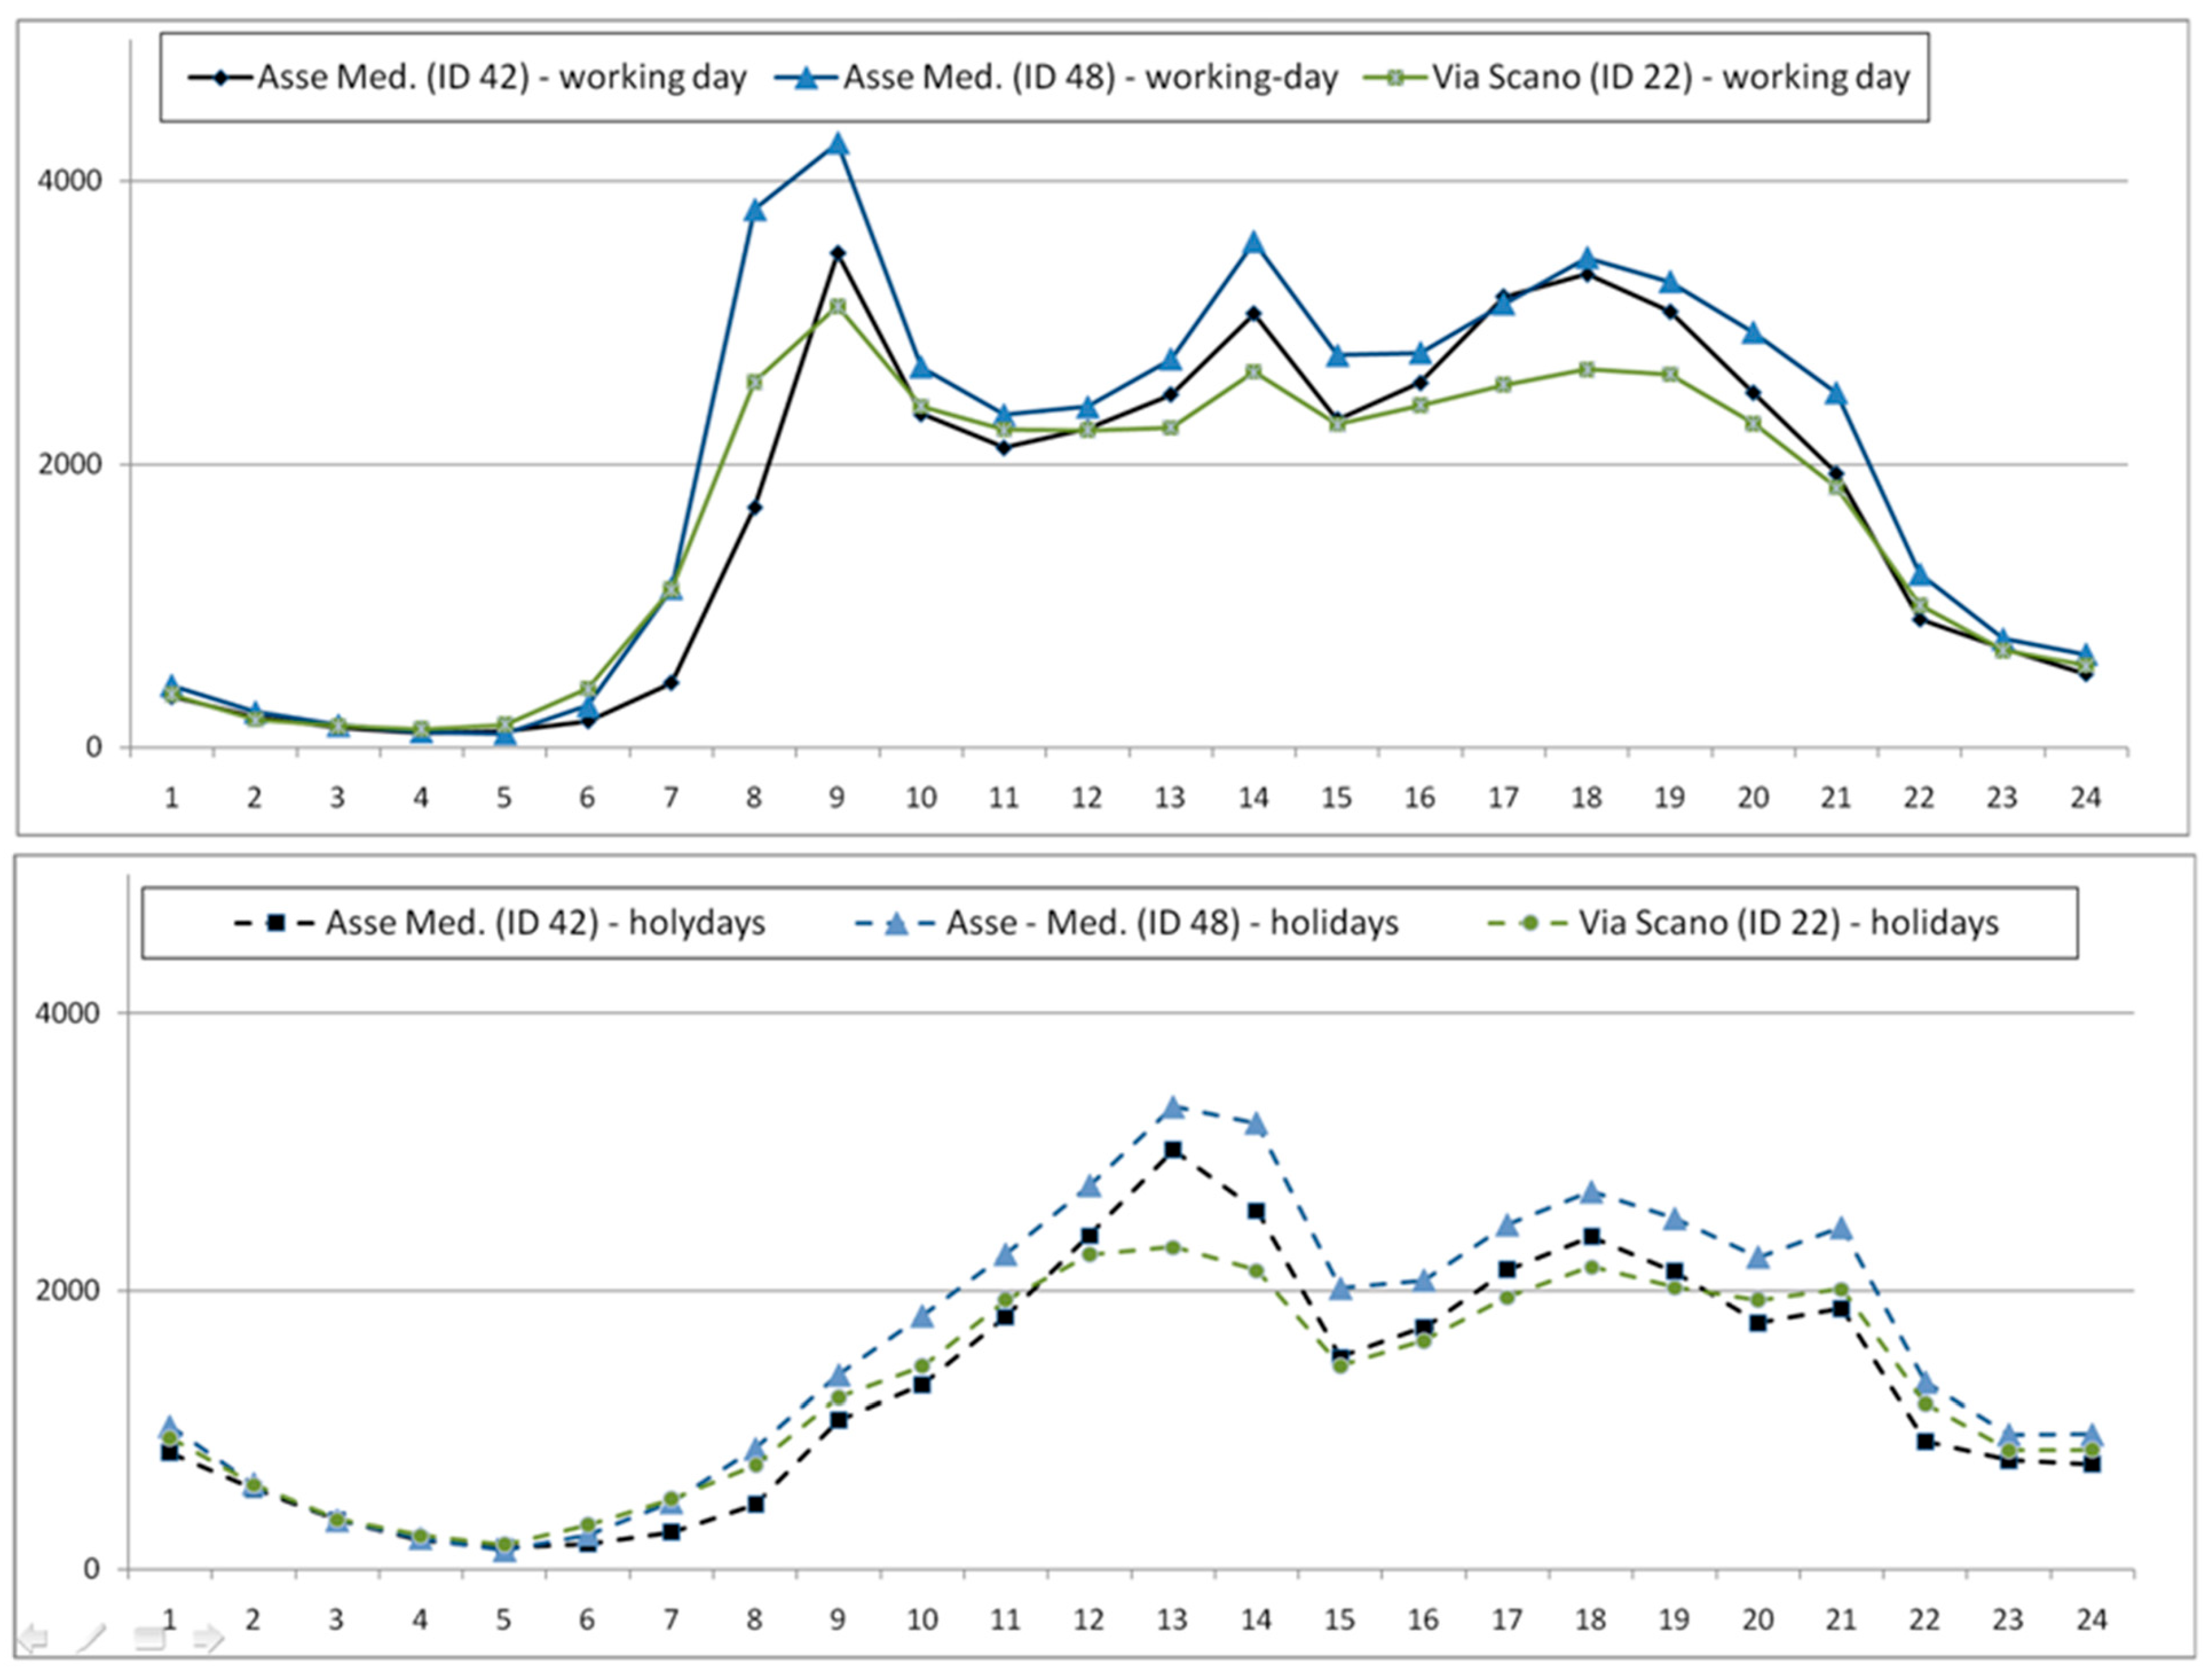
The analysis classified vehicles into seven Euro emission classes (Euro 0 to Euro 6). Passenger cars account for 76% of the circulating fleet, while the remaining 24% consists of motorcycles, trucks, long vehicles, and cargo transports. The fleet’s weighted average CO2 emission is estimated at 130.3 g/km. Traffic volumes depict distinct patterns on working days versus holidays and across seasons. Winter and fall show three daily traffic peaks aligned with typical work schedules (9 a.m., 2 p.m., 6 p.m.), while holidays have two midday and early evening peaks. Overall vehicle numbers are lower on public holidays and during summer/spring, when tourist influx softens traffic peaks but increases night-time activity, especially along the Poetto coast. Driver behavior demonstrates strong routine patterns, with traffic flow variations reflecting predictable commuting cycles (see Figure 2 and Figure 3). Figure 2 illustrates the daily variation in vehicular traffic across three major roads in Cagliari, distinguishing between working days (top panel) and holidays (bottom panel). On working days, traffic begins to increase sharply from 6:00 a.m., peaking between 8:00 and 9:00 a.m. due to morning commuting, particularly on Asse Mediano (ID 48), which shows the highest morning traffic surge (>4000 vehicles/hour). A secondary broader peak is observed between 5:00 and 7:00 p.m., corresponding to evening commuting hours. Traffic levels remain relatively high throughout the day, indicating sustained urban activity and mobility. Asse Mediano (both IDs 42 and 48) consistently carries more traffic than Via Scano, reflecting its role as a primary urban artery. On holidays, the traffic pattern shifts significantly. Early morning volumes remain low until around 9:00 am. A more gradual increase follows, peaking around midday (11:00 am–1:00 pm), likely reflecting leisure-related travel. A second, smaller peak occurs in the late afternoon (5:00–6:00 p.m.), although overall volumes remain notably lower than on working days. Traffic intensity is more evenly distributed during the day, with less pronounced rush-hour effects, indicating reduced commuting activity. Overall, the data confirm that total daily traffic volumes are considerably higher on working days than holidays, with sharper and more distinct peaks driven by commuting behavior, especially along the Asse Mediano corridor. Emission loads were estimated by integrating traffic flow data with category-specific emission factors, following established methodologies (e.g., USEPA [26] and IPCC [39]) and applying standardized factors for each vehicle type. These represent the average quantity of pollutants emitted per unit of vehicle activity—typically expressed per kilometer traveled or per liter of fuel consumed.
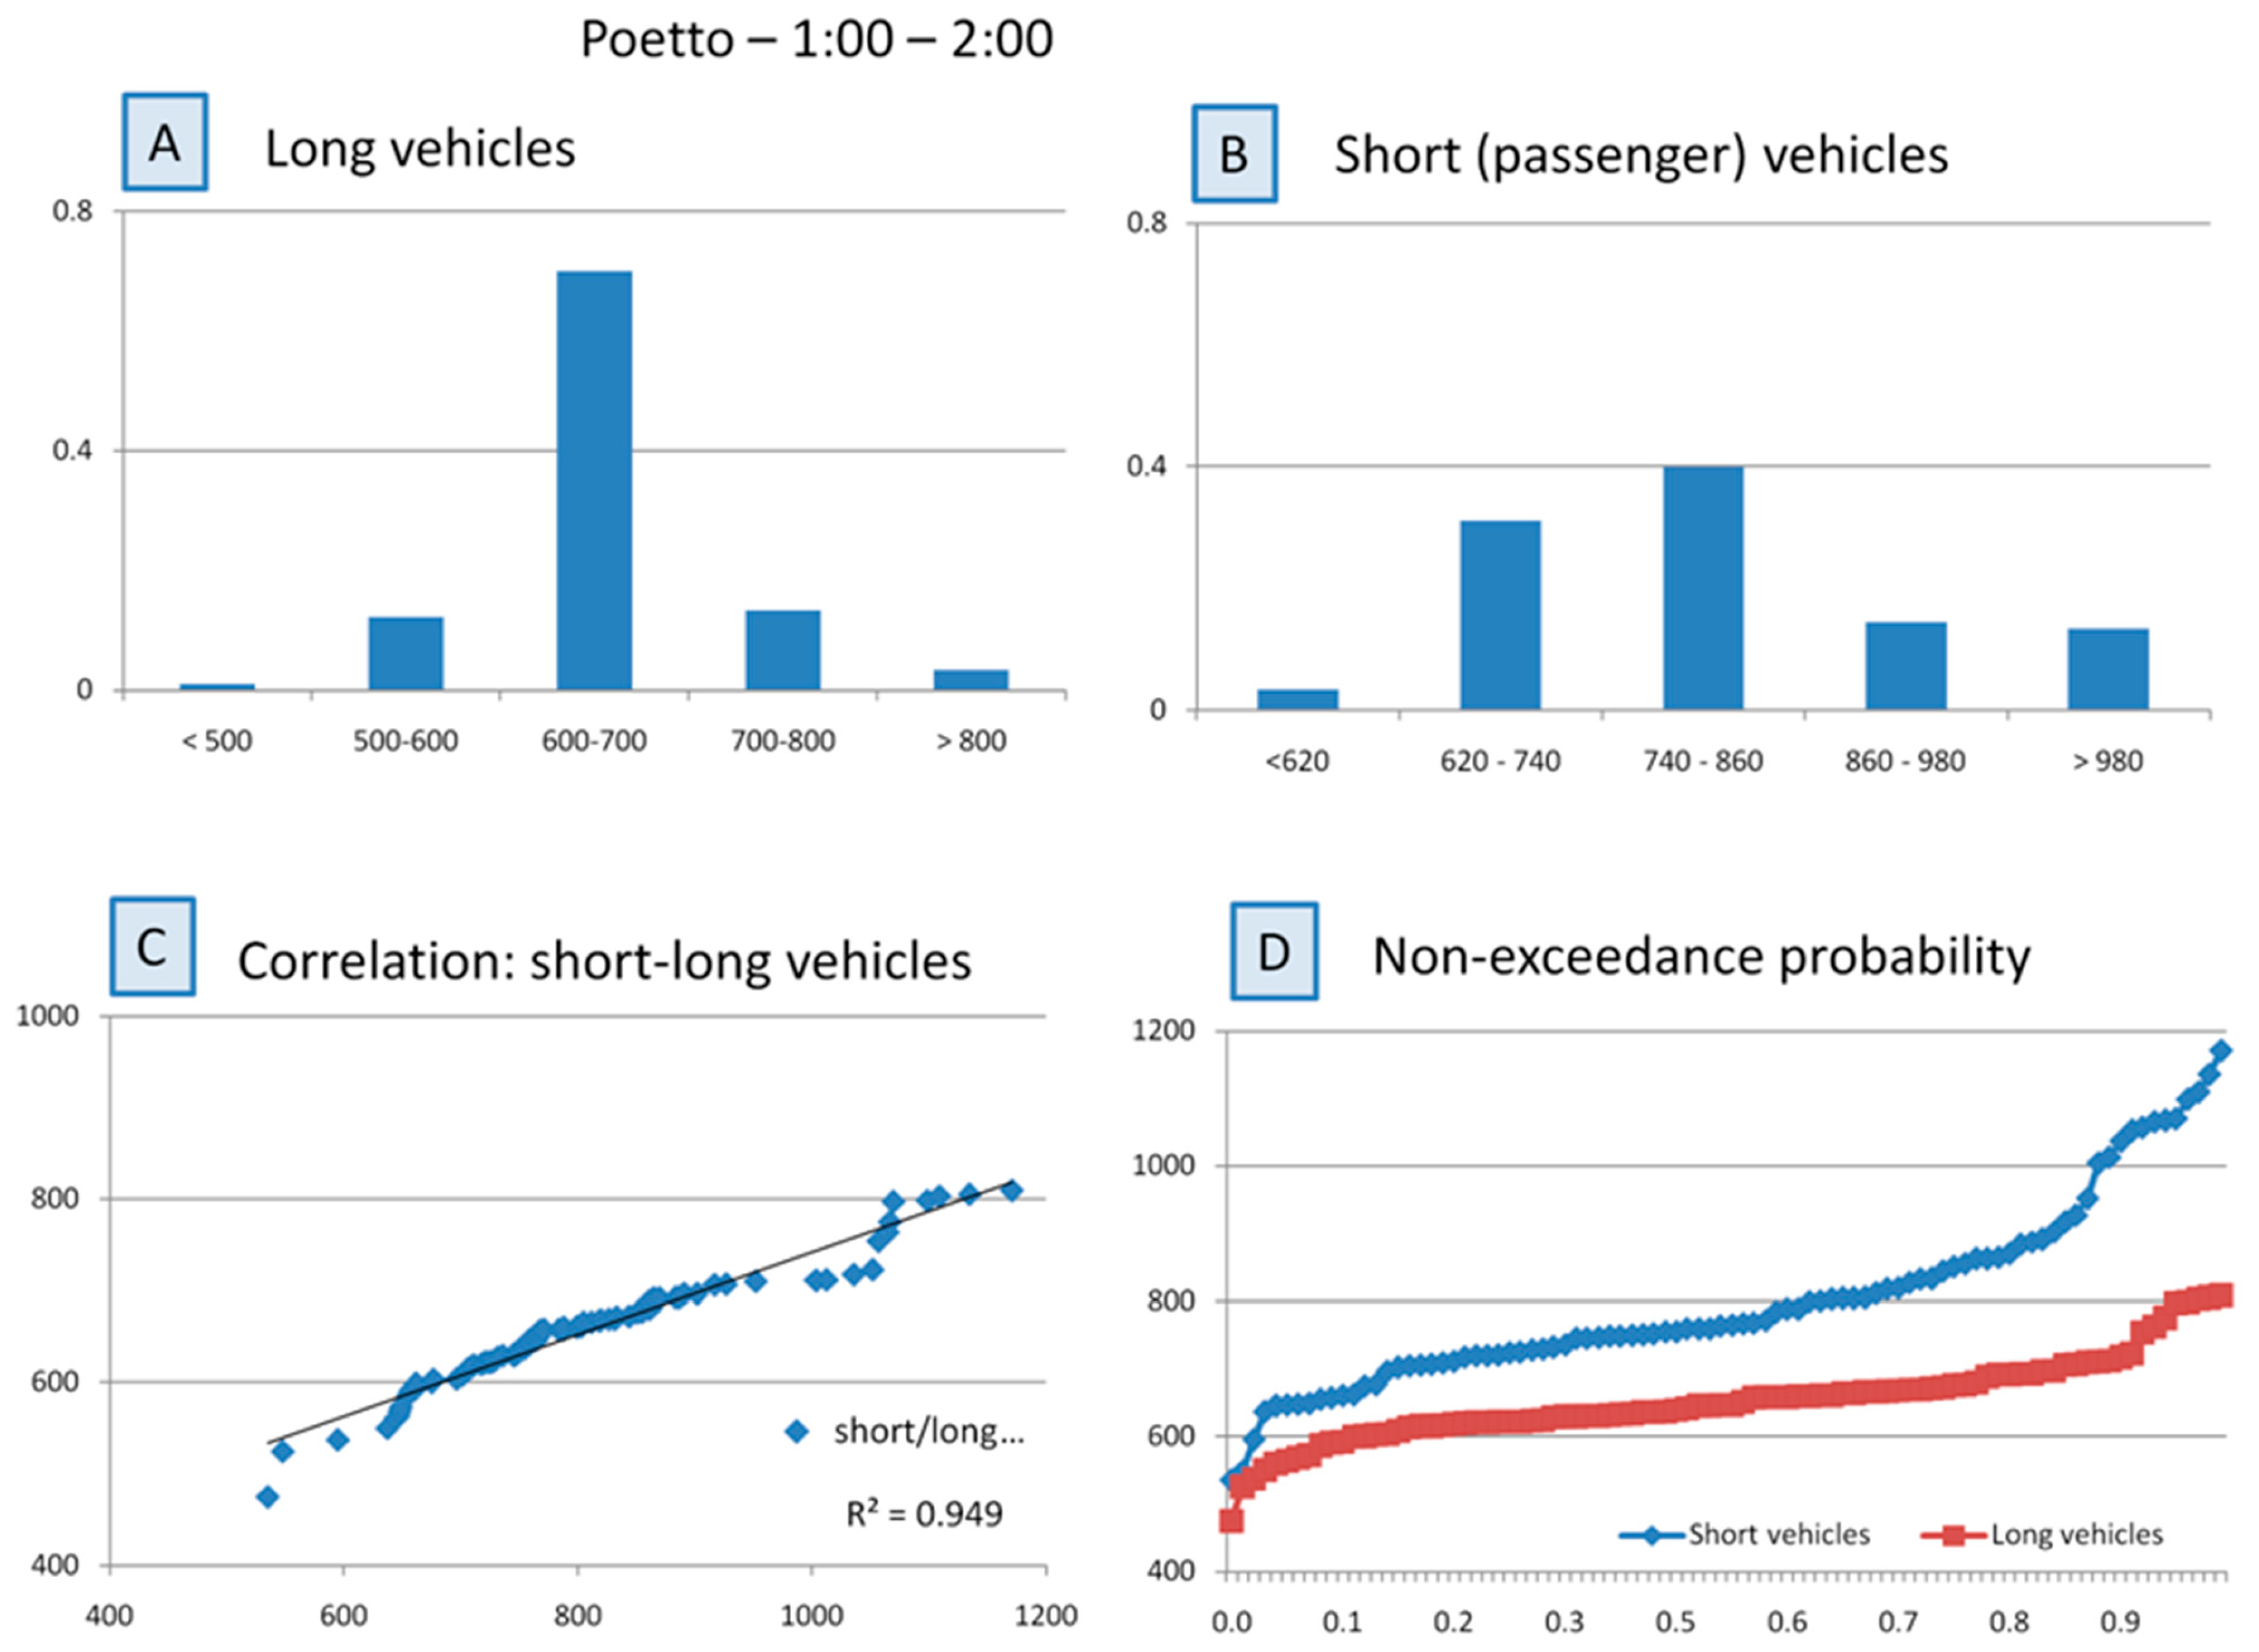
Figure 3 summarizes the traffic characteristics along Poetto Road, a major coastal corridor near Cagliari’s beach area, during the 1:00–2:00 PM period. The frequency distributions (Panels A and B) reveal that short vehicles—mainly passenger cars and motorcycles—dominate traffic flow, while long vehicles, such as buses and heavy-duty vehicles, account for a smaller yet consistent portion. A strong linear correlation (R2 = 0.949) between short and long vehicle counts (Panel C) suggests that traffic variations affect both categories similarly. The non-exceedance probability curves (Panel D) further show that short vehicles display greater variability and higher hourly volumes, reflecting their predominant role in overall traffic emissions.
Measured traffic data play a crucial role, providing information on vehicle volume, classification (e.g., passenger cars, heavy-duty trucks, buses), and temporal distribution across road segments. Pollutant emissions (e.g., CO, NO2, PM10) are then calculated for specific time intervals and locations by multiplying the number of vehicles in each class by their respective emission factors. Total emissions for a given road segment are derived by aggregating these outputs across all vehicle types on an hourly basis, thereby capturing traffic fluctuations and enabling a dynamic representation of urban emissions.
The emission factor approach supports dynamic modeling and scenario design by capturing fluctuations in traffic intensity, vehicle mix, and temporal patterns, thereby improving the accuracy of emission inventories and dispersion analyses. The reliability of the proposed methods lies in ensuring through calibration that the model is consistent with real field data.
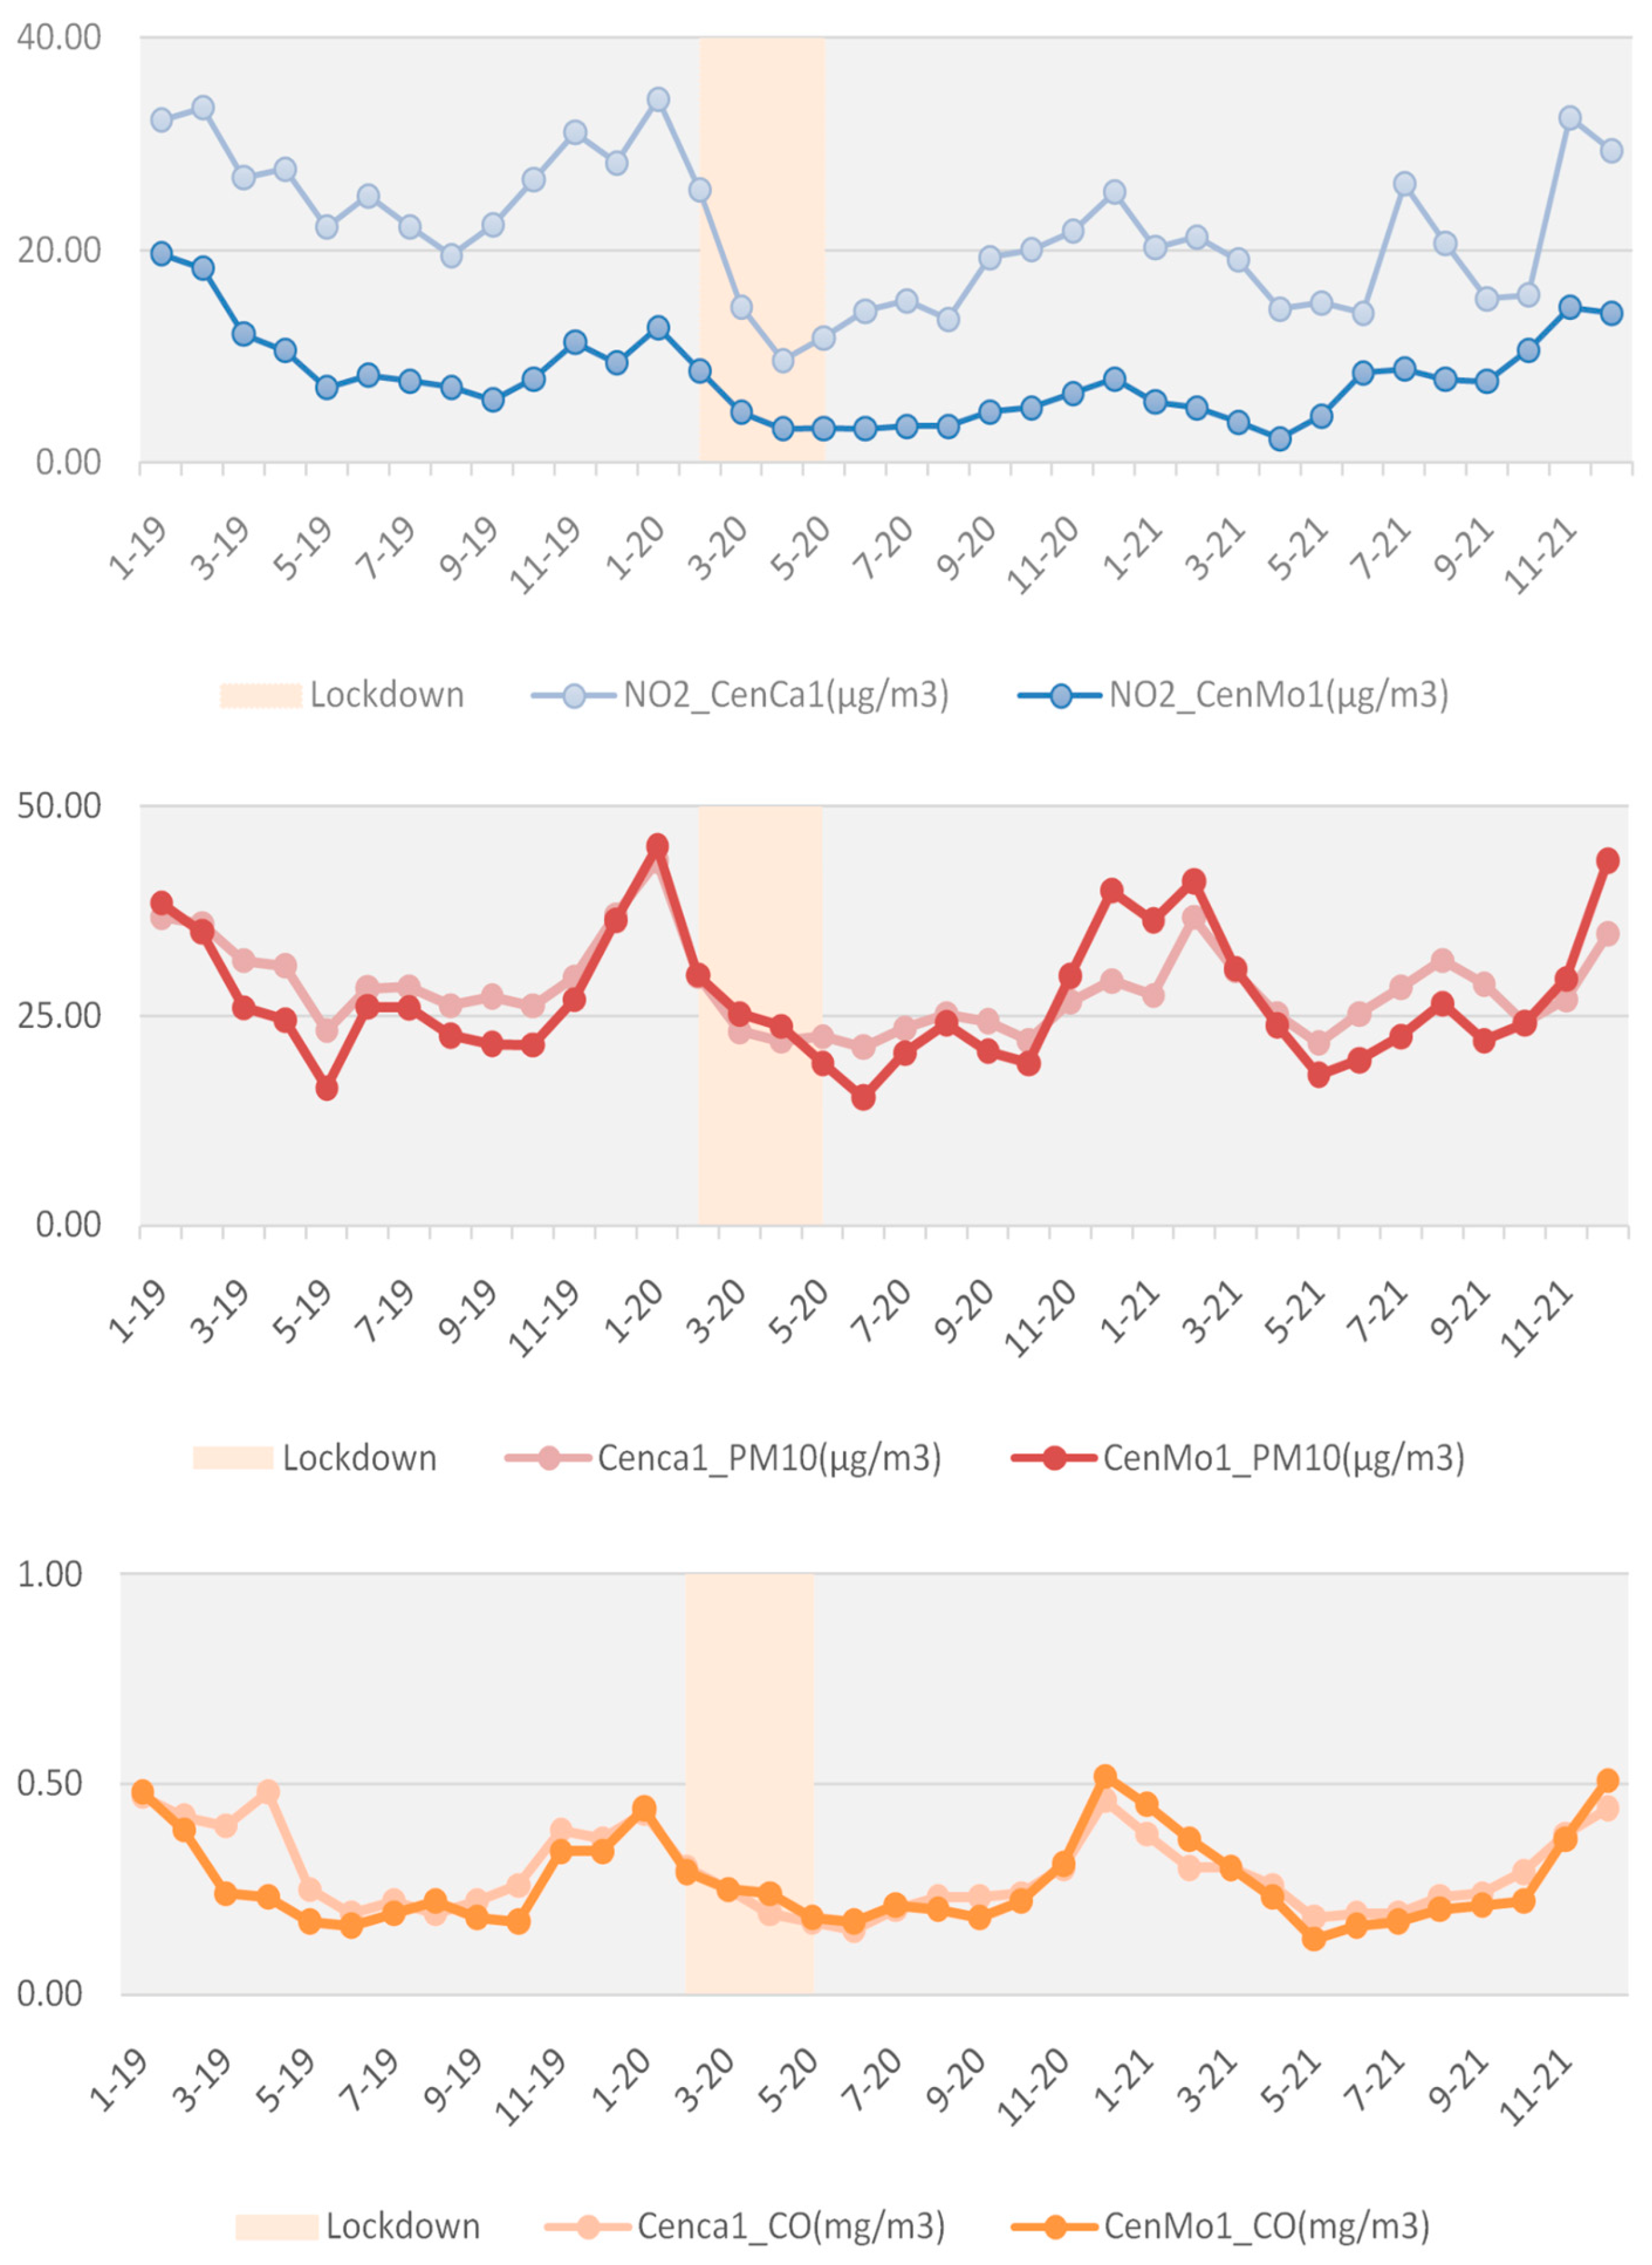
In the Cagliari metropolitan area, various sources of pollution are present, including vehicles, small industrial activities, civil heating systems, airport emissions, and industrial harbor pollution. Figure 4 illustrates the temporal evolution of NO2, PM10, and CO concentrations measured at the CenCa1 and CenMo1 monitoring stations in Cagliari. CenCa1 is located in the city center, and CenMo1 is positioned in the outer part of the city. A pronounced decline in NO2 and CO levels is observed during the lockdown period between 2019 and 2021, reflecting the reduction in vehicular traffic and associated emissions. In contrast, PM10 concentrations show greater variability and a less distinct response, likely due to the combined influence of non-traffic sources and meteorological factors. These results highlight the significant yet pollutant-specific impact of mobility restrictions on urban air quality. The monitored NO2 concentration data show that during the lockdown months, compared to 2019, an average NO2 drop of −45% is observed in the CenCa1 and an even greater drop of −59.5% in the peripheral station (CenMo1). The largest reduction occurred in April, consistent with peak lockdown restrictions.
For CO, the CenMo1 station (outer urban area) exhibits slight increases or stable concentrations during the lockdown period (February–May 2020), suggesting a lower sensitivity to traffic-related emissions and a stronger influence from outer industrial stationary sources and residential heating or small-scale combustion, which may have remained stable or even increased due to stay-at-home measures. In contrast, the CenCa1 station (central urban area) shows a light CO reduction, confirming that this station is more traffic-dependent than the other station. Moreover, a consistent seasonal pattern is observed across both stations, with winter peaks (December–January) reflecting increased combustion for heating and meteorological conditions unfavorable to pollutant dispersion, such as temperature inversions. A modest decline during summer months (June–August) is also evident, consistent with reduced combustion activity and improved atmospheric mixing. These seasonal dynamics further support the notion that CO levels in Cagliari are influenced by a broader mix of emission sources and are less directly linked to vehicular traffic compared to NO2. In the same line, PM10 levels in Cagliari show limited responsiveness to the COVID-19 lockdown compared to NO2, particularly at the outer station. This suggests that non-traffic sources, such as domestic heating, marine aerosols, construction dust, and transboundary pollution, play a major role.
This evidence is in agreement with the very low calculated correlation between experimental data and AERMOD simulated PM10 and CO data. This result is specific to the Cagliari area and its specific geographical setting. In Europe, on average, road transport contributes significantly to urban background PM10 pollution [40]. For Banská Bystrica (Slovakia), an urban center of similar size to Cagliari, a stronger correlation was obtained using a comparable modeling approach [41].

Calibration of the Model

Model calibration followed the recommendations of the EPA’s Guideline on Air Quality Models, adjusting emission coefficients to align with observed data. The analysis focused on NO2, as the other pollutants proved less sensitive to traffic variations. Vehicle emissions showed marked temporal variability influenced by the day of the week (workdays vs. holidays), seasonal changes, and the characteristics of individual road segments. To capture these dynamics, average hourly emission profiles were computed for each season and roadway, allowing the model to reproduce realistic fluctuations in traffic and emission intensity. Coefficients were subsequently refined to enhance model accuracy and internal consistency.
The model also accounted for the Urban Heat Island (UHI) effect—where urban areas experience elevated temperatures relative to surrounding rural zones due to anthropogenic heat sources, impervious surfaces, and dense built environments. The UHI modifies local meteorological conditions by influencing temperature gradients, wind circulation, and atmospheric stability—factors that directly affect pollutant dispersion and accumulation. Incorporating UHI effects into the simulation framework improved the representation of air quality in the Cagliari urban domain, enabling the model to better capture localized climatic influences on pollutant behavior.
The accuracy of the model was measured by comparing model concentration estimates with measured air quality data through the following objective functions:
MSE   =   i = 1 n ( y i y ^ i ) 2 n
MSEP = i = 1 n ( y i y ^ i ) 2 / ( y i ) 2 n
R 2 = 1 i = 1 n ( y i y ^ i ) 2 i = 1 n ( y i y - ) 2
Here, y represents the measured value, y ^ denotes the simulated value, and y - is the arithmetic mean of the measured observations. The calibration period covers March and April 2019. Initially, during the first run, the model’s performance metrics were as follows: Mean Squared Error (MSE) of 15.1, Mean Squared Error of Prediction (MSEP) of 257.9, and coefficient of determination (R2) of 0.21. After calibration, the best performing run resulted in significantly improved scores, with MSE reduced to 2.5, MSEP decreased to 43.9, and R2 increased to 0.62, indicating enhanced predictive accuracy and model reliability.
The calibrated configuration was then run to cover the whole year (2019). Lower MSE and MSEP values scored in spring and summer, indicating higher predictive accuracy, while consistently high R2 values confirm strong agreement between predictions and observations (Table 3). The model’s robustness makes it suitable for web-based integration, allowing stakeholders to simulate traffic and pollution scenarios, generate seasonal maps, and visualize pollutant distributions for data-driven environmental planning.
Figure 5 compares measured and modeled air pollutant concentrations over a typical 24 h cycle for the four seasons. Both measured and simulated data show a distinct diurnal pattern, with concentration peaks occurring in the morning (around 7–9 am) and in the evening (around 6–9 pm). Pollutant levels are highest in winter, particularly during peak hours, and lowest in spring and summer. The model accurately reproduces these seasonal and daily variations, with only minor overestimations during peak periods, especially in autumn and winter. These results indicate that the model effectively captures the temporal dynamics of air pollutant concentrations in Cagliari.

3. Results: The Decision Support System

The following section presents the results of this work, focusing on the development of the AERQ Decision Support System. AERQ DSS is specifically designed to explore and run “what-if” scenarios and facilitate evidence-based air quality management. Concentration heatmaps and diurnal plots presented are based on hourly averages over the simulation period, rather than the maximum values traditionally used in regulatory contexts. This approach allows visualization of short-term spatial variability without altering the AERMOD calculation scheme. By combining high-resolution modeling with intuitive interfaces, the DSS translates complex scientific outputs into actionable insights for policymakers, urban planners, and the public.

3.1. Integrated Architecture for Multiscale Air Quality Modeling

The AERQ DSS is a flexible, multiscale platform that integrates heterogeneous data, advanced modeling tools, and high-performance computing into a unified framework [42]. The system ingests and harmonizes data from satellite programs (e.g., Copernicus), national statistics (ISTAT), regional databases, and in-house environmental datasets. These data flows converge into a processing pipeline that couples geospatial analysis with air quality simulation system based on the AERMOD dispersion model.
The DSS architecture follows a modern, modular design that separates functionalities across four main layers: data ingestion and ETL (Extract, Transform, Load), simulation, storage, and visualization. Communication among components is orchestrated through optimized APIs and a high-speed internal network, ensuring minimal latency and fault tolerance.
This modular structure enables the platform to support near real-time and retrospective analyses with varying temporal resolutions, ranging from hourly cycles to seasonal and yearly aggregates. Outputs are exposed through a suite of business intelligence (BI) applications and interactive dashboards, allowing domain experts, urban planners, and decision-makers to explore complex air pollution scenarios through maps, charts, and data-rich reports.
Figure 6 presents the architecture of the Decision Support System (DSS), which integrates environmental, traffic, and meteorological information into a unified framework. The system begins with data acquisition from multiple sources, followed by harmonization processes that ensure data consistency and quality. The Execution Core manages data pre-processing, model simulations, and post-processing analyses. Simulation results are stored in a dedicated repository, providing access to both raw and processed outputs. Finally, the Visualization Portal delivers tailored information to various user groups, including citizens, policymakers, and technical experts, supporting awareness, decision-making, and operational analysis.

3.2. Computational Core and High-Resolution Simulation Framework

At the heart of AERQ is a hybrid simulation environment powered by the CRS4 HPC infrastructure. Leveraging over 9000 cores across geospatial-optimized clusters, namely Eolo and Seixi, the platform runs computationally intensive models like AERMOD with high spatial resolution and temporal fidelity. AERMOD’s physics-based modeling requires the integration of 3D meteorological fields, land-use characteristics, terrain profiles, and source-receptor relationships—factors that result in intensive workloads, especially when modeling urban areas with thousands of emission sources and receptors. For example, simulating pollutant dispersion for a full year in Cagliari, using over 1500 mobile sources and 2500 receptors, would take over two months on a standard desktop. Through a parallel simulation strategy on CRS4’s HPC, the same workload can be reduced to approximately 15 h—an efficiency gain of over 99%.
The simulation backend is supported by a hybrid storage system that combines SQL-based metadata management (PostgreSQL with PostGIS) with a high-throughput file system for raster data (BeeGFS, NFS). In a 5-year simulation, over 43,000 high-resolution GeoTIFFs and half a terabyte of simulation outputs are processed, indexed, and made queryable through spatial SQL operations and tile-based web rendering. This hybrid approach enables not only large-scale simulations but also fine-grained scenario analysis, paving the way for advanced decision-making at the municipal and regional levels.

3.3. User-Centric Applications and Decision-Making Tools

The AERQ DSS emphasizes usability and accessibility, offering a web-based suite of tools for scenario design, execution, and visualization. The user interface comprises two main applications: the Job-on-Demand App and the Visualization App [42].
Through the job-on-demand interface, authorized users can create custom scenarios by configuring pollutants, emission sources (e.g., traffic, industrial, port), vehicle fleet composition, meteorological conditions, and receptor locations. Scenario definition is intuitive: emission sources can be toggled directly on the GIS map, and vehicle volumes or Euro classes adjusted with simple sliders or dropdowns. The interface abstracts away the complexity of data handling and model execution, focusing user attention on the policy-relevant design of emission scenarios.
Upon scenario submission, the backend triggers a pipeline that prepares input data for AERMOD, runs the simulation on the HPC infrastructure, and processes the results through ETL procedures. Heatmaps are generated and stored as raster tiles (XYZ format), allowing responsive web display via MapWall, a custom OpenLayers-based framework [43,44]. Users can interactively filter results by date, pollutant, or wind direction, compare scenarios side-by-side, and analyze pollution dynamics over time and space.
Additionally, charts and analytical tools support time series exploration, regulatory threshold analysis, and hotspot identification. Outputs can be downloaded for offline use, while public-facing visualizations offer transparency and engagement for citizens.
This combination of high-end computational modeling and user-friendly interfaces makes AERQ a unique decision support system—capable of translating scientific complexity into actionable insights for environmental governance and sustainable urban planning.

3.4. Application of the DSS

This section demonstrates the practical application of the AERQ Decision Support System (DSS) for evaluating urban air quality scenarios.
Following consultations with transport and traffic managers, the future transformation of Via Roma and Viale Colombo—two central roads along Cagliari’s waterfront—is under consideration. The goal is to redefine their role within the urban fabric. Two main scenarios have been outlined. The first would limit vehicular circulation along Viale Colombo, converting it into a fully pedestrianized zone. The second would restrict through-traffic on Via Roma by diverting vehicles into an underground tunnel, allowing the surface level to be redesigned as a corridor prioritizing pedestrians and cyclists. This would create a continuous pedestrian connection between the waterfront and the inner city, reinforcing urban cohesion and stimulating socio-economic activities. Both options align Cagliari with a broader European trend of waterfront regeneration, enhancing pedestrian safety, reducing exposure to vehicular emissions, and improving environmental quality in the city center. At the same time, they would enable a broader valorization of the Marina district, the port area, and “Su Sicu” zone, opening new opportunities for cultural, commercial, and recreational uses. Notable precedents include Barcelona’s seafront transformation following the 1992 Olympic Games, which emphasized public access and leisure spaces; the redevelopment of Nice’s Promenade des Anglais, aimed at reducing car traffic and enhancing pedestrian mobility; and Naples’ “Lungomare Liberato” project, which converted major road sections into pedestrian areas. Together, these examples illustrate how rethinking waterfront mobility can drive urban renewal while strengthening a city’s civic and cultural relationship with the sea.
From a planning perspective, however, the two scenarios differ significantly in terms of feasibility, cost, and time horizon. Redirecting traffic to peripheral routes represents a relatively rapid and less resource-intensive measure but may require complementary interventions in traffic management and public transport to prevent congestion spillovers. The tunnel alternative, while technically more complex and costly, offers a long-term solution capable of reconciling urban accessibility with a radical reconfiguration of public space.
In both cases, the proposed intervention reflects a wider shift in mobility planning, where the prioritization of sustainable modes and public space quality is increasingly recognized as essential to urban resilience, environmental health, and the attractiveness of historic Mediterranean cities.

The Scenarios

The evaluated scenarios are investigated with particular attention to potential benefits for the Marina (in front of via Roma) and Bonaria (in front of viale Colombo) neighborhoods. Using the Job-on-Demand interface, scenarios were set up in under 10 min. The guided web-based tools embedded in the DSS enable users to configure even complex simulations through intuitive forms and map-driven interactions, automatically handling the preparation of emission inventories, meteorological inputs, and model parameters. This design makes the underlying modeling complexity completely transparent to users, allowing planners and technicians with no specific expertise in dispersion modeling to build, run, and compare scenarios efficiently. Through the user-guided pipeline, we defined the pollutants of interest (NO2), the simulation time frame, and the emission sources. Road segments could be individually enabled or disabled, while vehicle categories and their characteristics were either customized or combined from scratch. In our case, three configurations were tested:
Base line—Actual situation—This scenario was run using average hourly road emissions, taking into account both working days and holidays, as well as seasonal variations.
Scenario 1—Viale Colombo deactivation—Identical to the current situation, but with traffic from Viale Colombo rerouted to peripheral roads.
Scenario 2—Via Roma deactivation—Identical to the current situation, but with the diversion of vehicles through the planned tunnel in Via Roma.
The model was run over a five-year period, covering the timeframe from 1 January 2018 to 31 December 2022.
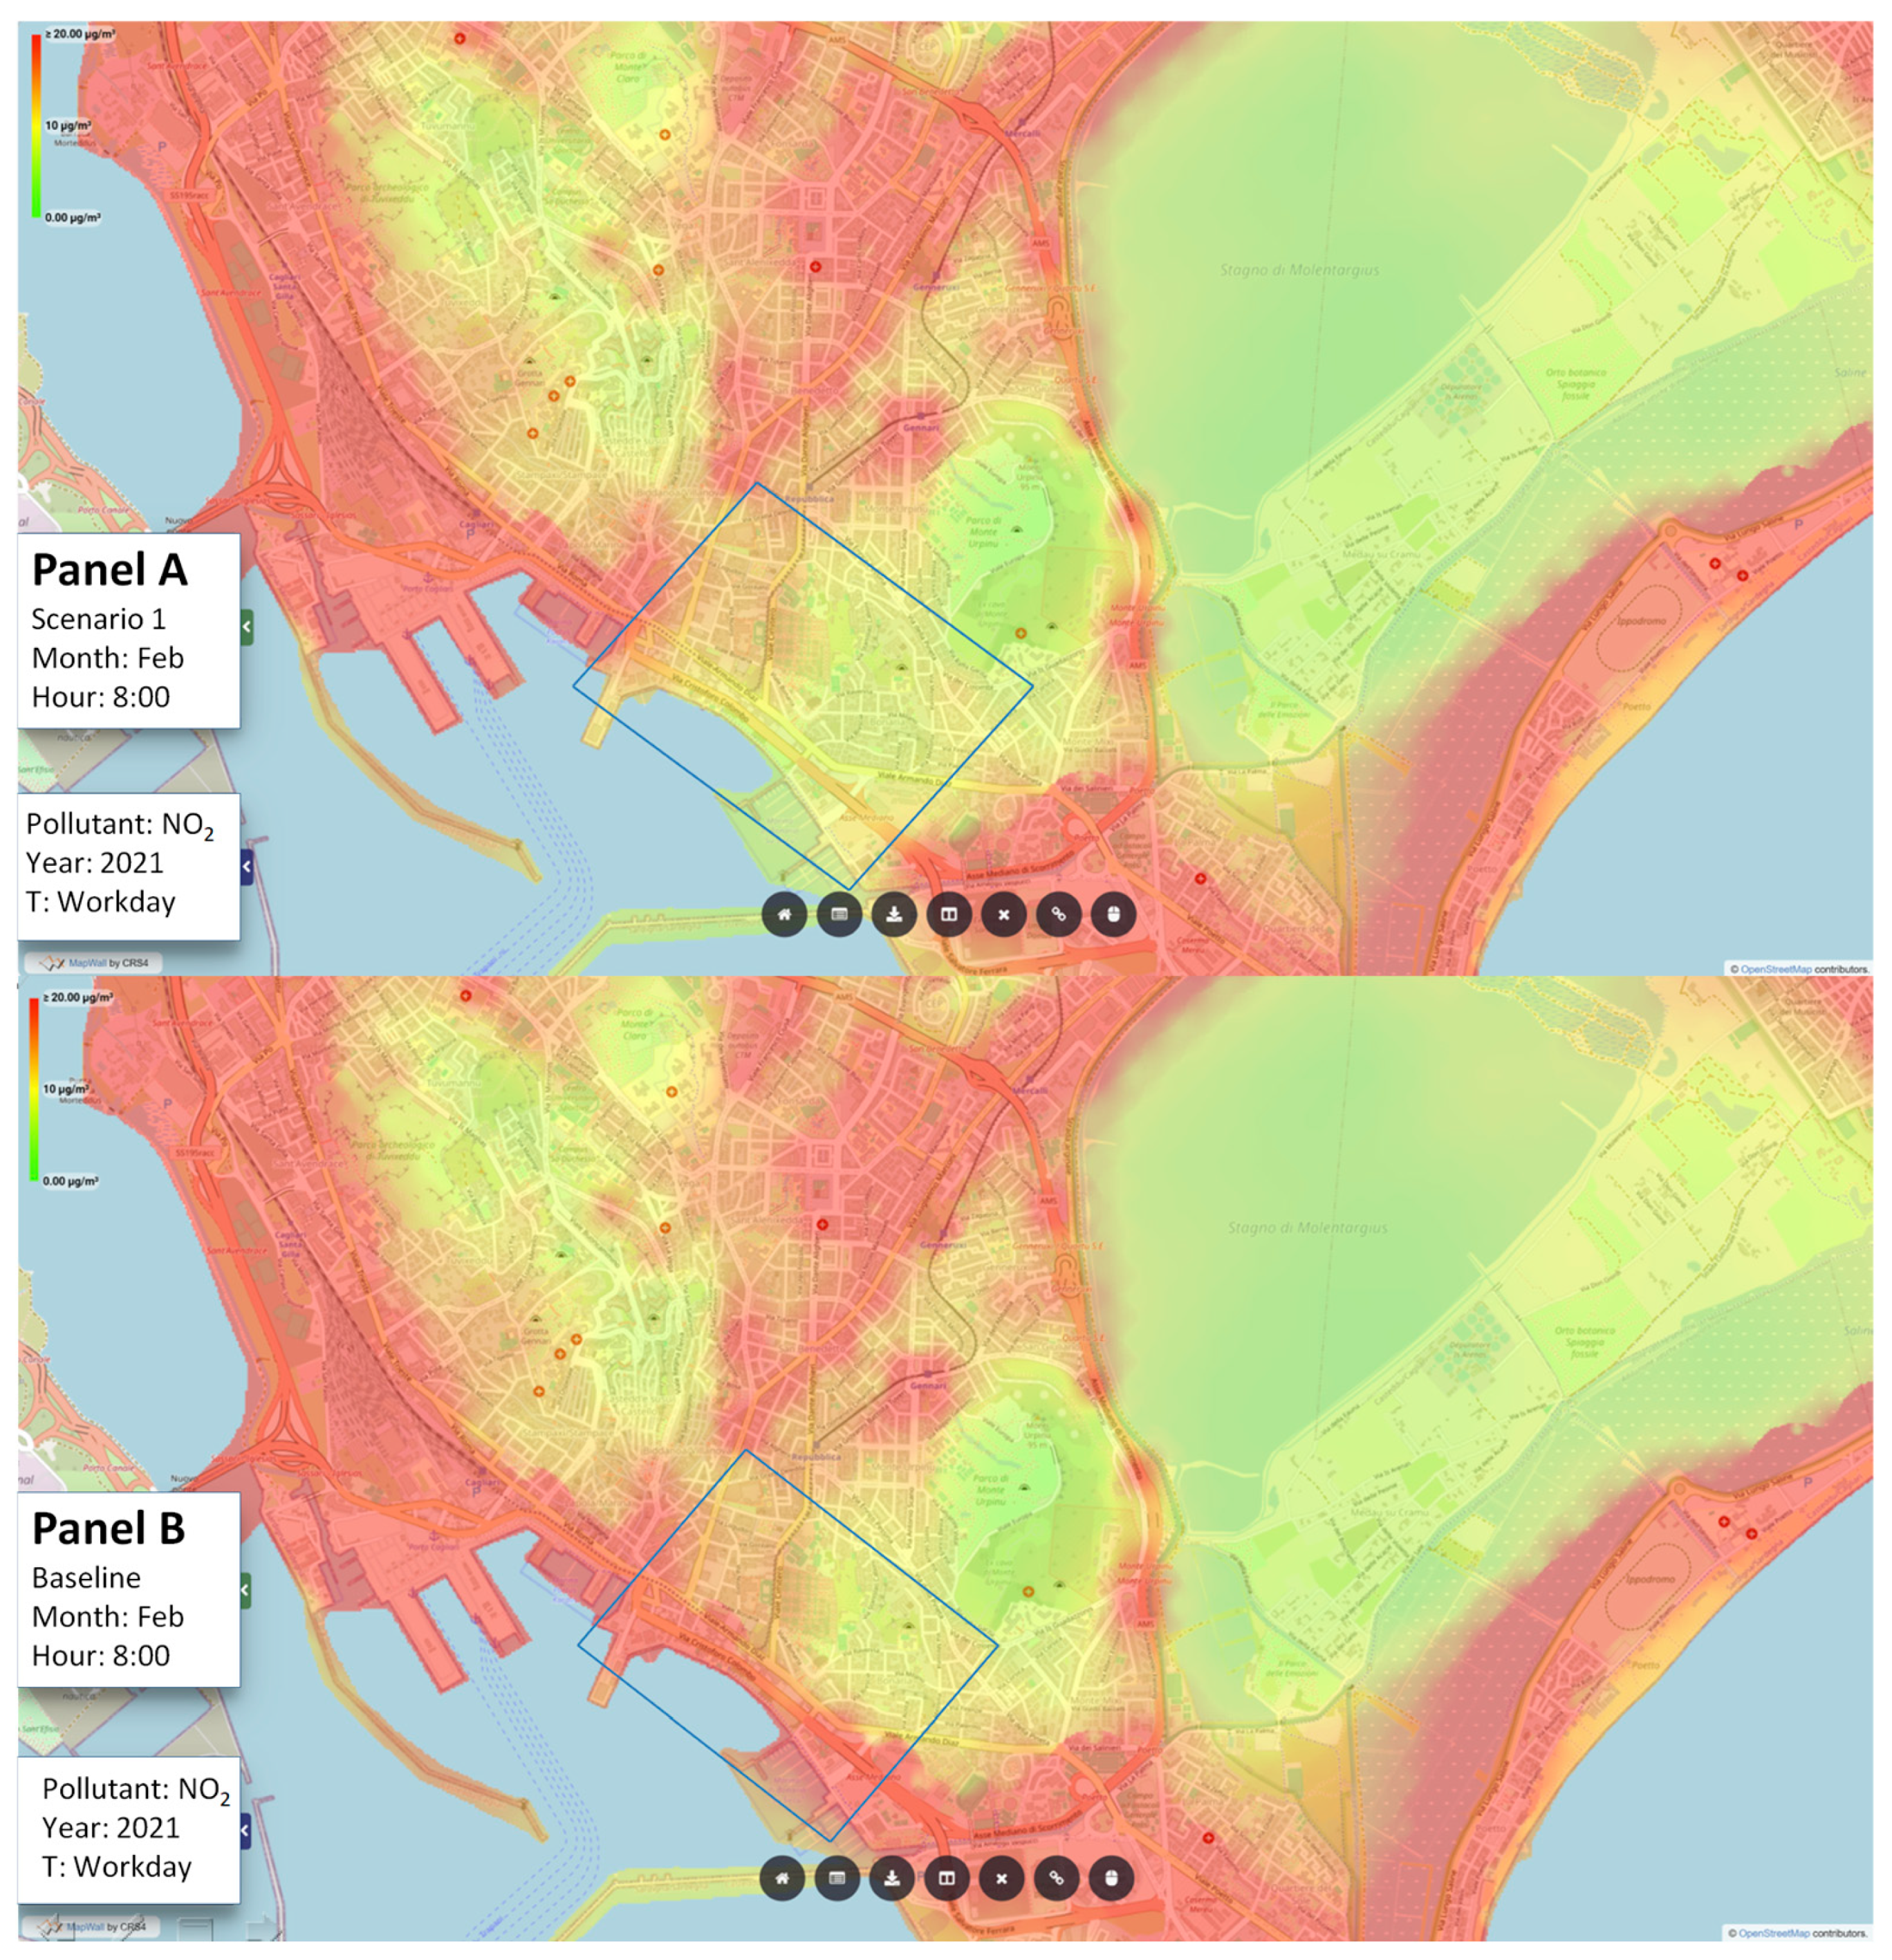
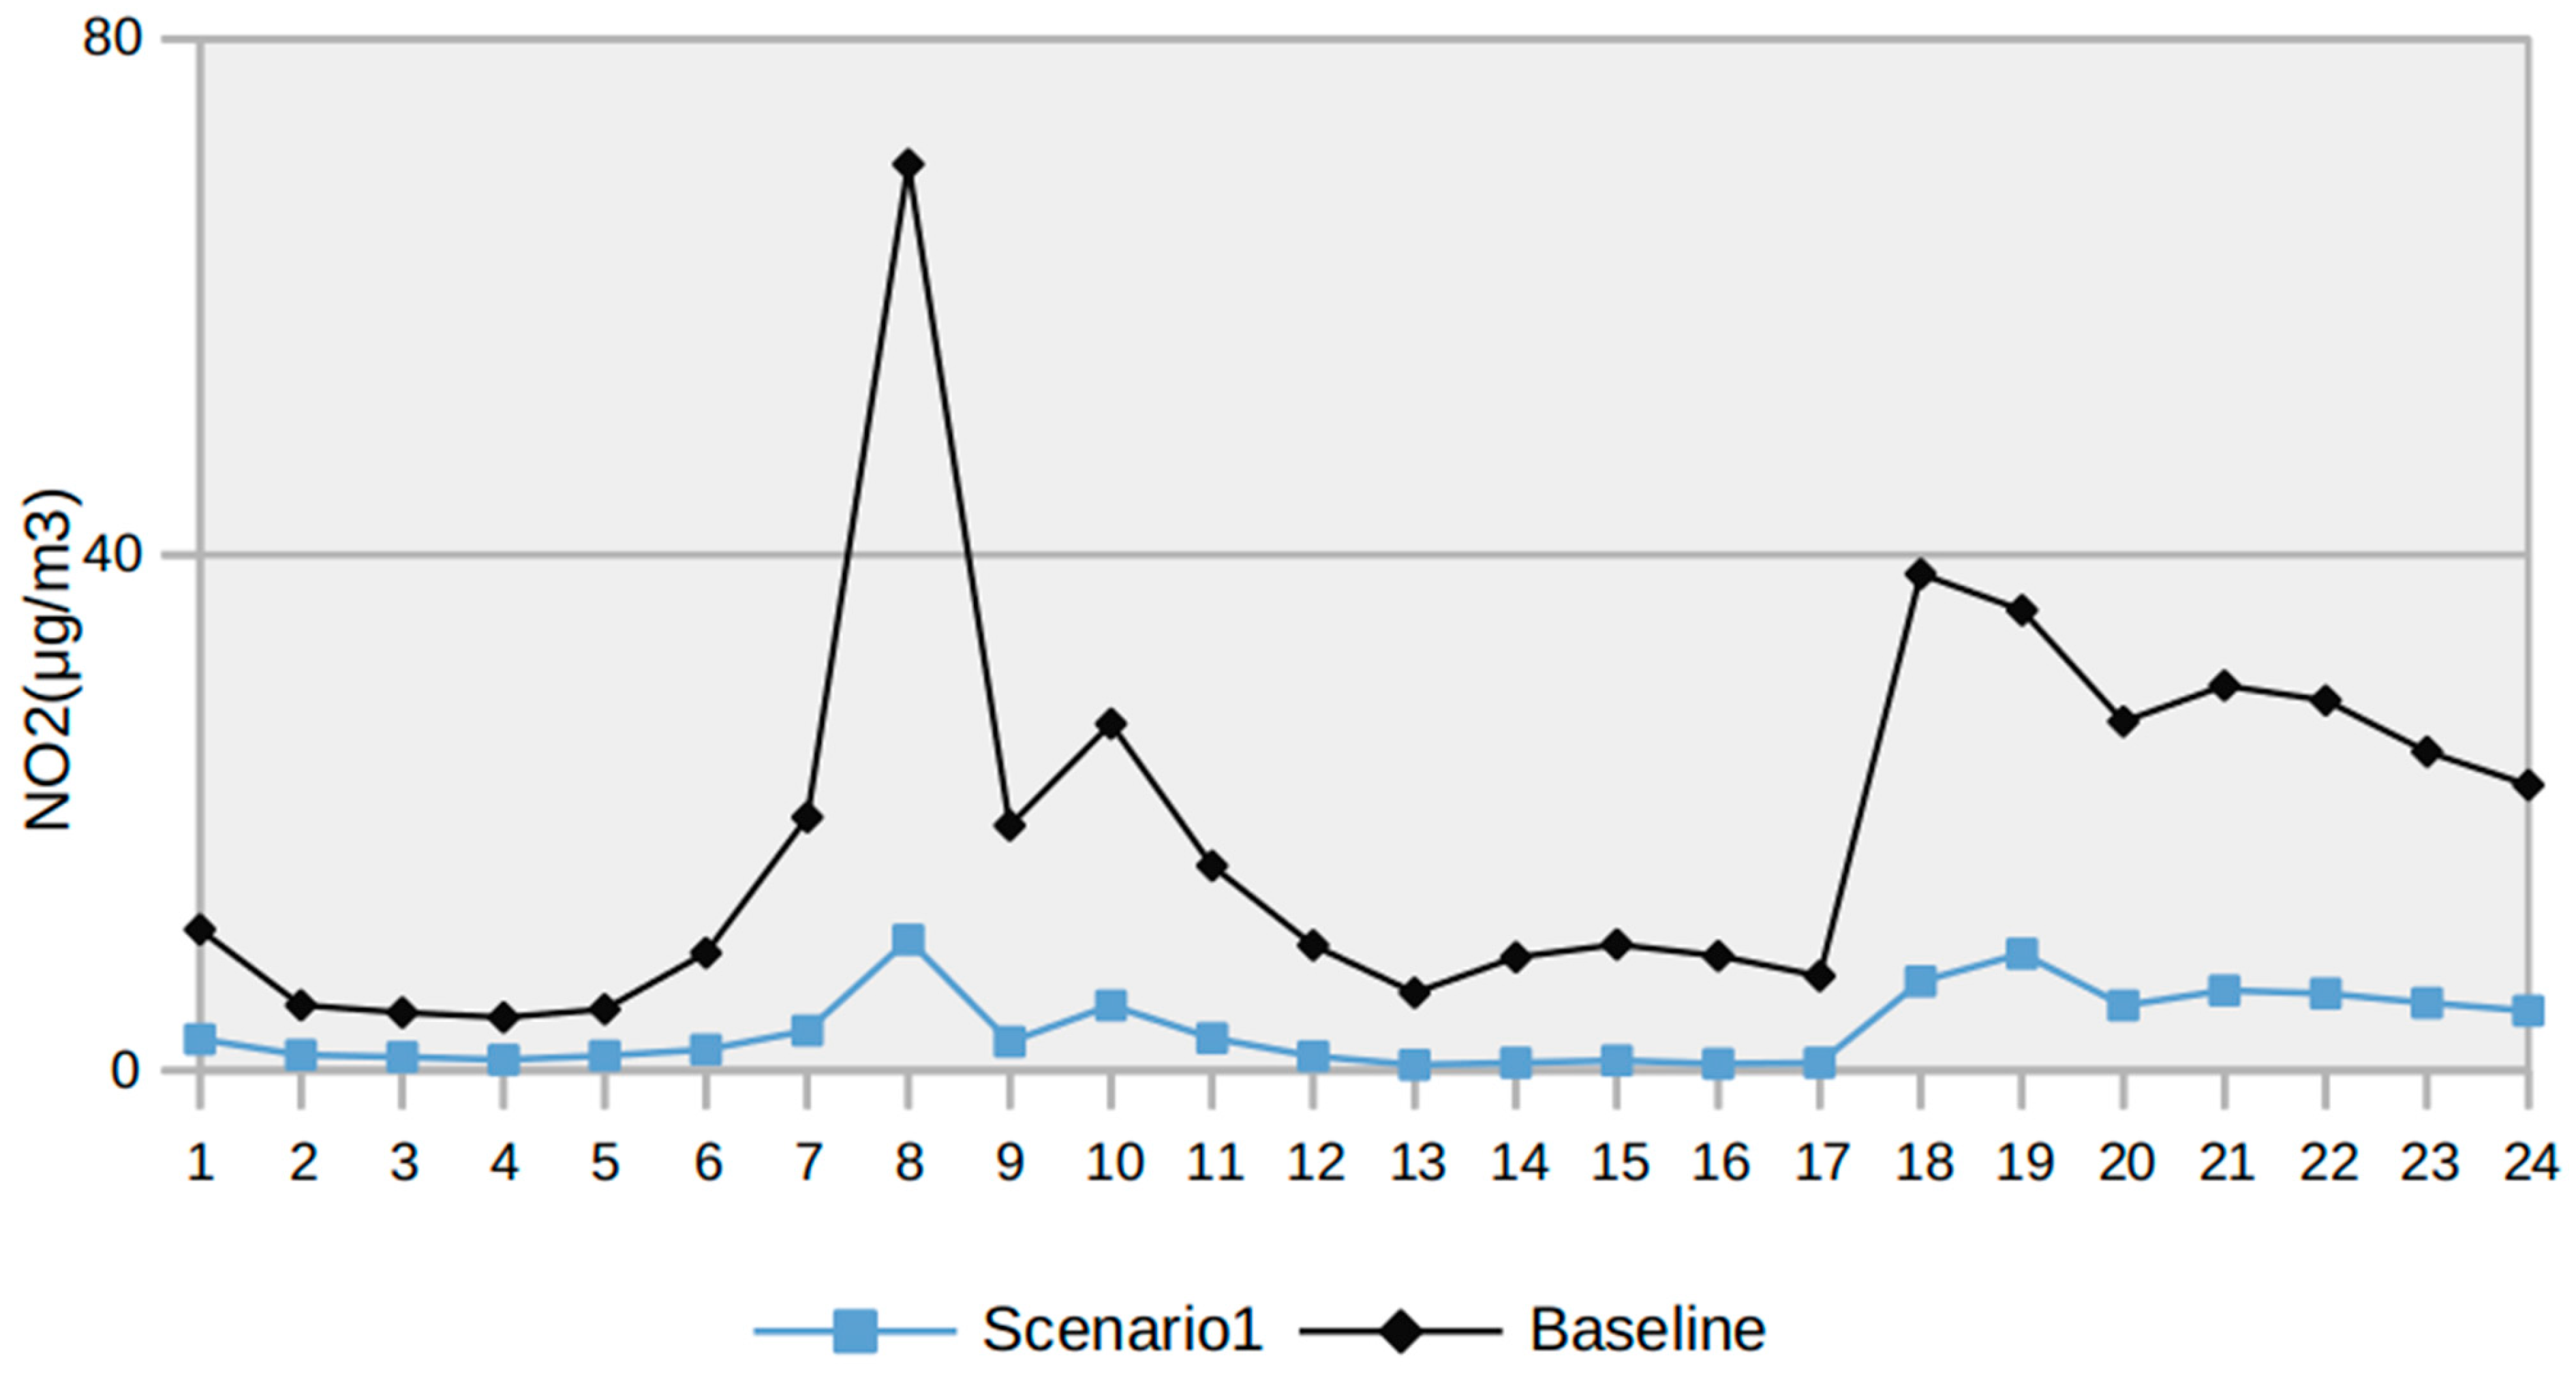
Scenario 1. Results indicate that air quality improvements extend well beyond the immediate vicinity of Viale Colombo, with positive impacts clearly visible throughout the Bonaria district. In Figure 7, in line with the new directive, the threshold was set to 10 µg/m3. The waterfront, directly affected by pedestrianization, is where reductions in traffic-related emissions and improvements in air quality are most visible. FPanel A in Figure 7 illustrates the proposed transformation in which Viale Colombo is converted into a pedestrian zone, with vehicular traffic rerouted to the outer road network. Panel B in Figure 7 shows the current situation where Viale Colombo remains a major traffic artery. The rectangular area highlights the section of the waterfront directly affected by pedestrianization, where reductions in traffic-related emissions and improvements in air quality are most visible. In Figure 8, monthly average hourly NO2 concentrations (February 2021) at a receptor located in the middle of Viale Colombo in Cagliari for the Baseline and Scenario 1. The black line represents the current situation, with Viale Colombo functioning as a major traffic corridor, while the blue line shows the simulated concentrations when Viale Colombo is deactivated and traffic is rerouted to peripheral roads. In the baseline case, concentrations exhibit two distinct peaks corresponding to the morning (~09:00 am, up to 75 µg/m3) and evening (~7:00 pm, ~40 µg/m3) rush hours. In contrast, the deactivation scenario shows a marked reduction in concentrations throughout the day, with hourly averages remaining below 10 µg/m3, thus highlighting the significant local air quality improvement achievable through traffic diversion.
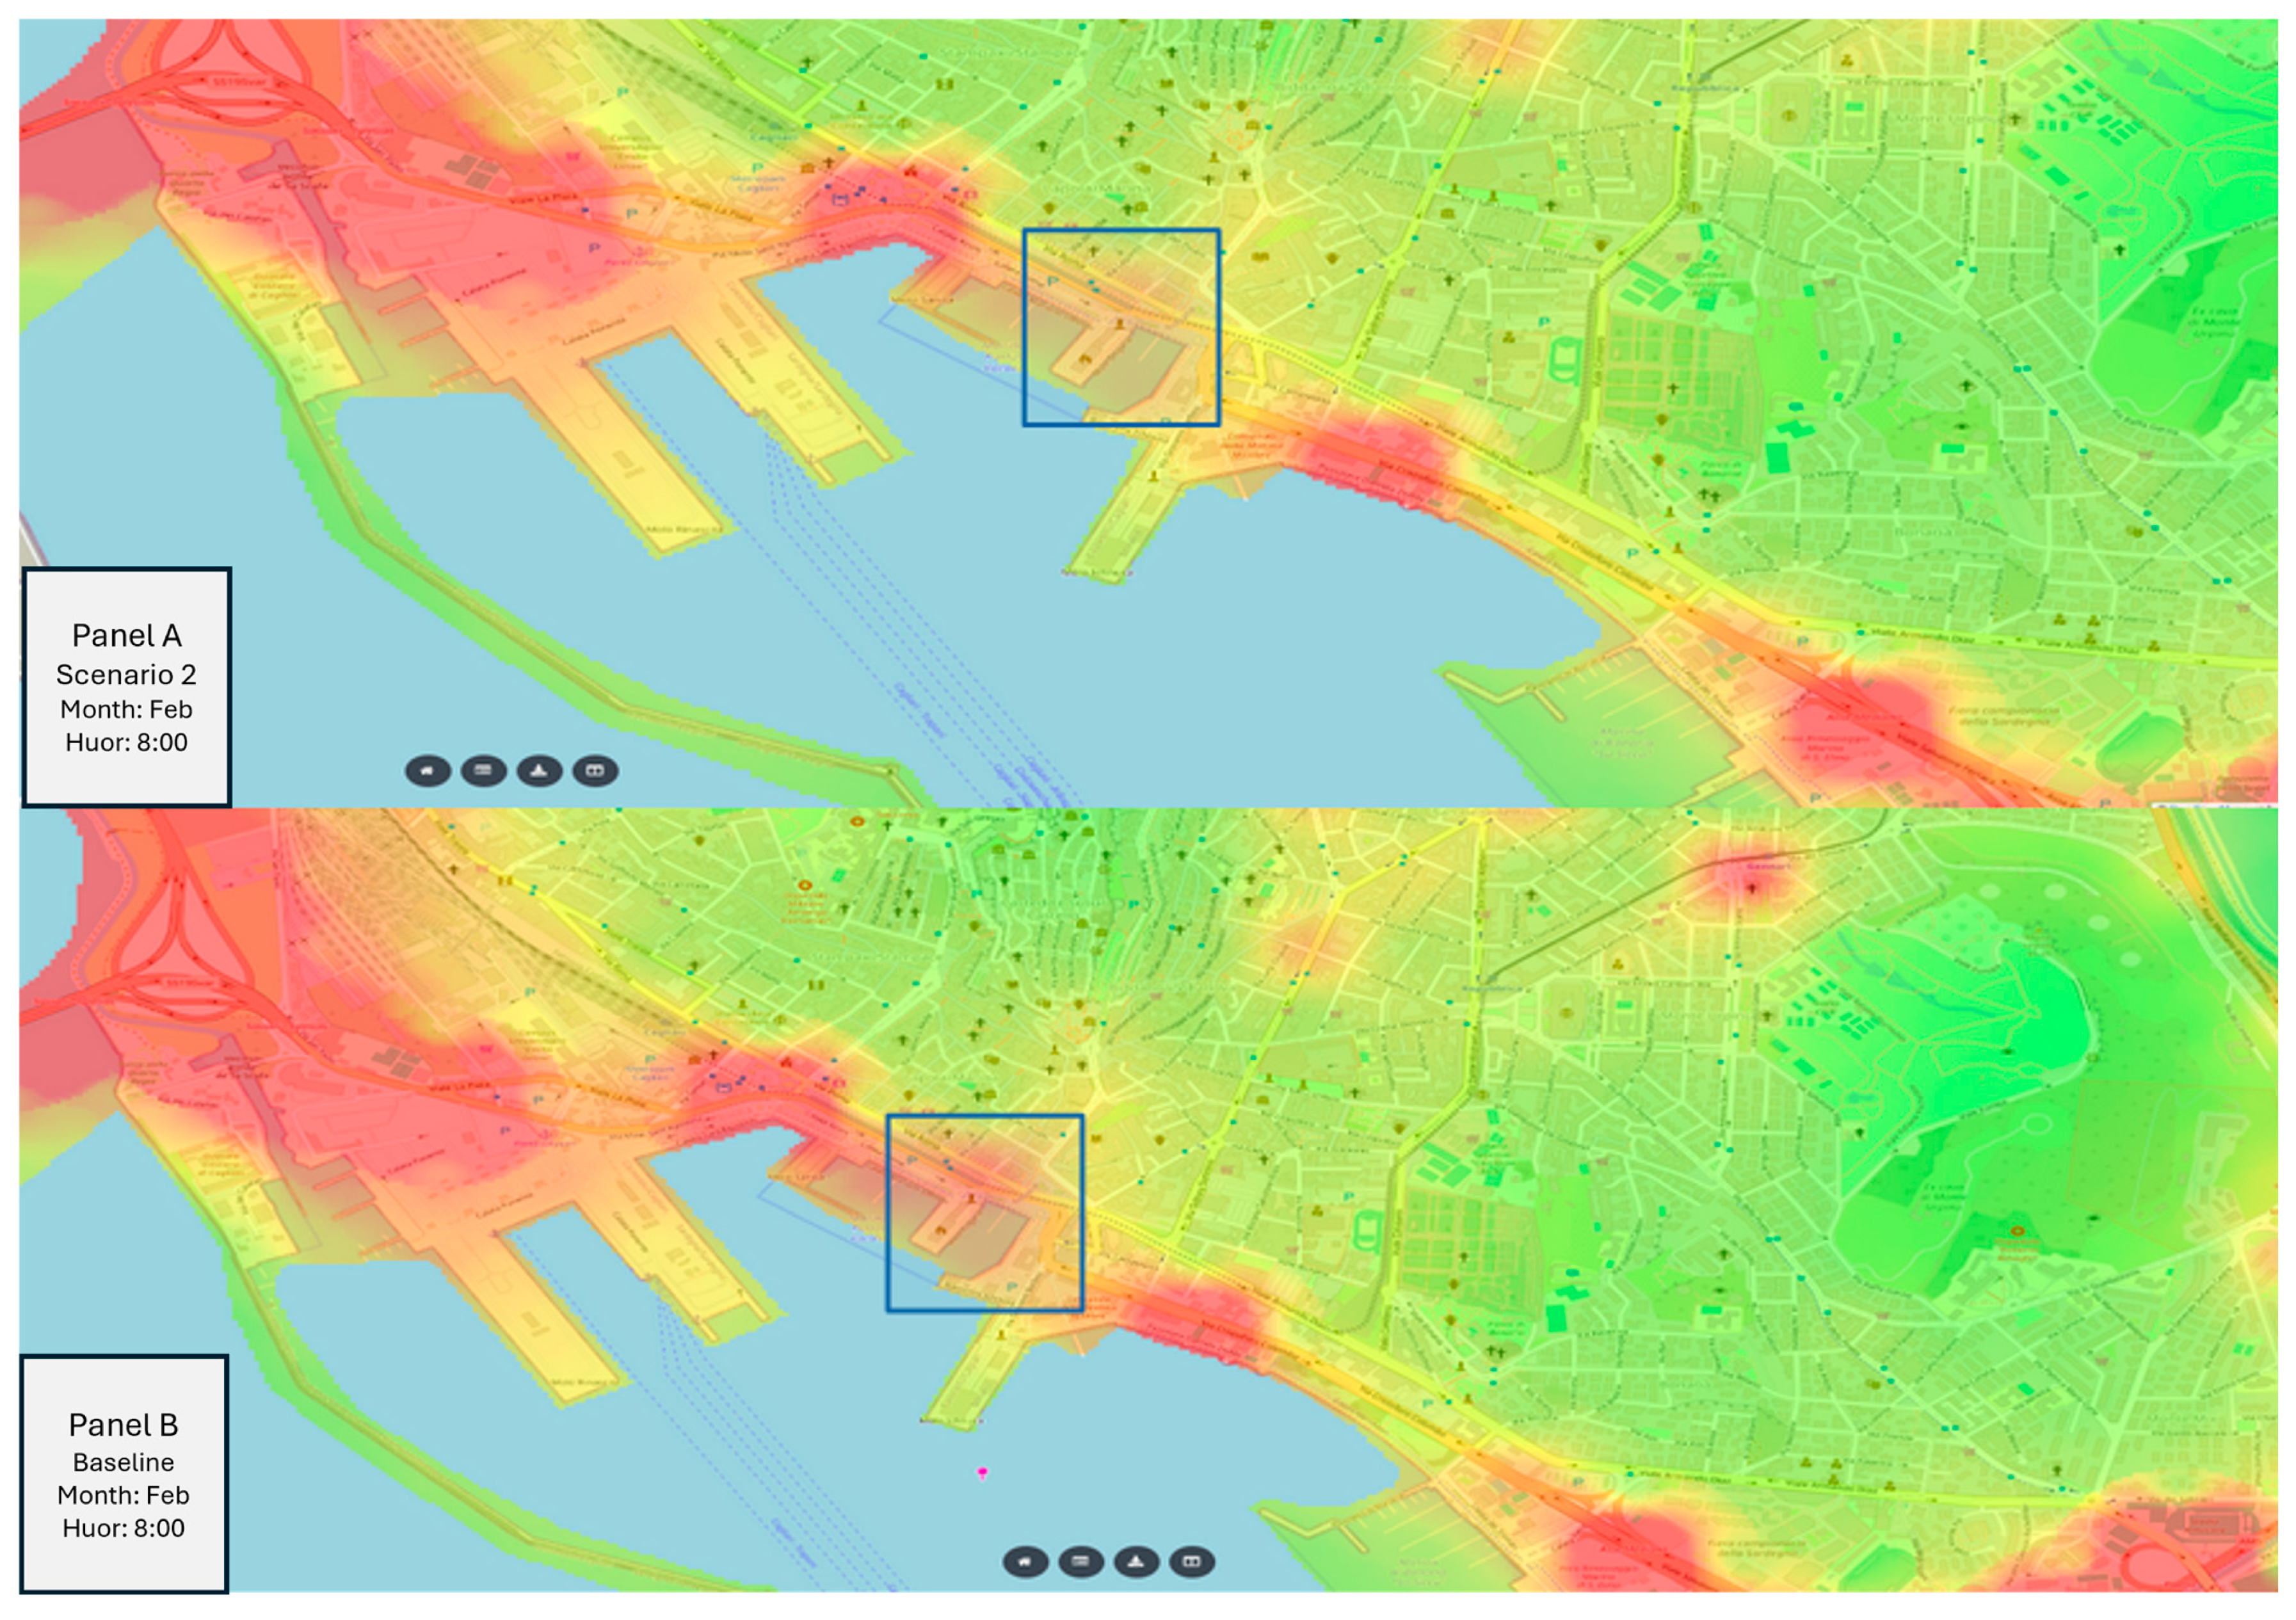
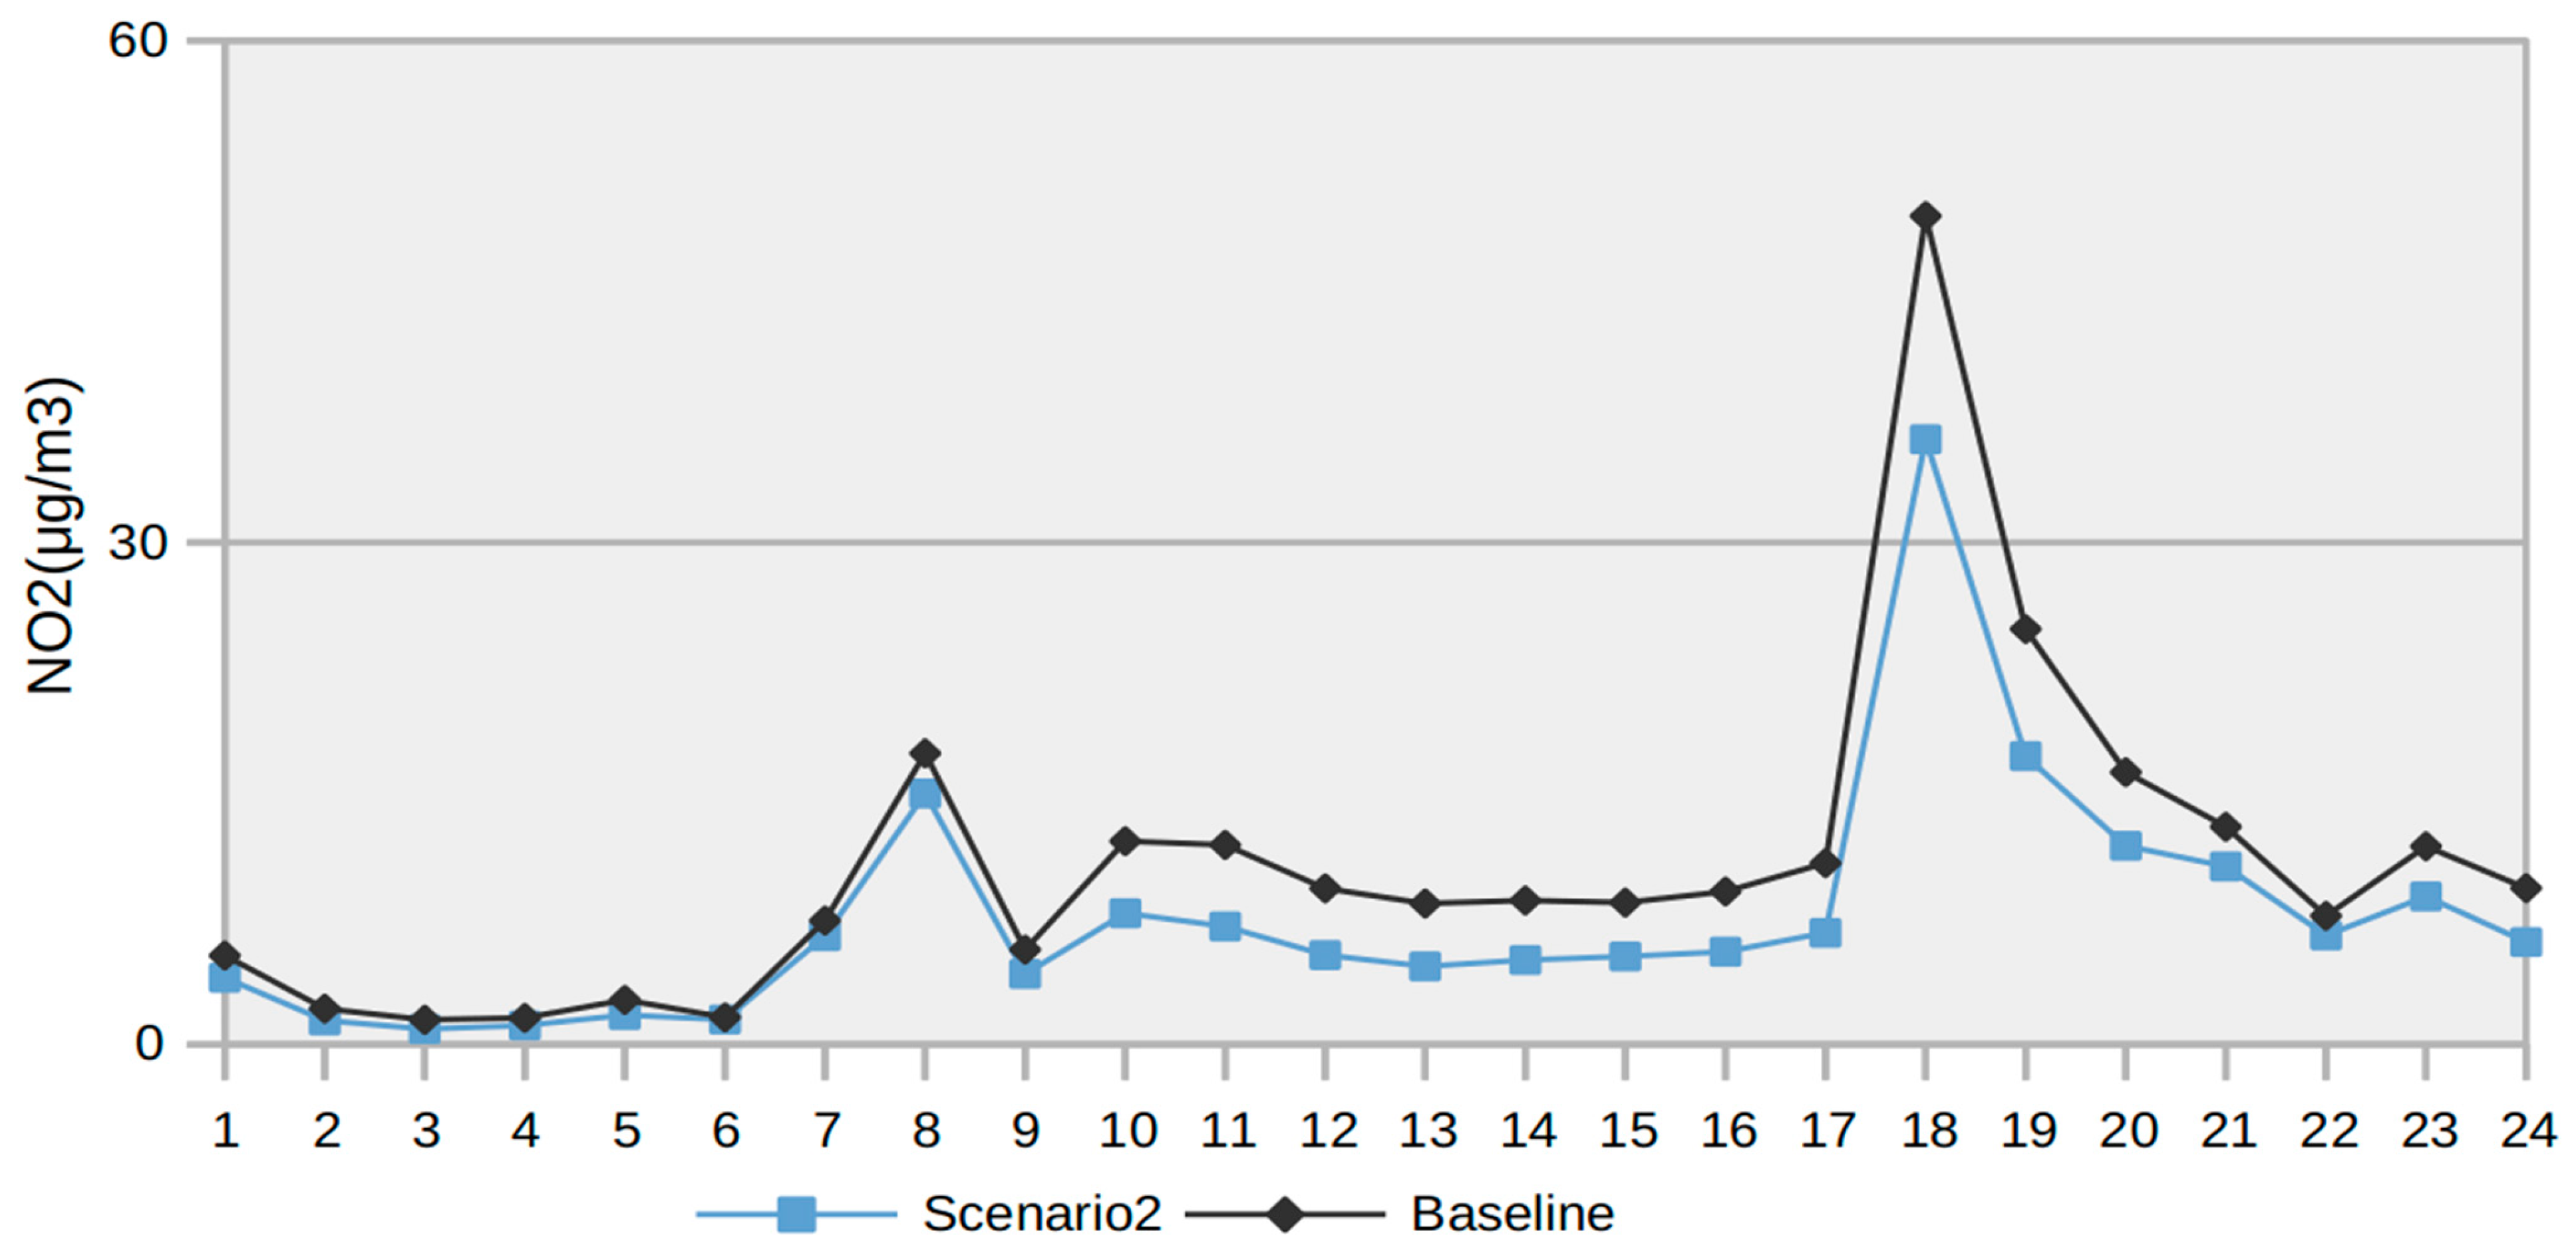
Scenario 2. Figure 9 compares the baseline scenario (Figure 9 B panel-bottom) with the Via Roma deactivation scenario (Figure 9 A panel-Top), in which traffic is diverted through the planned tunnel. The results show that the absence of vehicles along Via Roma leads to an improvement in air quality, but this effect is confined to the immediate surroundings of Via Roma. The limited benefit is due to the short length of the tunnel (approximately 300 m), which means that traffic emissions remain significant on adjacent streets. Moreover, the prevailing north-west to south-east winds further disperse pollutants across the area, reducing the localized improvement. Figure 10 shows that both Baseline and Scenario 2 display typical diurnal traffic-related patterns, with peaks during morning (08:00–09:00) and evening (19:00) rush hours. In the tunnel scenario, average concentrations are consistently lower, particularly during peak periods: the evening maximum is reduced from ~52 µg/m3 to ~38 µg/m3 (≈27% decrease), and the morning peak from ~20 µg/m3 to ~15 µg/m3 (≈25% decrease). Overall, the tunnel scenario reduces average hourly NO2 levels by 15–20% compared to the baseline, with the greatest improvements occurring during high-traffic hours.
These results show that pedestrianization and traffic diversion can significantly improve local air quality, with Viale Colombo achieving reductions in NO2 concentrations below 10 µg/m3 and Via Roma seeing 15–20% decreases, mainly during peak hours. These outcomes align with previous studies in Mediterranean cities: Barcelona’s waterfront pedestrianization reduced traffic-related NO2 by 20–30% [45], Naples’ “Lungomare Liberato” project achieved similar reductions in central streets [46,47], and Nice reported 15–25% decreases along the Promenade des Anglais [48]. Overall, the findings highlight that integrating traffic management with urban design interventions can deliver measurable air quality improvements, enhance pedestrian environments, and support sustainable mobility policies.

4. Discussion

The Scenarios demonstrate that the AERQ DSS can effectively quantify the environmental impacts of urban design and mobility interventions, providing actionable evidence for policymakers. Both the Via Roma tunnel and Viale Colombo pedestrianization scenarios resulted in measurable reductions in NO2 concentrations, confirming that targeted traffic management and street redesign can substantially improve air quality in compact coastal cities.
However, the magnitude and spatial extent of these benefits differ: while the pedestrianization of Viale Colombo produced a marked local decrease below 10 µg m−3, the Via Roma tunnel scenario yielded more moderate gains, confined to adjacent streets. These contrasts highlight the importance of integrating emission-control measures with comprehensive mobility planning, rather than relying on isolated infrastructural projects.
The outcomes for Cagliari are consistent with evidence from comparable Mediterranean cities such as Barcelona, Nice, and Naples, where waterfront pedestrianization projects achieved similar reductions in traffic-related NO2. These results suggest that the DSS produces realistic estimates and can serve as a transferable tool for evidence-based decision-making in other urban contexts. Beyond numerical validation, the findings underscore the co-benefits of pedestrianization—reduced exposure to pollutants, enhanced public space quality, and greater urban resilience.

Reflections on the Use of the DSS

A key contribution of AERQ lies in operationalizing complex dispersion modeling for real-world planning. Its integration of IoT data, traffic information, and HPC computation allows non-specialists to explore “what-if” scenarios quickly, bridging the gap between technical modeling and strategic policymaking. In this sense, AERQ acts not merely as a modeling tool but as a decision-enabling framework.
Nevertheless, the DSS’s effectiveness depends on the accuracy of traffic and meteorological data, model calibration, and appropriate user interpretation. The system currently omits photochemical processes and secondary aerosol formation, which may underestimate particulate pollution under certain atmospheric conditions. Future enhancements should include coupling with chemical transport models or machine-learning modules to capture these dynamics more comprehensively.
By making high-resolution simulations accessible to urban planners and local administrators, AERQ promotes data-driven, transparent governance. The Cagliari case illustrates how digital tools can support compliance with upcoming EU 2030 air quality standards and guide sustainable mobility transitions. More broadly, AERQ exemplifies the role of integrated environmental intelligence systems in advancing urban sustainability, offering a scalable model for other mid-sized Mediterranean cities.
AERQ enhances traditional modeling with automation, interoperability, computational efficiency, and accessibility. Unlike desktop GUIs that wrap AERMOD for single-user, project-by-project use, AERQ is a web-based, automated pipeline that ingests heterogeneous live data, harmonizes them via (Extract, Transform, Load procedures) ETL, executes iterative AERMOD runs and stores results in a queryable repository for multiple users and use-cases. AERQ couples the AERMOD engine with HPC-driven parallelization to convert workloads that would take months on a desktop into hours, enabling rapid scenario comparison and near-real-time policy support—capabilities that typical desktop packages do not deliver out-of-the-box.

5. Conclusions

This study presented AERQ, a data-driven Decision Support System (DSS) that integrates AERMOD dispersion modeling with IoT, traffic, and meteorological data to support urban air quality management. Applied to Cagliari (Italy), the system effectively reproduced spatial and temporal variations in NO2, CO, and PM10 concentrations, achieving strong agreement with monitoring data after calibration.
The AERQ DSS demonstrates how steady-state regulatory models like AERMOD can be operationalized within dynamic, iterative frameworks to generate high-resolution, scenario-based air quality analyses. By leveraging high-performance computing, AERQ reduces simulation time from months to hours and enables policymakers to explore “what-if” scenarios—such as traffic restrictions or pedestrianization plans—with rapid, quantitative feedback.
The Cagliari case confirmed that targeted mobility interventions can yield substantial local reductions in NO2 (up to 20–30%), consistent with evidence from other Mediterranean cities. Beyond numerical performance, AERQ enhances accessibility, transparency, and integration of air quality modeling into real decision-making processes. Furthermore, to ensure that proposed scenarios are both feasible and sustainable in the long term, such evaluations should be systematically complemented with socioeconomic analyses.
Future work will focus on extending the framework through chemical transport coupling and machine learning components to capture secondary pollutant formation and improve forecasting accuracy. Overall, AERQ provides a scalable and transferable digital platform that bridges advanced modeling and policy, supporting sustainable urban transformation in line with EU 2030 air quality goals.

Author Contributions

Conceptualization, P.C. and G.S.; methodology, P.C.; software, D.M. and C.M.; supervision, C.C.; writing—original draft, G.S. and P.C.; writing—review and editing, P.C. and C.C. All authors have read and agreed to the published version of the manuscript.

Funding

This research received no external funding.

Data Availability Statement

The original contributions presented in this study are included in the article.

Conflicts of Interest

The authors declare no conflicts of interest.

References

  1. WHO Air Pollution Information. Available online: https://www.who.int/news-room/fact-sheets/detail/ambient-(outdoor)-air-quality-and-health (accessed on 2 November 2024).
  2. EPA. Available online: https://www.epa.gov/mobile-source-pollution/learn-about-how-mobile-source-pollution-affects-your-health#mobile-sources (accessed on 1 August 2025).
  3. EEA Report 2023. Available online: https://www.eea.europa.eu/publications/europes-air-quality-status-2023 (accessed on 11 May 2025).
  4. Van Geffen, J.; Boersma, K.F.; Eskes, H.J.; Sneep, M.; ter Linden, M.; Zara, M.; Veefkind, J.P. S5P TROPOMI NO2 slant column retrieval: Method, stability, uncertainties and comparisons with OMI. Atmospheric Meas. Tech. 2020, 13, 1315–1335. [Google Scholar] [CrossRef]
  5. Chang, B.; Liu, H.; Zhang, C.; Xing, C.; Tan, W.; Liu, C. Relating satellite NO2 tropospheric columns to near-surface concentrations: Implications from ground-based MAX-DOAS NO2 vertical profile observations. NPJ Clim. Atmos. Sci. 2025, 8, 1. [Google Scholar] [CrossRef]
  6. De Santis, D.; Amici, S.; Milesi, C.; Muroni, D.; Romanino, A.; Casari, C.; Cannas, V.; Del Frate, F. Tracking air quality trends and vehicle traffic dynamics at urban scale using satellite and ground data before and after the COVID-19 outbreak. Sci. Total Environ. 2023, 899, 165464. [Google Scholar] [CrossRef] [PubMed]
  7. Gualtieri, G.; Brilli, L.; Carotenuto, F.; Cavaliere, A.; Giordano, T.; Putzolu, S.; Vagnoli, C.; Zaldei, A.; Gioli, B. Performance Assessment of Two Low-Cost PM2.5 and PM10 Monitoring Networks in the Padana Plain (Italy). Sensors 2024, 24, 3946. [Google Scholar] [CrossRef] [PubMed]
  8. Askariyeh, M.H.; Kota, S.H.; Vallamsundar, S.; Zietsman, J.; Ying, Q. AERMOD for Near-Road Pollutant Dispersion: Evaluation of Model Performance with Different Emission Source Representations and Low Wind Options. Transp. Res. Part Transp. Environ. 2017, 57, 392–402. [Google Scholar] [CrossRef]
  9. Munir, S.; Mayfield, M.; Coca, D.; Mihaylova, L.S.; Osammor, O. Analysis of Air Pollution in Urban Areas with Airviro Dispersion Model—A Case Study in the City of Sheffield, United Kingdom. Atmosphere 2020, 11, 285. [Google Scholar] [CrossRef]
  10. Available online: https://www.isprambiente.gov.it/en/archive/ispra-events/2024/02/presentation-of-the-air-quality-report-2023-edition (accessed on 11 May 2025).
  11. Colonne. Available online: https://www.9colonne.it/454521/breath-of-fresh-air-italy-s-remarkable-progress-in-air-quality?utm_source=chatgpt.com (accessed on 11 April 2025).
  12. Air Assessment. Available online: https://www.isprambiente.gov.it/en/activities/air/events-and-news (accessed on 11 April 2025).
  13. Eu Air Quality Directive. Available online: https://environment.ec.europa.euh/topics/air/air-quality/revision-ambient-air-quality-directives_en?utm_source=chatgpt.com (accessed on 11 May 2025).
  14. Xiao, Q.; Zhang, Z.; Liu, F.; Wu, Y.; Chang, H.H. Synergistic Effects of Ambient PM2.5, NO2, and Ozone on Mortality in 398 Cities. Environ. Int. 2024, 188, 108236. [Google Scholar]
  15. Meng, X.; Ma, Y.; Liu, C.; Chen, R.; Zhou, M.; Kan, H. A Multi-City Study of the Acute Effect of Carbon Monoxide on Mortality in China. Sci. Total Environ. 2024, 914, 168275. [Google Scholar] [CrossRef]
  16. European Environment Agency. Cagliari Among the Ten Italian Cities with the Worst Air Quality. L’Unione Sarda. 2024. Available online: https://www.unionesarda.it/en/sardinia/pollution-and-fine-particles-cagliari-among-the-ten-italian-cities-with-the-worst-air-quality-fruddzw1 (accessed on 21 July 2025).
  17. Cimorelli, A.J.; Perry, S.G.; Venkatram, A.; Weil, J.C.; Paine, R.J.; Wilson, R.B.; Lee, R.F.; Peters, W.D.; Brode, R.W. AERMOD: A Dispersion Model for Industrial Source Applications Part I: General Model Formulation and Boundary Layer Characterization. Appl. Meteorol. Climatol. 2005, 44, 682–693. [Google Scholar] [CrossRef]
  18. Pandey, G.; Venkatram, A.; Arunachalam, S. Modeling the air quality impact of aircraft emissions: Is area or volume the appropriate source characterization in AERMOD? Air Qual. Atmos. Health 2024, 17, 1425–1434. [Google Scholar] [CrossRef]
  19. Carruthers, D.J.; Stocker, J.R.; Ellis, A.; Seaton, M.D.; Smith, S.E. Evaluation of an explicit NOx chemistry method in AERMOD. J. Air Waste Manag. Assoc. 2017, 67, 702–712. [Google Scholar] [CrossRef] [PubMed]
  20. EPA AERMET User’s Guide. 2019. Available online: https://gaftp.epa.gov/Air/aqmg/SCRAM/models/met/aermet/aermet_userguide.pdf (accessed on 1 December 2024).
  21. Macêdo, M.F.M.; Ramos, A.L.D. Vehicle atmospheric pollution evaluation using AERMOD model at avenue in a Brazilian capital city. Air Qual. Atmos. Health 2020, 13, 309–320. [Google Scholar] [CrossRef]
  22. Rezaali, M.; Fouladi-Fard, R.; Karimi, A. Assessment of AERMOD and ADMS for NOx dispersion modeling with a combination of line and point sources. Stoch. Environ. Res. Risk Assess 2025. Advance online publication. [Google Scholar] [CrossRef]
  23. Nath, A.; Dhal, G.C. CALINE4 and AERMOD modelling for roadway vehicle-related air pollution: A recent review in India. Environ. Sci. Pollut. Res. 2024, 1–11. [Google Scholar] [CrossRef]
  24. Zeydan, Ö.; Karademir, A. Comparison of two air quality models in complex terrain near seashore. Atmósfera 2023, 37, 113–130. [Google Scholar] [CrossRef]
  25. Zhang, R.; Li, M.; Ma, H. Comparative study on numerical simulation based on CALPUFF and wind tunnel simulation of hazardous chemical leakage accidents. Front. Environ. Sci. 2022, 10, 1025027. [Google Scholar] [CrossRef]
  26. Air Emissions Factors and Quantification |USEPA. Available online: https://www.epa.gov/air-emissions-factors-and-quantification (accessed on 1 November 2024).
  27. Appel, K.W.; Bash, J.O.; Fahey, K.M.; Foley, K.M.; Gilliam, R.C.; Hogrefe, C.; Hutzell, W.T.; Kang, D.; Mathur, R.; Murphy, B.N.; et al. The Community Multiscale Air Quality (CMAQ) model versions 5.3 and 5.3.1: System updates and evaluation. Geosci. Model Dev. 2021, 14, 2867–2897. [Google Scholar] [CrossRef]
  28. Appel, K.W.; Napelenok, S.L.; Foley, K.M.; Pye, H.O.; Hogrefe, C.; Luecken, D.J.; Bash, J.O.; Roselle, S.J.; Pleim, J.E.; Foroutan, H.; et al. Description and evaluation of the Community Multiscale Air Quality (CMAQ) modeling system version 5.1. Geosci. Model Dev. 2017, 10, 1703–1732. [Google Scholar] [CrossRef]
  29. Zhu, Q.; Schwantes, R.H.; Coggon, M.; Harkins, C.; Schnell, J.; He, J.; Pye, H.O.; Li, M.; Baker, B.; Moon, Z.; et al. A better representation of volatile organic compound chemistry in WRF-Chem and its impact on ozone over Los Angeles. Atmos. Chem. Phys. 2024, 24, 5265–5286. [Google Scholar] [CrossRef]
  30. Manders, A.M.M.; Builtjes, P.J.H.; Curier, L.; Denier van der Gon, H.A.C.; Hendriks, C.; Jonkers, S.; Kranenburg, R.; Kuenen, J.J.P.; Segers, A.J.; Timmermans, R.M.A.; et al. Curriculum vitae of the LOTOS–EUROS (v2.0) chemistry transport model. Geosci. Model Dev. 2017, 10, 4145–4173. [Google Scholar] [CrossRef]
  31. Kim, S.-H.; Park, S.-H.; Joo, H.-S.; So, M.-S.; Lee, N.-H. A Study on Improvement of Air Quality Dispersion Model Application Method in Environmental Impact Assessment (II)—Focusing on AERMOD Model Application Method. J. Environ. Impact Assess. 2023, 32, 203–213. [Google Scholar] [CrossRef]
  32. Sardegnalive. Available online: https://www.sardegnalive.net/in-sardegna/aria-pulita-in-sardegna-biossido-di-azoto-e-ozono-nei-limiti-cygm08to (accessed on 11 March 2025).
  33. Seidel, D.J.; Free, M. Diurnal and seasonal variations in lower-tropospheric temperature inversions: Global climatology using radiosonde data. J. Geophys. Res. Atmos. 2020, 125, e2019JD030972. [Google Scholar]
  34. Air Quality Daily Data—Regione Autonoma Sardegna. Available online: https://www.sardegnaambiente.it/arpas/attivita/monitoraggio/aria/datigiornalieri.html (accessed on 12 January 2025).
  35. SOGAER. Available online: https://assaeroporti.com/archivio/ (accessed on 6 June 2025).
  36. Port Authority of Cagliari. Available online: https://www.adspmaredisardegna.it/cagliari/ (accessed on 1 September 2025).
  37. Data—Istat. Available online: https://www.istat.it/en/data/ (accessed on 1 August 2024).
  38. Cagliari API Portal. Available online: http://dashboard-api.comune.cagliari.it.s3-eu-west-1.amazonaws.com/traffic/pages/index.html (accessed on 1 August 2024).
  39. Intergovernmental Panel on Climate Change (IPCC). 2019. 2019 Refinement to the 2006 IPCC Guidelines for National Greenhouse Gas Inventories: Volume 2–Energy. Available online: https://www.ipcc.ch/report/2019-refinement-to-the-2006-ipcc-guidelines-for-national-greenhouse-gas-inventories/ (accessed on 21 January 2025).
  40. The Contribution of Transport to Air Quality-TERM12: Transport Indicator Tracking Progress Towards Environmental Targets in Europe-European Environment Agency. Available online: https://www.eea.europa.eu/en/analysis/publications/transport-and-air-quality-term-2012 (accessed on 5 May 2025).
  41. Salva, J.; Vanek, M.; Schwarz, M.; Gajtanska, M.; Tonhauzer, P.; Ďuricová, A. An Assessment of the On-Road Mobile Sources Contribution to Particulate Matter Air Pollution by AERMOD Dispersion Model. Sustainability 2021, 13, 12748. [Google Scholar] [CrossRef]
  42. Cau, P.; Muroni, D.; Satta, G.; Milesi, C.; Casari, C. AERQ—A Web-Based Decision Support Tool for Air Quality Assessment. Appl. Sci. 2025, 15, 2045. [Google Scholar] [CrossRef]
  43. Haklay, M.; Weber, P. Open Street Map: User-Generated Street Maps. IEEE Pervasive Comput. 2008, 7, 12–18. [Google Scholar] [CrossRef]
  44. Wendlik, V.; Karut, I.; Behr, F. Tiling concepts and tile indexing in Internet mapping APIs. In Geoinformation for a Better World: Applied Geoinformatics for Society and Environment; Behr, F., Ngigi, M., Pradeepkumar, A.P., Zimmermann, M., Eds.; AGSE: Nairobi, Kenya, 2011; pp. 116–121. [Google Scholar]
  45. Pérez, K.; Palència, L.; López, M.J.; León-Gómez, B.B.; Puig-Ribera, A.; Gómez-Gutiérrez, A.; Nieuwenhuijsen, M.; Carrasco-Turigas, G.; Borrell, C. Environmental and Health Effects of the Barcelona Superblocks. BMC Public Health 2025, 25, 634. [Google Scholar] [CrossRef]
  46. Sannino, A.; De Martino, A.; De Gennaro, G.; Di Gennaro, S.; De Santis, F.; Di Leo, E.; Di Carlo, P.; De Gennaro, M.; Di Gennaro, F.; De Gennaro, S.; et al. Air Quality Improvement Following the COVID-19 Pandemic Lockdown in Naples, Italy: A Comparative Analysis (2018–2022). Environments 2024, 11, 167. [Google Scholar] [CrossRef]
  47. Fioravanti, G.; Sannino, A.; De Martino, A.; De Gennaro, G.; Di Gennaro, S.; De Santis, F.; Di Leo, E.; Di Carlo, P.; De Gennaro, M.; Di Gennaro, F.; et al. Long-Term Variation in Exposure to NO2 Concentrations in Naples, Italy. Environ. Sci. Technol. 2024, 58, 12345–12354. [Google Scholar]
  48. Air Quality in Nice. 2023. Available online: https://www.investincotedazur.com/en/air-quality-in-nice-significant-reduction-in-fine-particle-pollution/ (accessed on 20 October 2025).
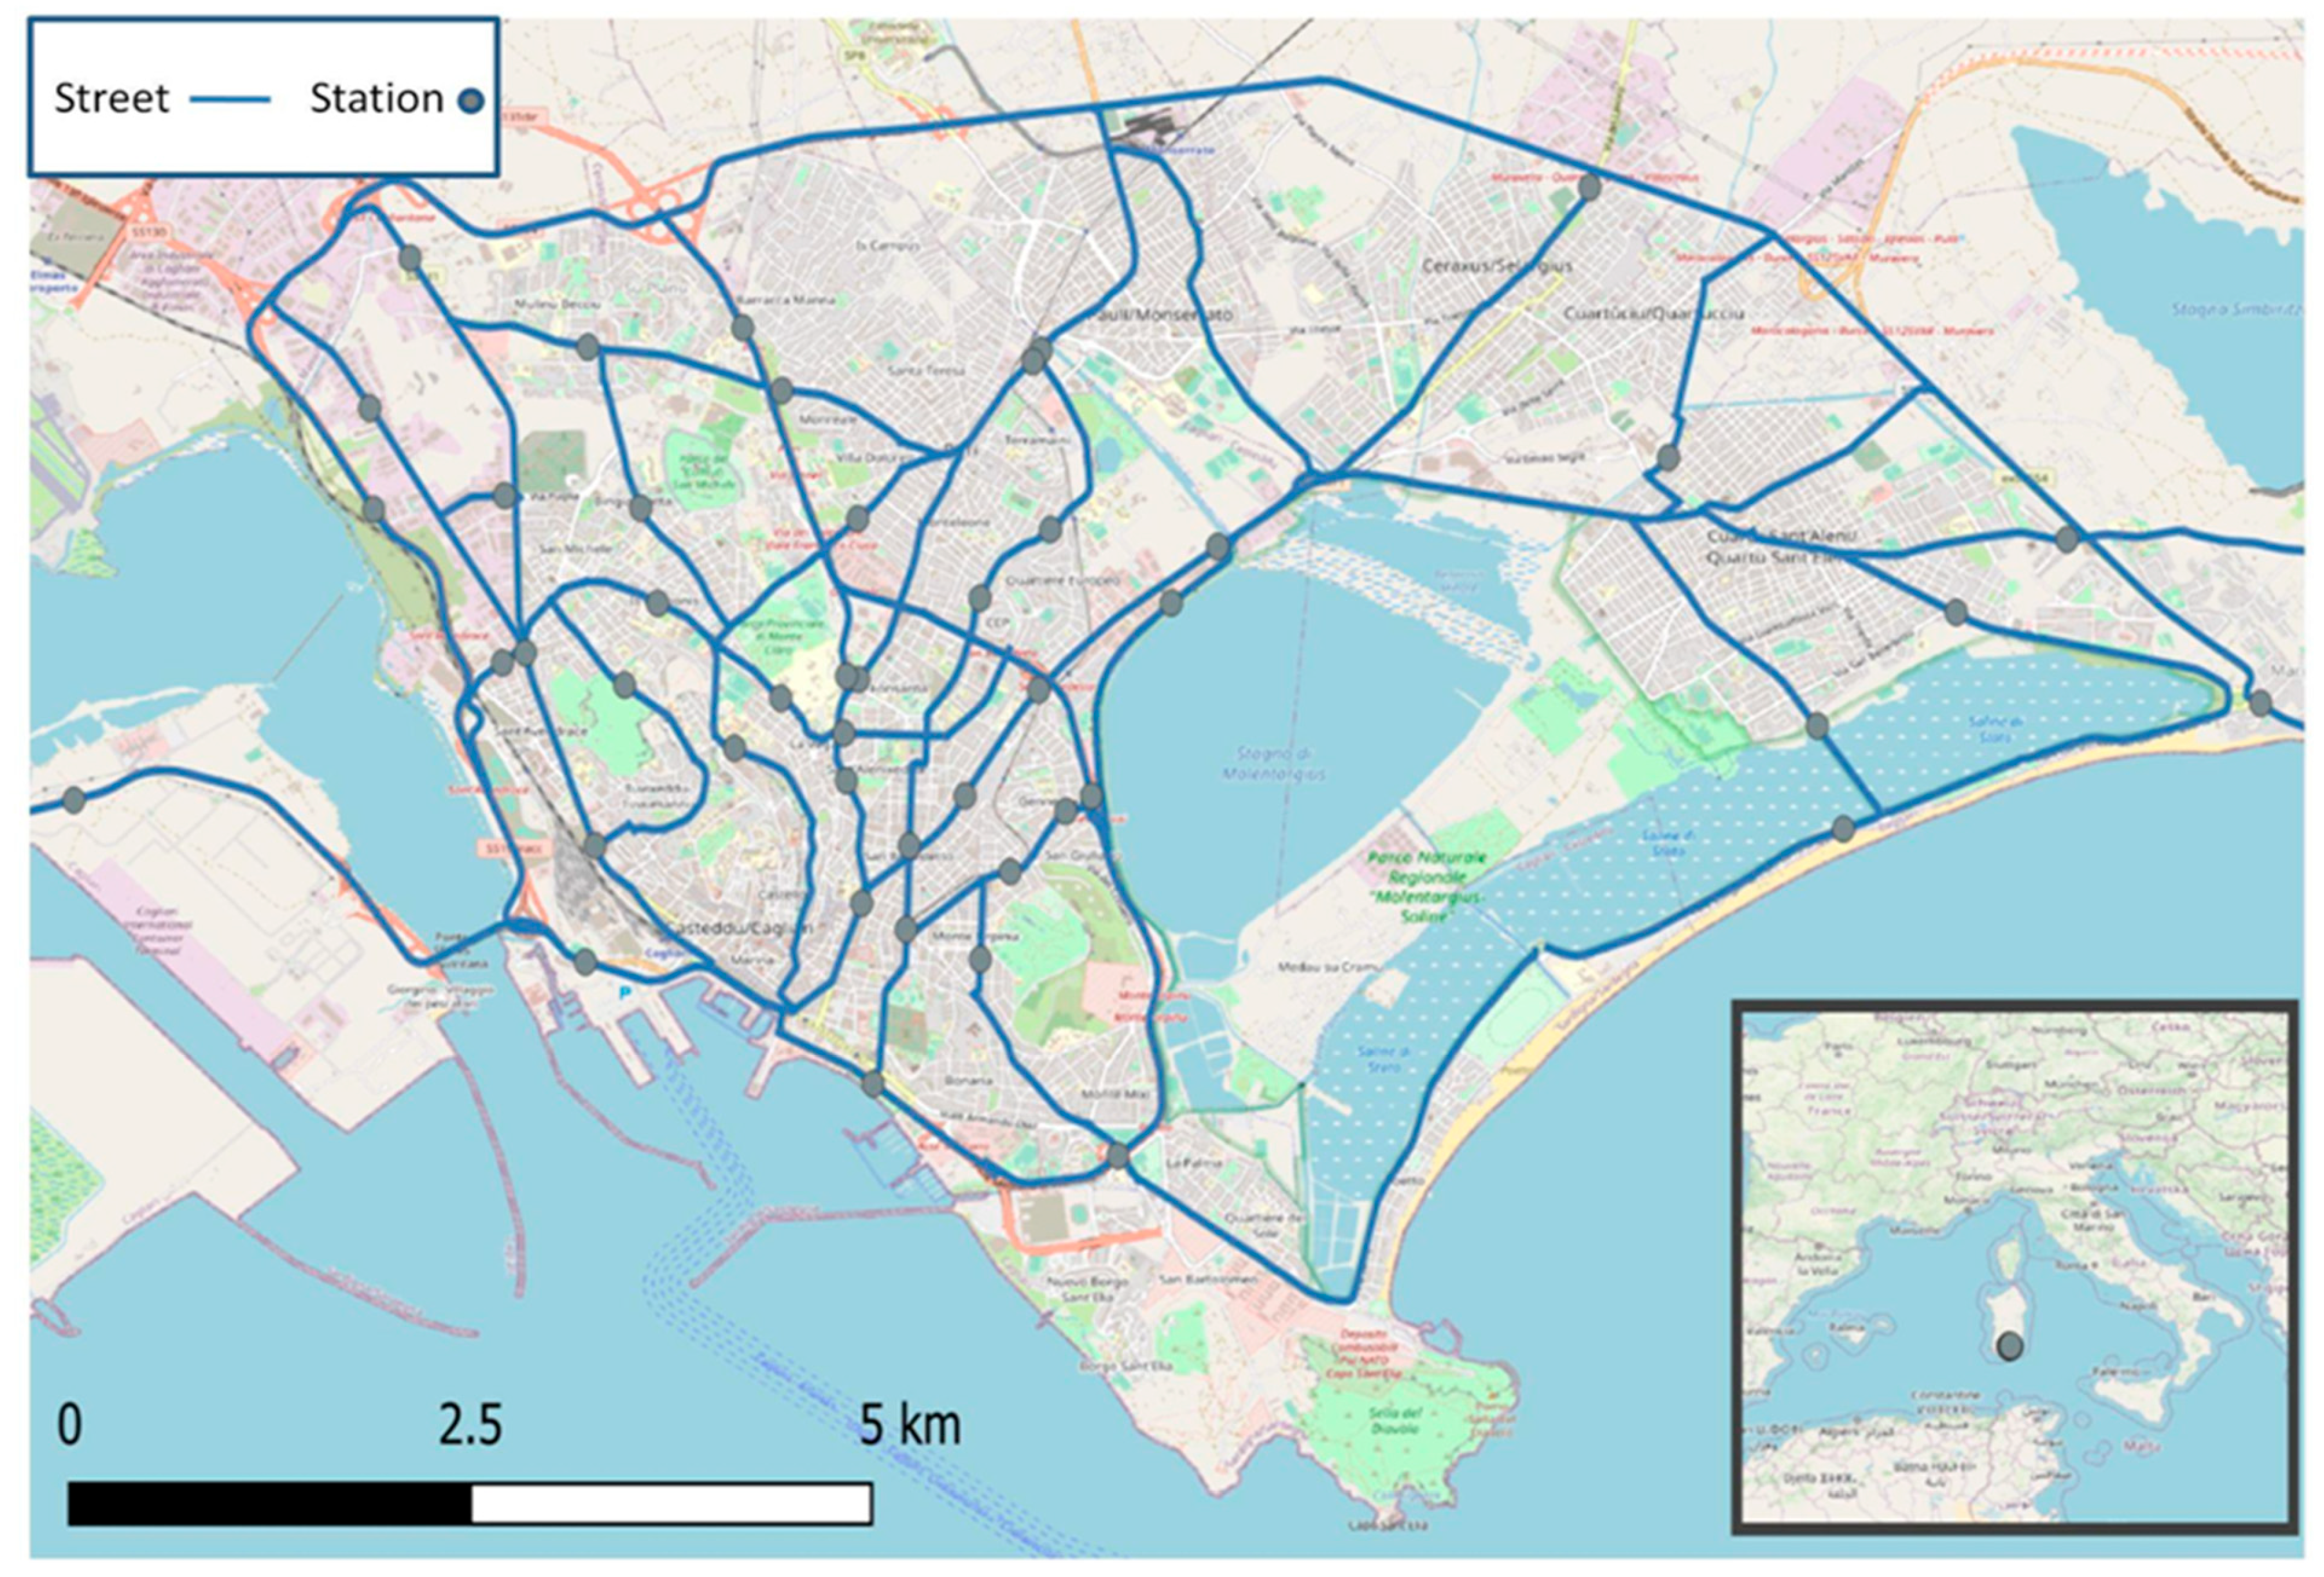
Figure 1. Map of the study area, Cagliari (Sardinia, Italy), displaying major roads (blue lines) and traffic monitoring stations (dots).
Gases 05 00025 g001
Figure 2. Hourly traffic flow patterns on three main roads in Cagliari (Asse Mediano—IDs 42 and 48, and Via Scano—ID 22) during working days (top panel) and holidays (bottom panel) in the winter season of 2019 (from December to February).
Gases 05 00025 g002
Figure 3. Traffic analysis along Poetto Road (1:00-2:00 p.m.). The figure presents vehicle count data collected along Poetto Road during a representative afternoon time slot. Panel (A) and (B) show the frequency distributions of long and short vehicles, respectively. Panel (C) illustrates the strong linear relationship between the two categories (R2 = 0.949), while Panel (D) displays the non-exceedance probability curves, indicating higher variability and overall volumes for short vehicles.
Gases 05 00025 g003
Figure 4. Temporal variation of NO2 (top), PM10 (center), and CO (bottom) concentrations at two monitoring stations in Cagliari. The plots highlight a marked decrease in NO2 and CO levels during the lockdown period (orange shading), while PM10 shows higher variability and less pronounced reductions.
Gases 05 00025 g004
Figure 5. Comparison of measured (black lines) and modeled (blue dot dashed lines) NO2 concentrations (µg/m3) over 24 h for each 2019 season. The model accurately reproduces diurnal patterns with two daily peaks and seasonal variability—higher in winter, lower in spring and summer.
Gases 05 00025 g005
Figure 6. Structure of the Decision Support System (DSS), composed of five interconnected components: Data Sources, Harmonization Engine, Execution Core, Simulations Repository, and Visualization Portal. Together, they form a complete data processing and communication pipeline.
Gases 05 00025 g006
Figure 7. NO2 heatmap for February 2021: Panel (A) shows the proposed Scenario 1—Viale Colombo deactivation—with traffic rerouted, while Panel (B) depicts the situation under current traffic conditions (Baseline Scenario). The highlighted area (blue boxes) indicate the waterfront section most affected by the changes.
Gases 05 00025 g007
Figure 8. Monthly average hourly NO2 concentrations at Viale Colombo (February 2021) under pedestrianization (blue line) Scenario 1—Viale Colombo deactivation, and the Base line—actual traffic (black line) scenarios.
Gases 05 00025 g008
Figure 9. Simulated NO2 concentrations for February 2021 under the baseline (Panel B) and Via Roma deactivation (Panel A) scenarios. Concentrations range from green (low values) to red (above 40 µg/m3). The highlighted area (blue boxes) indicate the waterfront section most affected by the changes.
Gases 05 00025 g009
Figure 10. Comparison of monthly average hourly NO2 concentrations (February 2021) at a receptor located in the middle of Via Roma in Cagliari under two traffic scenarios. The blue line shows the simulated concentrations when Via Roma traffic is diverted into the planned tunnel, while the black line represents the current situation with Via Roma functioning as a major traffic artery.
Gases 05 00025 g010
Table 1. EU Air Quality Directive: Current vs. 2030 Revision. In the table, the annual average is reported.
Current LimitNew LimitChange
PM2.525 µg/m310 µg/m360%
PM1040 µg/m320 µg/m350%
NO240 µg/m320 µg/m350%
CO10 mg/m35 mg/m350%
Table 2. Summary of Key Traffic and Emissions Data for Cagliari (2017).
ParameterValueSource Notes
Registered vehicles131,742MIT [37]
Circulating insured vehicles90,881MIT [37]
Average CO2 emission/km130.3 g/kmWeighted average based on fleet composition
Public buses (articulated)13CTM S.p.A. fleet
Trolley buses32CTM S.p.A. fleet
Main industrial areas (hectares)9244CASIC
Annual passengers (Mameli Airport)2.7 million (2021)SOGAER
Cargo throughput (Port of Cagliari)~50 million tons annuallyPort Authority
Table 3. The calibration period for the NO2 covers March and April 2019 while validation period is Spring, Summer, Autumn, and Winter. MSE, MSEP, and R2 have deeply improved in the calibration process. Together MSE, MSEP and R2 give a fuller picture of model performance: Ideally, a model with low MSEP and MSE, and high R2 has accurate predictions and a good fit.
MSEPMSER2
First Run—Summer3.2344.470.71
Best Run—Summer1.4221.50.72
First Run—Autumn3.1579.490.70
Best Run—Autumn1.7162.530.73
First Run—Winter4.49135.330.71
Best Run—Winter1.2536.030.72
First Run—Spring3.3266.040.71
Best Run—Spring1.0927.640.74
Disclaimer/Publisher’s Note: The statements, opinions and data contained in all publications are solely those of the individual author(s) and contributor(s) and not of MDPI and/or the editor(s). MDPI and/or the editor(s) disclaim responsibility for any injury to people or property resulting from any ideas, methods, instructions or products referred to in the content.