Article

Prototyping and Evaluation of 1D Cylindrical and MEMS-Based Helmholtz Acoustic Resonators for Ultra-Sensitive CO2 Gas Sensing

1
Hahn-Schickard-Gesellschaft, 78052 Villingen-Schwenningen, Germany
2
Georg H. Endress Chair for Smart Systems Integration, Institut für Mikrosystemtechnik (IMTEK), The University of Freiburg, 79108 Freiburg, Germany
*
Author to whom correspondence should be addressed.
These authors contributed equally to this work.
Gases 2025, 5(3), 21; https://doi.org/10.3390/gases5030021
Submission received: 3 June 2025 / Revised: 31 August 2025 / Accepted: 4 September 2025 / Published: 9 September 2025
(This article belongs to the Section Gas Sensors)

Abstract

This work presents a proof of concept including simulation and experimental validations of acoustic gas sensor prototypes for trace CO2 detection up to 1 ppm. For the detection of lower gas concentrations especially, the dependency of acoustic resonances on the molecular weights and, consequently, the speed of sound of the gas mixture, is exploited. We explored two resonator types: a cylindrical acoustic resonator and a Helmholtz resonator intrinsic to the MEMS microphone’s geometry. Both systems utilized mass flow controllers (MFCs) for precise gas mixing and were also modeled in COMSOL Multiphysics 6.2 to simulate resonance shifts based on thermodynamic properties of binary gas mixtures, in this case, N2-CO2. We performed experimental tracking using Zurich Instruments MFIA, with high-resolution frequency shifts observed in µHz and mHz ranges in both setups. A compact and geometry-independent nature of MEMS-based Helmholtz tracking showed clear potential for scalable sensor designs. Multiple experimental trials confirmed the reproducibility and stability of both configurations, thus providing a robust basis for statistical validation and system reliability assessment. The good simulation experiment agreement, especially in frequency shift trends and gas density, supports the method’s viability for scalable environmental and industrial gas sensing applications. This resonance tracking system offers high sensitivity and flexibility, allowing selective detection of low CO2 concentrations down to 1 ppm. By further exploiting both external and intrinsic acoustic resonances, the system enables highly sensitive, multi-modal sensing with minimal hardware modifications. At microscopic scales, gas detection is influenced by ambient factors like temperature and humidity, which are monitored here in a laboratory setting via NDIR sensors. A key challenge is that different gas mixtures with similar sound speeds can cause indistinguishable frequency shifts. To address this, machine learning-based multivariate gas analysis can be employed. This would, in addition to the acoustic properties of the gases as one of the variables, also consider other gas-specific variables such as absorption, molecular properties, and spectroscopic signatures, reducing cross-sensitivity and improving selectivity. This multivariate sensing approach holds potential for future application and validation with more critical gas species.

1. Introduction

The ability to accurately sense trace gas concentrations of gases such as CO2, CH4, CO, NO2, and SO2 among other gases is crucial for various applications including environmental monitoring, industrial process control, agricultural processes, and medical diagnostics—for example, ammonia, which is widely used in refrigeration and agriculture, and carbon monoxide, widely found in many industrial processes, medicine, safety, and robotics [1,2]. Historically, large, high-precision, and sophisticated systems, including mass spectrometers and gas chromatographs, have been used for gas sensing. The gas sensing technologies used currently include various methods such as change in electrical resistance, current generation, radiation adsorption, photoacoustics, and MEMS techniques. However, some disadvantages of them include poor selectivity, baseline drift, high power consumption, environmental concerns, etc. [3]. These gas-detecting techniques can be classified into two categories: sensors that detect specific gas species and those that observe broader changes in ambient atmospheric composition [4]. A widely used adsorption-based sensing technique relies on the affinity between the sensing element and the target gas species, for example, surface acoustic waves and calorimetry. Although this approach can offer high accuracy because of the engineered chemical selectivity, it often limits the response to specific chemical species. In contrast, sensing techniques that measure the physical properties of gases, such as acoustics or photoacoustics, offer the potential for a broader applicability in various gas species [5,6]. The choice of gas detection techniques is highly dependent on the intended application, as Capone [4] emphasized. Although these systems offer excellent accuracy, their size, complexity, and cost limit their utility in real time or field applications. In contrast, recent advances in MEMS have enabled the development of compact, low-cost, and real-time gas sensors. Table 1 provides a comparative overview of various gas sensing techniques, detailing their working principles, sensitivity levels, and resolution capabilities [4].
Among various detection strategies, resonance frequency-based sensing has emerged as a particularly promising approach since this method focuses on shifts in resonant frequency from the reference point as a function of changes in physical properties resulting from gas interaction. Sensors that operate with frequency output offer the following several distinct advantages:
  • High Accuracy and Long-Term Stability: [7] Frequency-based outputs are less affected by drift and electronic noise compared with analog voltage or current signals, resulting in more reliable performance.
  • Exceptional Sensitivity: [8] Resonant sensors can detect very small variations in mass or force, allowing the precise detection of trace gases.
  • Lower System Complexity and Cost: [9] We can often process frequency outputs without complex analog-to-digital converters.
  • Robust Thermal Stability: [10] Compared with piezoresistive sensors, resonant sensors exhibit reduced susceptibility to temperature fluctuations, ensuring more consistent readings under varying environmental conditions.
By focusing on frequency-tracking techniques in MEMS gas sensors combined with amplitude monitoring, researchers can develop gas detection systems that are highly sensitive, compact, robust, and suitable for integration into portable or embedded platforms. This approach is especially advantageous in scenarios that require rapid detection or operation in complex gas mixtures or where traditional sensing technologies reach their limits. This paper focuses on MEMS-based acoustic sensors that are highly sensitive to variations in gas composition, making them effective sensors, as their resonance is influenced by gas properties such as density and the speed of sound. Some disadvantages of acoustic sensing also include increased susceptibility to background noise and distortions, poor Q factor, and sensitivity in a higher spectrum of audible range [11]. We examine and simulate the design of these cylindrical acoustic resonators as detectors using COMSOL Multiphysics. This research has concentrated on CO2 analysis, as it is crucial for environmental monitoring to detect its low quantities. The molecular weight and velocity of any gas mixture are the primary determinants of resonance analysis. We can use the same methodology to determine the resonances of other gas mixtures if the speed of sound of that mixture in air is known. This paper’s research combines geometric and Helmholtz frequency monitoring with MEMS-based detectors. It offers a comprehensive investigation of this sensing technology by presenting a complete presentation of mathematical concepts, simulation techniques, and experimental validation. An important goal of this paper is thus to provide a proof of concept for using acoustics in gas sensing, not as a final sensor, but as an important building block to design multi-gas and multi-variable detection systems, and to pave the way to exploit the frequency dependency of acoustic resonators and put the theory to experiment for researchers to develop detection systems that are highly sensitive, compact, robust, and suitable for integration into portable or embedded platforms.

2. Theory

2.1. Acoustic Resonance

Sound waves, which are capable of propagating through virtually all solid structures, make acoustics a multifaceted field of study [12]. The molecular activity within the medium significantly influences the behavior of acoustic waves, specifically the number of internal molecules and their vibrations around their equilibrium positions, which are dictated by the speed of sound (c) in the medium. The following Equation (1) describes the speed of sound in a gas mixture [6,13]:
c = γ R T M m
where γ denotes the specific heat ratio, R represents the universal gas constant [8.314 m3 Pa mol−1 K−1], T stands for temperature [293 K], and M m is the molar mass of the gas mixture (kg/mol). For a non-ideal gas mixture, the speed of sound can also be directly determined using the following Equation (2) [6]:
c = β ρ
where β is the bulk modulus of elasticity and ρ is the gas density. Within a confined space, the molecules exhibit high kinetic energy, which manifests itself as increased sound pressure levels at resonance frequency, defined by (3) [14] as follows:
f r e s = n c L
where f r e s is the resonant frequency in Hz, n is the resonance mode, c is the speed of sound in m/s, and L is the length of the resonator in m. This relationship underscores the proportional relationship between the acoustic resonance and the speed of sound, forming the theoretical foundation of this gas-sensing technique [6].
The amplitude of the acoustic resonance is expressed as
S P L = ρ c v
where S P L represents the sound pressure level in Pa, c is the speed of sound in m/s, and v is the molecular velocity within the acoustic wave [6]. According to this relationship, the amplitude of the wave at resonance is proportional to ρ , increasing as the gas mixture becomes denser.

2.2. Acoustic Resonance in a 1-D Cylindrical Resonator

Acoustic waves traversing an open medium generally display modest amplitudes. However, when the gas sample is confined within a compact, enclosed geometry with rigid boundaries, the amplitude of these waves can be significantly enhanced. Acoustic resonators, which are well-defined closed geometric structures, serve to augment the amplitude of acoustic waves. These devices can produce not only longitudinal modes, but also azimuthal and radial modes, as detailed in [15]. Longitudinal modes, which involve pressure variations along the length of the resonator cavity, differ fundamentally from azimuthal and radial modes, which exhibit pressure nodes and antinodes distributed in the circumferential and radial directions, respectively. To selectively excite longitudinal modes, the resonator must typically possess either an open–open or closed–closed boundary condition to support strong wave reflections along its axis (see Figure 1). In this system, the length of the cylindrical cavity is the primary variable, while the radius remains fixed, naturally favoring the excitation of longitudinal modes whose resonances are strongly dependent on cavity length. Radial and azimuthal modes, on the contrary, are not effectively excited because their resonant frequencies are mainly governed by the radius and angular structure of the cavity, which remain unchanged, and because their mode shapes require off-axis or asymmetric excitation, neither of which is present here. Furthermore, radial and azimuthal modes generally carry significantly lower acoustic energy under these conditions. Careful alignment of the acoustic source and detector along the central axis of the cylinder ensures that energy is funneled almost exclusively into longitudinal modes, reinforcing their dominance in the observed resonance behavior.
  • The resonance frequency for a 1-dimensional acoustic resonator for an open–open/closed–closed system and open–closed system [15] is as follows:
    f n = n c 2 ( L + δ L ) a n d f 2 m 1 = ( 2 m 1 ) c 4 ( L + δ L )
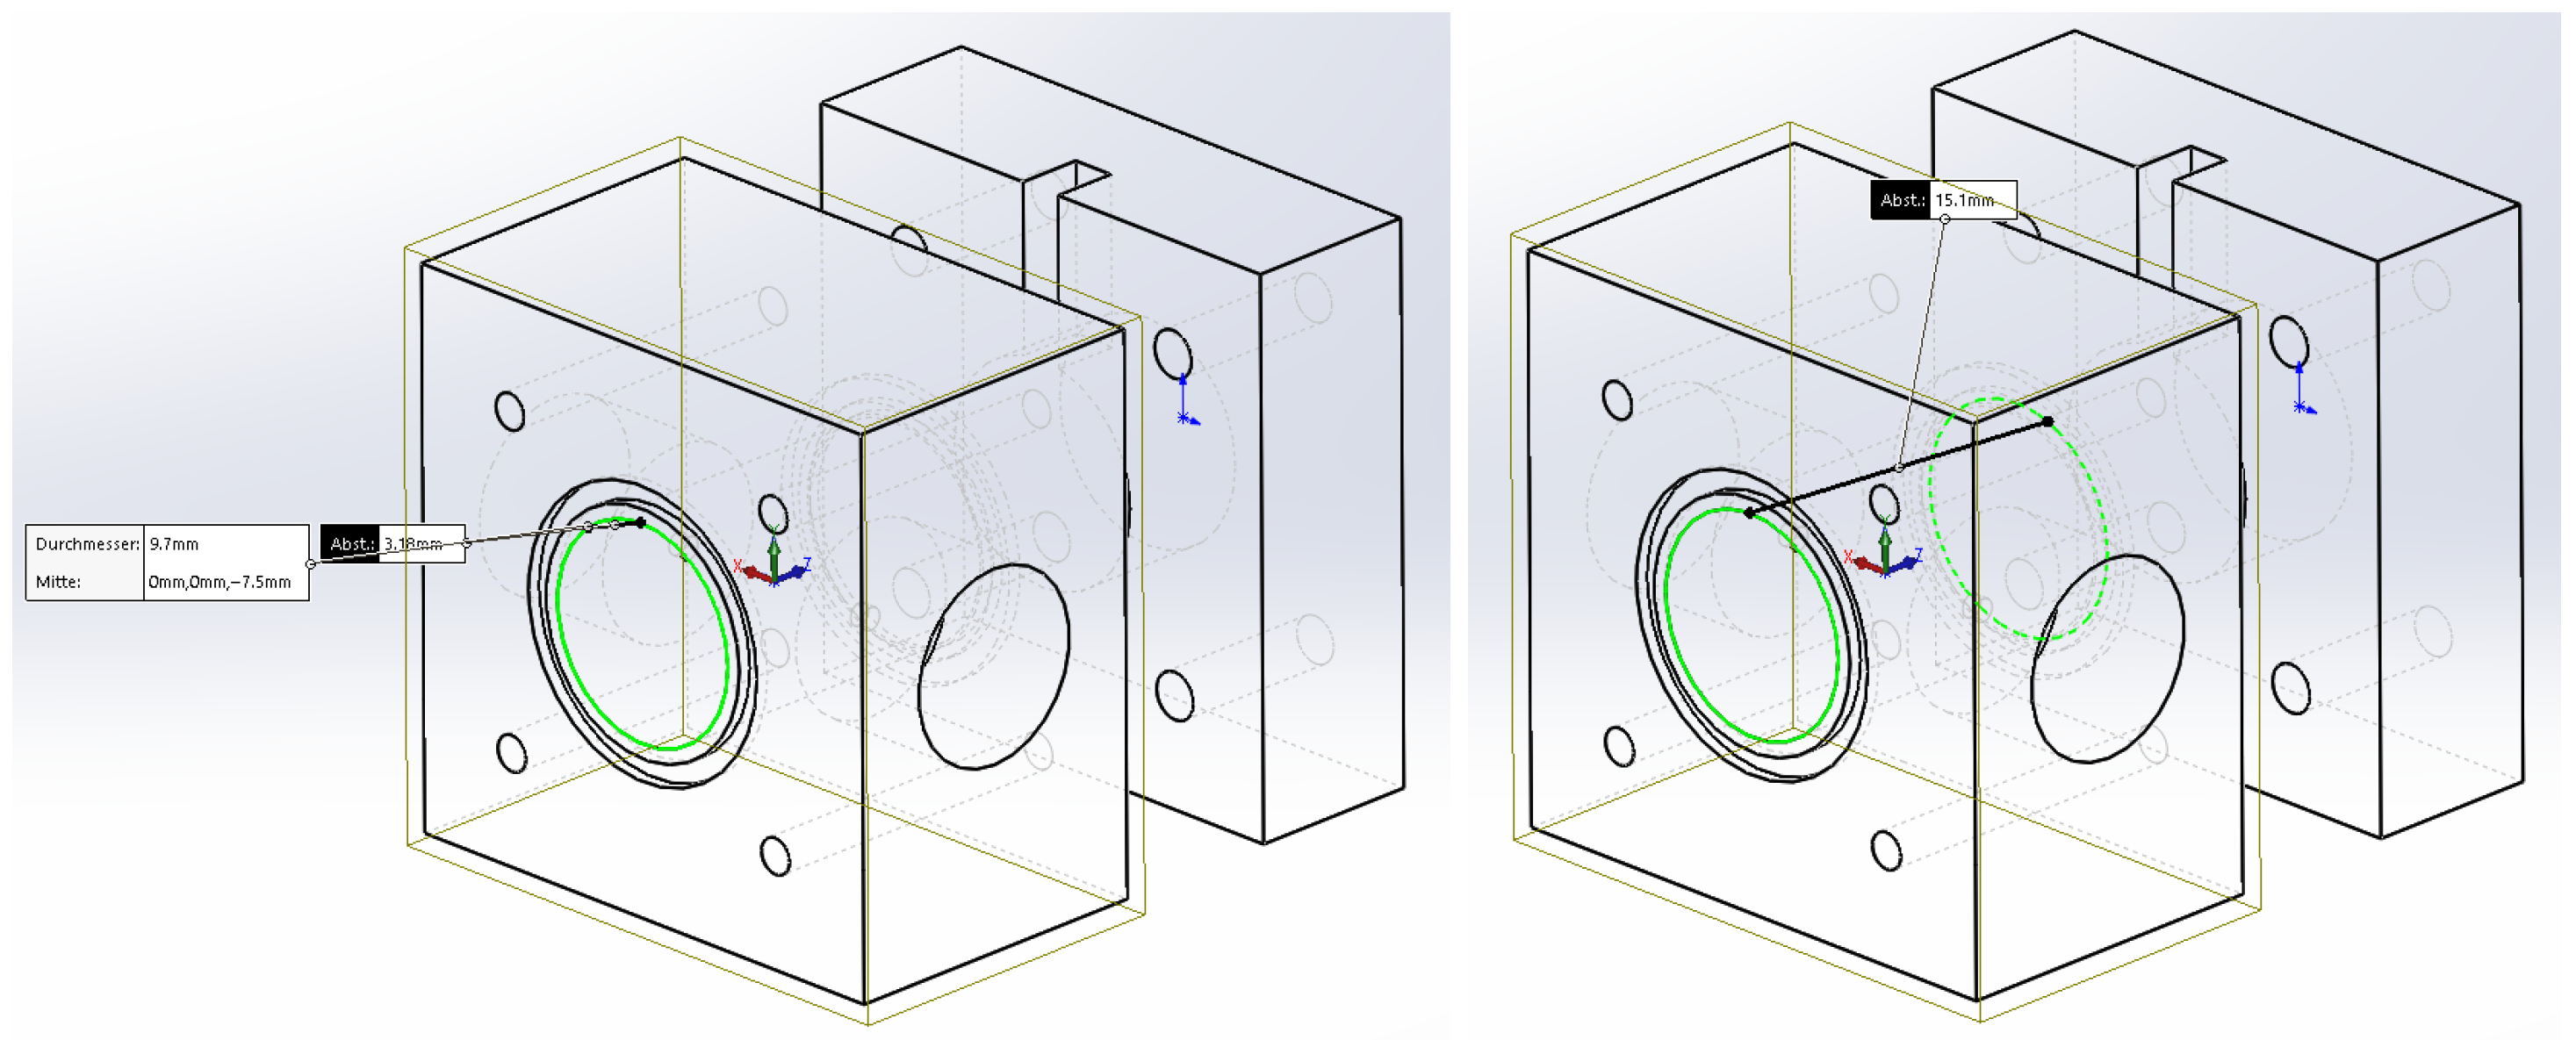
    where f n and f 2 m 1 denote the resonance frequencies, c represents the speed of sound within the medium, L is the total length of the resonator, and δ L is the end correction factor, which is conventionally zero for closed ends [6]. This end-correction factor accounts for the effective acoustic length, which may extend marginally beyond the physical dimensions of the resonator, particularly in configurations where two cavities are present, and the radius of the secondary cavity substantially exceeds that of the primary cylinder. Resonance in open–open or closed–closed pipes occurs at frequencies that are integer multiples of half the wavelength Equation (5) (left), in contrast with open–closed systems, which resonate at odd integer multiples, as indicated in Equation (5) (right). The experimental setup can be characterized as a one-dimensional acoustic resonator, given that the acoustic wavelength, calculated as c / f 0.0085 m, exceeds the resonator length of 0.015 m (see Figure 2), and is a closed–closed system with the cylinder completely sealed, thus containing the acoustic waves. Within a closed–closed cylindrical resonator, standing waves establish at distinct frequencies, with pressure antinodes forming at both sealed ends. The fundamental frequency is characterized by half a wavelength fitting within the tube, with higher harmonics manifesting at integer multiples of this base frequency. This configuration promotes the amplification of acoustic signals at these resonant modes, thereby enhancing both the sensitivity and the signal-to-noise ratio critical for acoustic gas-sensing applications.

2.3. Resonance Frequency Shift with Gas Concentration

As mentioned previously in Equation (1), the speed of sound in an ideal gas can be adapted for a mixture of ideal gases by assuming that the specific heat ratio ( γ ) of the mixture is calculated as a mole-weighted average of the specific heat ratios of its constituent gases, as shown in Equation (6) [6].
γ = i = 1 n x i C p i i = 1 n x i C v i
The molecular weight of the gas mixture (M) is determined using the weighted average mole fraction of the molecular weights of its components, as expressed in Equation (7). This approach, based on Dalton’s law of partial pressures and the ideal gas law, provides an accurate representation of the mixture’s overall molecular weight, which is important for subsequent calculations of acoustic properties.
M = i = 1 n x i M i
By substituting the specific heat at constant volume ( C v i ) as C v i = C p i R 0 and then substituting Equations (6) and (7) into Equation (1), we derive the final Equation for the speed of sound in a gas mixture, as given in Equation (8).
c 0 2 = R 0 T i = 1 n x i C p i i = 1 n x i M i i = 1 n x i ( C p i R 0 )
In this equation, R 0 is the universal gas constant, T is the absolute temperature, x i is the mole fraction of the i-th component, M i is the molecular weight, and C p i is the heat capacity at constant pressure. Although densities are not explicitly included in this formula, they vary with changes in mole fractions and molar masses. Consequently, as the gas concentration changes, the molar mass and density change, which affect the speed of sound and, in turn, the resonance frequency [6].
M o l a r m a s s D e n s i t y R e s o n a n c e f r e q u e n c y 1 / ( S p e e d o f s o u n d )

2.4. Microphone Helmholtz Resonance

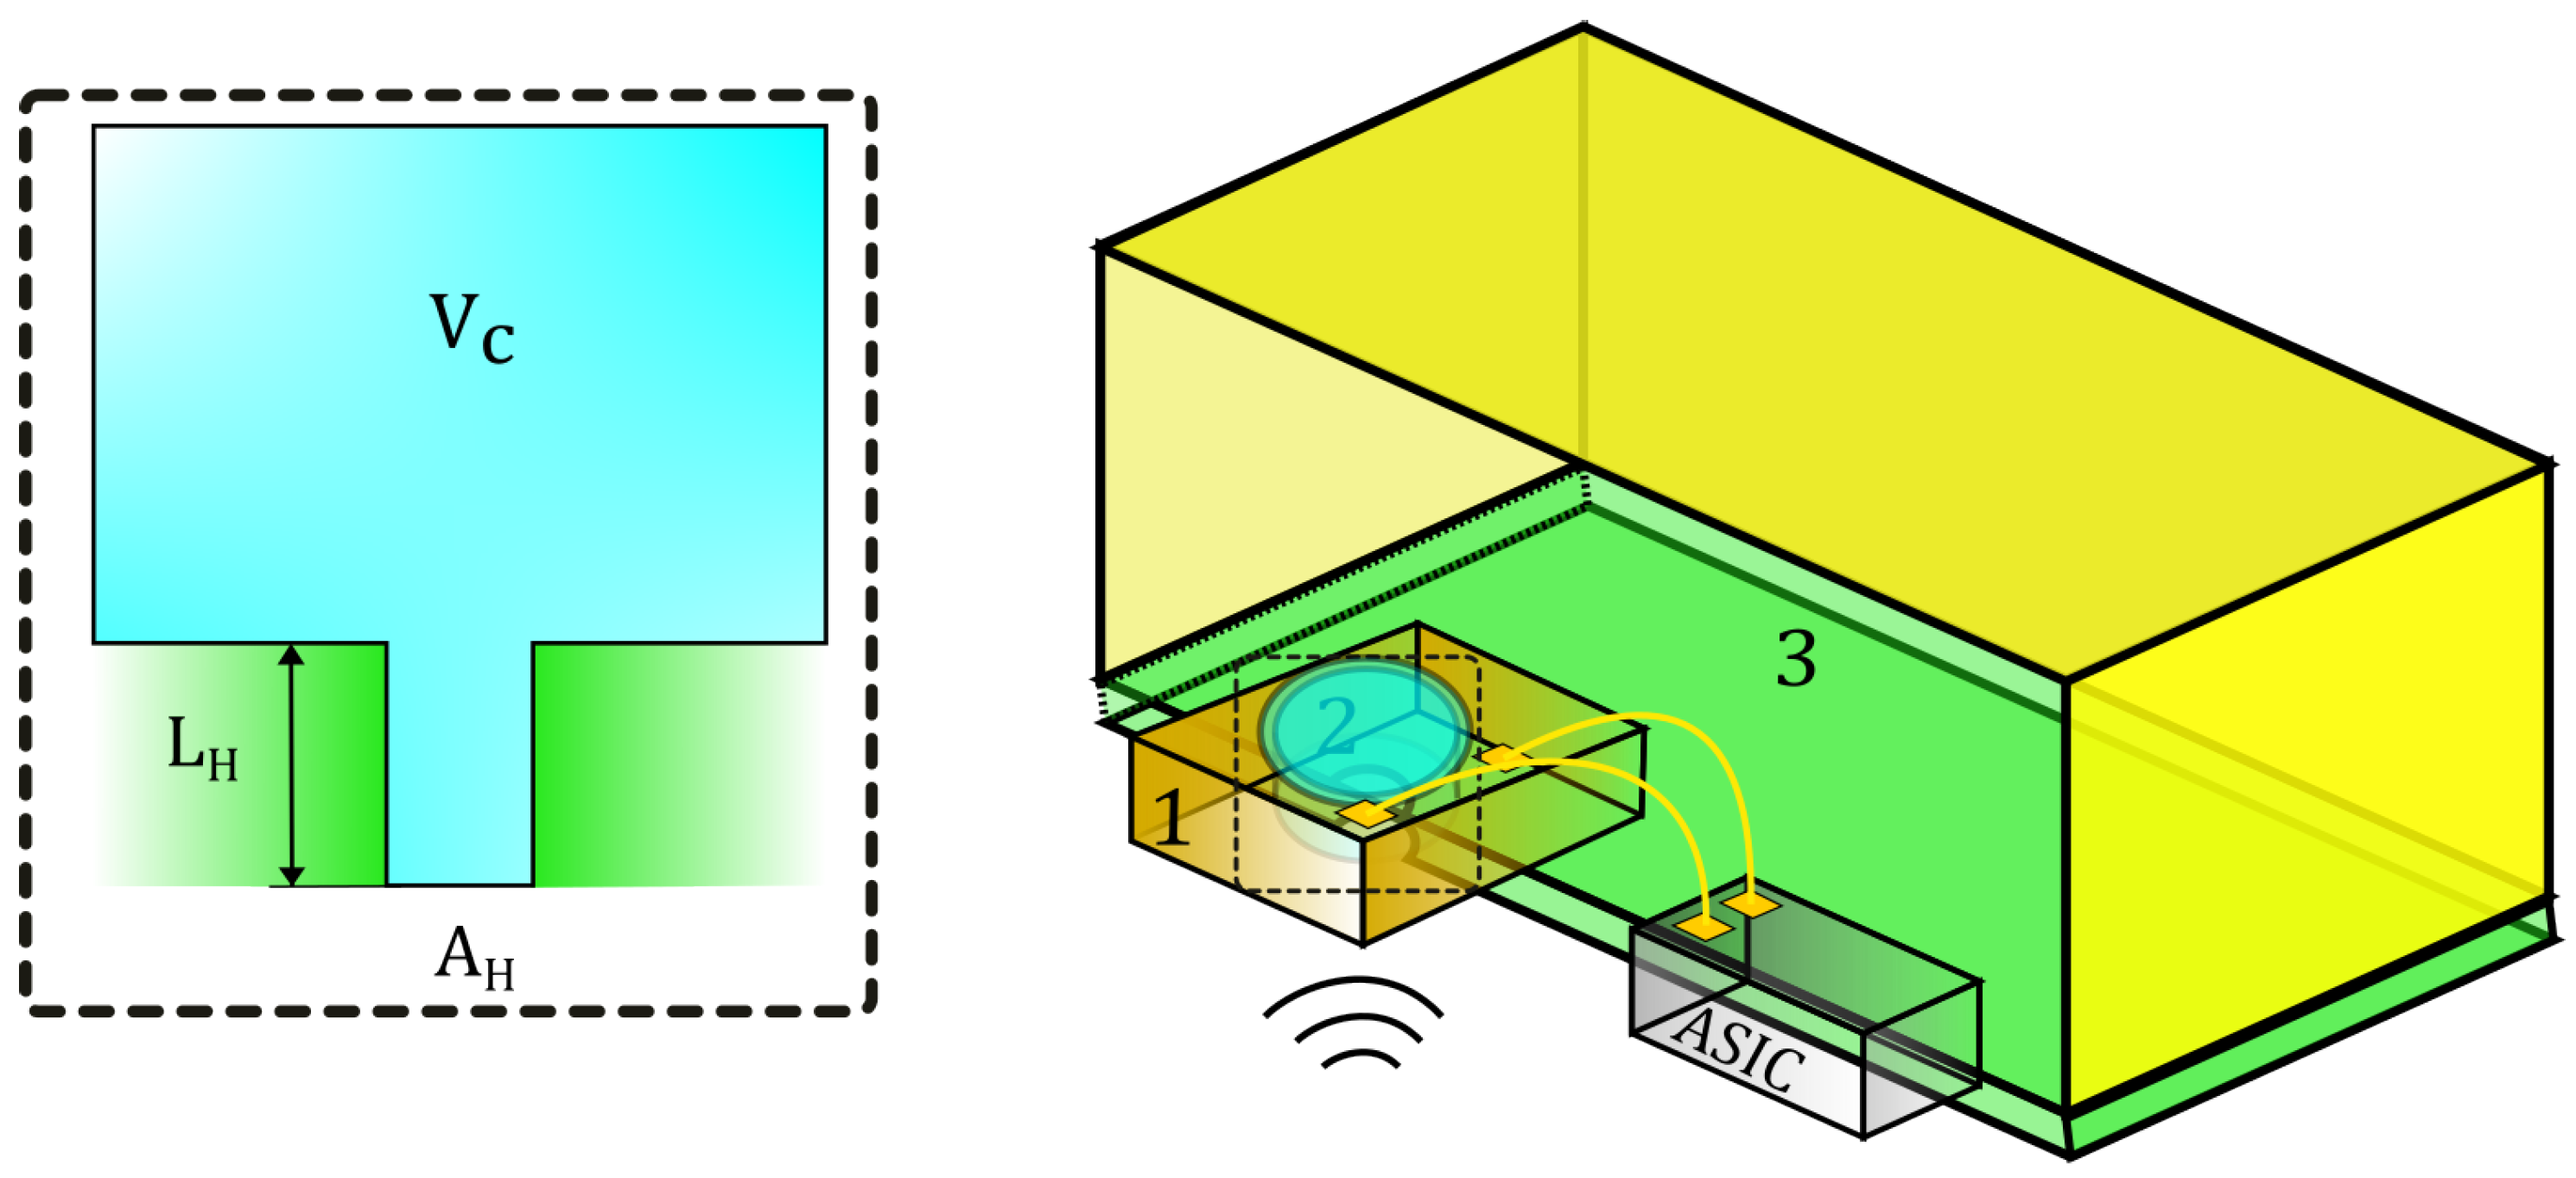
MEMS microphones are widely adopted in consumer products due to their exceptional performance characteristics and compact form factor. These devices typically require an acoustic pathway to facilitate sound transmission from the external environment to the microphone element. This pathway, which comprises various components such as the product housing, the acoustic gasket, the printed circuit board (PCB), and the microphone itself, functions as a waveguide that modulates the frequency response of the system, as seen in Figure 3. The material properties of these components play an important role in determining the overall performance and frequency response characteristics of the microphone system.
A Helmholtz resonator is a fundamental acoustic element consisting of a hollow cavity with a narrow sound inlet. When excited, this structure resonates acoustically, producing a phenomenon analogous to the sound generated when air is blown across the opening of an empty bottle. Its resonance frequency is given by (10) [16], as follows:
F H = c 2 π A H V C L H
where c is the speed of sound in air, A H is the cross-sectional area of the sound inlet, L H is the length of the inlet, and V C is the volume of the cavity. Figure 3 also shows a model that illustrates how the geometry of a MEMS microphone similarly forms a Helmholtz resonator, defined by the small front inlet port and the enclosed large back cavity.
The MEMS microphone is enclosed in a designed package that creates a front chamber (1) and a back chamber (3) along with a very thin membrane above the sound inlet (2), which together determine the microphone’s frequency response behavior. The thickness of the substrate is optimized to balance robustness with minimal impact on Helmholtz resonance frequency [17]. This Helmholtz resonance can be monitored similarly to geometric resonance, as discussed in previous chapters. This method provides a gas-sensing approach that is independent of the geometry of the external resonator and is based solely on the MEMS microphone package and the speed of sound (c). A similar laser-based photoacoustic gas sensing approach was also developed for low ppm methane detection, using a 2970 nm, 8.5 mW interband cascade laser focused through the sound port of a TDK ICS-40730 MEMS microphone. Unlike traditional gas sensors that rely on dedicated acoustic resonators, this method uses the MEMS microphone itself as a photoacoustic cell, resonator, and sound transducer in one compact unit [18].

2.5. Frequency Tracking Using Lock-In and Phase-Locked Loop

In reference to Equations (5) and (10), as the speed of sound (c) changes, a shift in resonance is expected. However, in gas mixtures, especially those with small concentration changes, the variation in the speed of sound is less pronounced. For example, a 100 ppm change in gas concentration leads to a negligible change in the speed of sound compared with 10,000 ppm or 1%. Consequently, the corresponding frequency shift is also minimal (in μHz/mHz). Therefore, to detect these subtle changes, precise frequency tracking becomes very important. This requirement for accurate frequency tracking is a key focus of this paper. To achieve this critical frequency tracking, we utilize lock-in amplifier and phase-locked loop (PLL) functionalities of the Zurich Instruments MFIA that facilitate the advanced features like high-precision measurements necessary to detect minute changes in gas composition through shifts in resonance frequency. The locked-in frequency and phase of the resonator serve as the input signal to the PLL module, and any change in these parameters as a result of physical changes is actively tracked in a closed-loop configuration, as shown in Figure 4.
We controlled gas concentrations for all experiments using the Sensirion SFC 5500-2slm Mass Flow Controller (MFC), which has a full-scale flow accuracy of 0.1%. Because the control software only permitted control of the flow rates and no direct manipulation of the gas concentrations, they were calculated on the basis of the controlled flow rates using the dilution theory [19], which can be observed in Equation (11). In short,
Concentration in Flowrate in = Concentration out Flowrate out
This change in gas concentration alters the properties of the gas mixtures (ref Equations (5) and (8)), leading to a shift in the acoustic resonance frequency, which is then detected as a phase shift. The MFIA PID controller then acts to compensate for this phase shift, generating equivalent control signals to stabilize the phase. We pass these signals to the Voltage-Controlled Oscillator (VCO), which adjusts its frequency accordingly. The frequency adjustment made by the VCO reflects the actual shift in resonance resulting from the change in gas concentration, thus allowing for precise tracking of the acoustic behavior under varying gas conditions. Thus, with the help of frequency tracking using the MFIA, any deviation from the reference phase indicates a shift in the resonance frequency, which implies a change in the gas concentration within the acoustic chamber.

3. Simulations

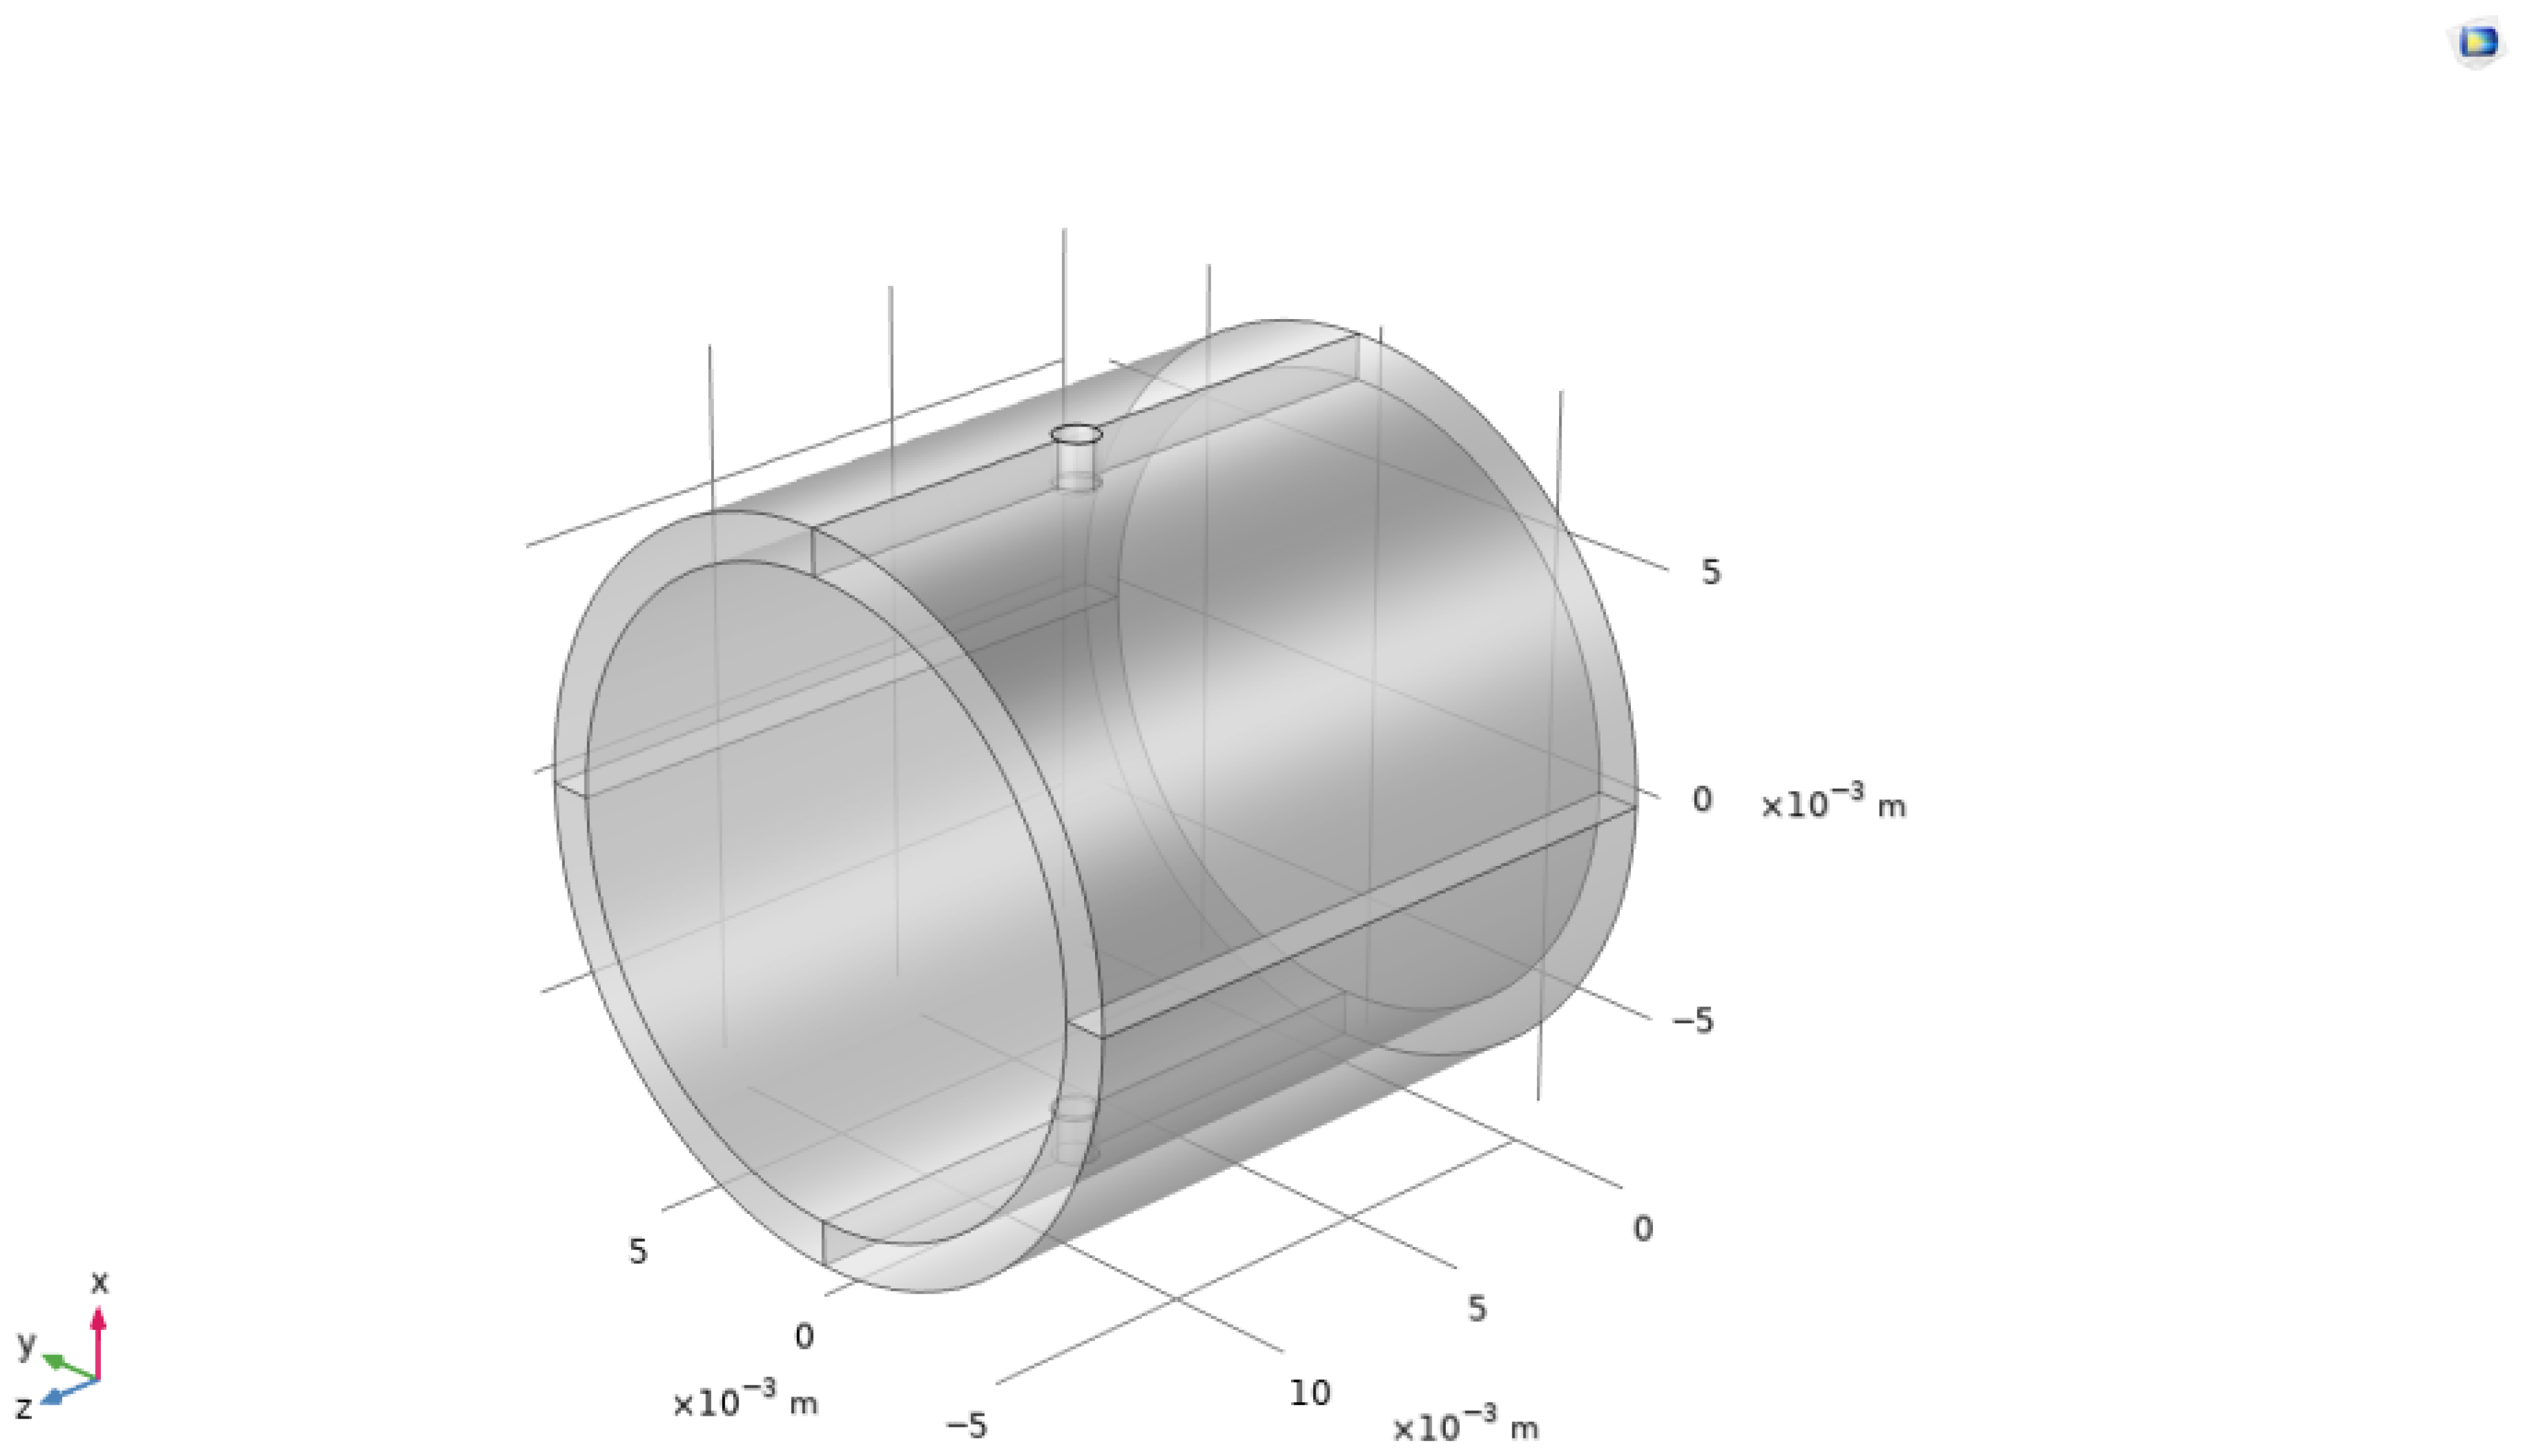
We modeled the acoustic resonator in COMSOL Multiphysics to simulate its response to varying CO2 concentrations in the N2/CO2 gas mixture. We defined the geometry (Figure 5), boundary conditions, thermodynamic properties, and material properties of the gas mixture, and then calculated the acoustic pressure field for different gas mixtures. Figure 1 also shows a resonance mode with the simulated model.
The simulation physics included the following:
  • Pressure Acoustics, Frequency Domain: The acoustic pressure in the chamber is generated using this module. We generate this pressure in COMSOL using the following Equations [20]:
    δ ( 1 ρ c ( δ p t q d ) ) k e q 2 p t ρ c = Q m
    p t = p + p b
    k e q 2 = ( w c c ) 2 , i w = λ
    where p t , p b , p s are total pressure, background pressure field, and scattered field. Without background field, p t = p s = p . ρ c and c c are complex valued quantities, and k e q is the wave number in both the out-of-plane and azimuthal directions.
  • Thermodynamics, Gas System: To simulate gas mixtures within the acoustic chamber, we use thermodynamic physics to manually define diluted gas compositions by specifying solvent and solute gases along with key mixture properties. This allows accurate replication of the behavior of the mass flow controller and enables the export of the mixture to the materials section for further simulation.

3.1. Boundary Conditions

To accurately model a closed-closed acoustic system, we implement pressure boundary conditions at both ends of the cylinder within the Pressure Acoustics module. We outline the boundary conditions as follows:

3.1.1. Pressure Settings

  • Left End of Cylinder: We apply a constant pressure of 1 Pa.
  • Right End of Cylinder: Set to 0 Pa, simulating no pressure, but just a solid boundary.

3.1.2. Valve Configurations

All valve openings are configured as closed to prevent the simulation software from interpreting the system as open-closed, which would improperly influence the resonance characteristics.

3.1.3. Simulation Parameters

  • We enable amplitude normalization to stabilize the solution.
  • We disable port sweep to focus on stationary state analysis.
  • The initial pressure settings across domains are set to 0 Pa.
  • We select the external layer as an acoustic wall.
  • We activate a domain probe for the inner cylinder.

3.2. Chemical and Thermodynamic Considerations

We use thermodynamic physics to define diluted gas compositions manually, by specifying solvent and solute gases along with key mixture properties. This allows the accurate replication of the behavior of the mass flow controller and enables export of the mixture to the materials section for further simulation.

3.3. Selected Solvent and Bulk Species

  • We select Nitrogen (N2) as the solvent, chosen for its mass and thermodynamic properties.
  • Carbon dioxide (CO2) is designated as the bulk species, which primarily influences the system dynamics.
This configuration ensures an accurate simulation of the closed–closed acoustic system and adequately represents the properties of the gas mixtures for analysis.

4. Experimental Setup and Methodology

4.1. Cylindrical Acoustic Resonator—Higher Concentrations

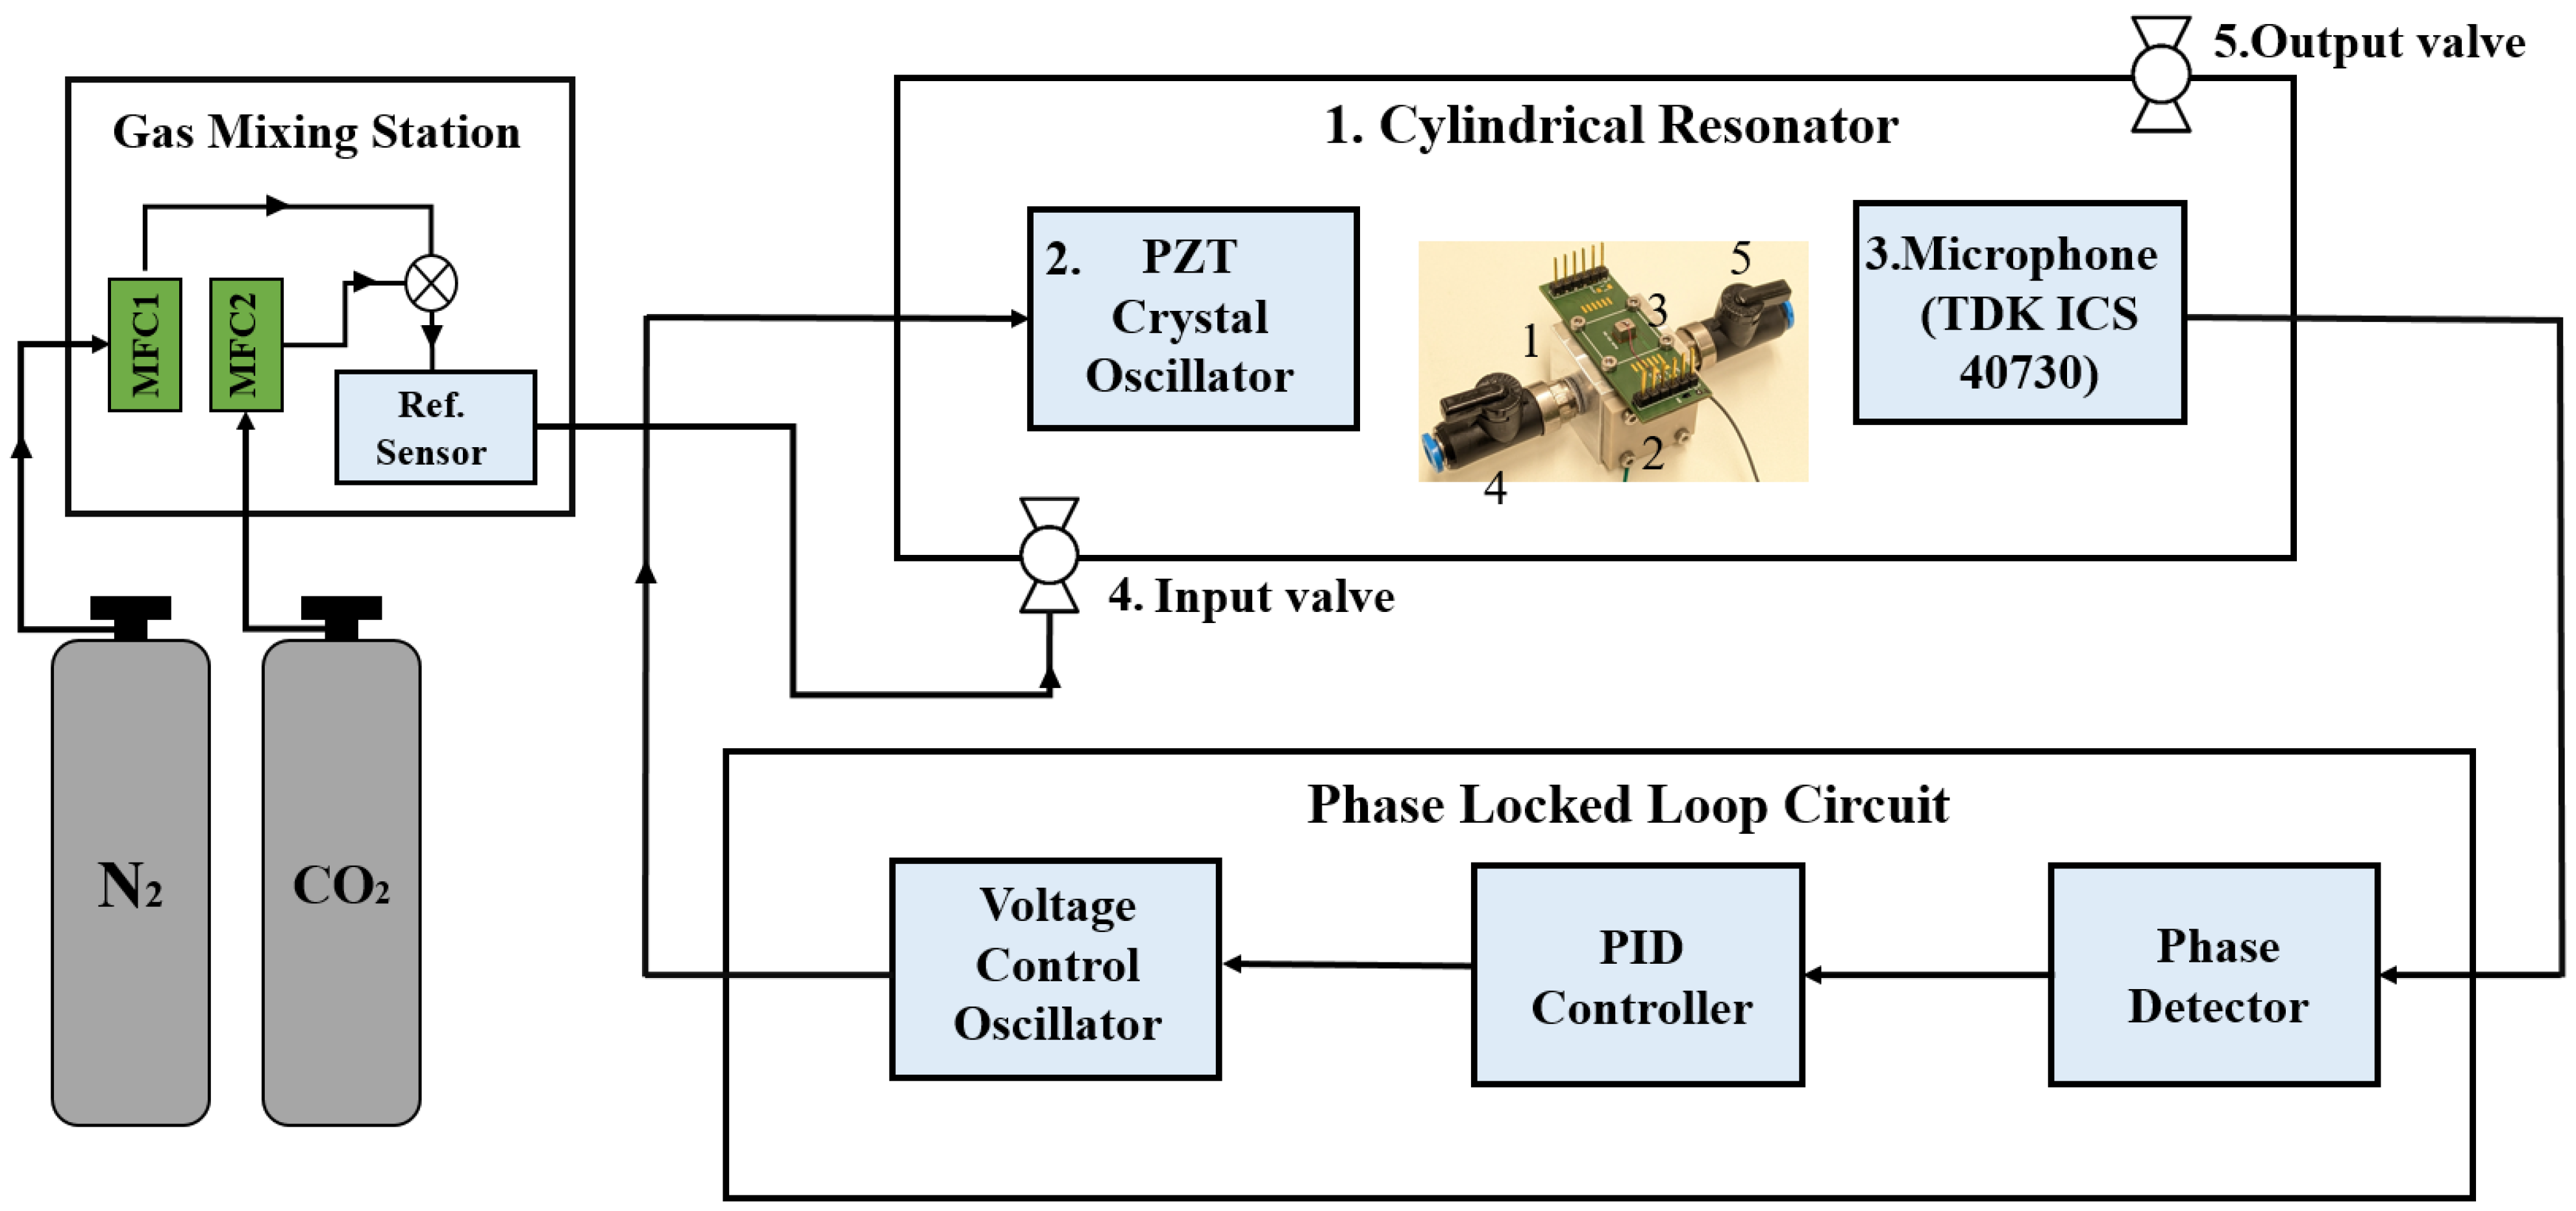
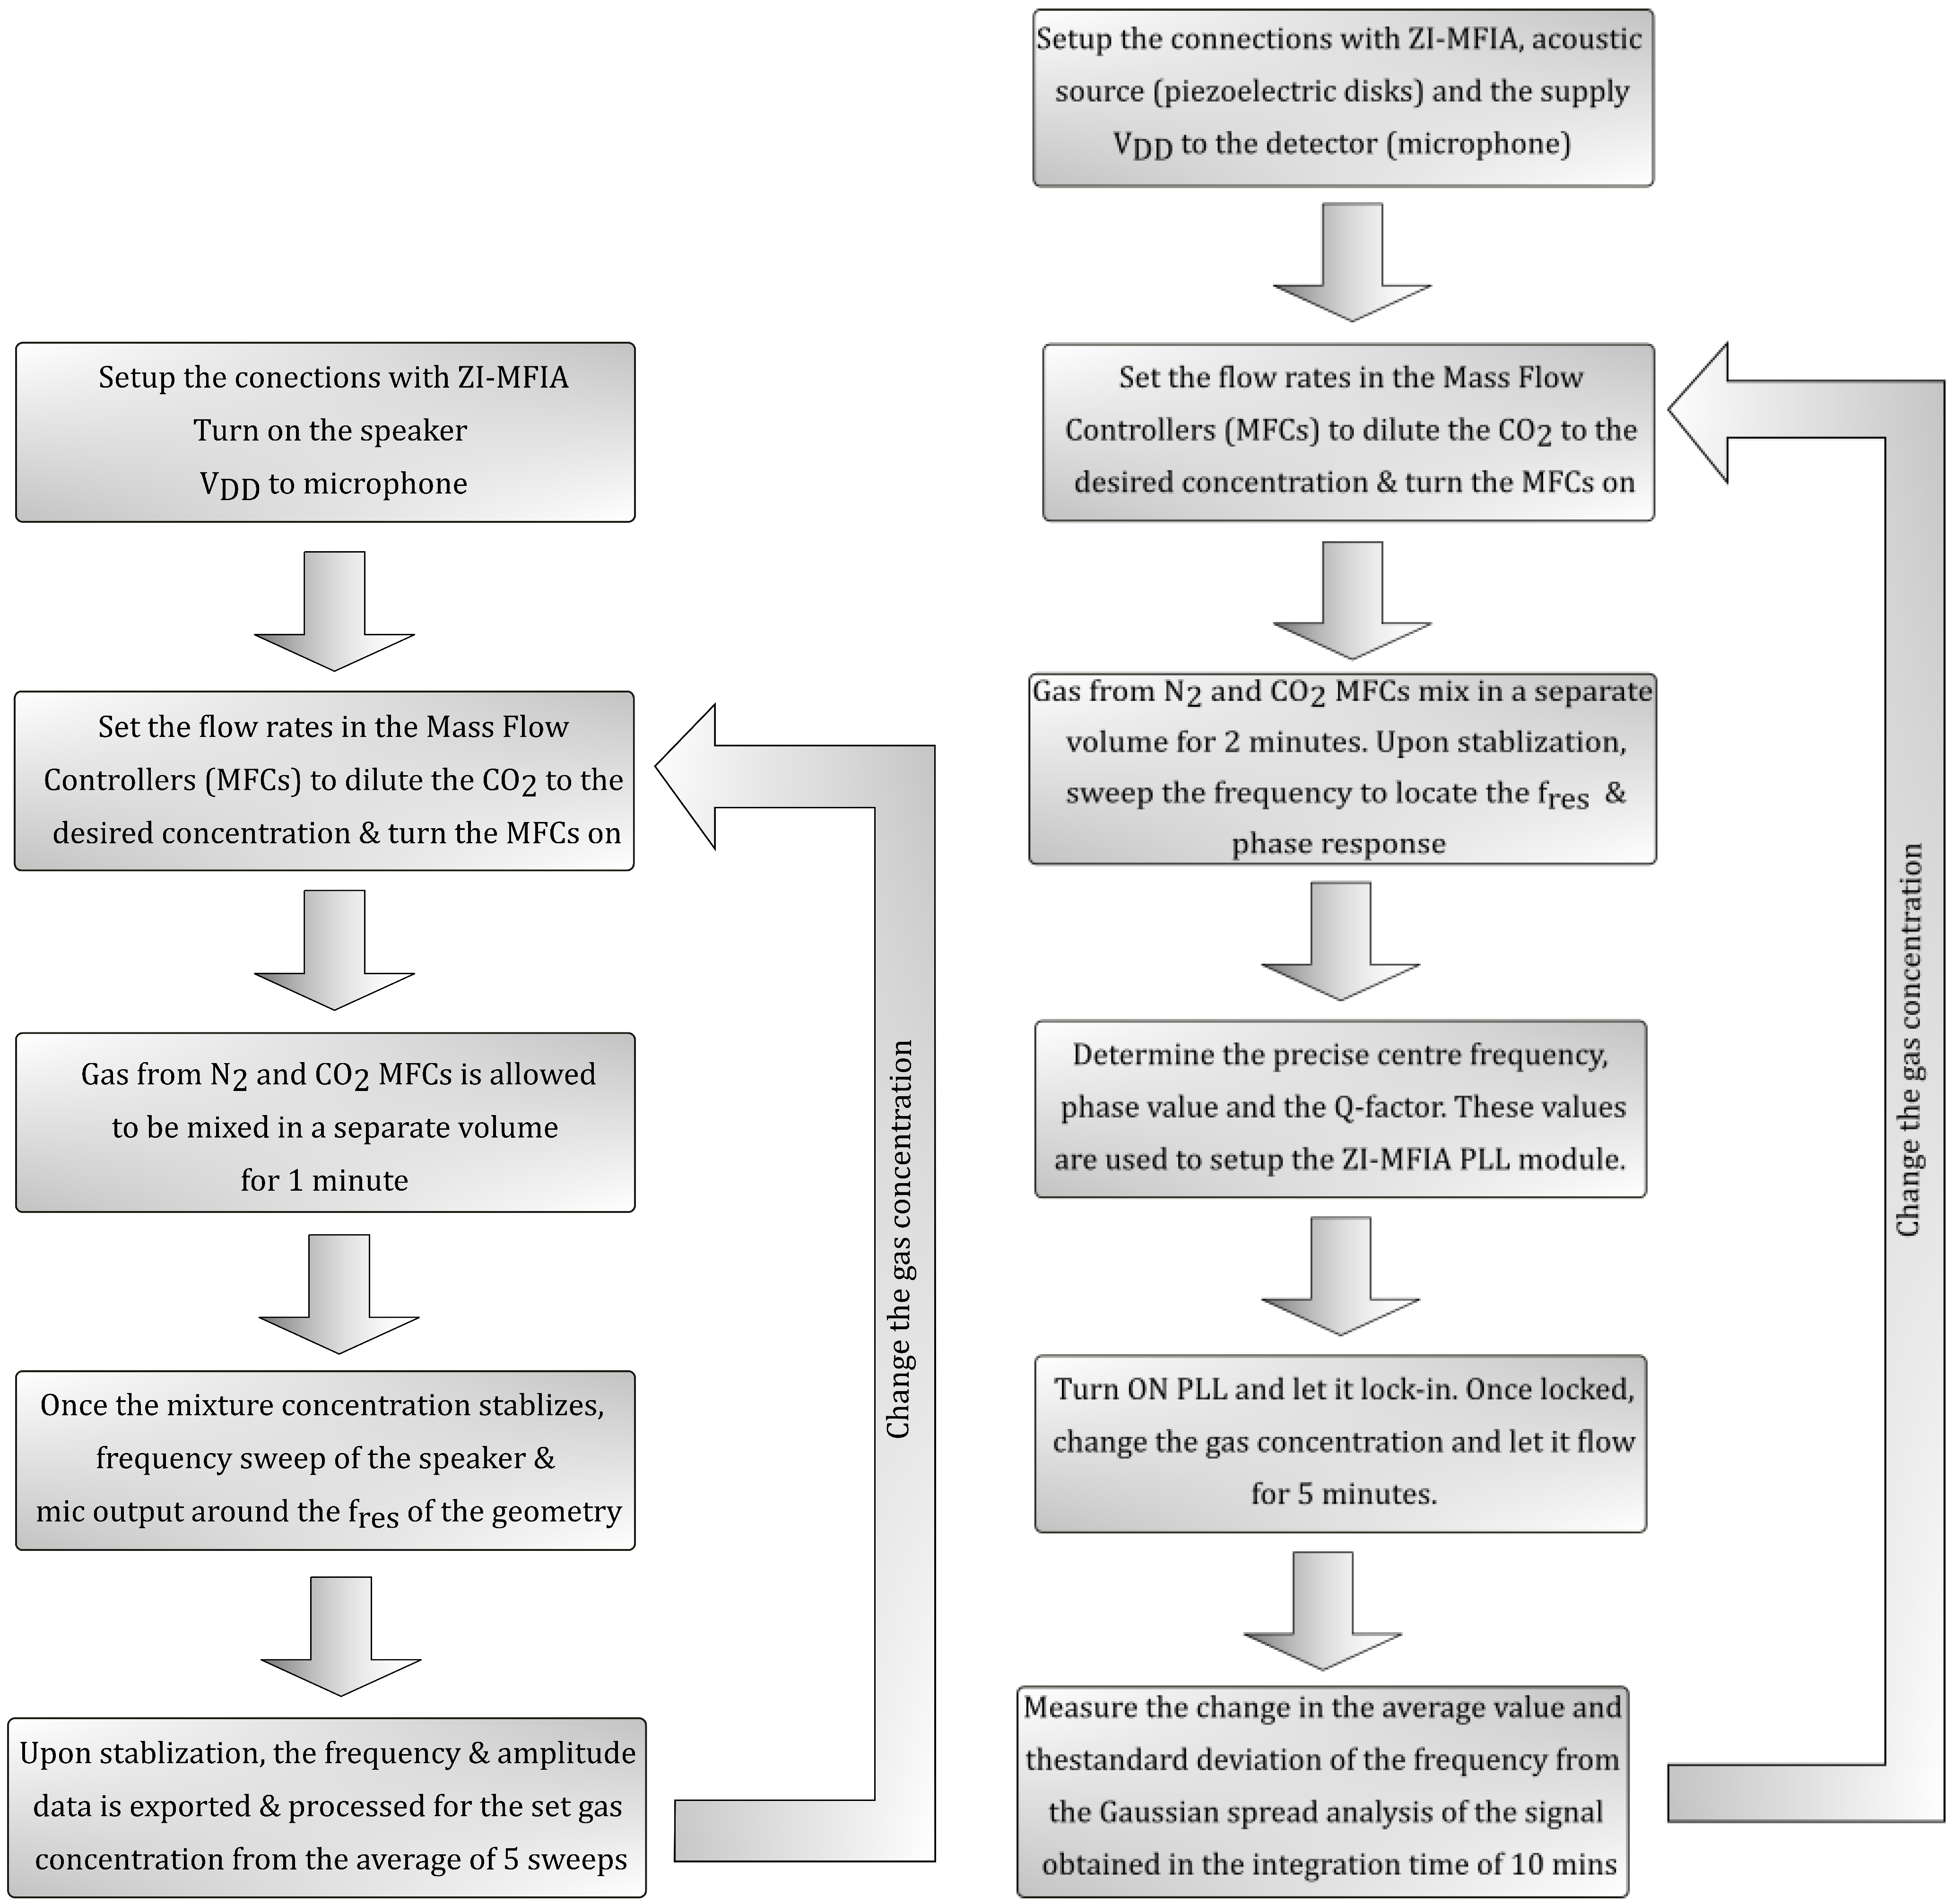
According to the system block diagram in Figure 6, we use a PZT crystal (2) as an acoustic source and a TDK 40730 microphone (3) as an acoustic detector with sensitivity as 12.59 mV/Pa at the other end. In this configuration, both the inlet and outlet valves were kept open to avoid any unwanted pressure generation or condensation generation (4,5), allowing continuous gas flow through the chamber through a mass flow controller. The control software, manually calibrated for individual gases (N2 and CO2), regulated gas flow rates in standard liters per minute (slm). Consequently, gas concentrations were calculated based on the controlled flow rates of the constituent gases using the principle of gas dilution seen above in Equation (11) [19]. Using these relationships, measurements were performed systematically, starting from 100% CO2 and gradually decreasing the concentration in increments of 10%. To minimize uncontrolled variables in this open-system configuration, we maintain a constant total flow rate.
Experimental flow: For higher gas concentrations (i.e., 100% CO2 to 10% CO2), we perform a frequency sweep for each new gas concentration to find the corresponding geometric resonance peak. We repeat each frequency sweep measurement five times, and the values presented below are arithmetic means of those measurements. These high concentration measurements are performed for basic validation of standard acoustic resonance theory (Equation (5)) before demonstrating the trace gas measurements using PLL. The variance of these measurements was very small in terms of the microphone output and frequency, and thus, error bars are omitted. On the left in Figure 7, the experimental flow is also briefly presented.

4.2. Cylindrical Acoustic Resonator—Trace Gas Concentrations

To investigate CO2 concentrations at trace levels (i.e., up to 1 ppm) where the frequency shifts become minimal, it became necessary to use a much more precise and reliable method such as the phase-locked loop module provided by Zurich Instruments MFIA. In addition to frequency sweeps, this setup also allowed for precise tracking of small resonance frequency changes, providing the necessary resolution to detect and measure the subtle changes in low CO2 concentrations on the acoustic properties of gas mixtures.
Experimental Flow:Figure 7 (right) shows a slightly different work flow used to calculate the minor deflections in the resonance. We monitored key parameters, including frequency and standard deviation, and recorded them after every 10 min measurement period. We performed measurements under continuous gas flow with three repetitions per concentration, and the results were averaged for accuracy. It was also made sure that MFC’s lower control limit (i.e., 0.1–100% full scale (1000:1)) was never exceeded to avoid any stability and repeatability problems. Some reference flow rates (slm) and Table 2 detail the calculations (ppm) for a few instances based on the gas dilution theory, where the required CO2 was the target concentration, the input CO2 came from the gas bottles in the laboratory, and the flows of CO2 and N2 were calculated accordingly and used in the MFC software (ControlCenter Version 1.36).

4.3. Helmholtz Resonator

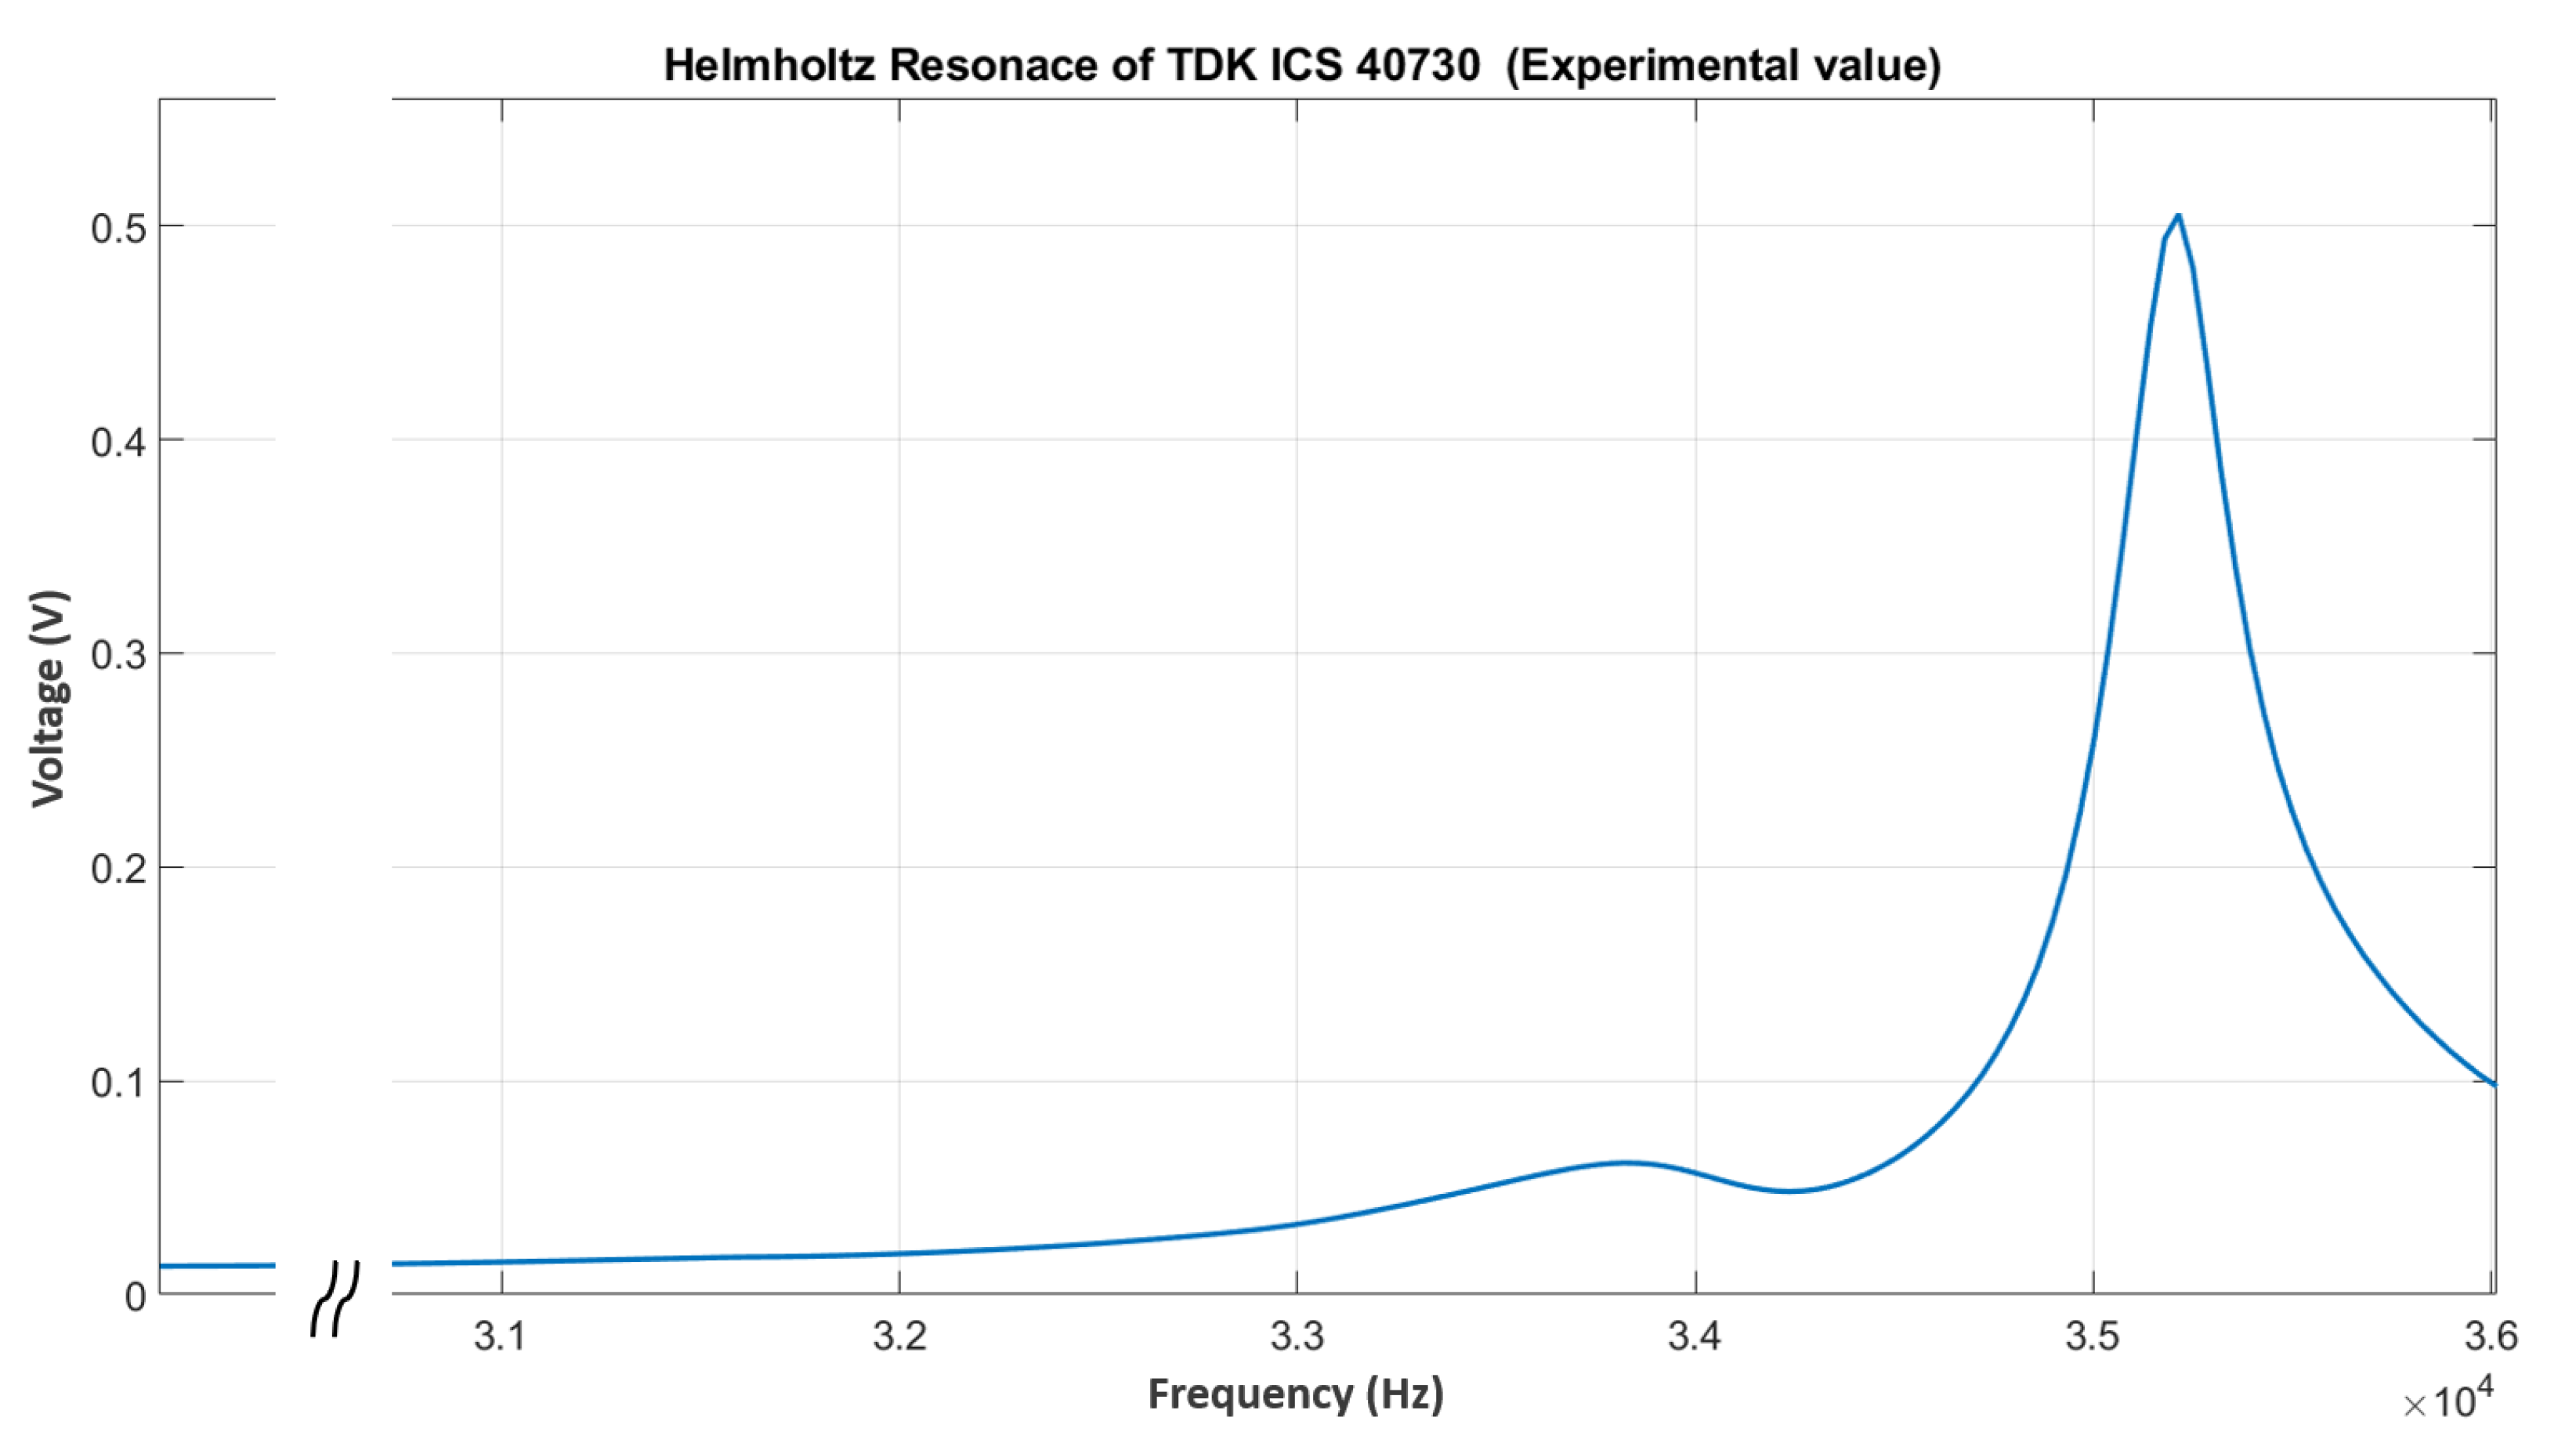
The goal of this new experiment, although using the same setup, was to track the trace gases, but this time by using the intrinsic Helmholtz resonance of the MEMS microphone, making this approach largely independent of external geometrical factors, as mentioned in Equation (10). Since both the resonances (Helmholtz and Geometric) can be now tracked with the same setup, it offers a great flexibility and enables future multi-variable analysis. As Helmholtz resonances usually occur in the ultrasound range, it is usually beyond human hearing and the capabilities of conventional acoustic sources [16,17]. Thus, to excite this resonance, we used a non-conventional method involving a PZT crystal that has not been explored before. Although it generated a limited SNR, it was one of the best available solutions. Due to the compact chamber geometry and the close proximity of valves near the detector microphone, we used low flow rates to prevent signal interference. The resonance peak is governed by Equation (10) and is experimentally determined at around 35kHz in Section 5.4.
Experimental flow: The Helmholtz resonance frequency of a TDK 40730 MEMS microphone was tracked using the same experimental setup (Figure 6). There may be slight variations in the Helmholtz frequency as a result of small assembly and manufacturing variations. We can monitor the exact resonance by varying a physical parameter, since it is independent of any external geometry variations. For example, the area, volume, and length parameters specified in Formula (10) are constant as the physical dimensions of this microphone, which remain fixed once fabricated. Thus, to find out the resonance, we can perform a frequency sweep around 30–35 kHz. To confirm that the measured peak corresponds to the Helmholtz resonance, we can vary the geometry of the cylindrical resonator (1 in Figure 6), and then the measurement was repeated (in our case, the length was altered). Since changing the physical parameter of the resonator would alter only the geometrical resonance (Formula (5)), the Helmholtz peak should remain unchanged. This behavior enables the difference between standard acoustic resonances and Helmholtz resonances. Once the resonance is identified, the PLL work flow (right in Figure 7) can be repeated to track it against the change in gas concentration.
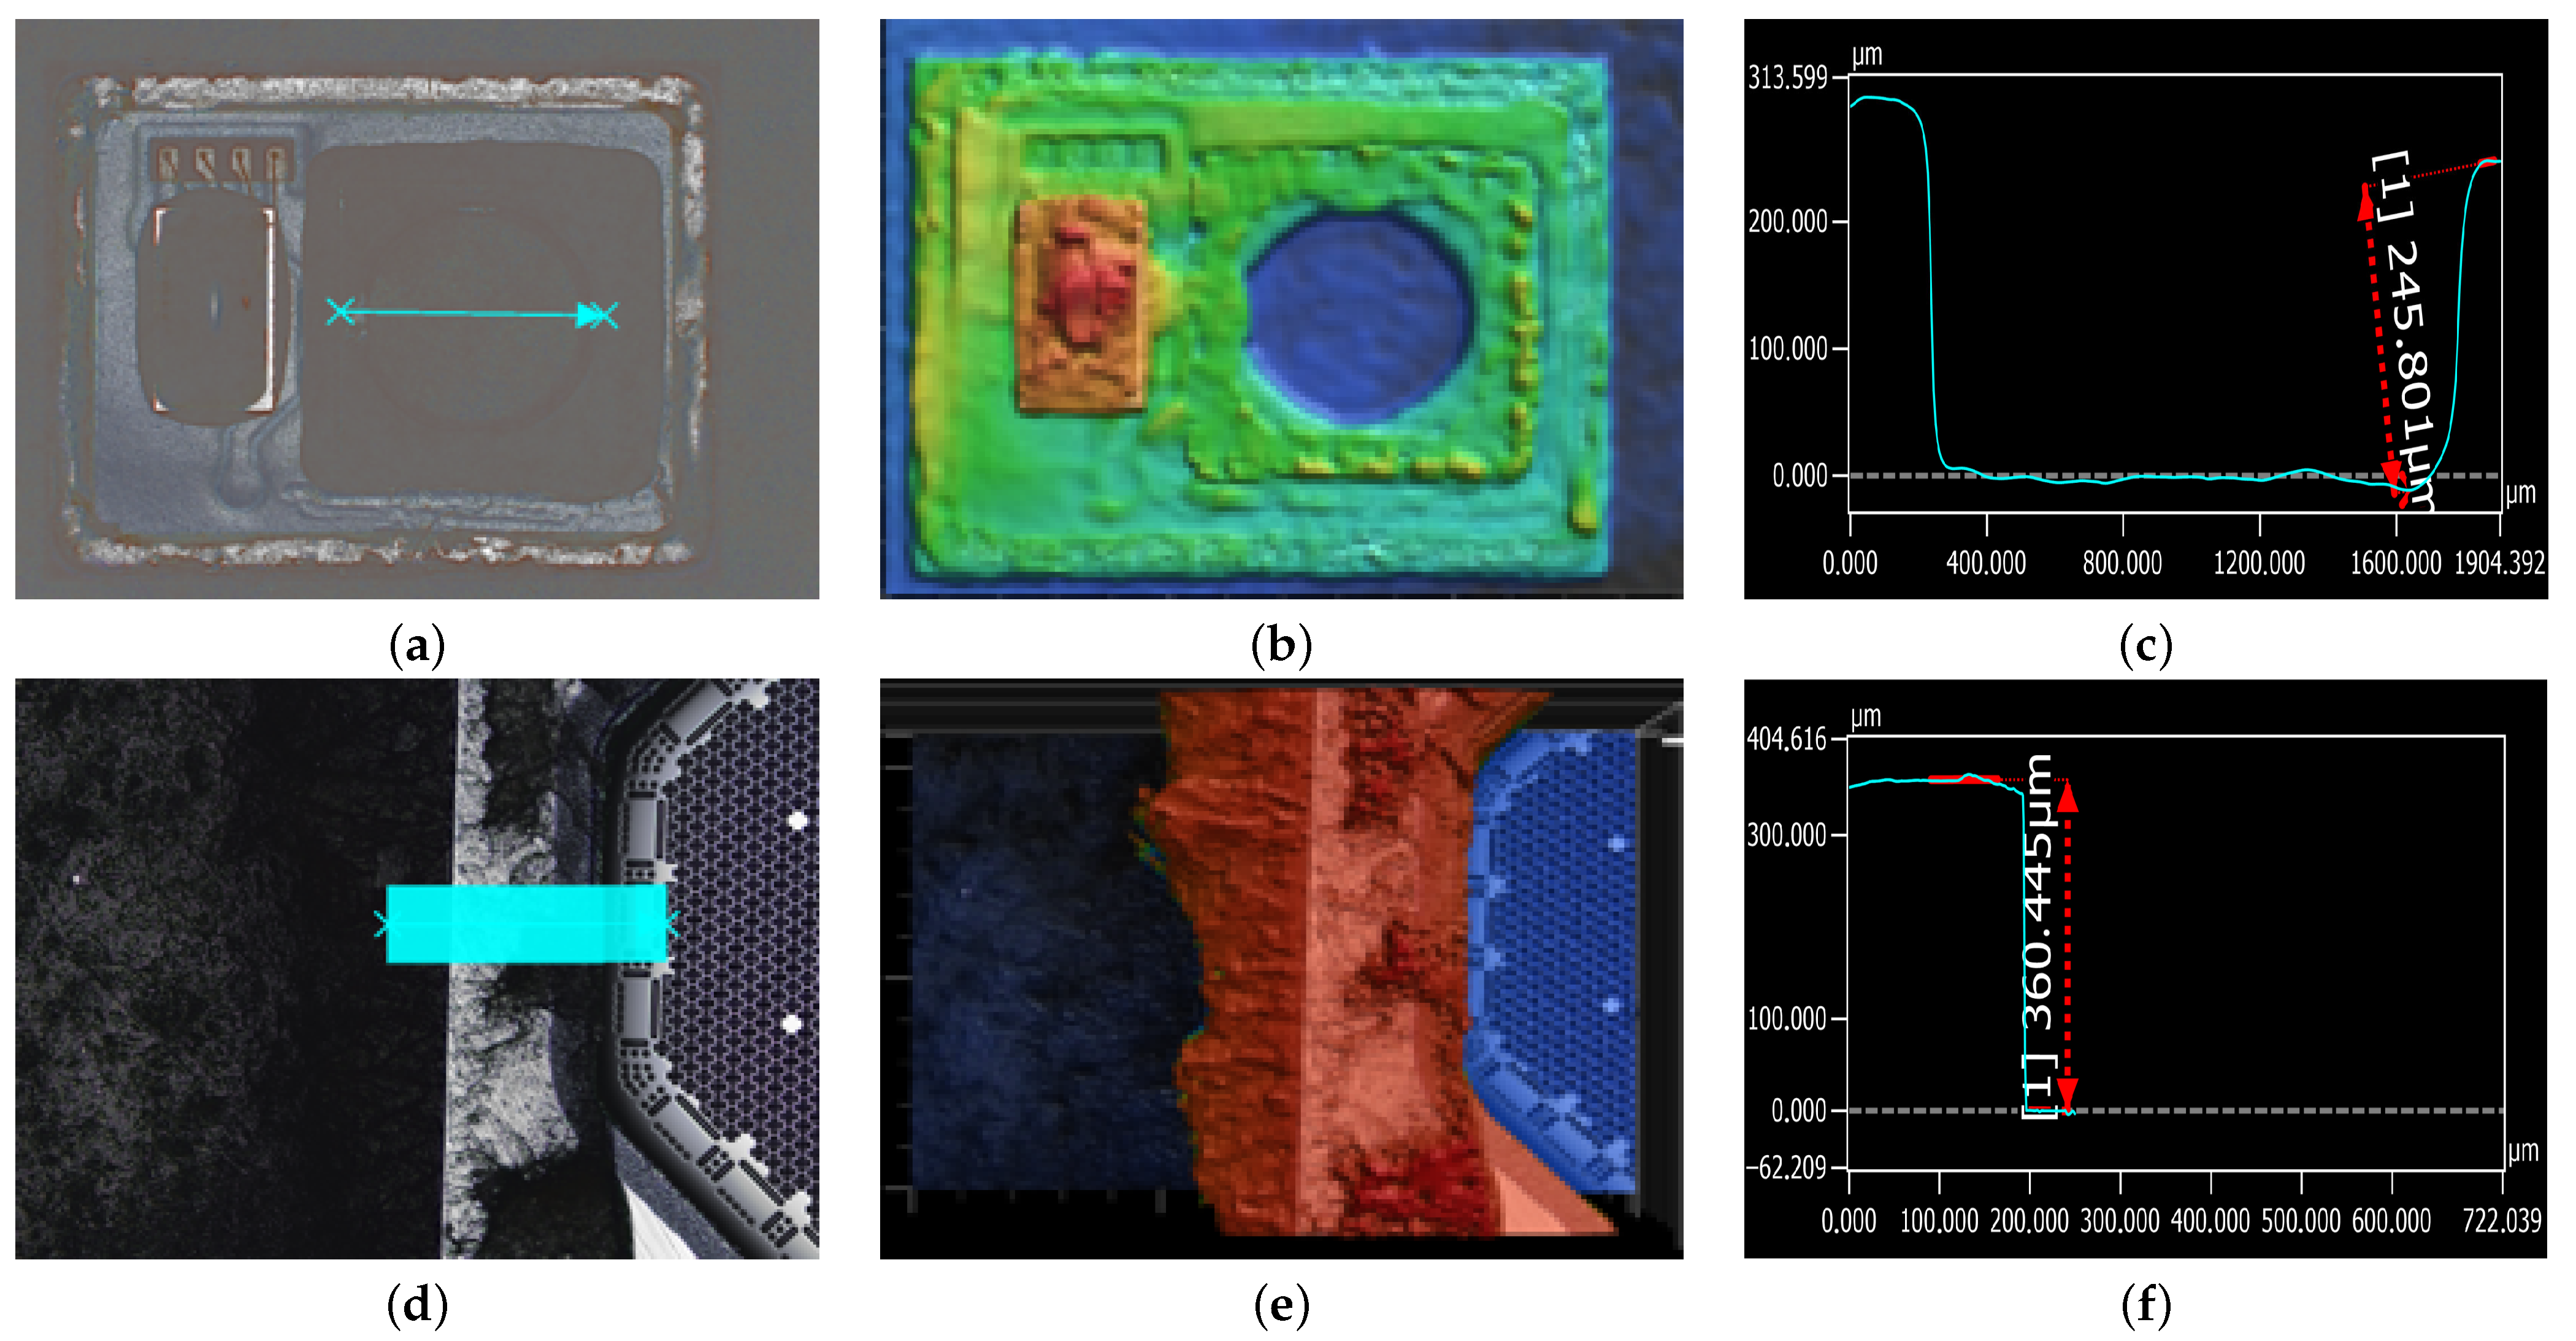
This resonance can also be verified using the Formula (10) if the corresponding parameters are known. We carefully opened up the microphone cavity and placed it under a Keyence laser scanning microscope to measure the length of inlet port, cavity height, membrane structure, total volume, etc., to find the theoretical value of this MEMS microphone.
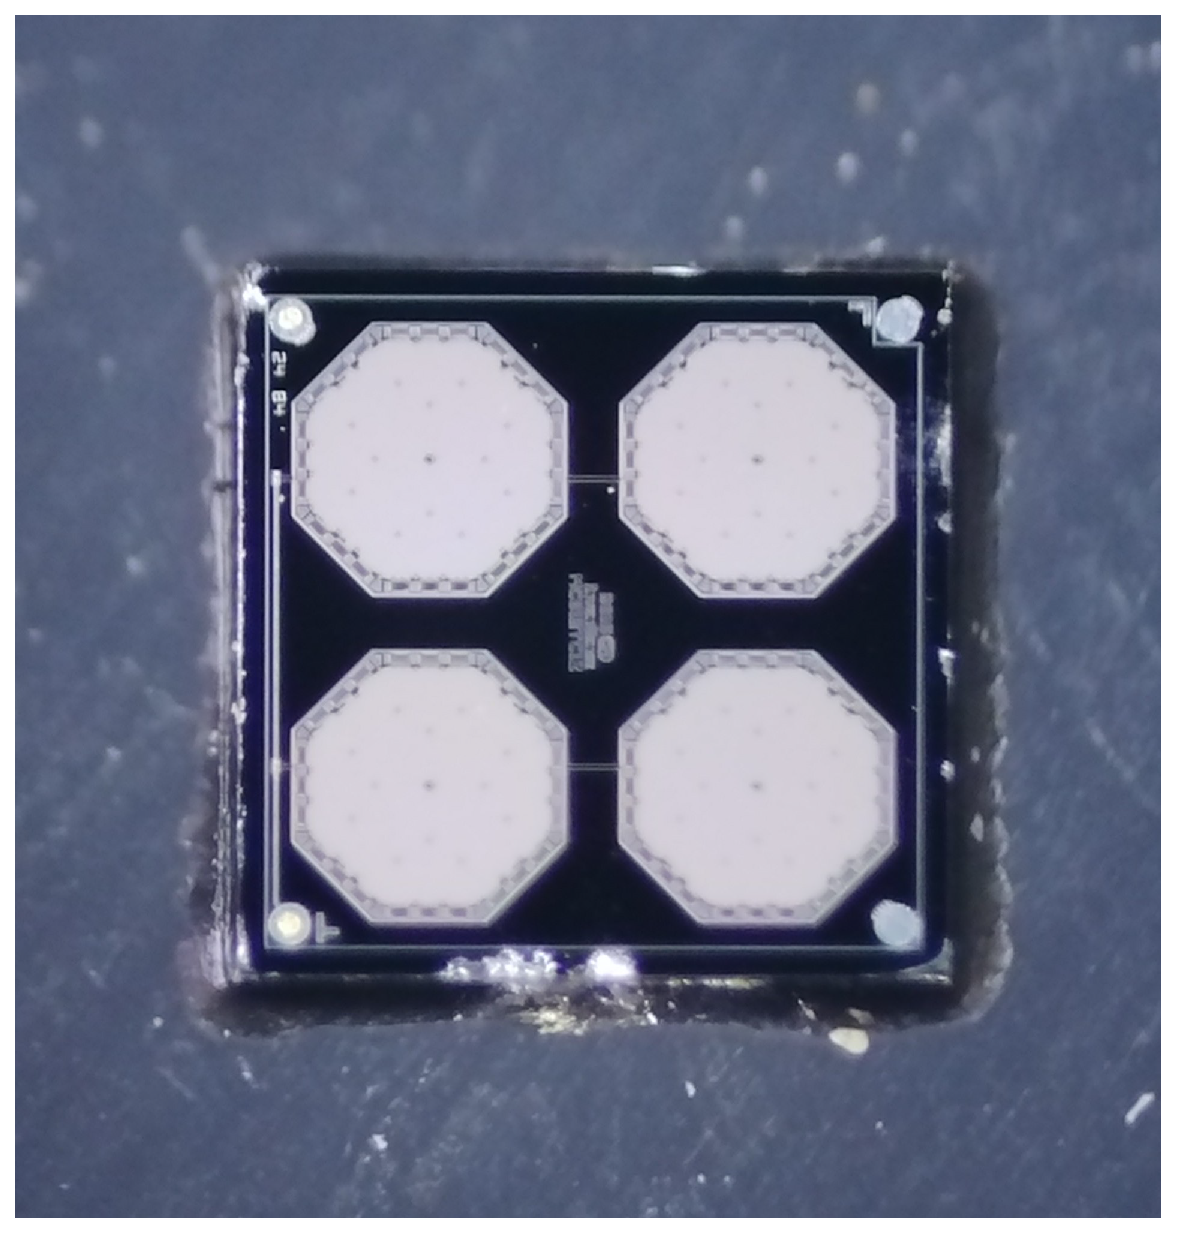
In Figure 8, it was shown how various parameters were roughly measured by using a Keyence laser microscope. In order to calculate the chamber volume, we had to calculate the radius, which was performed by calculating the diameter of the membrane that sat inside Figure 9. After calculating these values and substituting them in Equation (10), we calculate the expected resonance.

5. Results and Discussion

For the data collection methodology, all values presented in this study represent arithmetic means calculated from multiple experimental trials to ensure the reliability and reproducibility of the results. Standard deviations accompany these means to indicate the variability and precision of the measurements. For low concentration measurements, two distinct datasets are shown on the same graph, since they remain analytically separate due to different initial CO2 concentrations in the source bottles. This divergence in reference baselines arose from the resolution limitations of the MFC. To achieve accurate and stable gas mixtures at very low concentrations, it was necessary to use source gases with different CO2 levels. This approach enabled coverage of a wider dynamic range while maintaining control accuracy and resolution. We generated datasets under distinct conditions specifically in terms of gas density, flow rate, and initial concentrations, so a direct combination or overlap is not feasible. We present them concurrently, but they must be interpreted independently, within the specific context of their respective experimental setups. Additionally, for such precise measurements involving trace-level gas concentrations, external environmental parameters such as temperature and humidity are very important. Although these factors were not actively regulated during the experiments, they were continuously monitored using NDIR sensors [21], which confirmed that these parameters remained stable, minimizing their potential impact on the results and ensuring consistent measurement conditions throughout all trials.

5.1. Geometric Acoustic Resonance—Higher Concentrations

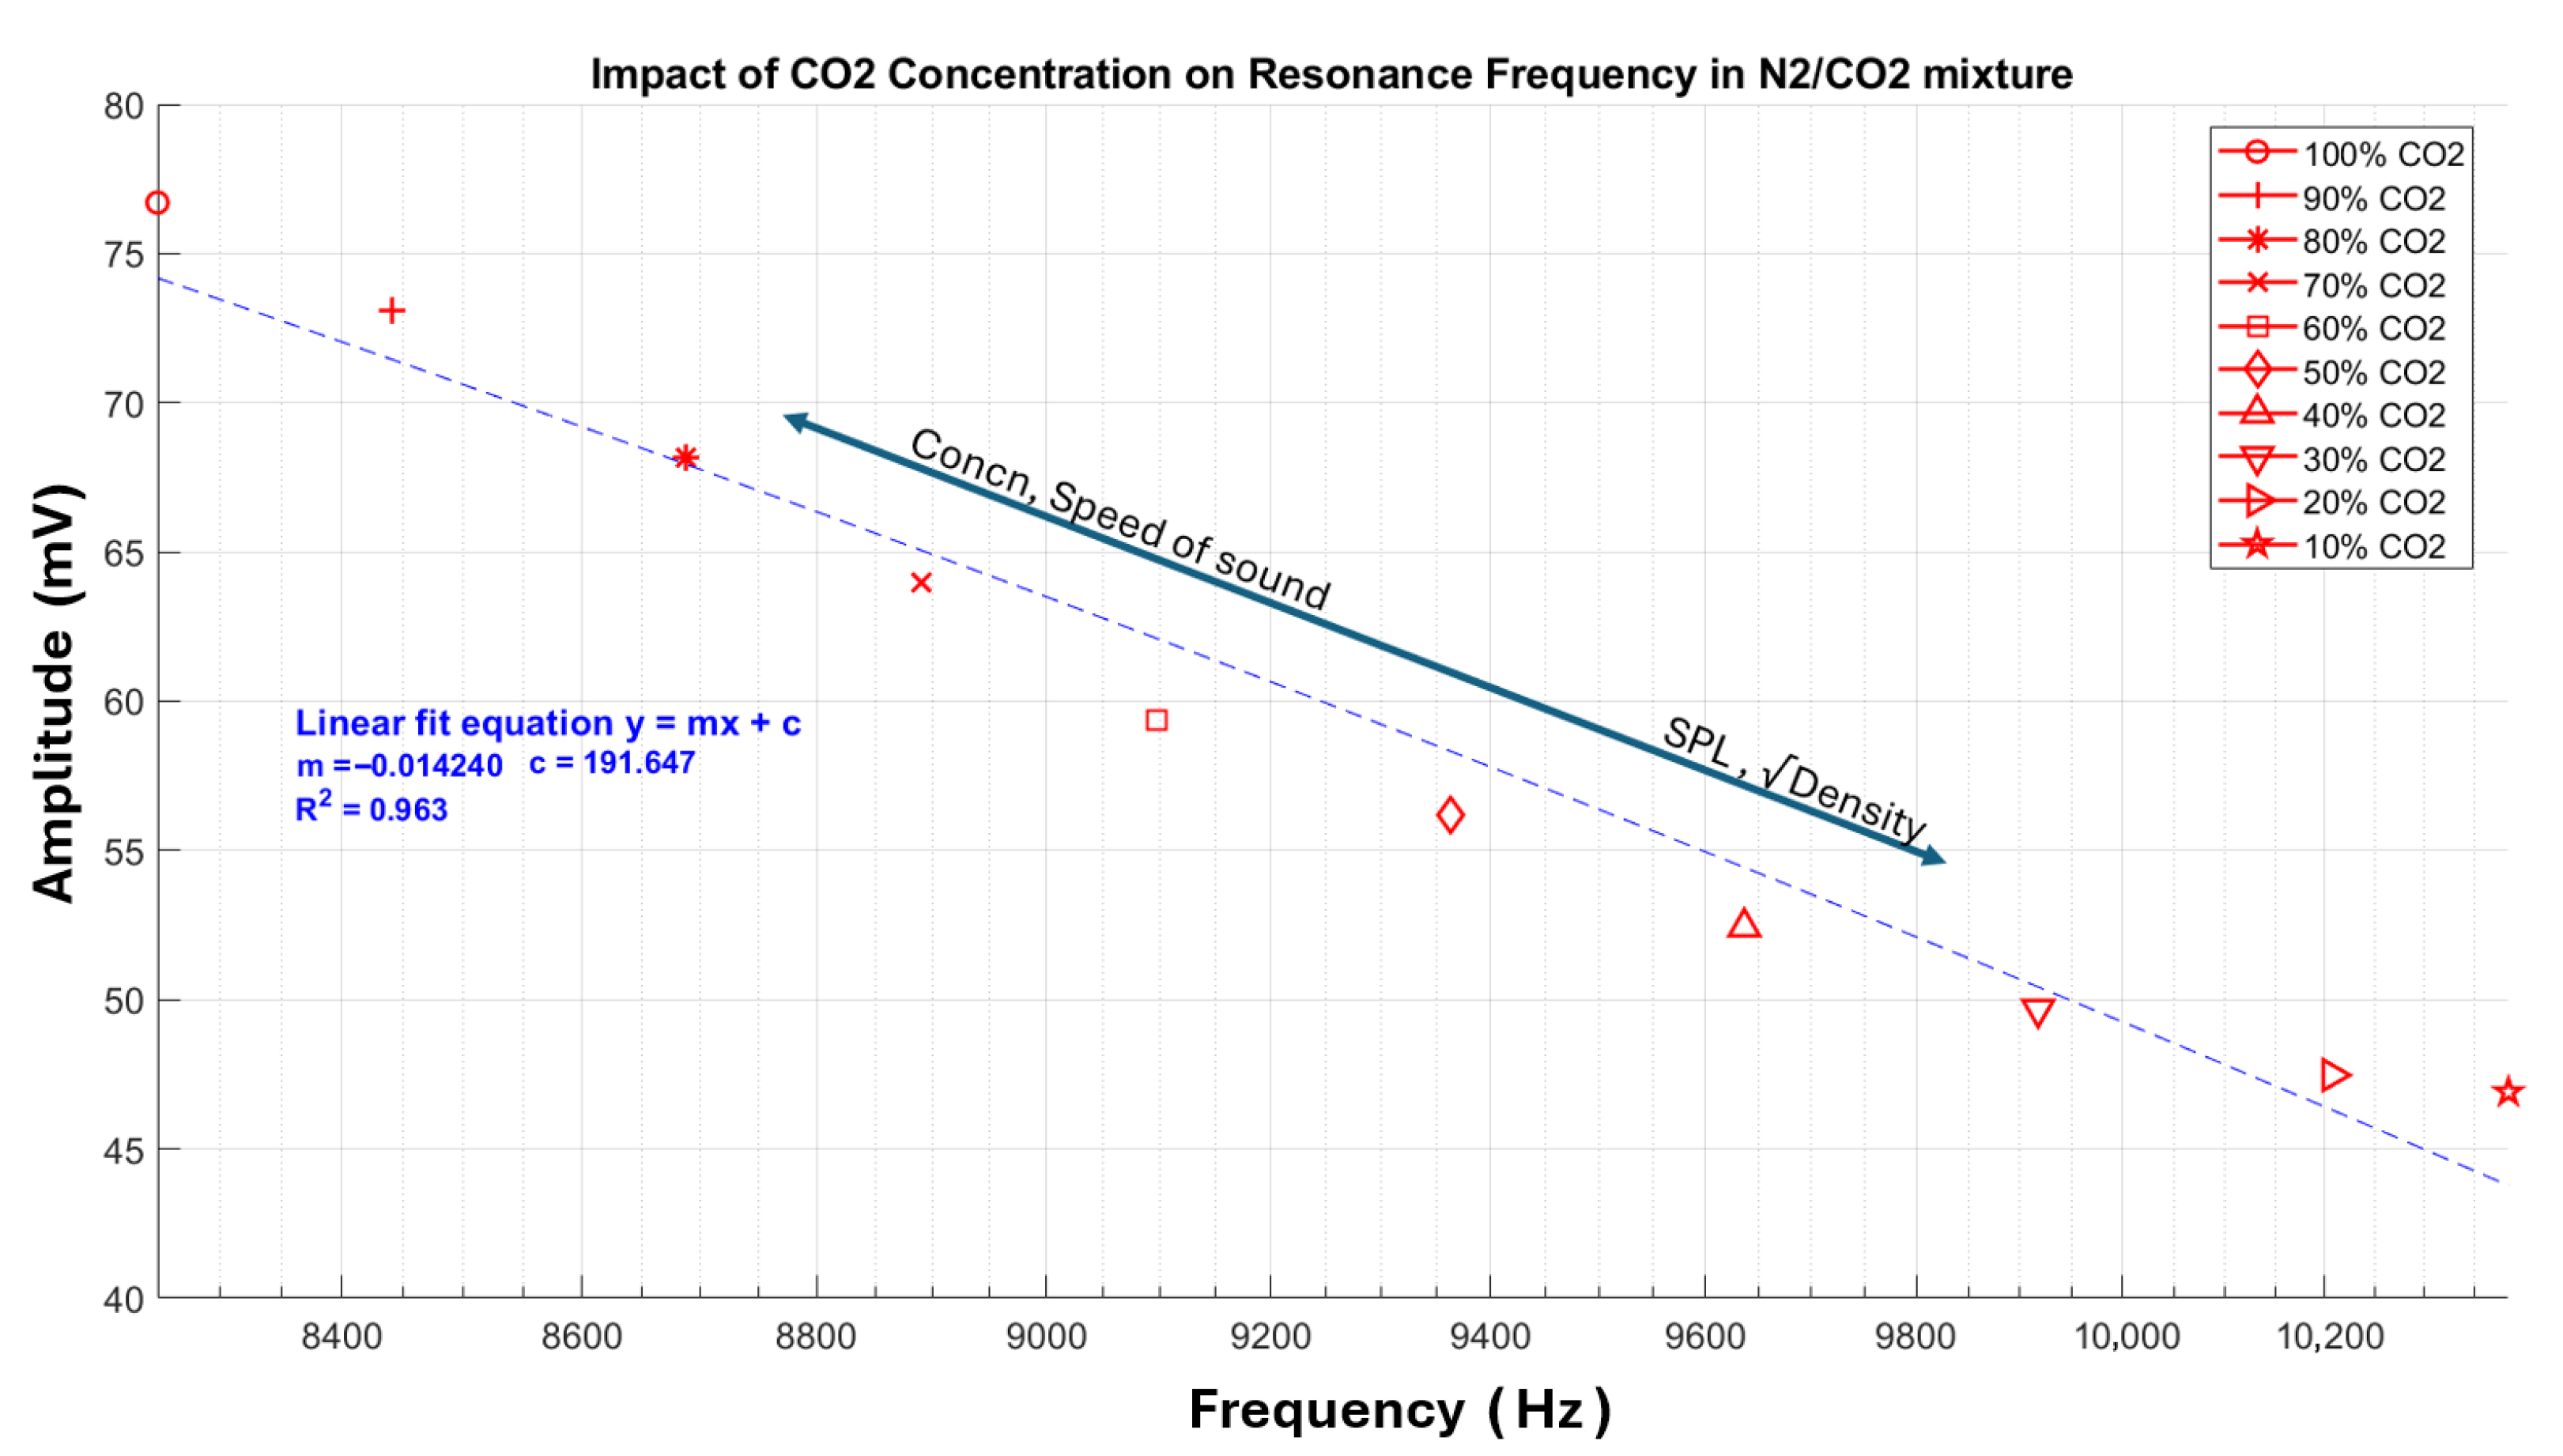
Figure 10 represents 10 different frequency sweep measurements with different CO2 concentrations stacked together, thus proving the theoretical correlation between the speed of sound, frequency, and amplitude (Equation (9)). The Y-axis in the figure represents the output voltage, i.e., the amplitude of the microphone (Nr 3. in Figure 6), the X-axis represents frequency, and the voltage excitation of the speaker was kept constant at 5 V. The figure, in short, illustrates the shifts in resonance frequency for varying CO2 concentrations ranging from 100% to 10% in a N2/CO2 mixture.
The important results observed were as follows:
  • The linear relationship between resonance frequency and speed of sound is substantiated by applying a linear regression model, which produces a coefficient of determination (R2) of 0.96, which confirms direct proportionality.
  • The small-magnitude negative slope of −11.8 mV/Hz indicates a gradual decrease in the resonance frequency with increasing CO2 concentration, although with a relatively small rate of change.
  • We observe an increase in gas mixture density as the CO2 concentration rises due to the higher molecular weight of 44.01 g/mol [22] of CO2 compared with 28.02 g/mol [22] for N2.
  • Consequently, we observe an increase in amplitude, approximately 50%, from the lowest point to the highest point, which can be attributed to the relationship between SPL and density, expressed as SPL ρ , where ρ represents the gas density.
  • The coefficient of determination (R2) of 0.96 obtained from the linear regression analysis suggests robust consistency and reliability in the measurements. This indicates that the technique has significant potential for gas detection applications, particularly for CO2 detection and quantification.

5.2. Geometric Acoustic Resonance—Trace Gas Concentrations

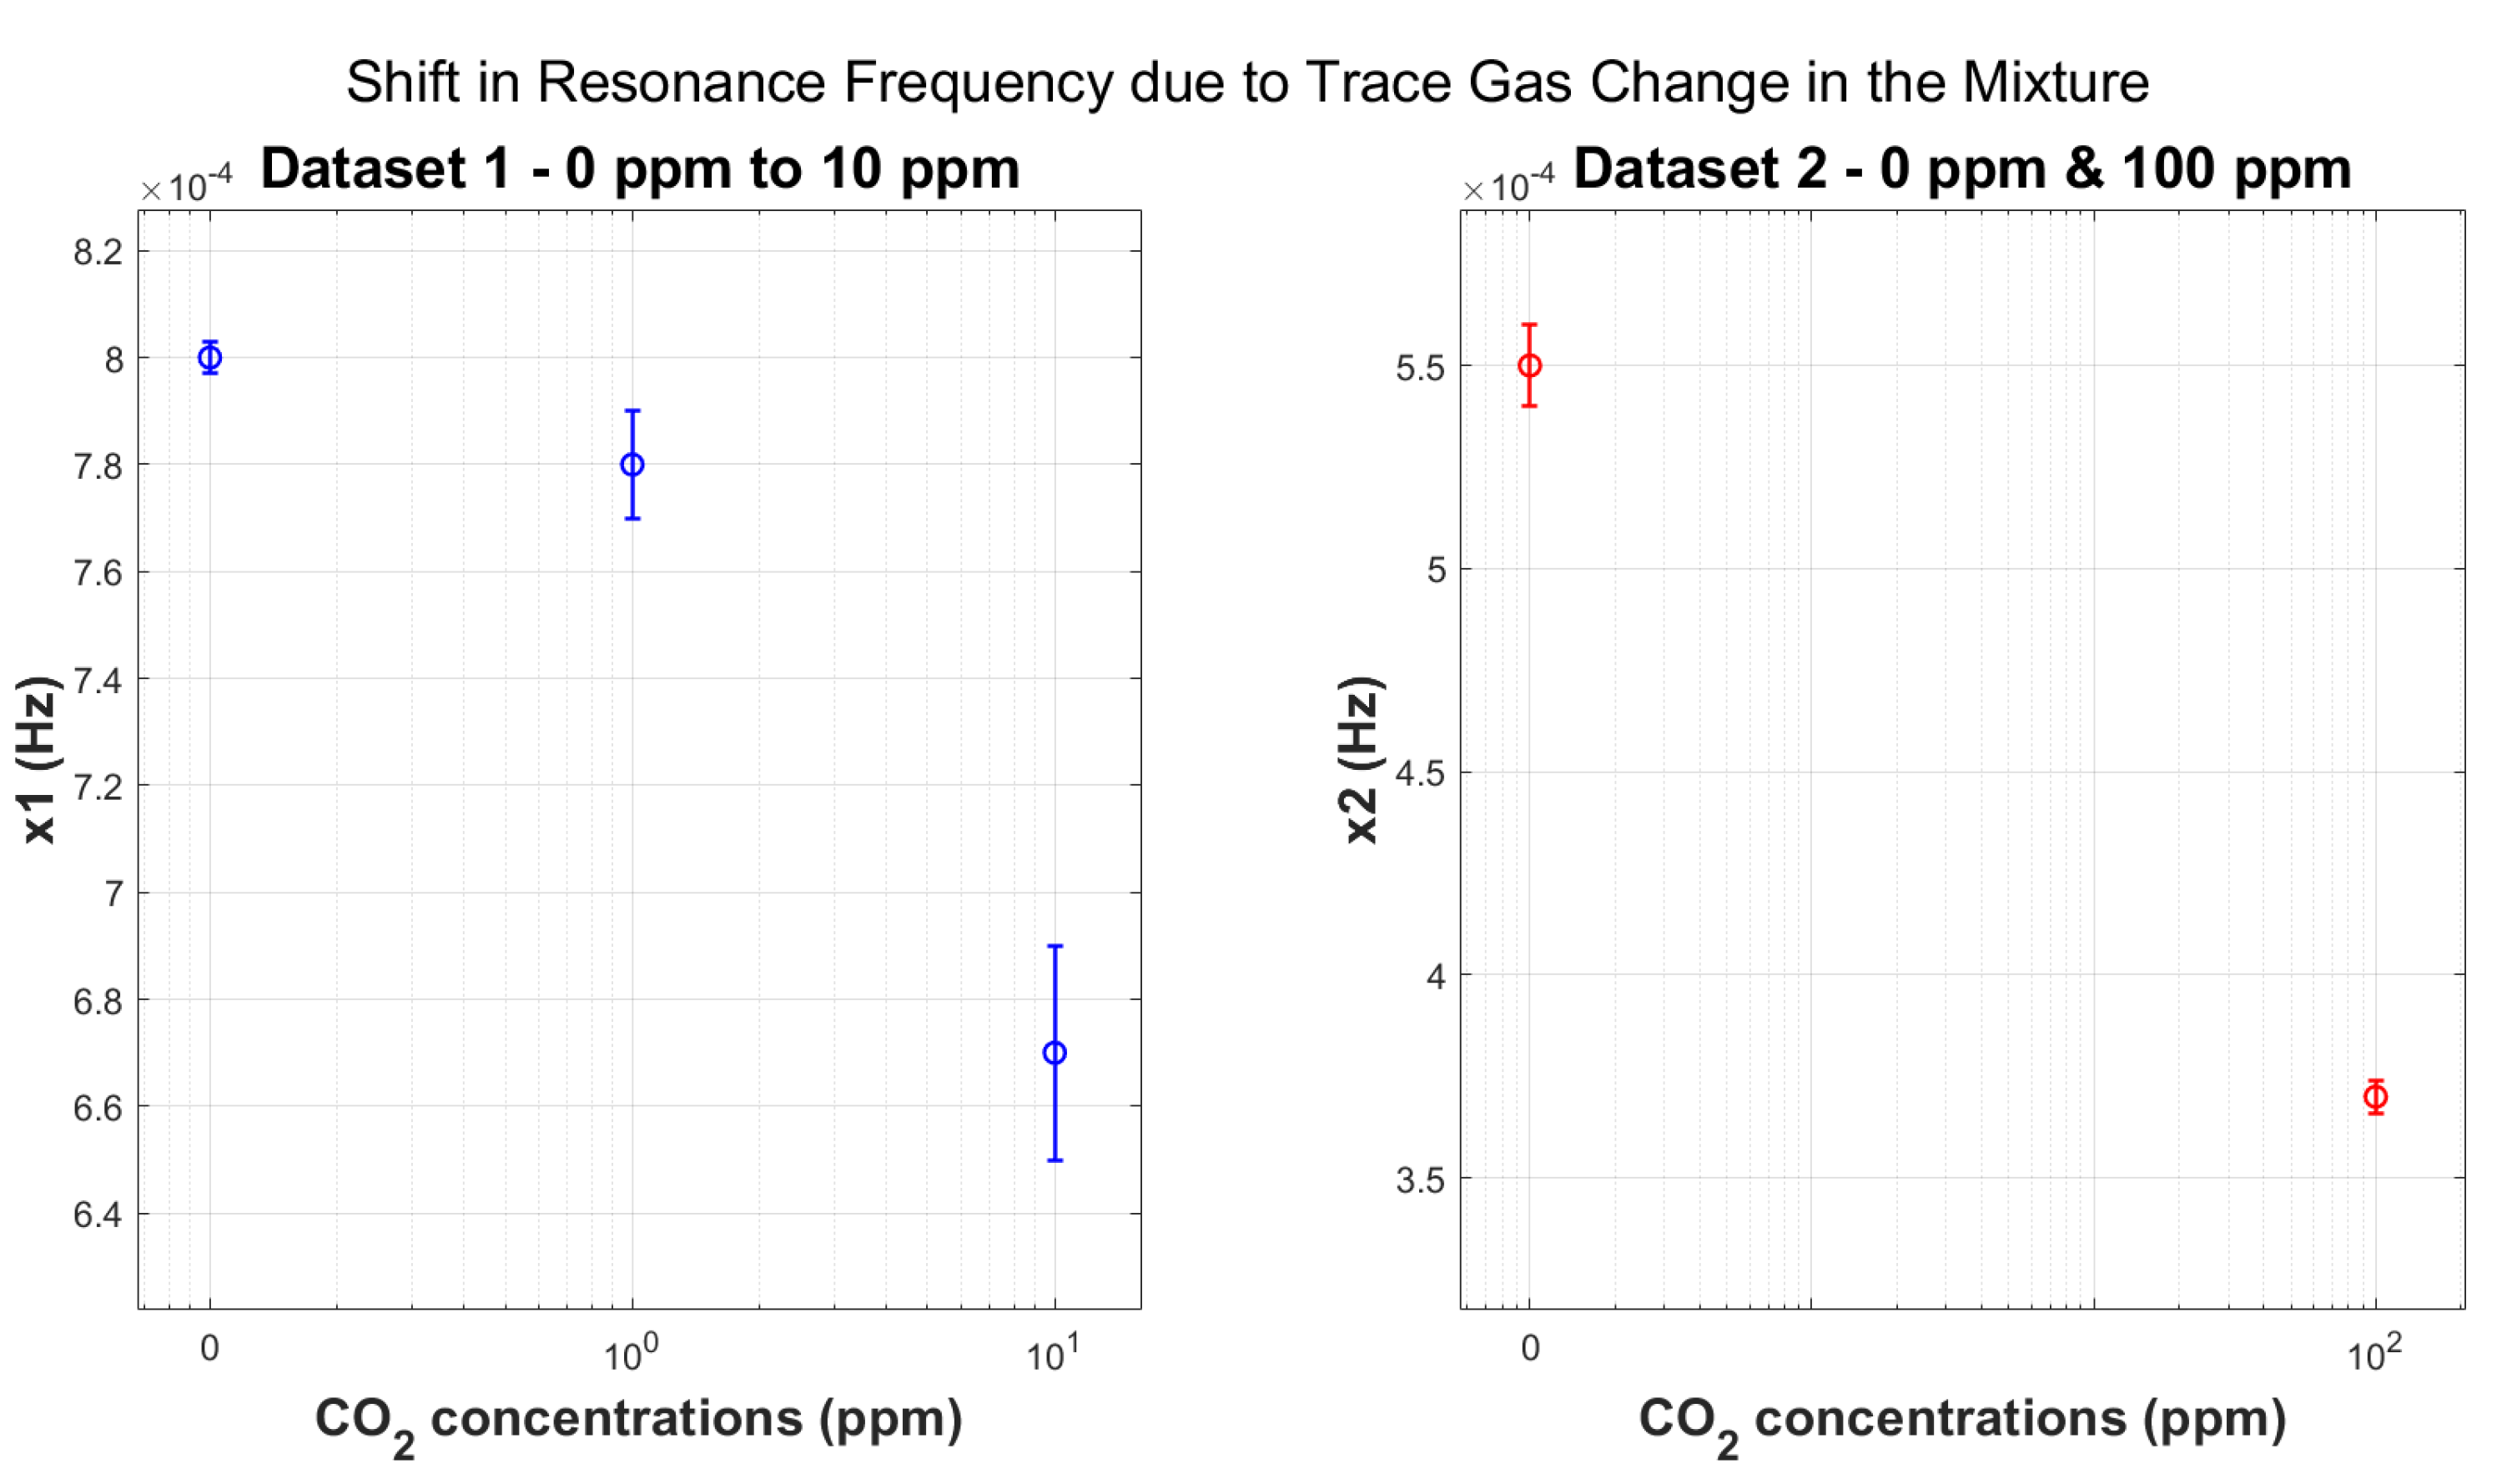
The Y-axis in Figure 11 shows the ppm concentration of CO2, measured in logarithmic intervals to obtain enough frequency deflection between minor frequency changes, and the X-axis represents the deflection in the center frequency of reference with respect to the change in gas concentration, along with the error bars.
Key observations from these measurements include the following:
  • Sensitivity: We observe significant frequency shifts in the transition from 100 ppm to 0 ppm CO2 concentrations (Table 3), as the change in the mole fraction becomes progressively smaller, resulting in increasingly smaller changes in CO2.
  • Linearity: A linear correlation exists between the frequency fn, amplitude SPL, and speed of sound c and CO2 concentrations, as a result of f r e s c , S P L ρ . (Refer to Equations (3), (4), and (8).)
  • Repeatability: The magnitude of the error bars is comparable to the frequency shifts observed, indicating high measurement repeatability and precision.These errors are derived from the standard deviations calculated from the respective group of multiple datasets. This underscores the reliability of the experimental setup and data acquisition process.

5.3. Geometric Acoustic Resonance—Simulation

We investigated various resonator geometries through simulation to optimize the acoustic response. For the final configuration, the simulated resonance modes demonstrated strong agreement with the experimentally measured values, particularly around the primary resonance frequency around 12 kHz (Figure 11). This consistency between theoretical predictions and empirical results validates the simulation approach and confirms the physical accuracy of the modeled parameters. In the simulations, the frequency changes for the trace concentrations were successfully resolved using the same pressure acoustics physics in conjunction with thermodynamics. Table 4 illustrates the changes in center frequency due to changes in CO2 concentrations ( δ f ) with respect to pure N2.
Some key observations from the experiments include the following:
  • The observed trend of frequency, amplitude, and speed of sound remains consistent across both simulations and experiments.
  • Variation in gas concentration resulted in larger frequency shifts in the simulations compared with the experimental results, since the simulations performed by us are simulations with no external influence of microphone sensitivity, pressure induced gas flow, open valves, etc. These ideal results serve as benchmarks for future experiments with better sensitivity and resolution.

5.4. Helmholtz Resonance

We estimated the theoretical value of the Helmholtz resonance after measuring the dimensions of the MEMS microphone (see Figure 8 and Figure 9). The calculated resonance frequency (from Equation (10)) was around 38 kHz, while the experimental was around 35 kHz (seen in Figure 12), indicating good agreement. The small variation most likely resulted from roughly calculated dimensions with the laser microscope along with an approximated volume.
Analysis of the data presented in Figure 13 reveals the following two significant outcomes:
  • Repeatability: The raw frequency values seen in Figure 12 represent the mean of three consecutive measurement runs carried out for each gas concentration group. We computed the associated standard deviation and error values from this dataset, ensuring statistical reliability and measurement precision. This methodology improves the repeatability and precision of the reported results.
  • Maximum Sensitivity: The Helmholtz resonance method exhibits the largest change in resonance frequency relative to pure N2 among all experiments carried out in this study so far (see Table 5). This indicates a high level of sensitivity to variations in gas composition. Equation (10) shows the direct proportionality between the speed of sound and the Helmholtz resonance.
  • Geometry-Independent Tracking: These results demonstrate that the Helmholtz resonance, which is intrinsic to the microphone and independent of the geometry of the acoustic chamber, serves as an excellent parameter for tracking gas concentrations. This geometry independence offers potential advantages in sensor design and application versatility.
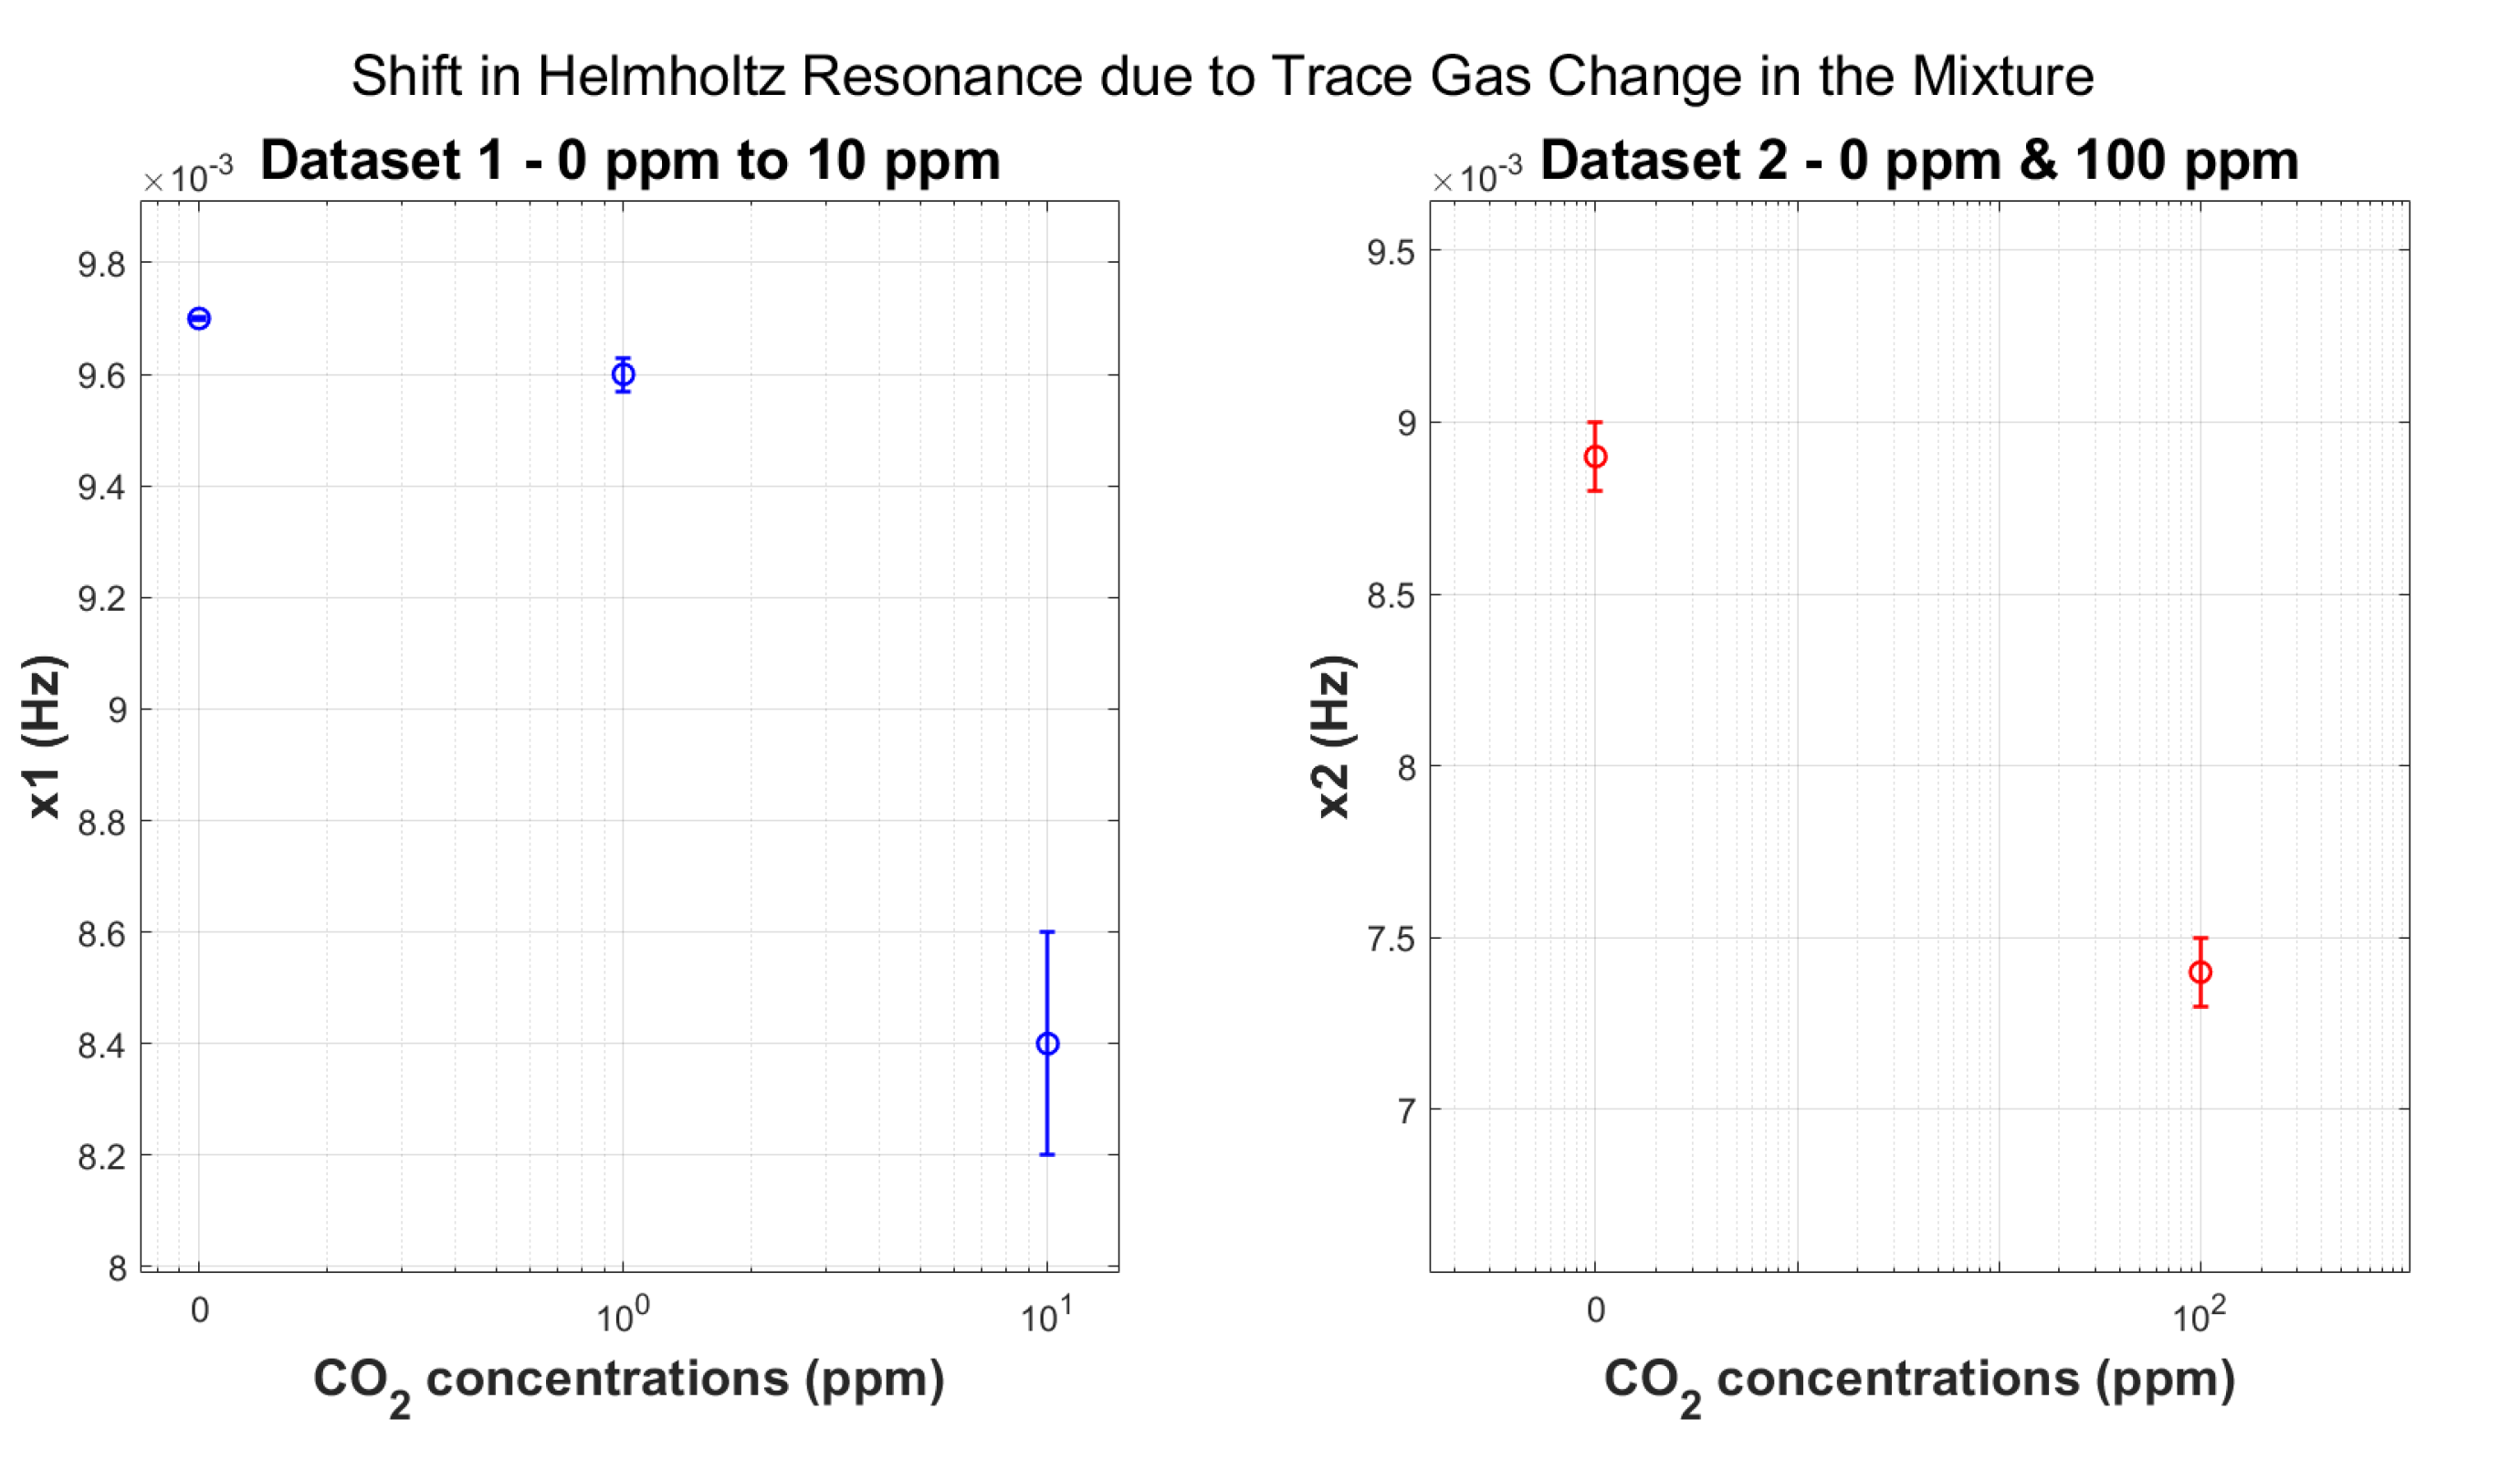
Figure 13. Effect of low CO2 concentration variations on the resonance frequency of the gas mixture at the fundamental mode centered around (35,218.3 + x1) Hz and (35,218.3 + x2) Hz.
Gases 05 00021 g013
These findings highlight the Helmholtz resonance method as a promising approach for high-precision gas sensing, potentially offering repeatability, improved sensitivity, and design flexibility compared with traditional acoustic resonance techniques.

5.5. Comparison

You can refer to the tables below for a final comparison between the multiple methodologies seen in this paper. For simplicity, we consider only two gas concentrations as a result of the limited literature available on the speed of sounds of gas mixtures. We can calculate the speed of sound for any gas mixture using the formula provided by NIMS Japan [23]. A comparison for maximum gas resolutions and the change in resonance frequency is made in Table 6. For simulations involving ideal case scenarios, the resolution is much better in comparison with two other methods explored in this paper. Both methods could reach a resolution of 1 ppm and showed repeatable changes in the resonance, although the geometry-independent Helmholtz method showed better results than the geometrical resonator. For precise regulation, monitoring, better resolution, and precision, a multivariate analysis in an enclosed system could turn valuable.

6. Conclusions

Experiments confirmed that resonance frequency shifts can be reliably detected down to 1 ppm CO2 concentrations in a N2-CO2 mixture, which offered improved sensitivity and reduced noise. The phase-locked loop (PLL) functionality of the Zurich Instruments MFIA enabled high-resolution tracking of frequency changes ranging from 20 to 200 µHz, as shown in Table 3. Furthermore, a geometry-independent sensing approach based on the Helmholtz resonance of MEMS microphones demonstrated sensitivity in the mHz range, as shown in Table 5, validating its effectiveness for applications demanding high resolution and repeatability. These methods complement traditional acoustic resonance techniques, expanding the toolkit for advanced gas sensing applications where even minute concentration shifts are important. Repeated experimental trials confirmed the reproducibility and stability of both configurations, providing a solid foundation for system reliability and statistical validation. In summary, the integration of geometric acoustic resonance with advanced measurement techniques, particularly phase-locked loop (PLL) tracking, has demonstrated a highly sensitive and reliable approach to trace gas sensing. The experiments and simulation models developed in this work have showcased their effectiveness in detecting minute shifts in resonance frequency corresponding to trace-level changes in gas concentrations and have also been shown to establish a goal for future investigations aimed at achieving similar levels of sensitivity. This hybrid sensing strategy not only enhances detection accuracy, but also offers scalability and adaptability for various sensing configurations. This study aims to provide proof-of-concept prototypes to exploit fundamental acoustic resonators. This work serves as a building block for multivariate precision gas sensing. Integrating machine learning algorithms could enable more nuanced analysis of multiple gas parameters simultaneously, eliminating the issue of cross-sensitivity with other gas mixtures. For this work, the experiments were set under laboratory conditions, and other critical influencing parameters such as environment temperature, pressure, humidity, and cross-sensitivity to other gases were monitored throughout the experiments using a reference NDIR gas sensor [21]. This ensured a minimum invariability of such parameters during the experiments. The proposed multivariate strategy can be extended and experimentally validated for detecting higher-priority gases in subsequent studies.

Author Contributions

Conceptualization, A.S.; methodology, A.S. and R.S.; software, A.S. and R.S.; validation, R.S.; formal analysis, A.S. and R.S.; investigation, A.S. and R.S.; resources, A.B. and A.D.; data curation, A.S. and R.S.; writing—original draft preparation, R.S. and A.S.; writing—review and editing, A.S., R.S., A.B. and A.D.; visualization, A.S. and R.S.; supervision, A.S., A.B. and A.D.; project administration, A.S.; funding acquisition, A.B. and A.D. All authors have read and agreed to the published version of the manuscript.

Funding

This work is partly supported by the German Federal Ministry of Research, Technology, and Space (BMFTR) under the Photonik für die Produktion framework, project 13N16786, ModPAS.

Acknowledgments

The authors thank BMFTR for their support of the work reported here.

Conflicts of Interest

The authors declare no conflicts of interest.

References

  1. What is a Gas Sensor. 2020. Available online: https://wiki.dfrobot.com/What_is_a_Gas_Sensor (accessed on 5 September 2024).
  2. Burge, S. 11 Most Common Flammable Gasses. ISFJ International Fire and Safety Journal, 1 March 2025. Available online: https://internationalfireandsafetyjournal.com/flammable-gasses/ (accessed on 11 April 2025).
  3. Sharma, A.; Eadi, S.B.; Noothalapati, H.; Otyepka, M.; Lee, H.D.; Jayaramulu, K. Porous materials as effective chemiresistive gas sensors. Chem. Soc. Rev. 2024, 53, 2530–2577. [Google Scholar] [CrossRef] [PubMed]
  4. Capone, S.; Forleo, A.; Francioso, L.; Rella, R.; Siciliano, P.; Spadavecchia, J.; Presicce, D.S.; Taurino, A.M. Solid state gas sensors: State of the art and future activities. J. Optoelectron. Adv. Mater. 2003, 5, 1335–1348. [Google Scholar] [CrossRef]
  5. Palzer, S. Photoacoustic-Based Gas Sensing: A Review. Sensors 2020, 20, 2745. [Google Scholar] [CrossRef] [PubMed]
  6. Yildirim, T.; Feng, M.Q.; Ngo, T.A.; Shiba, K.; Minami, K.; Yoshikawa, G. Dual domain acoustic olfactory discriminator. Sens. Actuators A Phys. 2023, 350, 114102. [Google Scholar] [CrossRef]
  7. Hijmans, R.A.; Puers, R. Resonant sensors: A review. J. Micromech. Microeng. 2016, 26, 123001. [Google Scholar]
  8. Meijer, G. Smart Sensor Systems; Wiley: Hoboken, NJ, USA, 2008. [Google Scholar]
  9. Eom, K.; Park, H.S.; Yoon, D.Y.; Kwon, T. Nanomechanical resonators and their applications in biological/chemical detection: Nanomechanics principles. Phys. Rep. 2011, 503, 115–163. [Google Scholar] [CrossRef]
  10. Nguyen, C.T.C. MEMS technology for timing and frequency control. IEEE Trans. Ultrason. Ferroelectr. Freq. Control 2007, 54, 251–270. [Google Scholar] [CrossRef] [PubMed]
  11. Martin, S.; Frye, G.; Spates, J.; Butler, M. Gas sensing with acoustic devices. In Proceedings of the 1996 IEEE Ultrasonics Symposium, San Antonio, TX, USA, 3–6 November 1996; Volume 1, pp. 423–434. [Google Scholar] [CrossRef]
  12. Kuttruff, H. Introduction to Acoustics; Taylor and Francis: Abingdon, UK, 2007. [Google Scholar]
  13. Berg, R.E. Encyclopedia Britannica. Acoustics. 2025. Available online: https://www.britannica.com/science/acoustics (accessed on 8 March 2025).
  14. Yildirim, T.; Feng, M.Q.; Shiba, K.; Minami, K.; Yoshikawa, G. A portable audible-range acoustical approach for determining headspace vapour-phase properties. Sens. Actuators A Phys. 2023, 358, 114438. [Google Scholar] [CrossRef]
  15. Miklós, A.; Hess, P. Application of acoustic resonators in photoacoustic trace gas analysis and metrology. Rev. Sci. Instruments 2001, 72, 1937–1955. [Google Scholar] [CrossRef]
  16. EDN. Acoustic Design for MEMS Microphones; STMicroelectronics, Inc.: Geneva, Switzerland, 2014. [Google Scholar]
  17. STM. Ultrasound Behavior and Guidelines of Analog MEMS Microphone IMP23ABSU; Technical report; STMicroelectronics, Inc.: Geneva, Switzerland, 2020. [Google Scholar]
  18. Strahl, T.; Steinebrunner, J.; Weber, C.; Wöllenstein, J.; Schmitt, K. Photoacoustic methane detection inside a MEMS microphone. Photoacoustics 2023, 29, 100428. [Google Scholar] [CrossRef] [PubMed]
  19. Met One Instruments. User Manual Metone.com CAL-200 Dilution Calibrator Version 1.0; Met One Instruments: Pass, OR, USA, 2022. [Google Scholar]
  20. COMSOL Multiphysics. Pressure Acoustics—User’s Guide. Available online: https://doc.comsol.com/5.5/doc/com.comsol.help.aco/aco_ug_pressure.05.002.html (accessed on 27 July 2025).
  21. Senseair, A.B. Senseair tSENSE VAV Display. Available online: https://senseair.com/product/senseair-tsense-vav-display/ (accessed on 1 August 2025).
  22. Engineering Toolbox. Molecular Weight of Substances; Engineering Toolbox: Los Angeles, CA, USA, 2023. [Google Scholar]
  23. Duquesnoy, M. Tuning Forks in Photoacoustic Spectroscopy: Comparative Study and New Developments. Ph.D. Thesis, Université Paris-Saclay, Gif-sur-Yvette, France, 2021. [Google Scholar]
Figure 1. Total acoustic pressure (Pa) generated at resonance of the cylindrical resonator (simulated).
Gases 05 00021 g001
Figure 2. CAD depiction of the cell geometry used for resonance tracking measurements, with the internal volume = 1.116 cm3.
Gases 05 00021 g002
Figure 3. MEMS microphone inserted into a standard metal package imitating a Helmholtz chamber.
Gases 05 00021 g003
Figure 4. Schematic diagram of a PLL with its components. The PLL generates an output signal that follows the phase and frequency of its input signal. It is implemented using a negative feedback closed loop.
Gases 05 00021 g004
Figure 5. Acoustic resonator geometry, L = 15 mm, R = 7 mm, valve opening = 1 mm.
Gases 05 00021 g005
Figure 6. Block diagram of the system used to determine the acoustic resonance of the resonator with varying CO2 concentrations.
Gases 05 00021 g006
Figure 7. Work flow for higher CO2 concentrations using sweep functionality (left) and lower CO2 concentrations using PLL functionality (right) using Zurich Instruments MFIA.
Gases 05 00021 g007
Figure 8. (ac) Measurement of length of the inlet port; (df) measurement of height of the chamber.
Gases 05 00021 g008
Figure 9. 4-Octagon membrane structure with diameter pro Octagon ≈ 777 μm.
Gases 05 00021 g009
Figure 10. Impact of varying CO2 concentrations on the resonance frequency of the gas mixture from 100% to 10% in a N2/CO2 mixture. In addition to frequency values on the X-axis, the plot shows the corresponding microphone output voltage on the Y-axis, with the microphone sensitivity = 12.59 mV/Pa.
Gases 05 00021 g010
Figure 11. Effect of low CO2 concentration variations on the resonance frequency of the gas mixture at the fundamental mode centered around (11,677.884 + x1) Hz and (11,651.917 + x2) Hz.
Gases 05 00021 g011
Figure 12. Experimentally observed Helmholtz resonance of TDK ICS 40730 between 30 and 35 kHz with the help of Zurich Instruments MFIA.
Gases 05 00021 g012
Table 1. Gas sensor types with associated physical changes, sensitivity, and resolution ranges.
No.Sensor TypePhysical ChangeSensitivity (ppm)Resolution (ppm)
1SemiconductorElectrical conductivity5–5000.1–10
2Field effectElectrical polarization0.1–1000.01–1
3PiezoelectricMass0.1–1000.01–1
4OpticalOptical parameters0.1–10000.01–10
5CatalyticHeat/temperature100–10,00010–100
6ElectrochemicalEMF or current0.05–5000.01–1
Table 2. Gas mixture calculations w.r.t flow rates for trace CO2 concentrations.
Required CO2 in the Mixture (ppm)Input CO2 (%)CO2 Flow (slm)N2 Flow (slm)
1000.50.0010.049
100.020.0010.019
10.010.0010.099
Table 3. Average change in resonance frequency ( δ f ) values for different CO2 concentrations at the first mode.
ReferenceCO2 Concentration (ppm) δ f
N2—Group 1125
N2—Group 110141
N2—Group 2100200
Table 4. Simulated resonance shift ( δ f ) from the center frequency due to trace gas variations in the mixture.
Change in CO2 Concentration (ppb) w.r.t N2Change in Frequency ( δ f ) (mHz)
108
10012
100028
10,00076
Table 5. Average δ f values of Helmholtz for different CO2 concentrations.
ReferenceCO2 Concentration [ppm] δ f at Helmholtz (mHz)
N2—Group 110.085
N2—Group 1101.2
N2—Group 21001.4
Table 6. Comparison between the different gas sensing types experimented in this paper.
TypeMaximum Resolution (ppm) δ f (mHz)
Acoustic resonator (Simulated)0.0018
Acoustic resonator10.025
Helmholtz resonator10.085
Disclaimer/Publisher’s Note: The statements, opinions and data contained in all publications are solely those of the individual author(s) and contributor(s) and not of MDPI and/or the editor(s). MDPI and/or the editor(s) disclaim responsibility for any injury to people or property resulting from any ideas, methods, instructions or products referred to in the content.