Article

Study on the Temporal and Spatial Migration Patterns of Blast Smoke in the Mining Area and Optimization of Effective Range

School of Mining and Geomatics Engineering, Hebei University of Engineering, Handan 056038, China
*
Author to whom correspondence should be addressed.
Gases 2025, 5(3), 20; https://doi.org/10.3390/gases5030020
Submission received: 18 July 2025 / Revised: 22 August 2025 / Accepted: 26 August 2025 / Published: 1 September 2025

Abstract

To prevent toxic and harmful gas suffocation accidents in underground metal mine stopes, the Fluent numerical simulation method was employed to investigate the wind field distribution patterns and the diffusion laws of blasting fumes in stopes with and without middle–end roadways under varying effective ranges. The simulation accuracy was validated through laboratory experiments. The results demonstrate that over time, the CO concentration in the blasting area decreases, while in other regions of the stope, it initially increases before declining. The presence or absence of a middle roadway does not significantly alter the migration and diffusion behavior of blasting fumes in the stope. When the effective range is ER–1, the simulation error is only 8 s. As the effective range increases, the time required to reduce the CO concentration to 24 ppm on the respiratory plane, across the entire space, and at the monitoring point follows a linearly increasing trend. Meanwhile, the maximum wind speed at the working face exhibits a linearly decreasing trend, whereas the peak CO concentration shows a linearly increasing trend. Under the ER–1 effective range, the CO concentration can be reduced to a safe threshold more rapidly. The experimental and simulation results exhibit an error margin within 16.97%, confirming the accuracy of the numerical simulation.

1. Introduction

The panel caving method without sill pillars has become a predominant mining technique in underground metal and nonmetal operations due to its high efficiency and cost–effectiveness. However, this method presents substantial risks of toxic fume exposure. The intensive blasting operations inherent to caving methods generate copious amounts of noxious fumes, severely contaminating the underground work environment. This contamination frequently leads to toxic gas poisoning incidents, resulting in both human casualties and significant economic losses. As a consequence, numerical simulation of hazardous gas dispersion in metal mining operations has become critically important, attracting growing research attention [1,2,3].
Current research methodologies for investigating blasting fume dispersion patterns in stopes primarily involve numerical simulations and experimental approaches. In experimental studies, Cao et al. [4] systematically examined the effects of varying airflow velocities on blasting fume migration patterns in tunneling roadways. Koutsoukos et al. [5] conducted comprehensive experimental investigations into CO dispersion dynamics following blasting operations. Through experimental analysis, Liu et al. [6] and Hua et al. [7] characterized the movement behavior of blasting particulates in diversion tunnels. Gao et al. [8] developed a novel computational model for blast excavation ventilation requirements based on experimental data. Furthermore, Li et al. [9] quantitatively analyzed CO transport mechanisms in blasting fumes under different ventilation conditions through controlled experiments.
In numerical simulation research, Wang et al. [10] conducted computational fluid dynamics (CFD) analyses to investigate how stope dimensions affect blasting fume dispersion patterns. Through numerical modeling, Cong et al. [11] and Souza et al. [12] systematically examined the correlation between CO concentration dynamics in blasting fumes and stope environmental parameters. Huang et al. [13] employed numerical simulations to quantify the impacts of ventilation duct positioning, airflow volume, and elevation on particulate matter transport. Ma et al. [14] performed parametric studies using numerical methods to evaluate the effects of duct installation height and diameter on CO dispersion characteristics. Furthermore, Wang et al. [15] developed comprehensive numerical models to analyze the influence of duct diameter and outlet velocity on CO diffusion behavior in underground mining environments.
In summary, most scholars have used CO in blasting fumes as the medium to investigate the transport and diffusion of blasting fumes in stopes. Existing research has primarily focused on factors such as air velocity, duct diameter, and roadway length and their effects on fume dispersion. However, fewer studies have examined the influence of the distance from the duct outlet to the working face and the presence or absence of a mid–section roadway on blasting fume dispersion patterns.
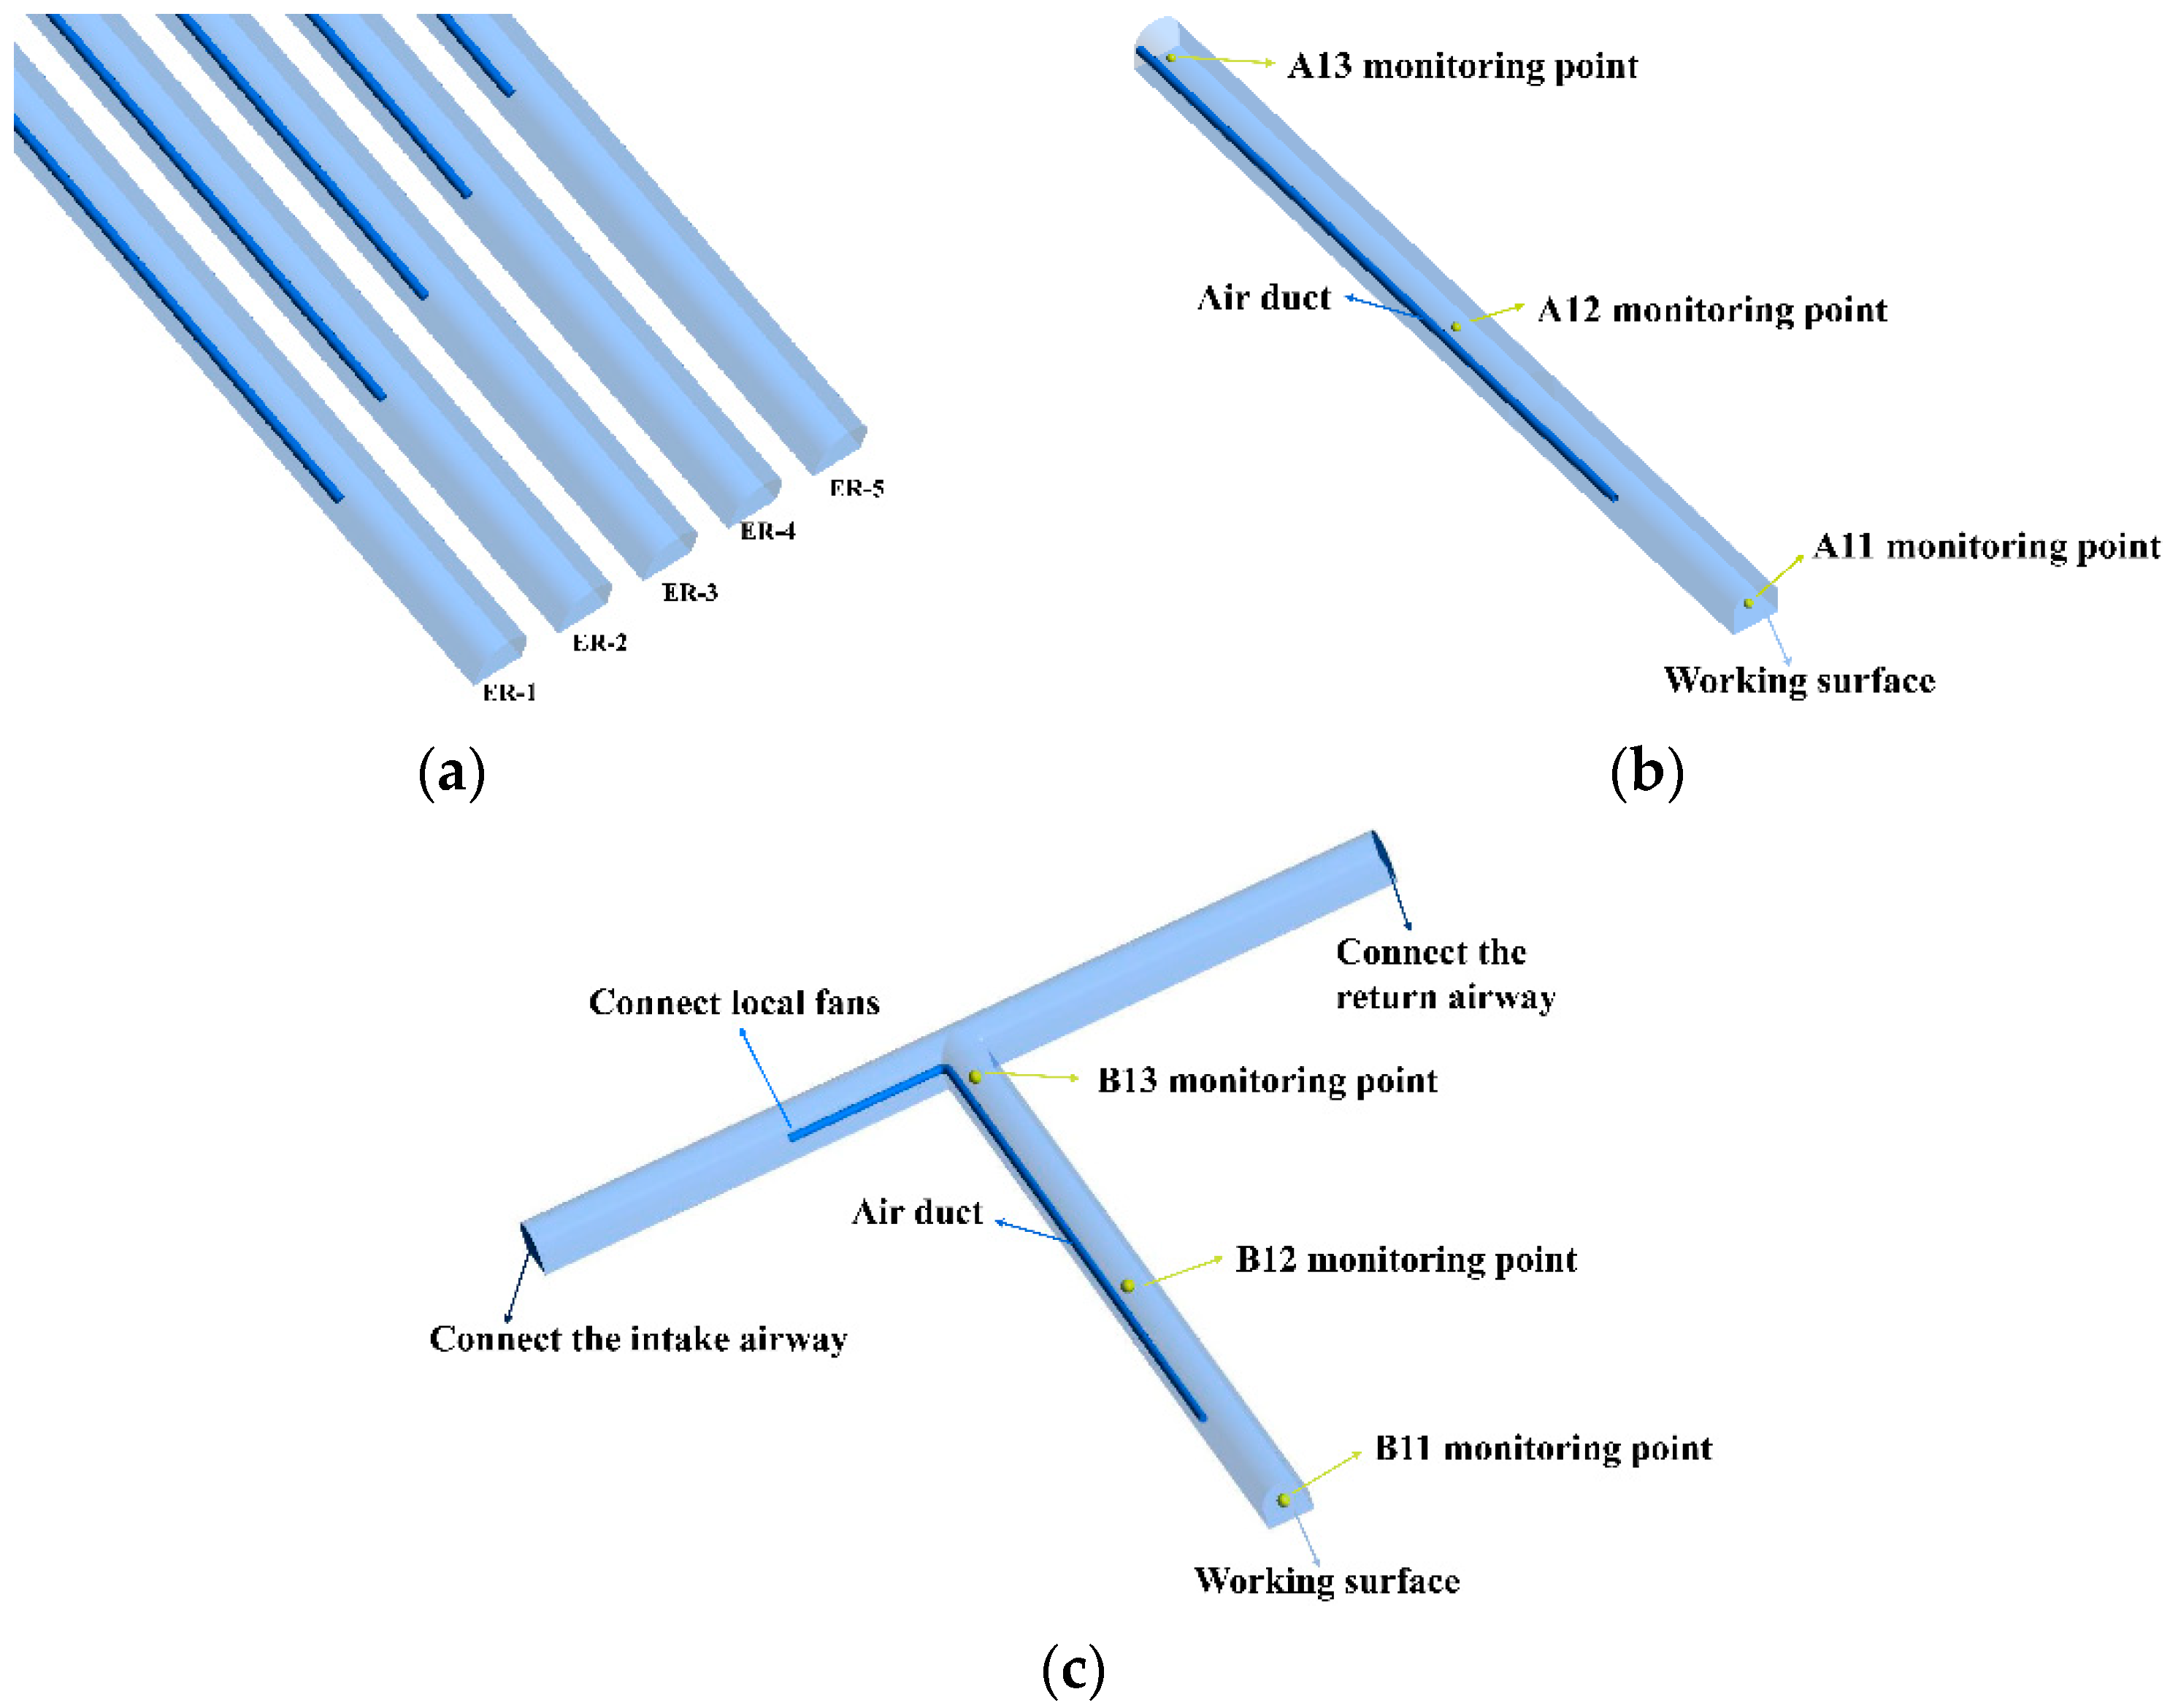
According to industry standards, the duct outlet should be positioned within the effective airflow range (ER) of the working face. The ER is a variable defined as (4–5)√A, where A is the cross–sectional area of the roadway. However, in practice, this distance is often determined empirically rather than through precise calculations. To minimize the time required to reduce blasting fumes to safe concentrations and enhance operational efficiency, this study adopts CO in blasting fumes as the test medium. Considering the presence or absence of a mid–section roadway, five effective airflow ranges (ER) were selected at equal intervals within the standard range: 4.0√A (ER–1), 4.25√A (ER–2), 4.50√A (ER–3), 4.75√A (ER–4), and 5.0√A (ER–5). Using Fluent numerical simulation, we analyzed the airflow distribution and blasting fume dispersion under forced ventilation for these five ER scenarios, both with and without a mid–section roadway. Experimental validation was conducted to verify the simulation results, providing theoretical guidance for optimizing on–site ventilation design.

2. Grid Division and Parameter Setting

2.1. Basic Control Equation of Gun Smoke Diffusion

In modeling carbon monoxide dispersion from blasting operations, the following fundamental assumptions were adopted: (1) Chemical inertness: CO gas maintains invariant thermophysical properties throughout the simulation domain without participating in chemical reactions. (2) Singular emission source: CO generation originates exclusively from blasting–induced gas liberation, with negligible contributions from anthropogenic respiration or strata outgassing. (3) Isothermal atmospheric conditions: The roadway microenvironment maintains constant thermodynamic parameters including temperature (298 K), relative humidity (45%), atmospheric pressure (101.325 kPa), and gravitational acceleration (9.81 m/s2). (4) Ideal fluid behavior: Both CO contaminant and ventilation air streams are treated as incompressible Newtonian fluids with negligible viscous effects. (5) Initial purity condition: The ventilation system delivers CO–free air prior to detonation events, establishing zero baseline concentration at simulation initialization. (6) Binary gas system: The species transport model [16] governs the transient advection–diffusion interaction between CO and fresh air, as mathematically described by Equation (1):
𝜕 ρ w 𝜕 t + 𝜕 ρ u i w 𝜕 x i = 𝜕 𝜕 x i ρ D m 𝜕 w 𝜕 x i
where w is the mass fraction of each component, t [s] is time, ui [m/s] is the velocity component in the i–direction, xi is the fluid’s heat transfer coefficient, and Dm [m2/s] is the turbulent diffusion coefficient.
The ANSYS Fluent computational framework incorporates three Reynolds–Averaged Navier–Stokes– (RANS) turbulence closure models: the baseline k–epsilon formulation, Renormalization Group (RNG) variant, and realizable configuration. Through comparative analysis of wall–bounded flow characteristics [17], the standard k–epsilon model demonstrates superior predictive accuracy for confined turbulent flows with moderate pressure gradients–a fundamental feature of underground ventilation systems. This empirical validation motivates our implementation of the standard k–epsilon approach to resolve. The governing transport equations for turbulent kinetic energy (k) and its dissipation rate (ε) are, respectively, expressed as
𝜕 ρ K 𝜕 t + 𝜕 ρ u i K 𝜕 x i = 𝜕 𝜕 x i μ + μ t σ k 𝜕 K 𝜕 x i + P k + G b ρ ε Y M + S k
𝜕 ρ ε 𝜕 t + 𝜕 ρ u i ε 𝜕 x i = 𝜕 𝜕 x i μ + μ t σ ε 𝜕 ε 𝜕 x i + C 1 ε ε K G K + C 3 ε G b C 2 ε ρ ε 2 K + S ε
where K [m2/s2] is the turbulent kinetic energy, ε [m2/s3] is the dispersion rate, μ [Pa·s] and μt [Pa·s] are the dynamic viscosity of fluid, σk and σε are the Prandtl number corresponding to the k–equation and the ε–equation, Pk [m2/s2] is the turbulent kinetic energy generated by laminar velocity gradient, Gb [m2/s2] is the turbulent kinetic energy generated by buoyancy, Gk [m2/s2] is the turbulent kinetic energy caused by average velocity gradient, YM, is the fluctuations due to transition diffusion in compressible turbulent flows, C1ε, C2ε and C3ε, are the empirical constant, Sk and Sε are the user–defined source items.

2.2. Physical Model and Mesh Division

Through the measurement of the well, the length of the stope is 80 m, the size of the central roadway is 84.5 m, the left and right are symmetrical, and the section size is 42.25 m. The cross–section consists of a straight–wall semi–circular arch with a 2 m wall height and a 4.5 m diameter. A 0.8 m diameter ventilation duct was incorporated, providing an outlet air velocity of 4 m/s, while measurement stations (ER–1 to ER–5) were positioned as shown in Figure 1a. Research points A11/B11, A12/B12, and A13/B13 were established along the breathing plane at 2 m, 40 m, and 78 m from the working face, respectively. The excavation face was geometrically modeled using ANSYS SpaceClaim 2025, where lines and surfaces were constructed and extruded to develop the final solid structure, as illustrated in Figure 1b,c.
Six mesh types were evaluated: polyhedral, tetrahedral, polyhedral–hexahedral hybrid, tetrahedral–hexahedral hybrid, and hexahedral. Mesh quality was optimized using Fluent Meshing’s enhanced volume meshing and node movement, with minimum mesh quality, skewness, and aspect ratio as evaluation criteria. The results demonstrated that when the minimum mesh quality exceeded 0.5, skewness remained below 0.3, and the aspect ratio was maintained between 1 and 3, the polyhedral–hexahedral hybrid mesh exhibited the fewest iterations and shortest computational time. Consequently, the polyhedral–hexahedral hybrid mesh was selected for this study. In order to better display the surface mesh of the model, the middle part of the model is hidden, as shown in Figure 2a,b, and the cross–section mesh is shown in Figure 2c.
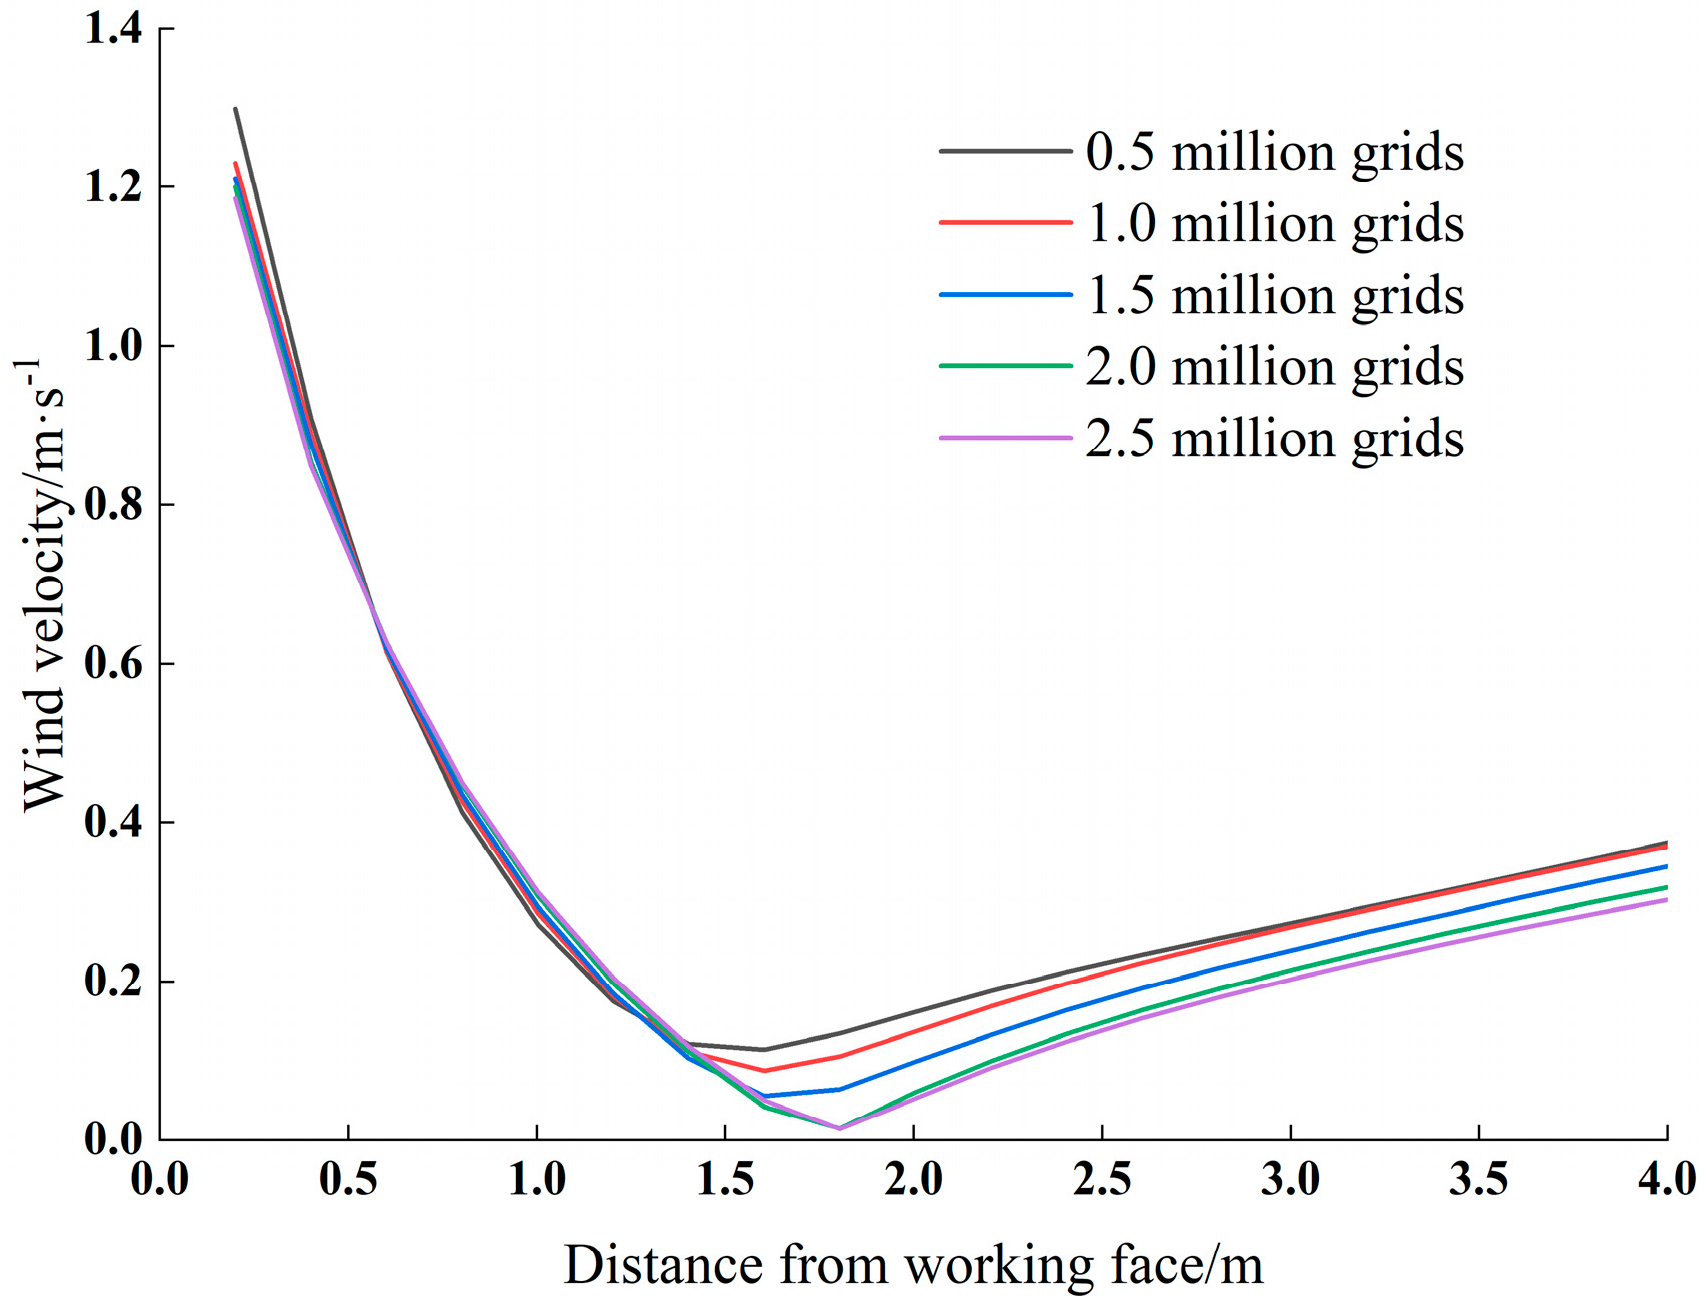
Due to the presence of vortex regions near the working face, significant wind speed variations were observed. To characterize these fluctuations, a 4 m– straight monitoring line (AB) was established at breathing plane height within the mining area, as shown in Figure 3. Wind speed distributions along this monitoring line were compared across different mesh densities to identify an optimal mesh size that achieves both computational efficiency and solution accuracy.
As illustrated in Figure 4, simulations were performed with grid resolutions of 0.5 million, 1.0 million, 1.5 million, 2.0 million, and 2.5 million cells. The minimum wind speeds recorded were 0.114 m/s, 0.08 m/s, 0.05 m/s, 0.015 m/s, and 0.014 m/s, occurring at distances of 1.6 m, 1.6 m, 1.6 m, 1.8 m, and 1.8 m from the working face, respectively. The relative errors between successive grid refinements (0.5 million vs. 1.0 million, 1.0 million vs. 1.5 million, 1.5 million vs. 2.0 million, and 2.0 million vs. 2.5 million) were 42.5%, 60.0%, 233%, and 7.1%, respectively. Despite these variations, the overall wind speed distributions exhibited consistent behavior.
Based on this analysis, a grid resolution of 2.0 million cells was selected as the optimal balance between accuracy and computational efficiency. The corresponding mesh parameters included a minimum surface size of 0.014 m, maximum surface size of 0.14 m, minimum volume cell size of 0.014 m, and maximum volume cell size of 0.112 m. These settings were then uniformly applied to the remaining nine models in the study.

2.3. Calculation Model Settings

It is necessary to introduce CO in the numerical simulation of blasting smoke in tunneling roadway. Compared with the numerical simulation of wind field in tunneling roadway, the length of throwing area should be set in the numerical simulation of blasting smoke migration, and the initial concentration should be set in the throwing area for simulation research.
The length of the blasting smoke throwing area after blasting is shown in Equation (4):
L i = 15 + m 5 = 15 + 30 5 = 21
where Li [m] is the throwing length of gun smoke, m [kg] is the explosive detonation quantity.
Assuming that CO is evenly distributed in the throwing area after blasting, the percentage calculation equation of CO is:
E = C × M 1000
where E [%] is the percentage of CO, C [mol/m3] is the initial molar concentration of CO, M [L/mol] is the volume of unit molar CO under standard conditions.
The calculation of initial CO molar concentration is shown in Equation (6):
C = m × q × ρ M × V
where q [L/Kg] is the volume of CO generated during the explosion of unit mass No. 2 rock explosive, p [1.25 g/L] is the density of CO, V [m3] is the throwing area volume, M [28 g/mol] is the CO molar mass.
When the amount of No. 2 rock emulsion explosive is 30 kg, the dispersion distance of the cannon smoke is 21 m, and the concentration of CO in the dispersion area is 1770 ppm. The computational domain was initialized with gravitational acceleration vector (9.81 m/s2 magnitude) aligned with the negative Y–direction. Pressure–velocity coupling was resolved through the SIMPLE algorithm for steady–state ventilation analysis, employing second–order spatial discretization for momentum and scalar transport equations. Solution convergence was declared when residual magnitudes fell below 1 × 10⁻⁴ for all governing equations [18]. The species transport model was activated during the simulation of blasting fume dispersion to calculate gas components without accounting for chemical reactions. Simulation verification indicated that the PISO algorithm converges more readily than the SIMPLE algorithm [19]. Consequently, the PISO algorithm was selected for the numerical simulation of roadway blasting fumes, while maintaining the second–order upwind discretization scheme. To ensure solution stability, convergence factors were adjusted appropriately, with the transient time step set to 1 s to enhance convergence [20]. Additionally, both the pressure and momentum relaxation factors were modified to 0.5. The verification of numerical simulation will be introduced in detail later.

3. Analysis of Wind Field Distribution Results

3.1. The Distribution of Velocity and the Patterns of Streamlines in the Horizontal Cross–Section

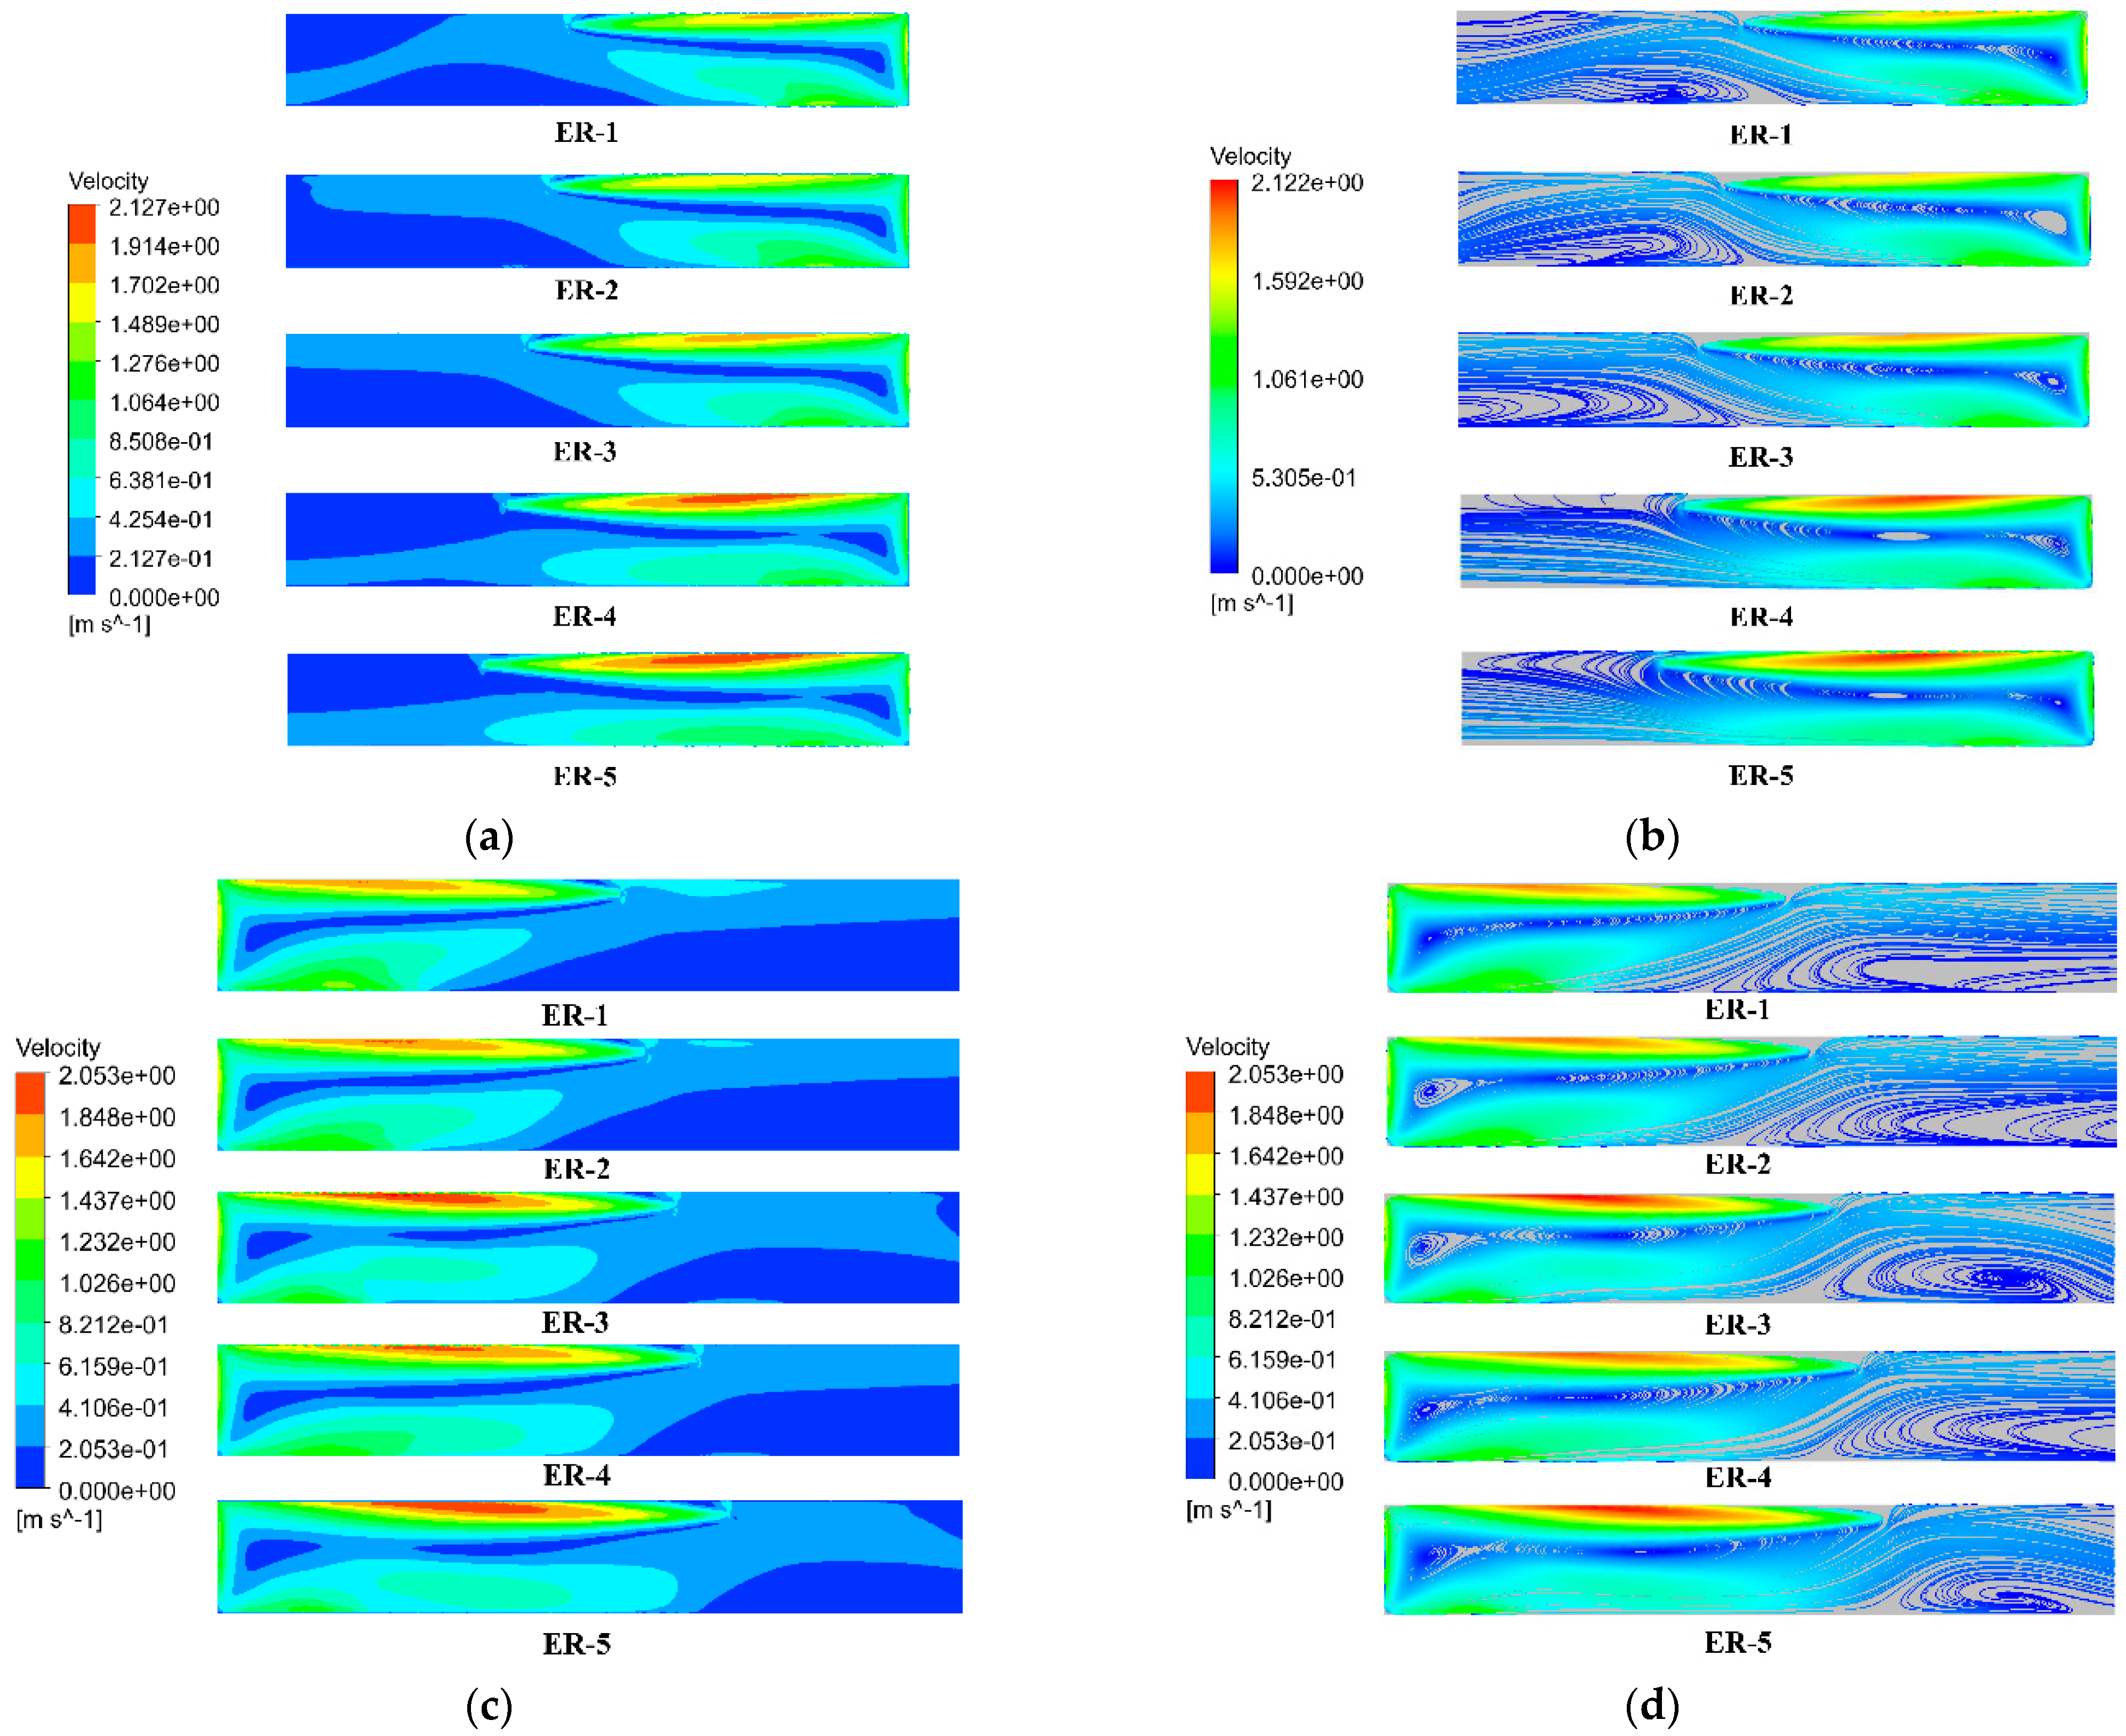
The horizontal cross–section at a breathing height of 1.5 m is chosen as the study object. The wind speed and trajectory plots without the influence of a mid–range tunnel at different effective ranges are presented in Figure 5a,b. The wind speed and trajectory plots with the influence of a mid–range tunnel are shown in Figure 5c,d.
As illustrated in Figure 5, regardless of the presence of a mid–tunnel, the jet flow from the ventilation duct entrains surrounding air, thereby expanding its influence range. However, confined by the tunnel space, the jet impinges on the walls, inducing backflow and subsequent air expulsion. Upon reaching the working face, the airflow reverses direction toward the tunnel entrance, forming distinct entrainment and discharge boundaries. Streamline analysis reveals complex flow structures in the excavation zone, characterized by vortex regions that expand with increasing jet distance. This phenomenon arises because the airflow moving toward the stope exit collides with the jet flow from the ventilation duct outlet. In accordance with the principles of energy and momentum conservation, some air molecules lose momentum, while others begin to rotate under the combined influence of the duct airflow and the outgoing stope airflow. Consequently, a well–defined vortex zone forms within the stope, where the airflow becomes nearly stagnant or recirculates. As the jet range increases, the distance between the duct outlet and the working face also extends. This greater separation enlarges the interaction space between the duct airflow and the stope exit airflow, resulting in a progressive expansion of the vortex zone.

3.2. Distribution of Wind Speed

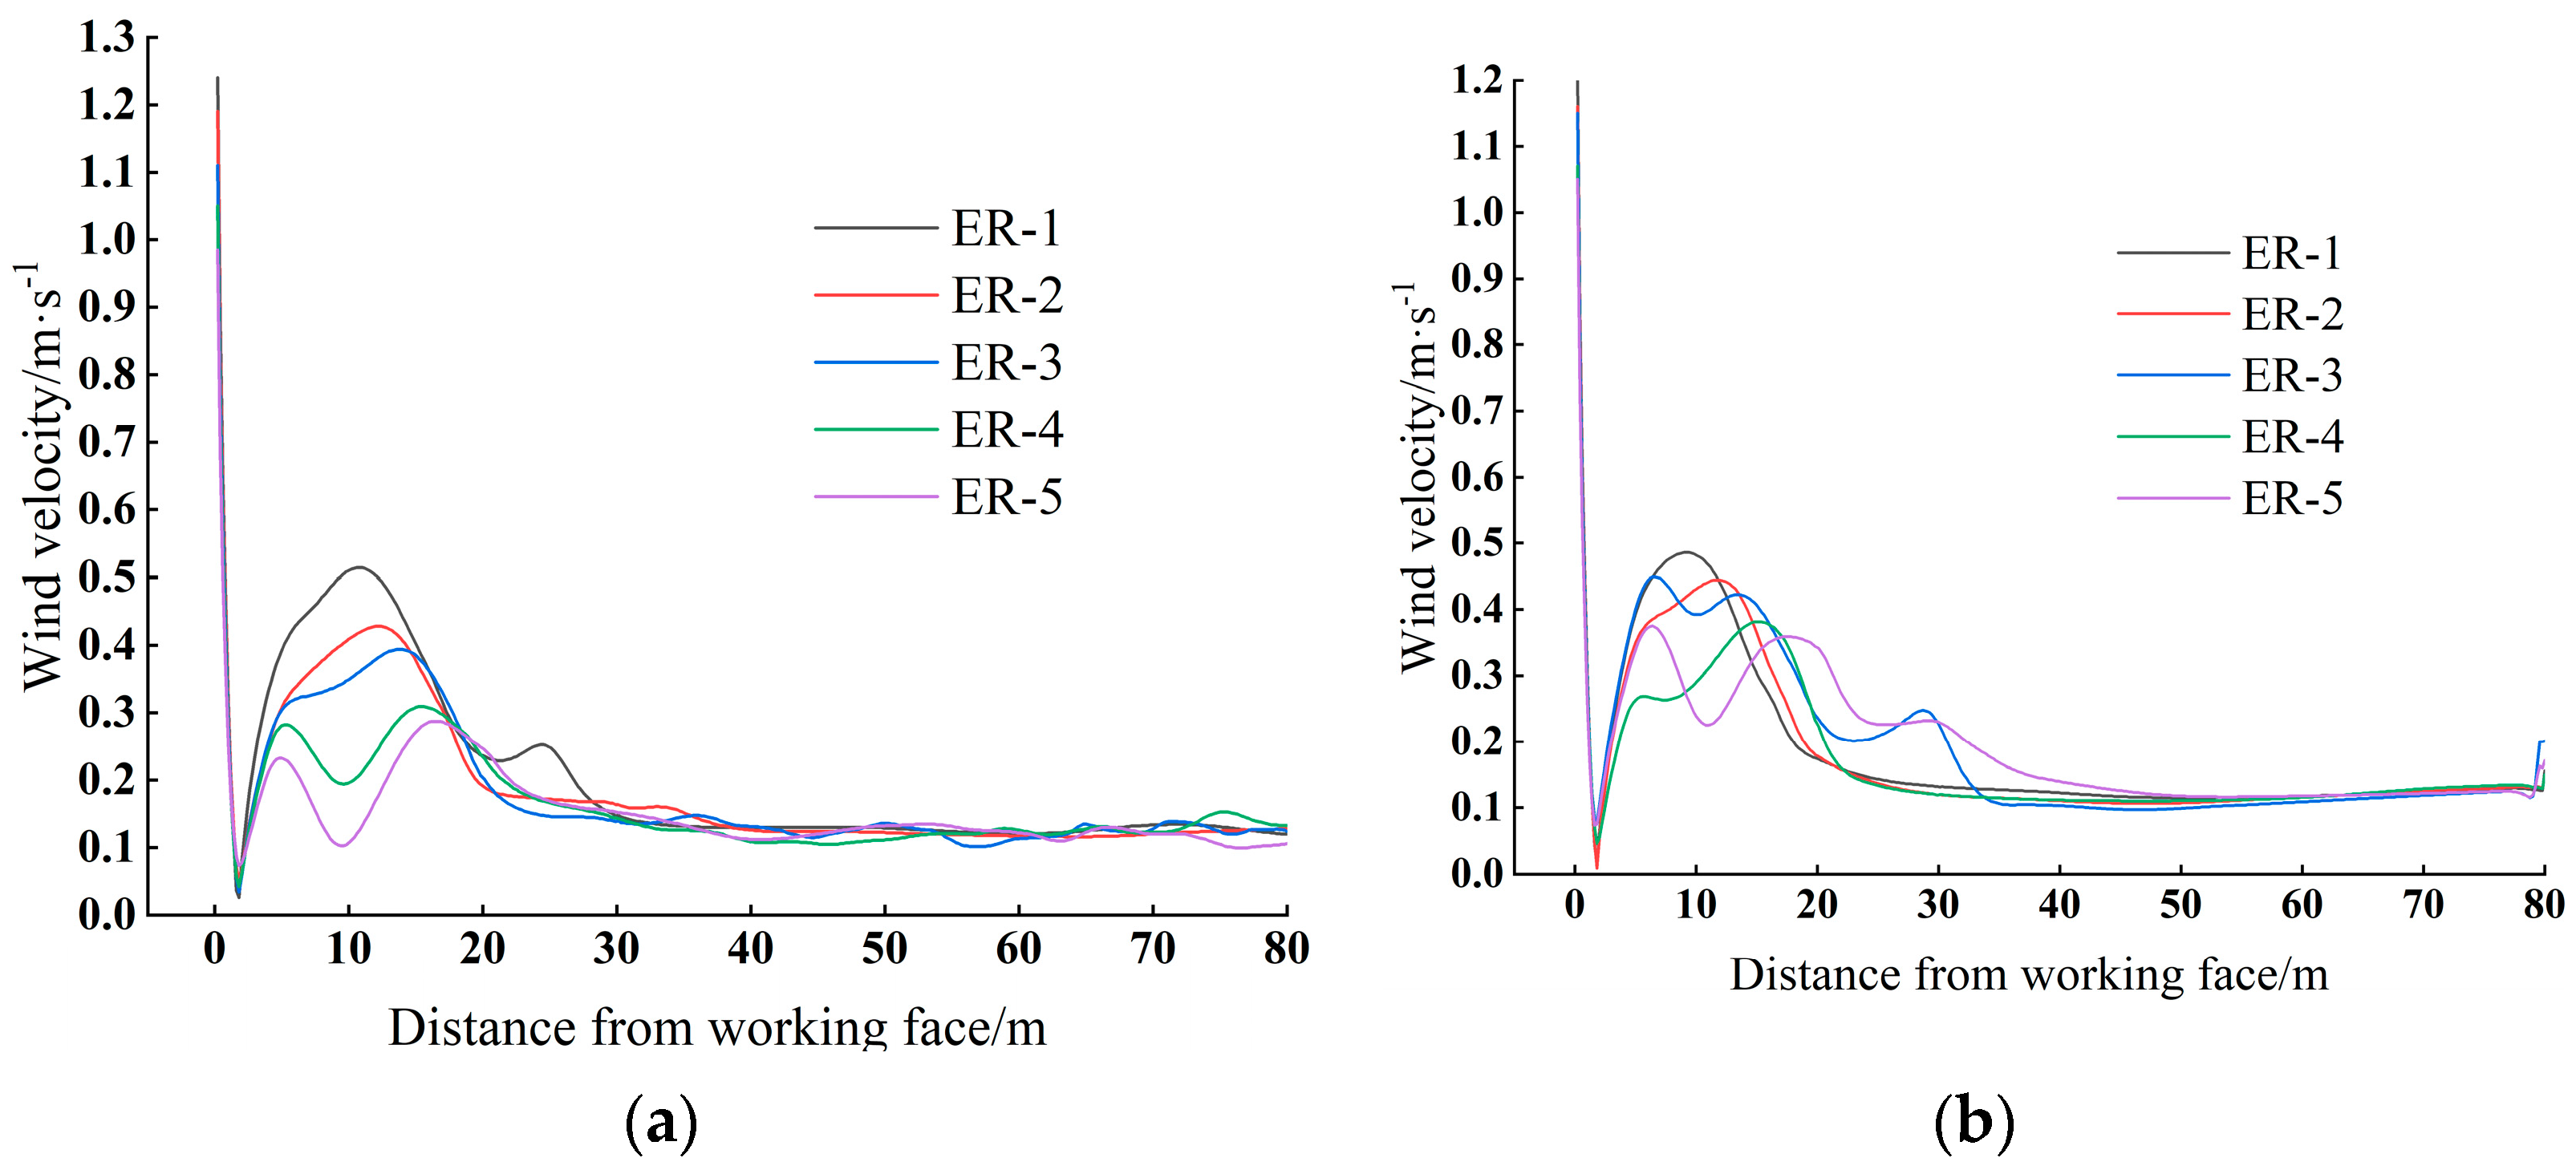
At the height of the breathing plane in the mining site, an 80 m– straight line is established in the middle section, which is divided into 400 points. This results in the wind speed variation with respect to position as illustrated in Figure 6.
Figure 6 demonstrates that for both configurations (with and without a mid–tunnel), the airflow velocity in the projection zone follows a consistent trend across all five effective ranges: an initial decrease, followed by an increase, and a final reduction. However, when a mid–tunnel is present, velocities within 0.5 m of the stope exit exhibit an average increase of 0.051 m/s. This enhancement arises from pressure differentials between the mid–tunnel and the 0–0.5 m exit zone, causing partial airflow diversion from the mid–tunnel into this region during ventilation. The resulting induced airflow increases the airflow velocity near the outlet of the stope.

3.3. Distribution Law of Wind Speed at Working Face

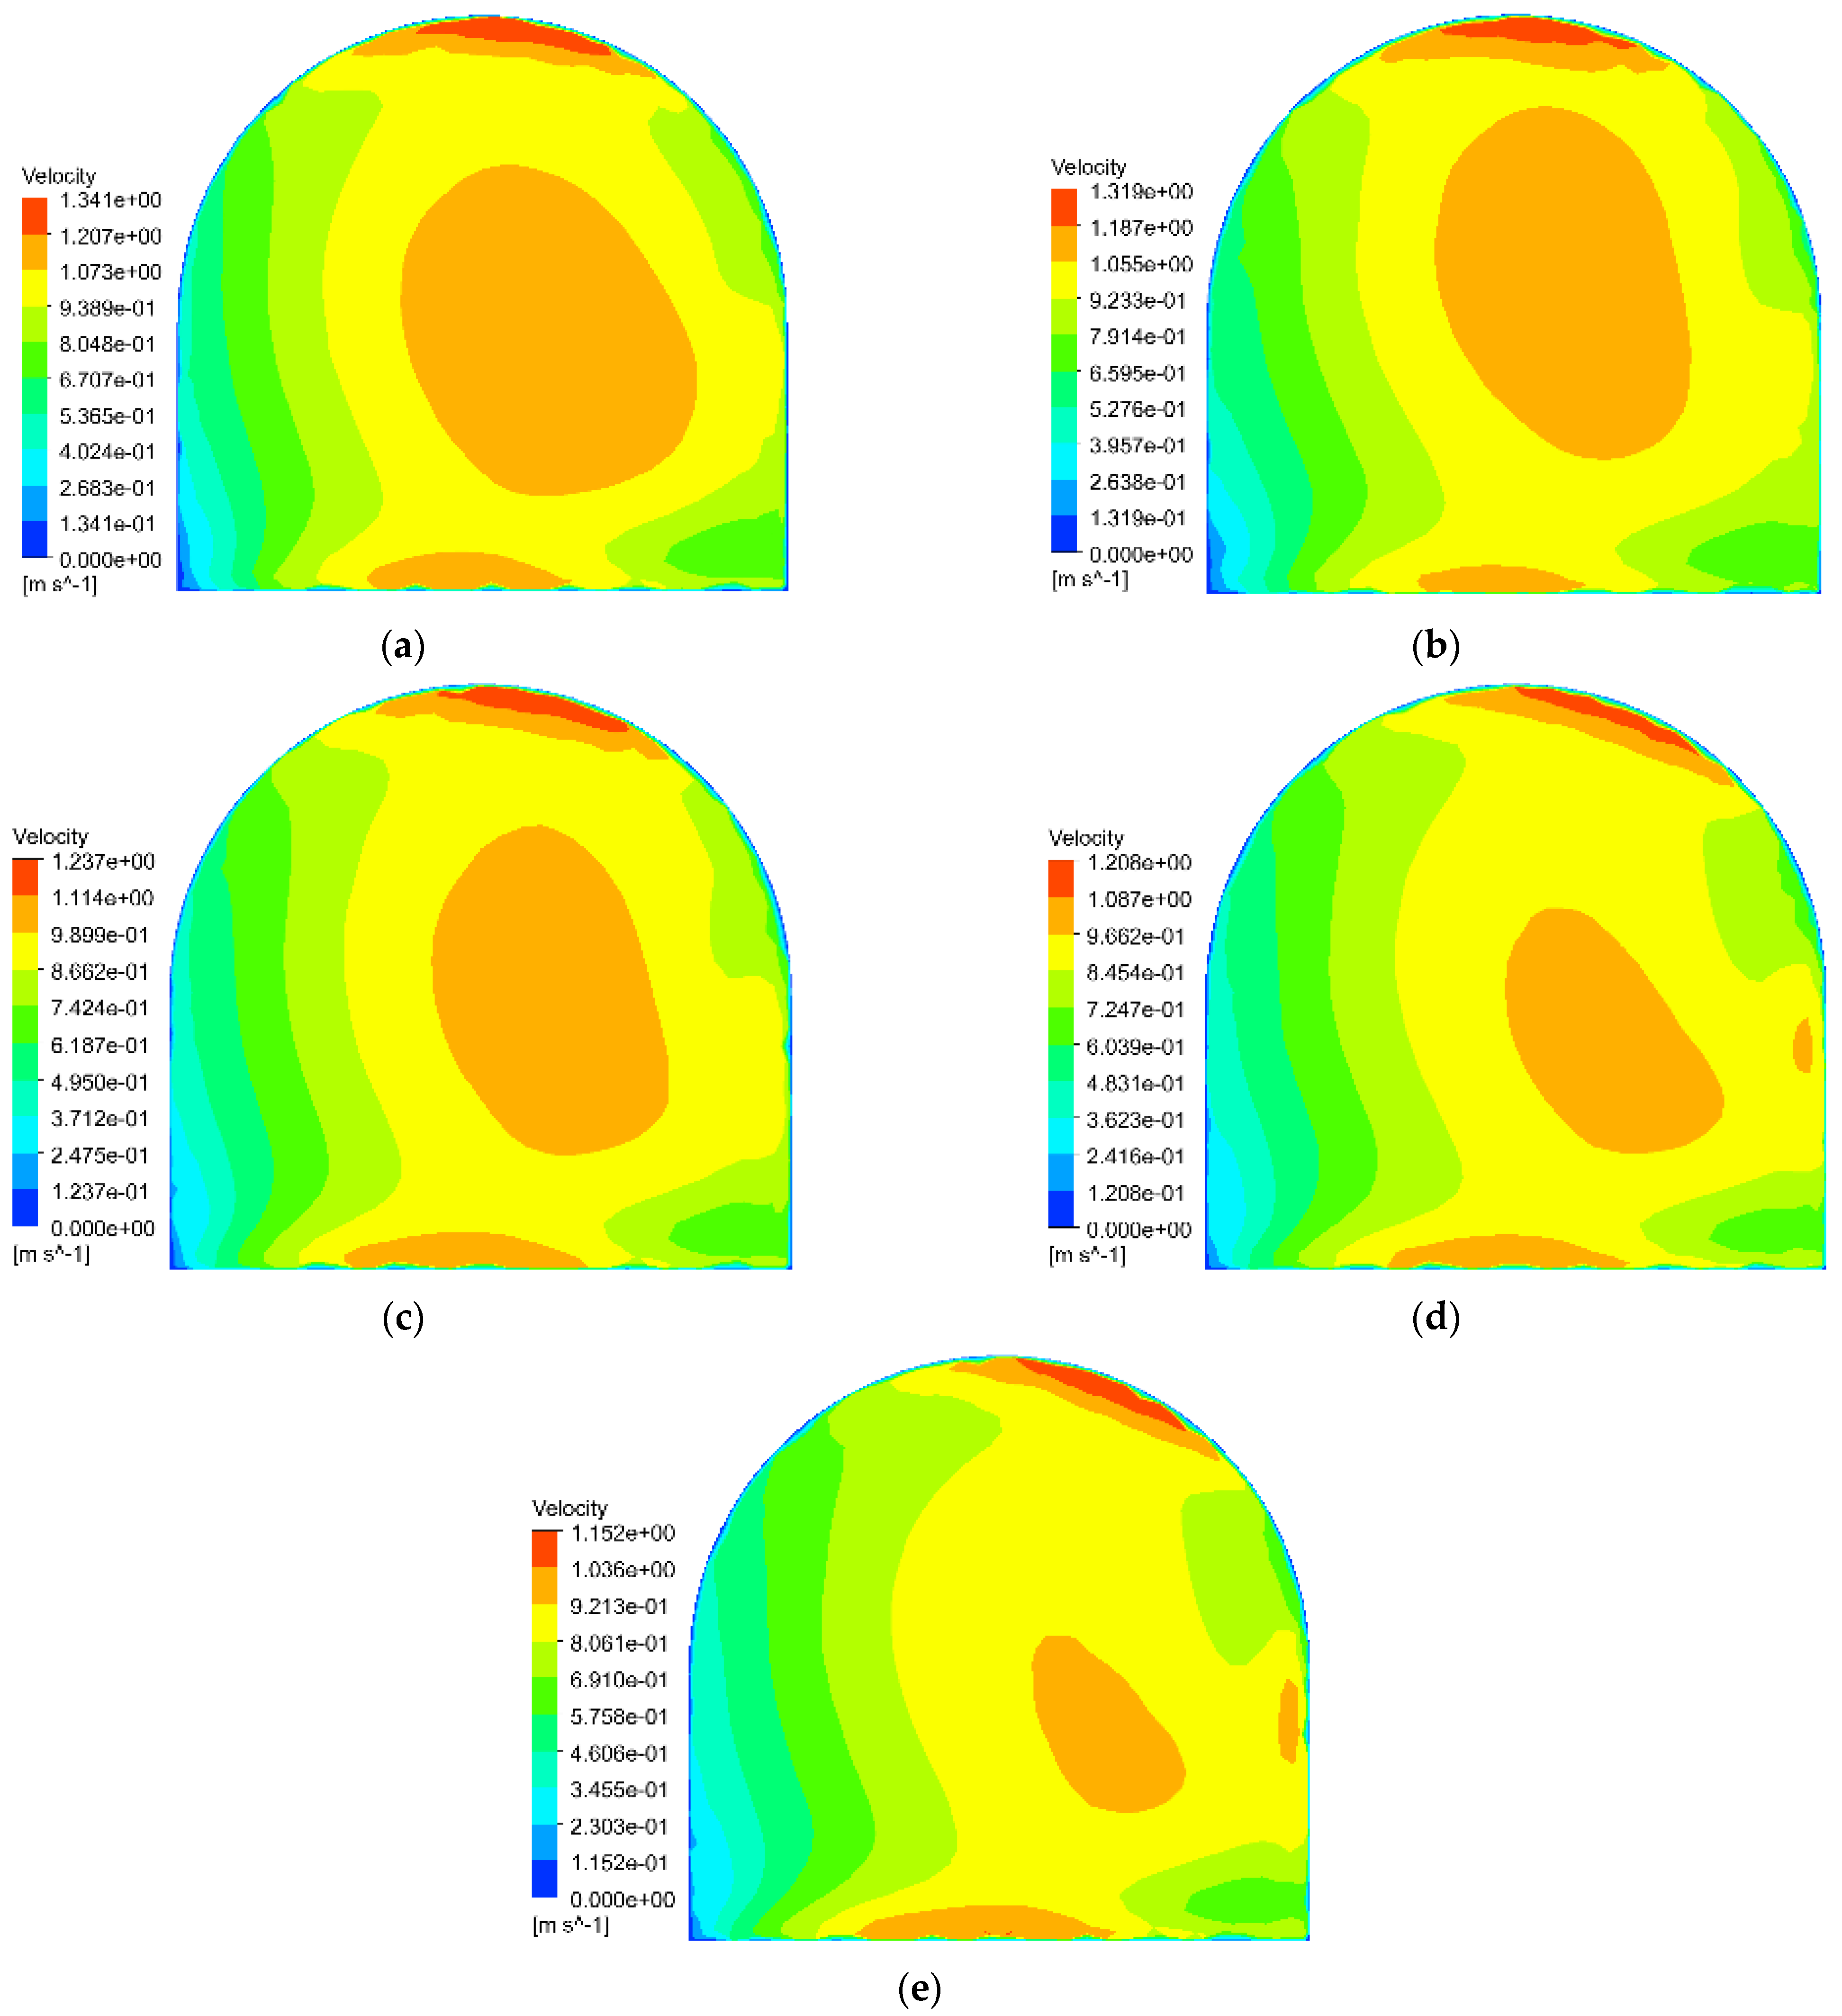
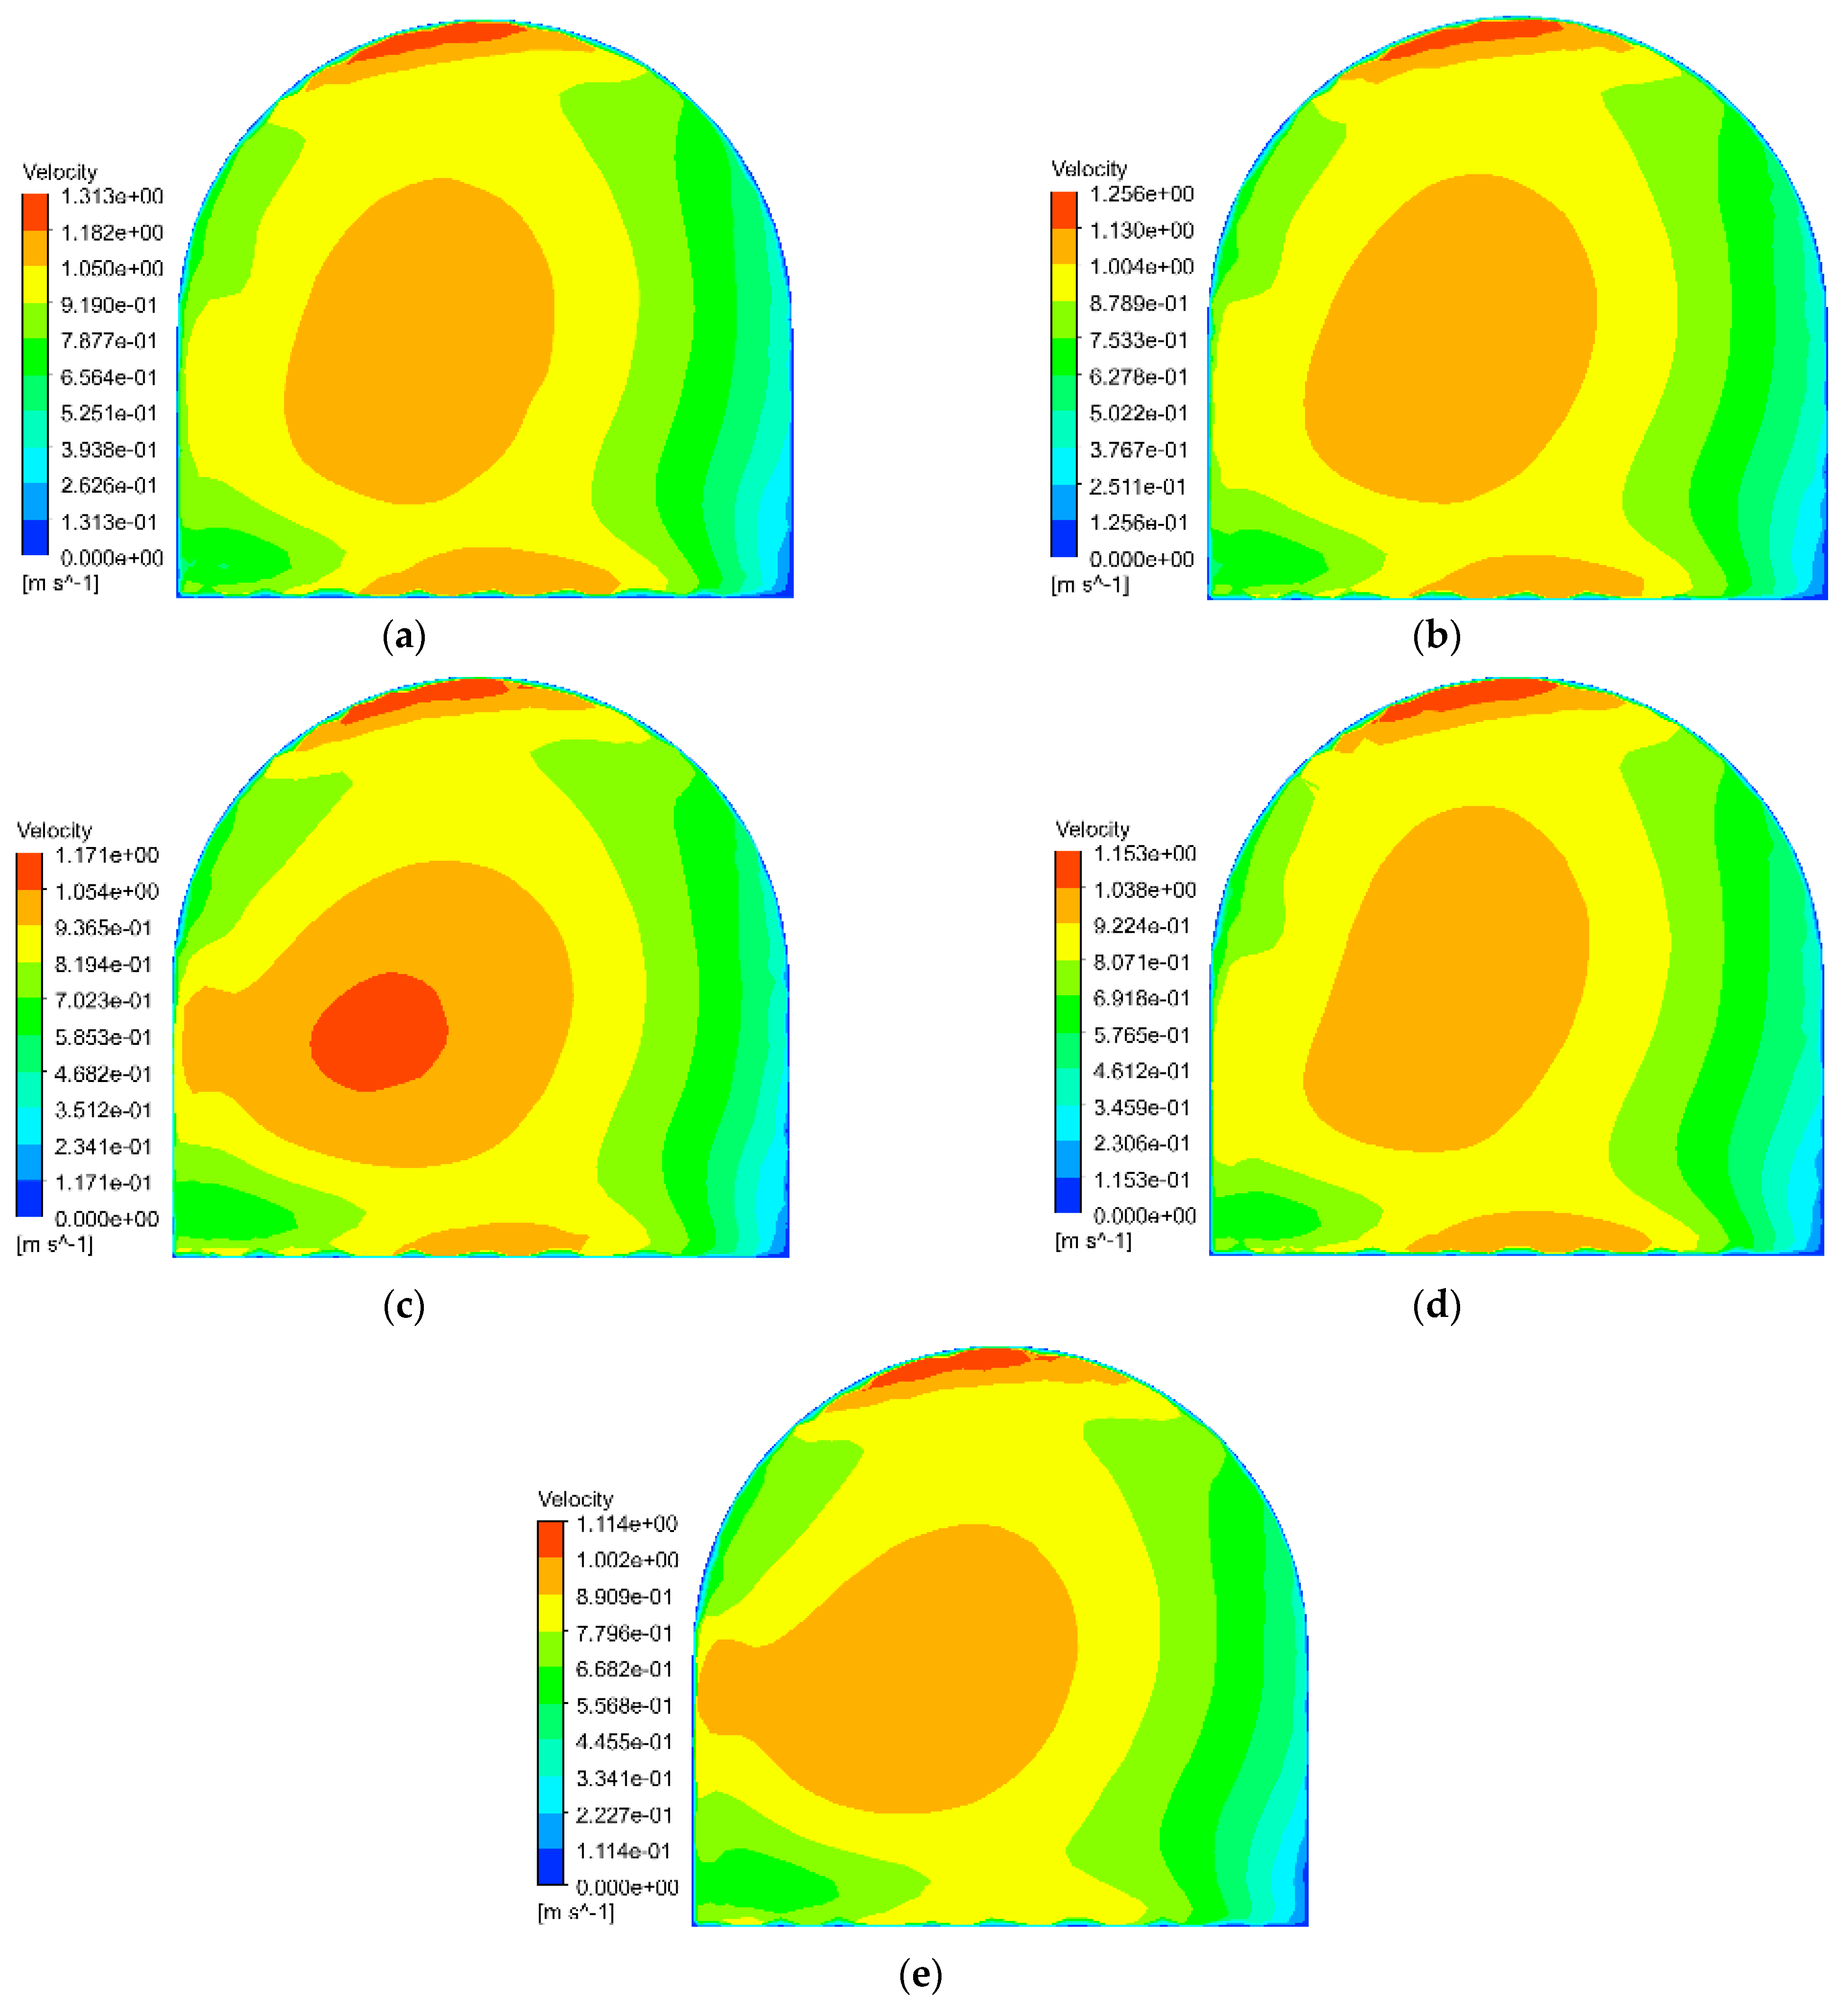
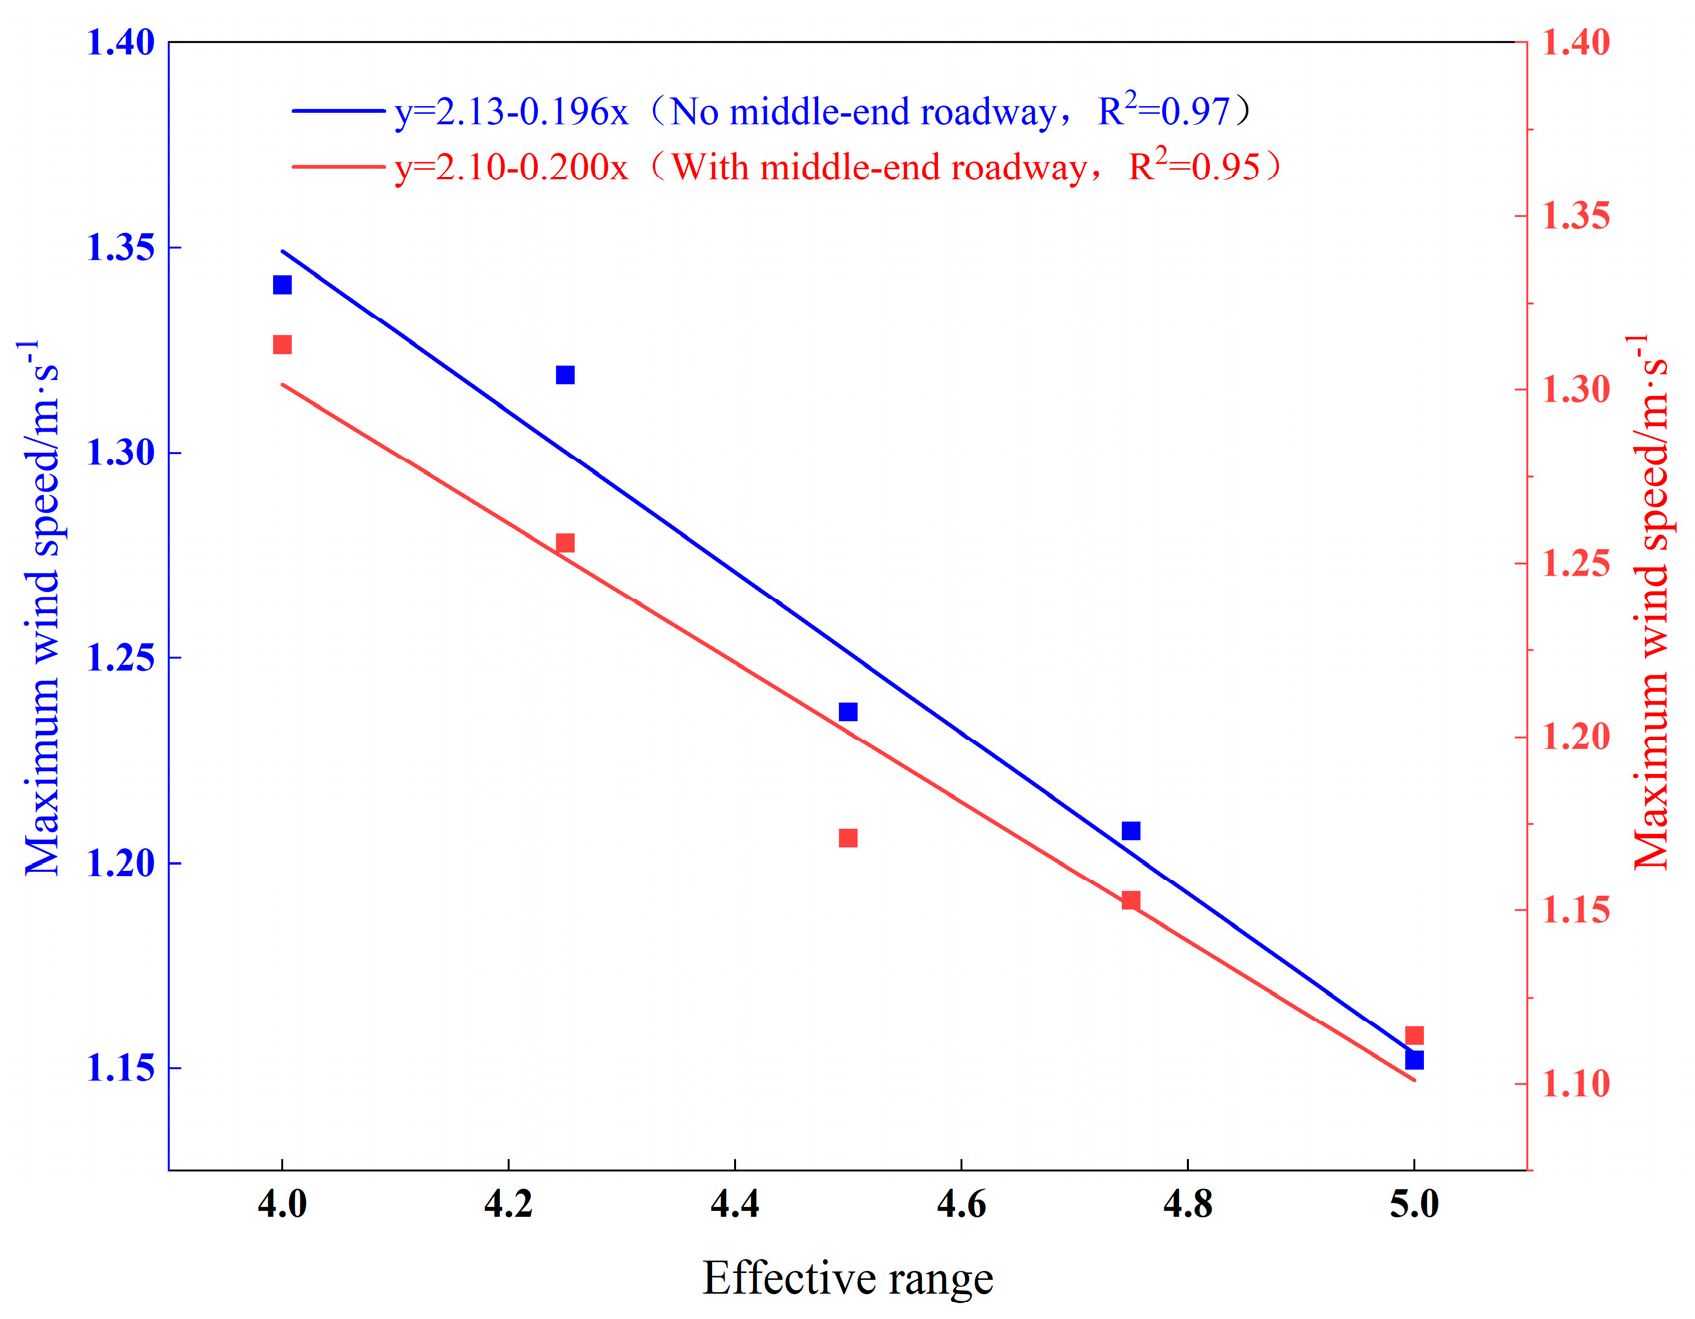
Figure 7 presents the velocity distribution at the working face for different effective ranges (ER) in the absence of a mid–tunnel. The airflow exhibits a characteristic pattern with higher velocities in the upper and middle regions, gradually decreasing toward the sides, which results from the right–side placement of the ventilation duct. Specifically, the maximum velocities at this cross–section were measured as 1.341 m/s (ER–1), 1.319 m/s (ER–2), 1.237 m/s (ER–3), 1.208 m/s (ER–4), and 1.152 m/s (ER–5), all complying with regulatory standards for instantaneous airflow speed while effectively preventing secondary dust suspension. The ER–1 condition demonstrated superior velocity retention, maintaining both higher peak and surrounding velocities due to its minimal distance from the working face, thereby reducing energy dissipation.
Figure 8 presents the velocity contour at the working face with a mid–tunnel configuration, revealing a distinct distribution pattern where higher velocities dominate the upper and middle regions while gradually decreasing toward the sides. This phenomenon results from the right–side duct arrangement, with maximum wind speeds at this cross–section measuring 1.313 m/s (ER–1), 1.256 m/s (ER–2), 1.171 m/s (ER–3), 1.153 m/s (ER–4), and 1.114 m/s (ER–5). The significantly enhanced airflow characteristics observed in ER–1, both in maximum velocity and surrounding flow fields, are attributed to its proximity to the working face. This strategic positioning minimizes frictional and local resistance losses, thereby demonstrating superior ventilation performance compared to other excavation ranges.
In summary, Figure 9 presents the fitted maximum wind speed at the working face, revealing a clear trend: as the effective range increases, the vortex zone elongates, forcing the duct airflow to overcome greater frictional and local resistance before reaching the working face, consequently reducing the maximum wind speed. A comparison between configurations with and without a middle roadway shows the most significant deviation (0.028 m/s, negligible) occurs at ER–1, indicating that while the middle roadway modifies the stope’s airflow distribution, its influence remains predominantly localized near the stope outlet.

4. Analysis of Concentration Migration and Diffusion Results

4.1. Horizontal and Overall Spatial Concentration Distribution Law

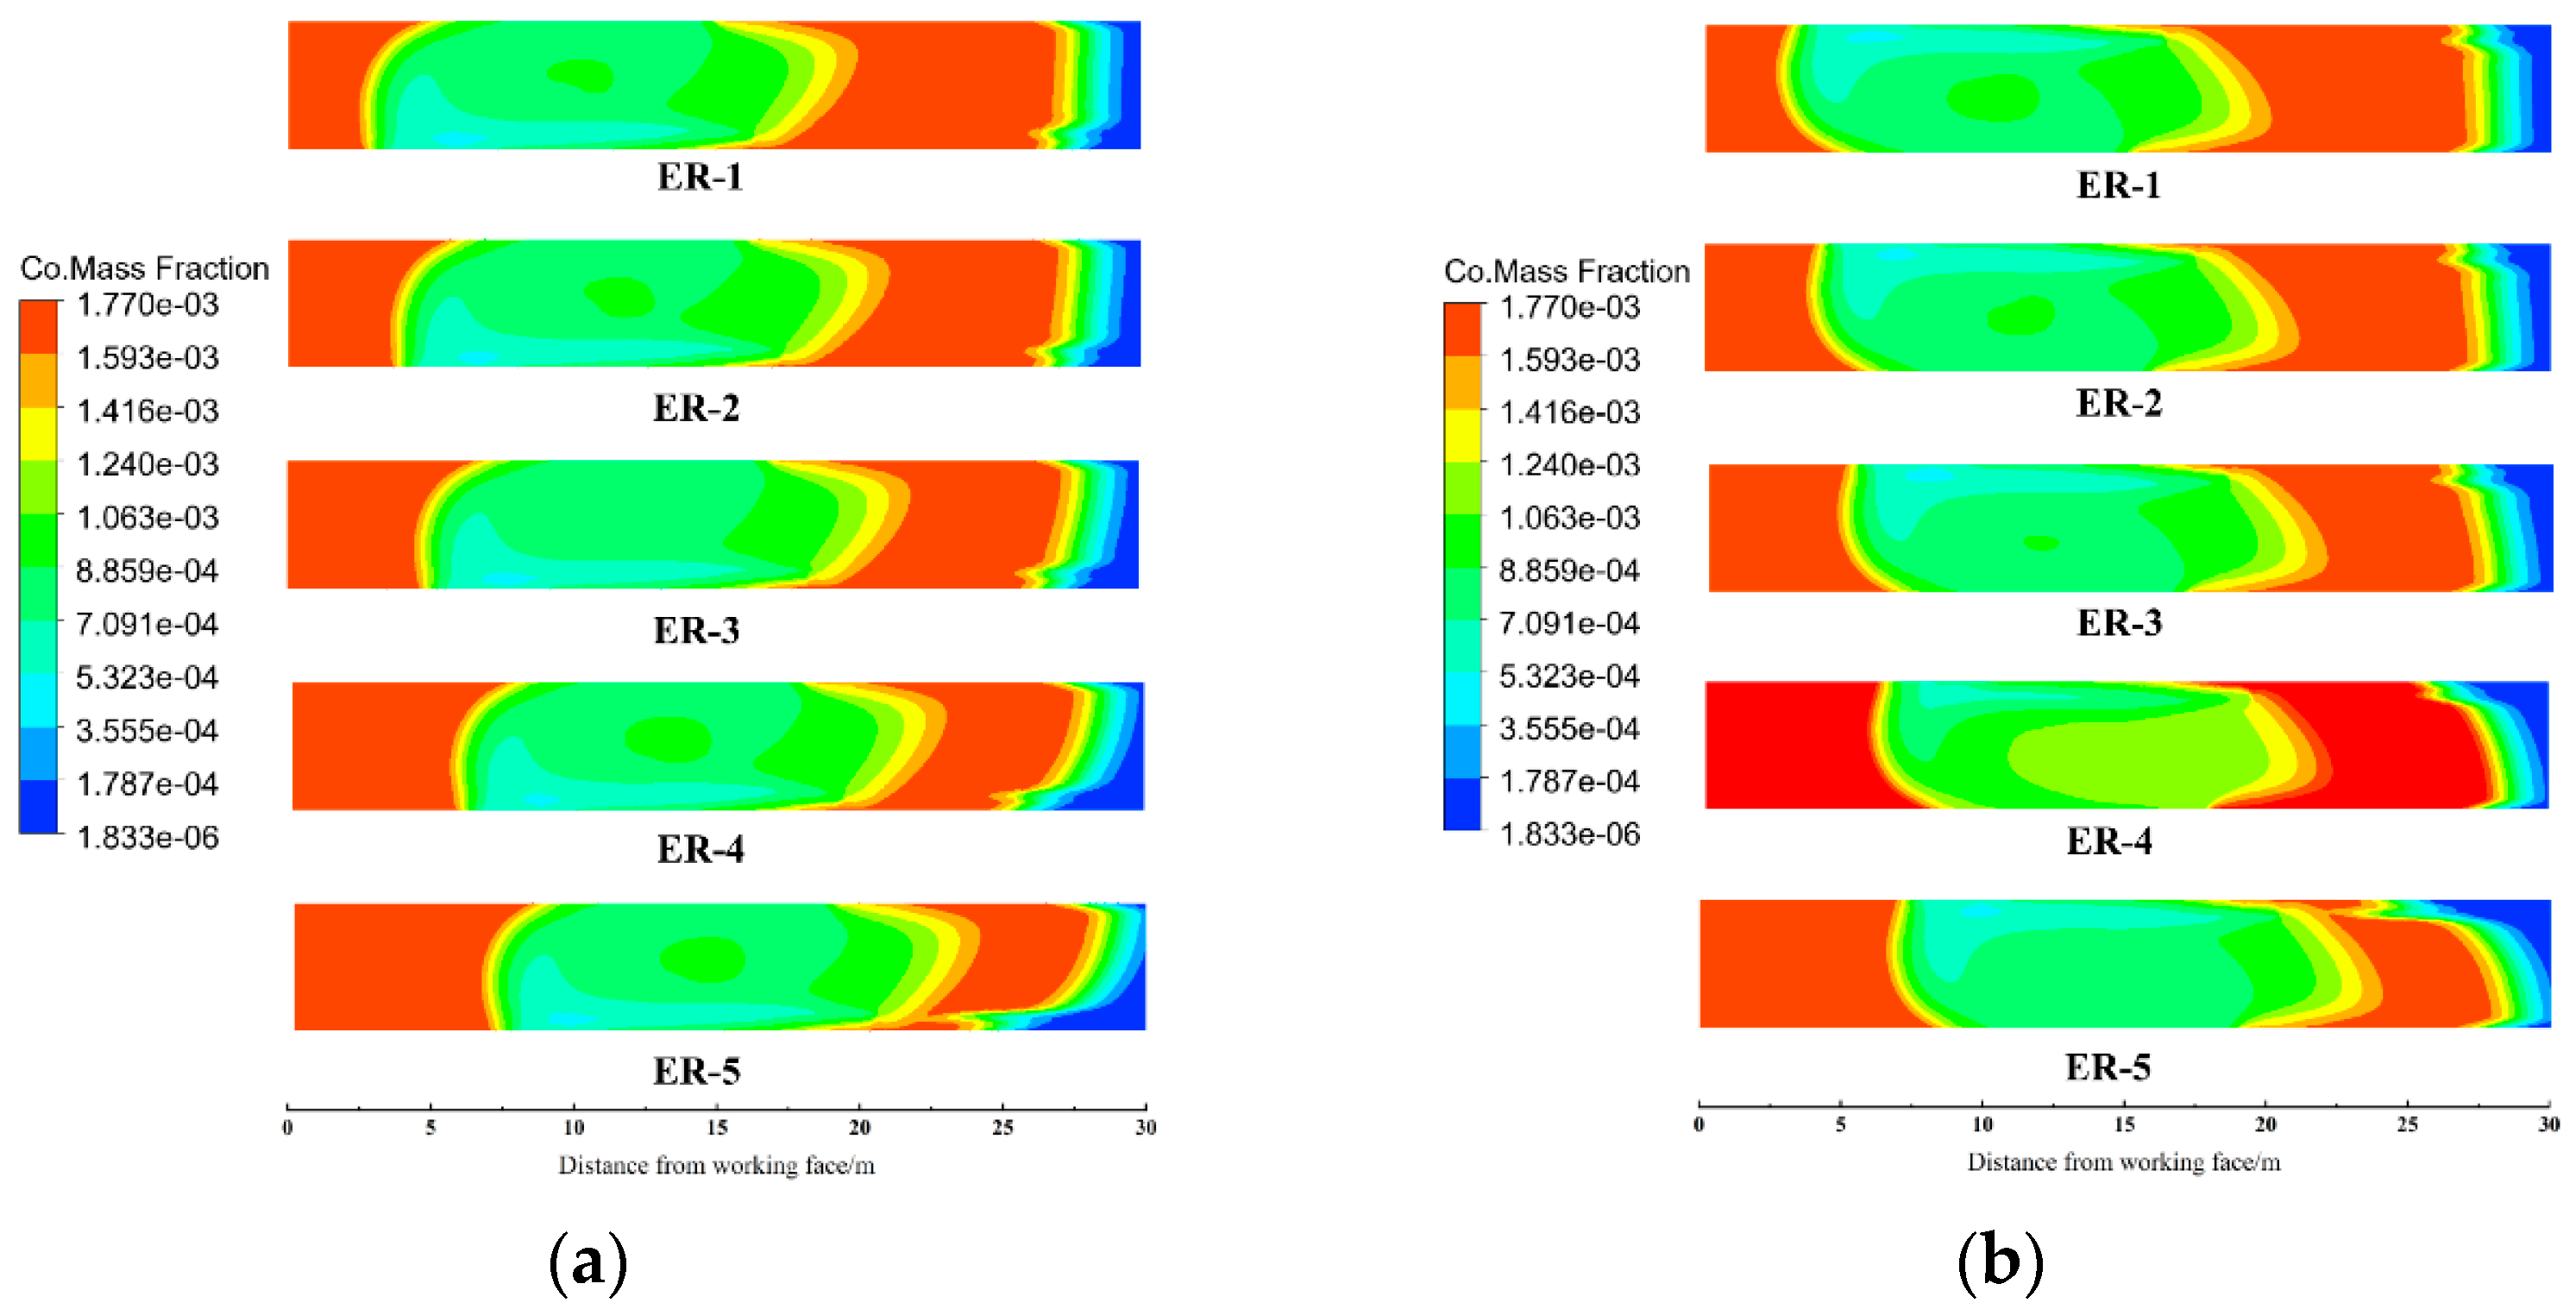
Figure 10 displays the CO concentration distribution at the 1.5 m horizontal plane (human breathing height) after 60 s, demonstrating how the duct outlet jet airflow dilutes surrounding CO concentrations. In the absence of intermediate roadway, the CO in the space of about 3.5 m (ER–1), 4.2 m (ER–2), 5.5 m (ER–3), 6.7 m (ER–4) and 8.9 m (ER–5) from the working face is not diluted. With a middle roadway, these distances shift slightly to 3.6 m, 4.4 m, 5.2 m, 7.2 m, and 8.6 m, respectively. While peak concentrations remain unaffected, CO removal efficiency progressively declines with increasing effective range due to the local fan’s diminished dispersion capability. Due to the presence or absence of the middle roadway, the length of the CO air mass in the stope is not diluted, so the influence of the middle roadway on the airflow distribution in the jet zone can be ignored.
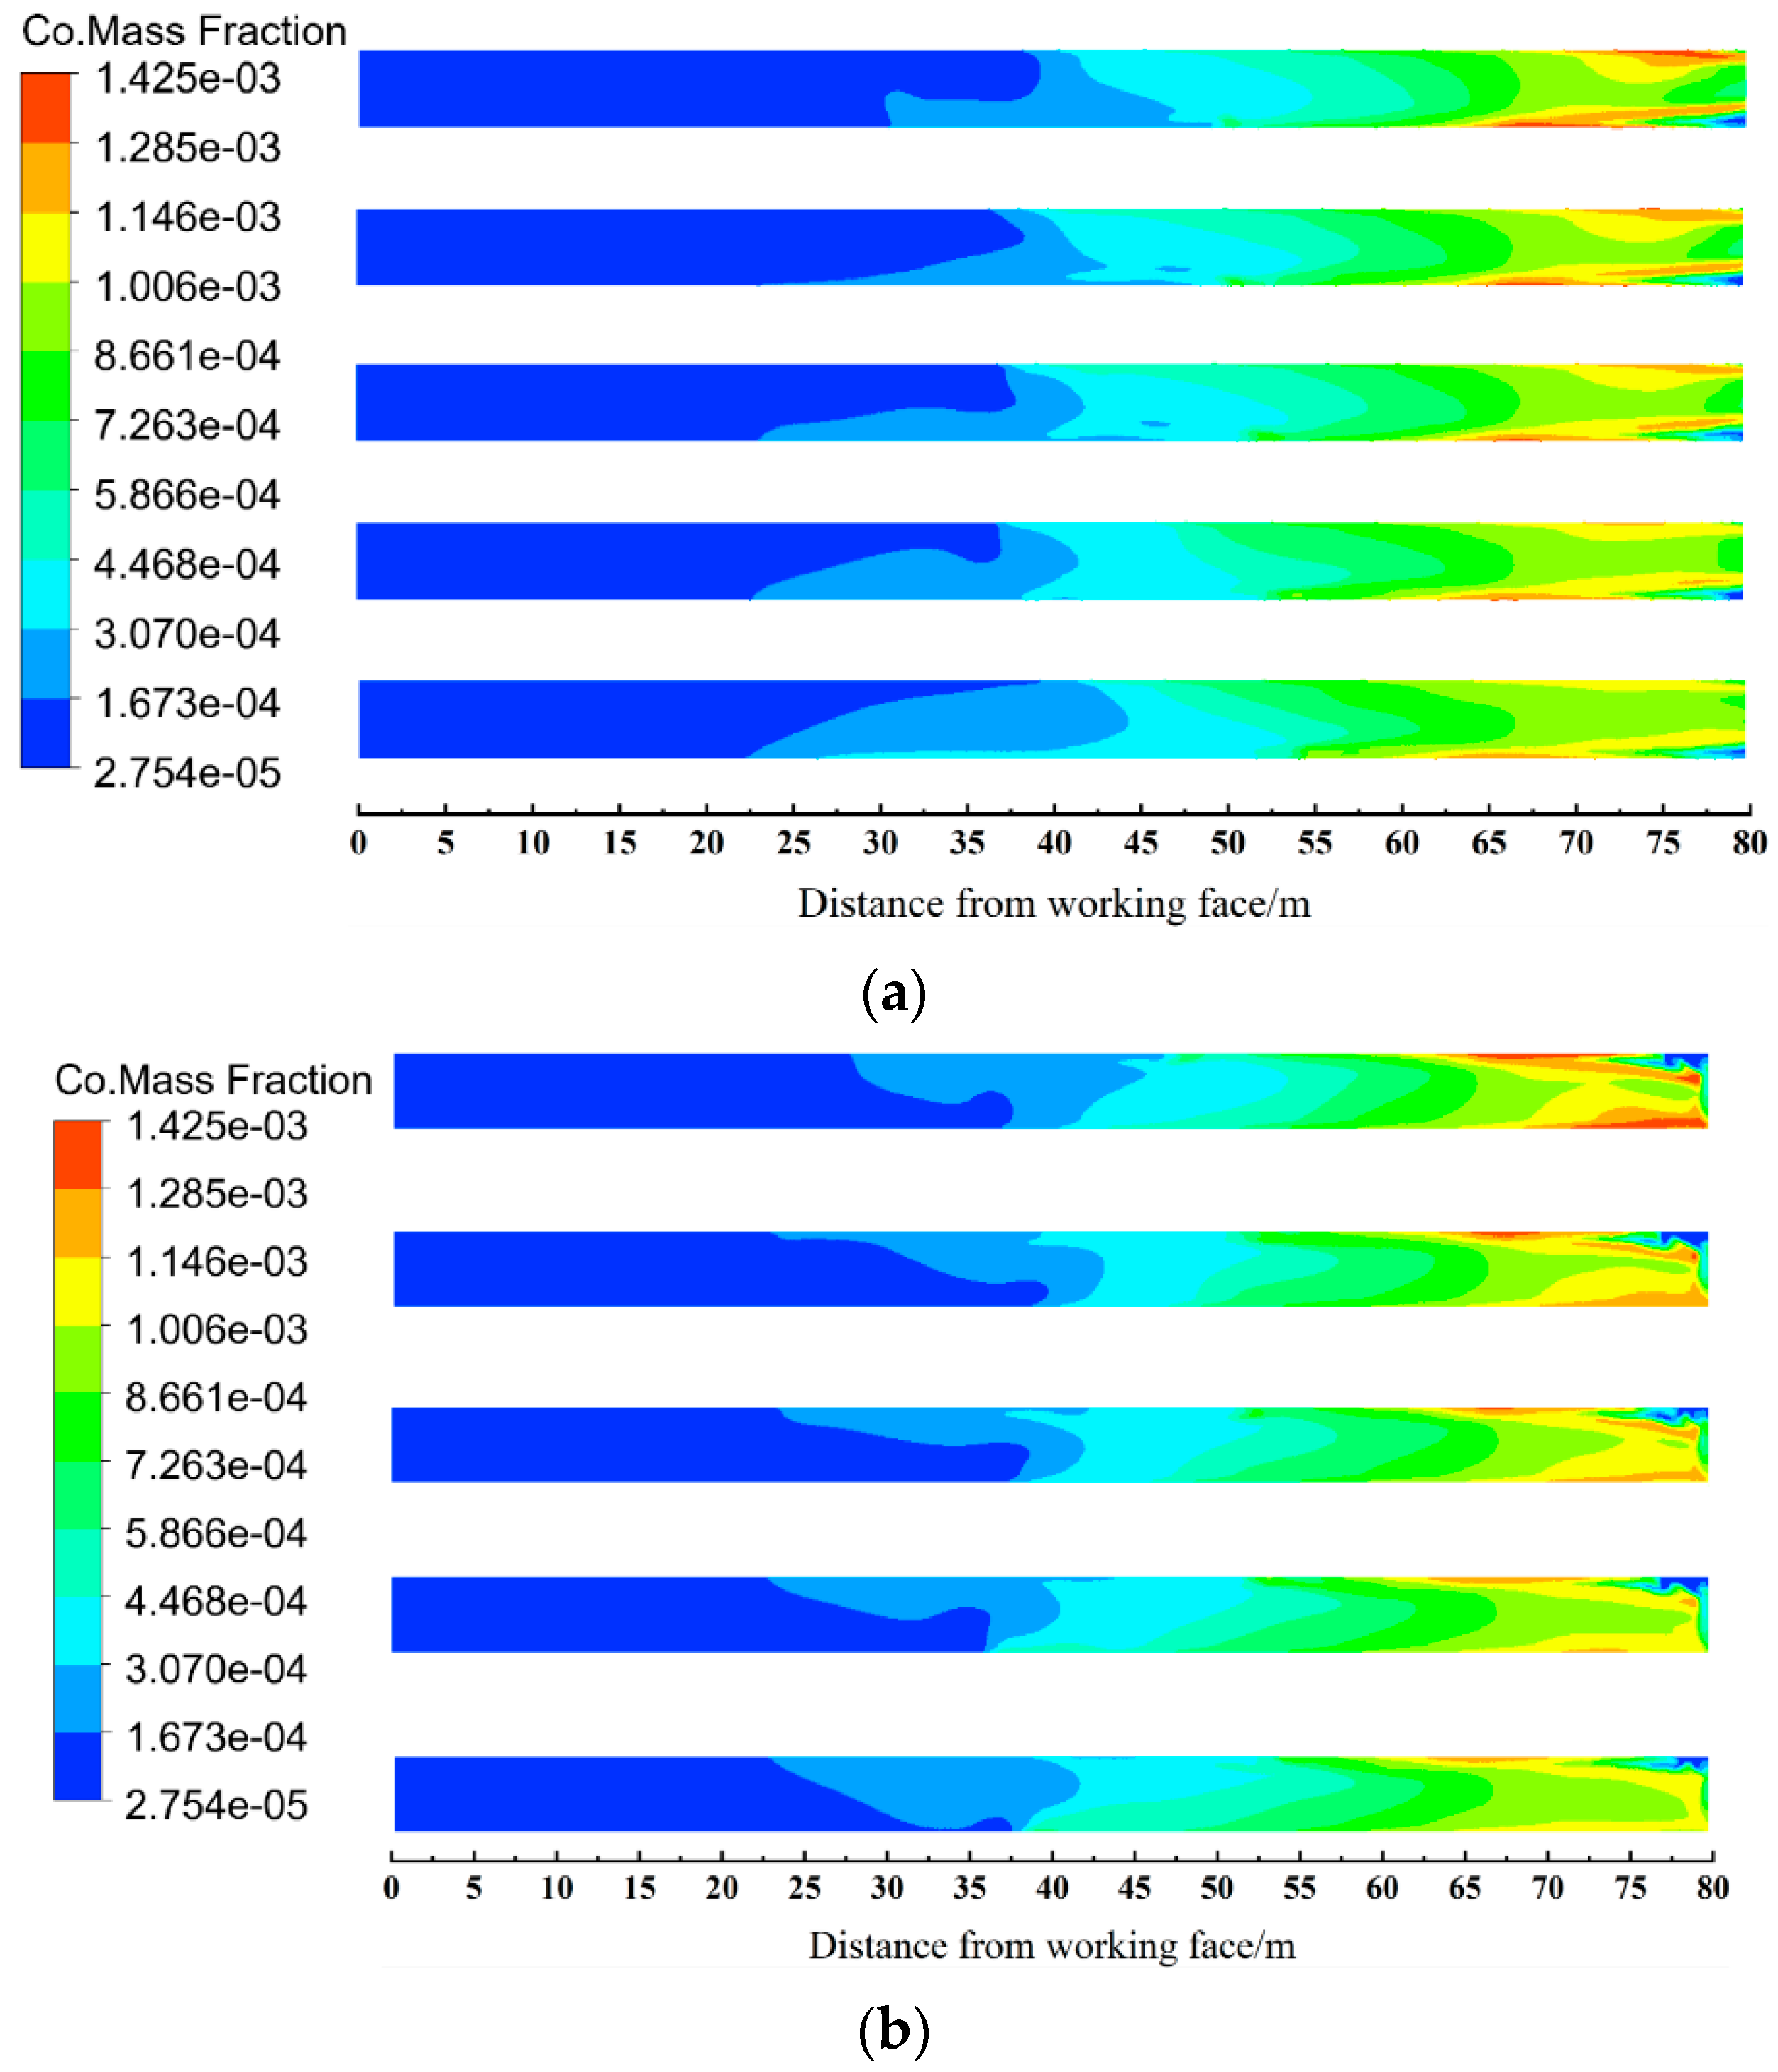
At 500 s, the CO concentration distribution on the 1.5 m horizontal plane (human breathing height) is illustrated in Figure 11. Significant CO has been expelled and transported through the middle roadway. Without the middle roadway, the breathing–level CO concentrations at ER–1, ER–2, ER–3, ER–4, and ER–5 were 1425 ppm, 1372 ppm, 1310 ppm, 1287 ppm, and 1230 ppm, respectively. In contrast, with the middle roadway, the corresponding concentrations decreased to 1381 ppm, 1359 ppm, 1304 ppm, 1262 ppm, and 1222 ppm. ER–1 exhibited the highest CO removal efficiency in the absence of the middle roadway, attributed to its optimal performance. As the effective range increases, the airflow velocity reaching the working face diminishes. According to momentum conservation, the reduced momentum transfer during air–CO molecular collisions leads to weaker CO transport and diffusion, explaining ER–1’s superior removal efficiency. Although the presence of the middle roadway slightly influences the working face airflow velocity, the maximum velocity difference is only 0.028 m/s. Consequently, the middle roadway has a negligible impact on CO transport, with a maximum concentration deviation of merely 44 ppm.
To further elucidate the differences in CO migration and diffusion with and without a middle roadway across varying effective ranges, we compared the time required for CO concentration to decrease to the safe threshold of 24 ppm at both the 1.5 m breathing–height cross–section and throughout the entire space. Through the post–processing module in ANSYS, in the absence of intermediate roadway, the CO concentration of the respiratory surface of ER–1 to ER–5 reached a safe level at 1270 s (23.81 ppm), 1336 s (23.92 ppm), 1352 s (23.99 ppm), 1470 s (23.9 ppm), and 1480 s (23.69 ppm) for ER–1 through ER–5, respectively. Correspondingly, the entire space achieved safe CO concentrations at 1406 s (23.83 ppm), 1478 s (23.88 ppm), 1530 s (23.87 ppm), 1560 s (23.95 ppm), and 1580 s (23.84 ppm) for the same effective ranges, as detailed in Table 1. These results demonstrate a consistent temporal delay in whole–space clearance compared to the breathing plane, with both clearance times progressively increasing with greater effective ranges.
When incorporating a middle roadway, the time required for CO concentration reduction followed distinct patterns across different effective ranges. At the breathing plane (1.5 m height), safe CO levels (<24 ppm) were achieved at 1334 s (21.52 ppm), 1374 s (23.44 ppm), 1426 s (21.36 ppm), 1452 s (23.78 ppm), and 1461 s (20.02 ppm) for ER–1 through ER–5, respectively. For complete spatial clearance, the system required 1414 s (23.85 ppm), 1480 s (23.61 ppm), 1576 s (23.87 ppm), 1528 s (23.56 ppm), and 1568 s (23.79 ppm) to reach safe concentrations under the same effective range conditions (Table 2). These results demonstrate that while the middle roadway configuration extended clearance times at the breathing plane compared to the no–roadway scenario, it maintained similar whole–space clearance durations, suggesting its influence primarily affects localized rather than global CO dispersion patterns.
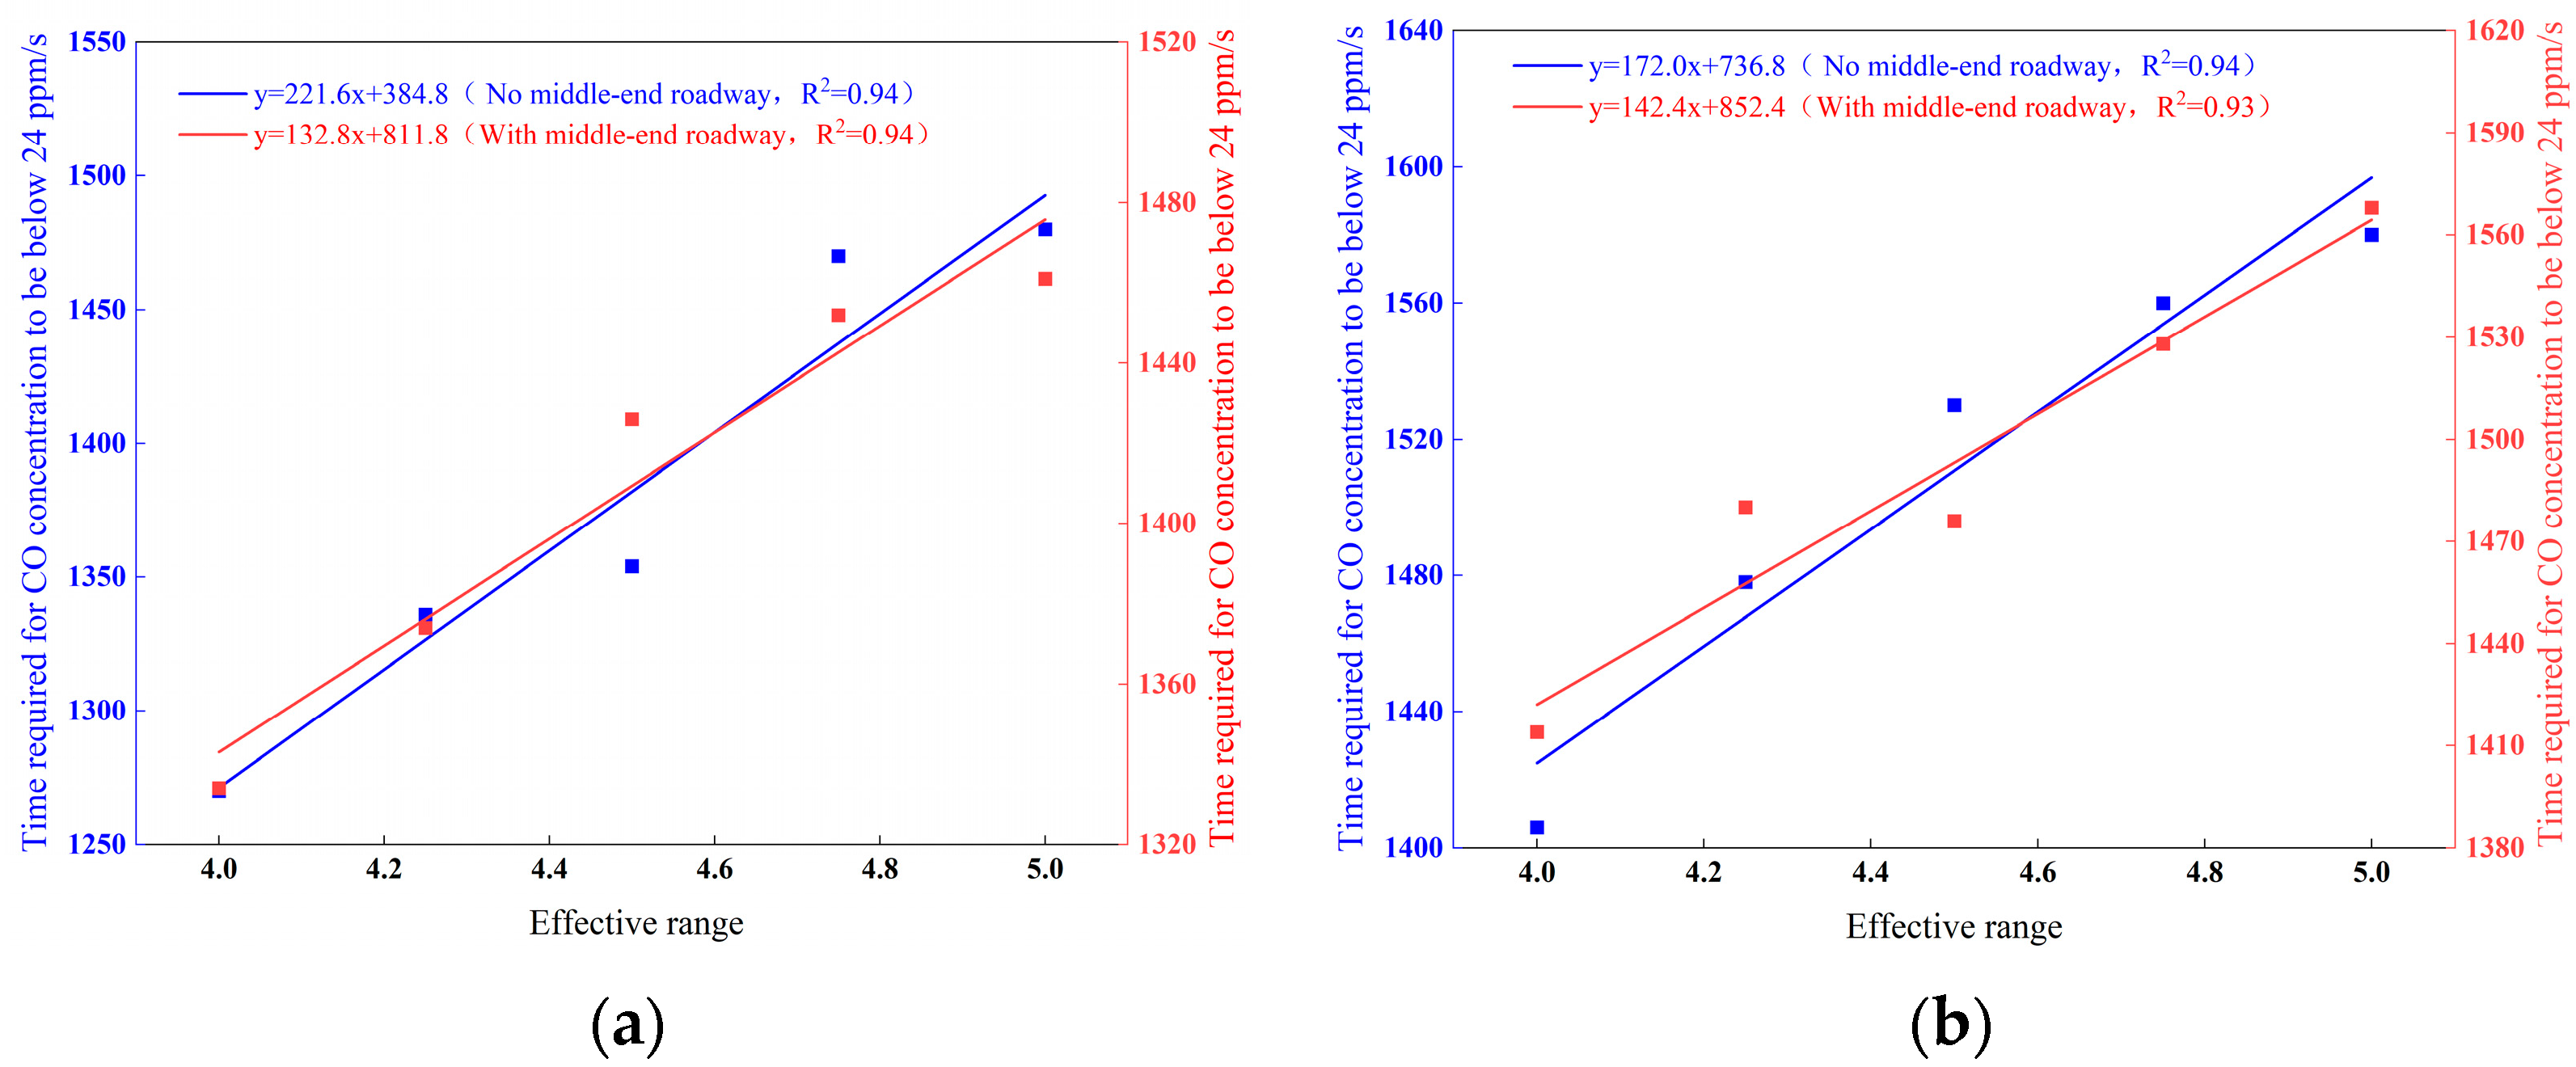
As shown in Figure 12, the time required for the CO concentration to decrease to 24 ppm exhibits a linear increase with the effective range, irrespective of the presence of a middle roadway. Without a middle roadway, the clearance time for the respiration plane and the entire space increases linearly from 1270 s to 1406 s to 1480 s to 1580 s, respectively, while with a middle roadway, it rises from 1334 s to 1414 s to 1461 s to 1568 s, respectively. The shortest clearance time occurs under ER–1 due to its minimal vortex zone, which reduces energy loss and maximizes the energy acting on CO dispersion. The absence of a middle roadway further shortens the required time because the airflow velocity at the working face under ER–1 is 0.006 m/s higher than that with a middle roadway. According to momentum conservation, the higher momentum imparted to CO molecules enhances dispersion efficiency. However, since the maximum velocity difference is negligible, the time difference is merely 8 s, indicating that the presence of a middle roadway has a marginal impact on blast fume migration. Therefore, in the complex mining environment, moving the trolley and other equipment to the middle roadway before blasting can improve the efficiency of smoke diffusion.

4.2. Concentration Distribution Law at Working Face

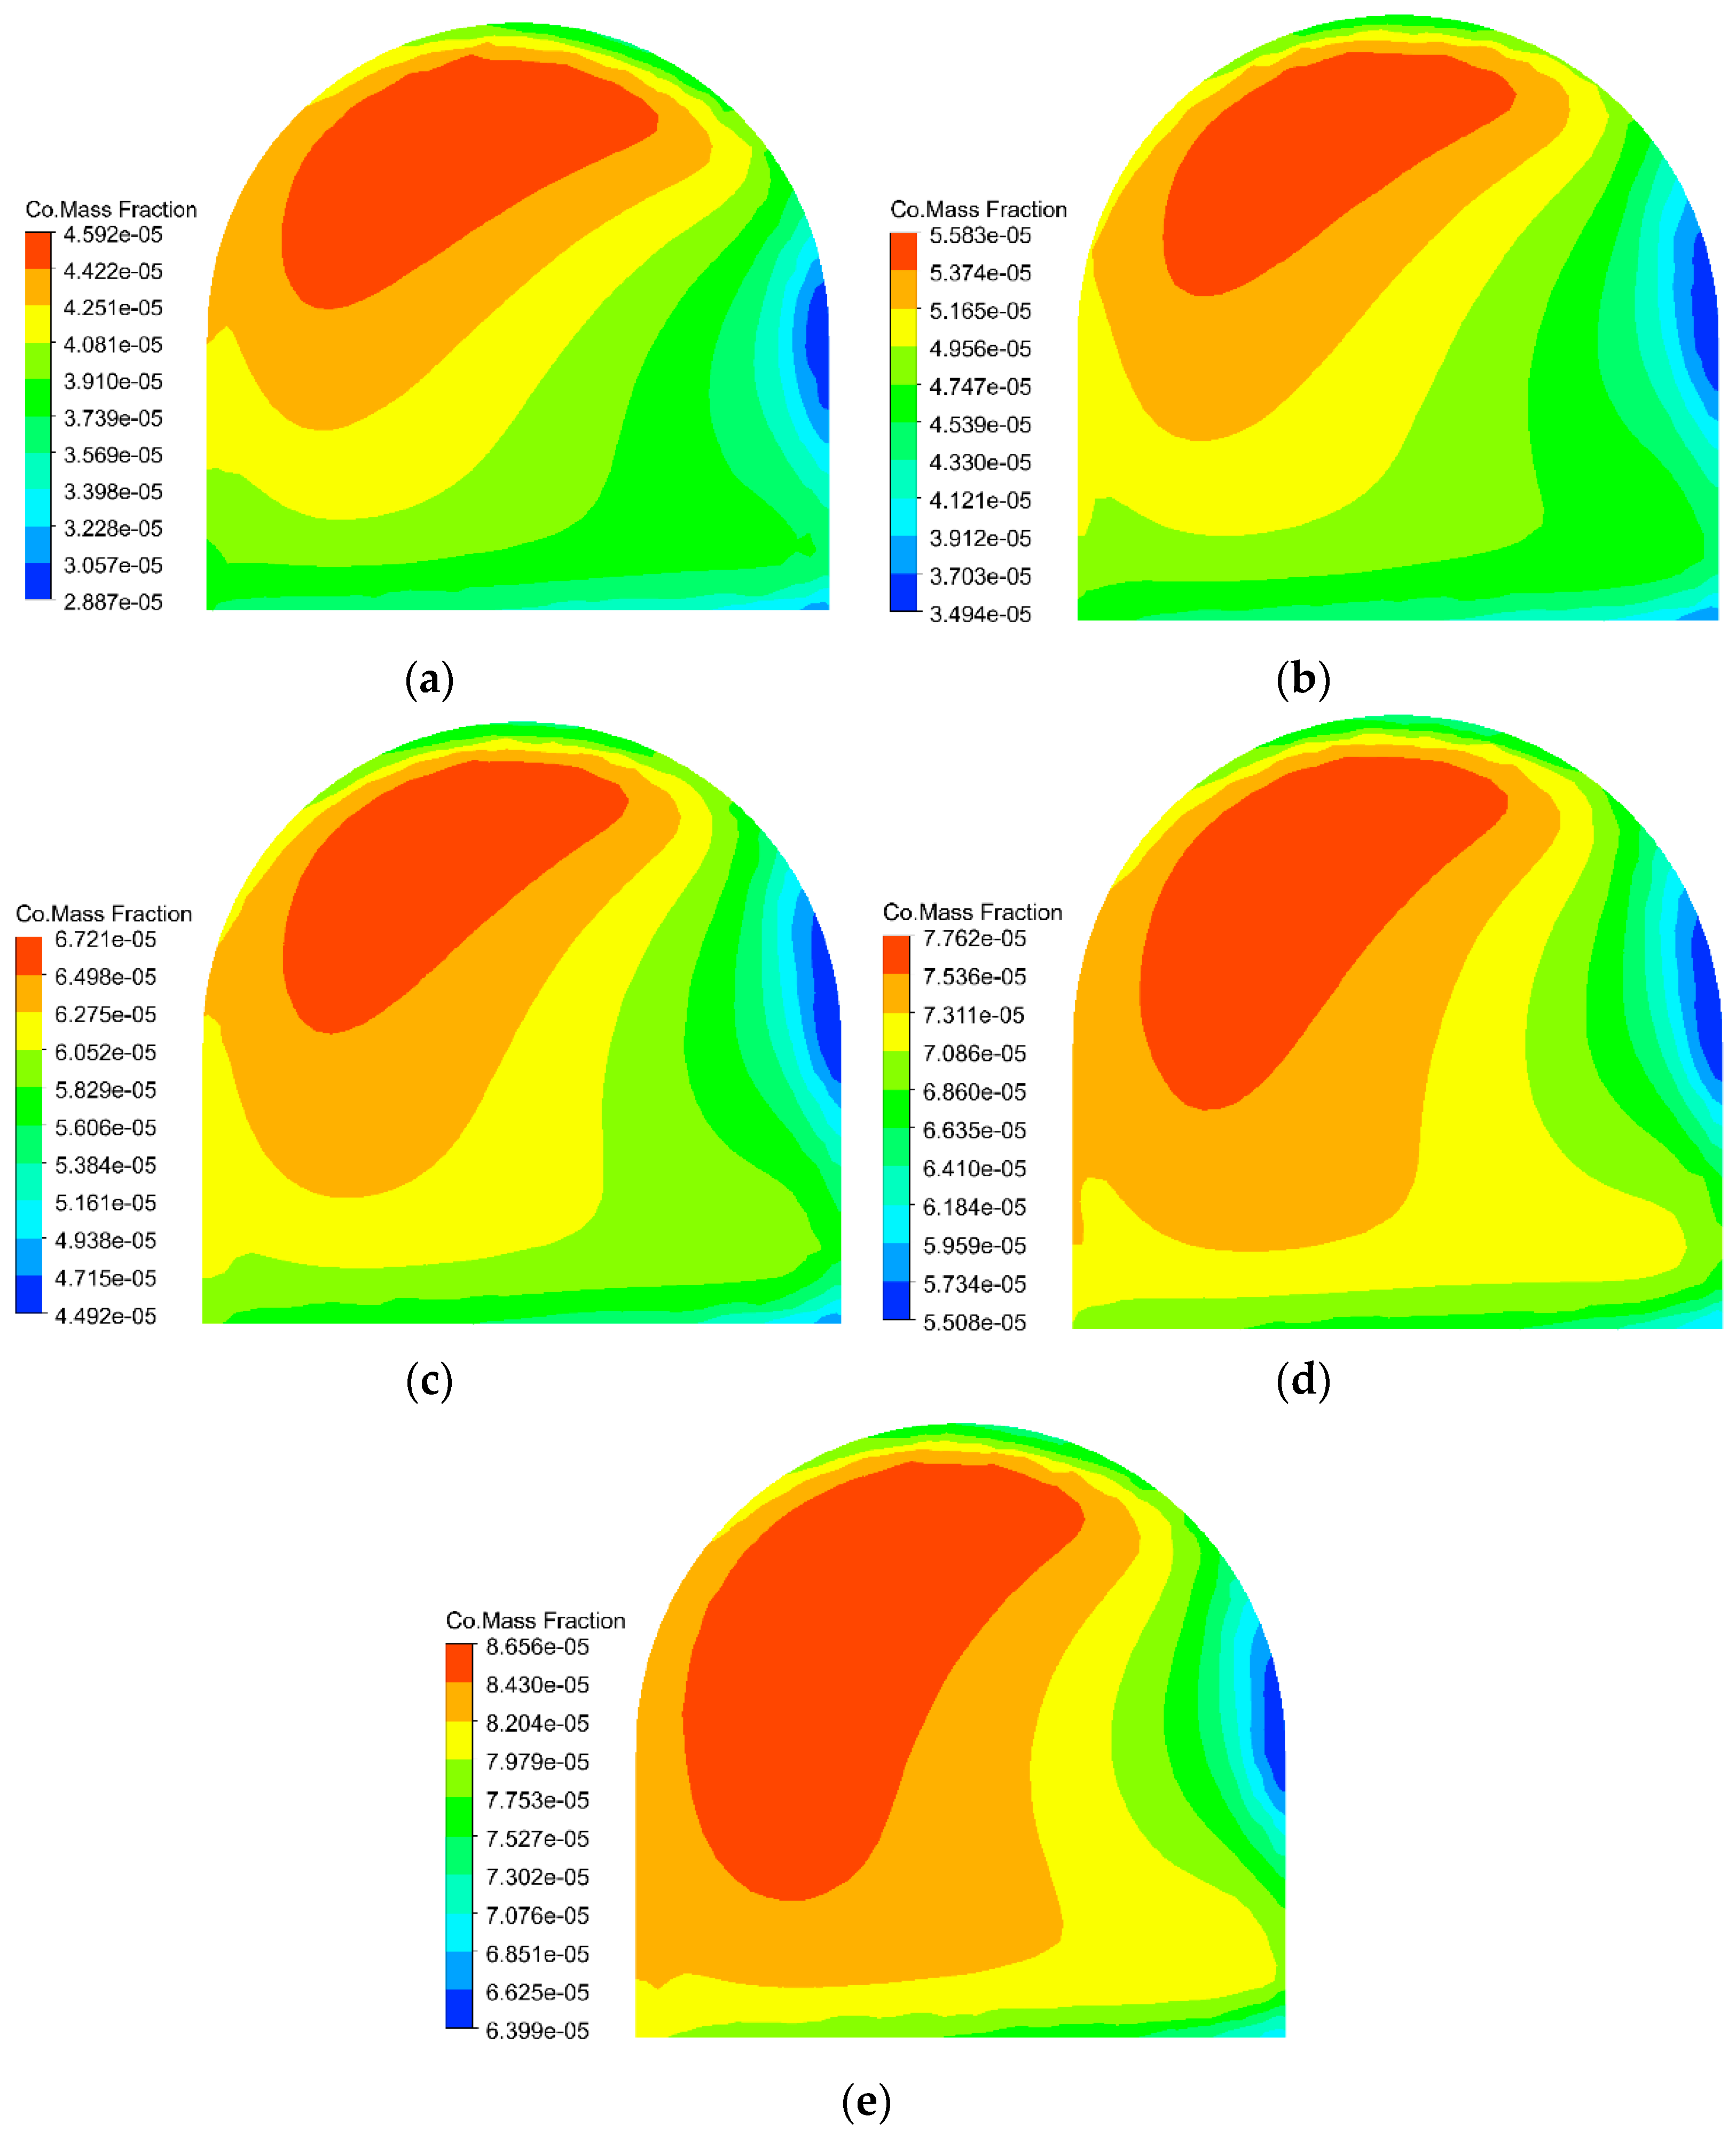
Figure 13 presents the CO concentration distribution at the working face after 500 s without a middle roadway. Across all effective ranges, the CO concentration demonstrates higher values in the upper left region and lower values in the lower right, exhibiting a gradual decreasing gradient from the upper left to the lower right. However, the peak CO concentrations vary significantly with different effective ranges: under ER–1, ER–2, ER–3, ER–4, and ER–5 conditions, they reach 45.92 ppm, 55.83 ppm, 67.21 ppm, 77.62 ppm, and 86.56 ppm, respectively.
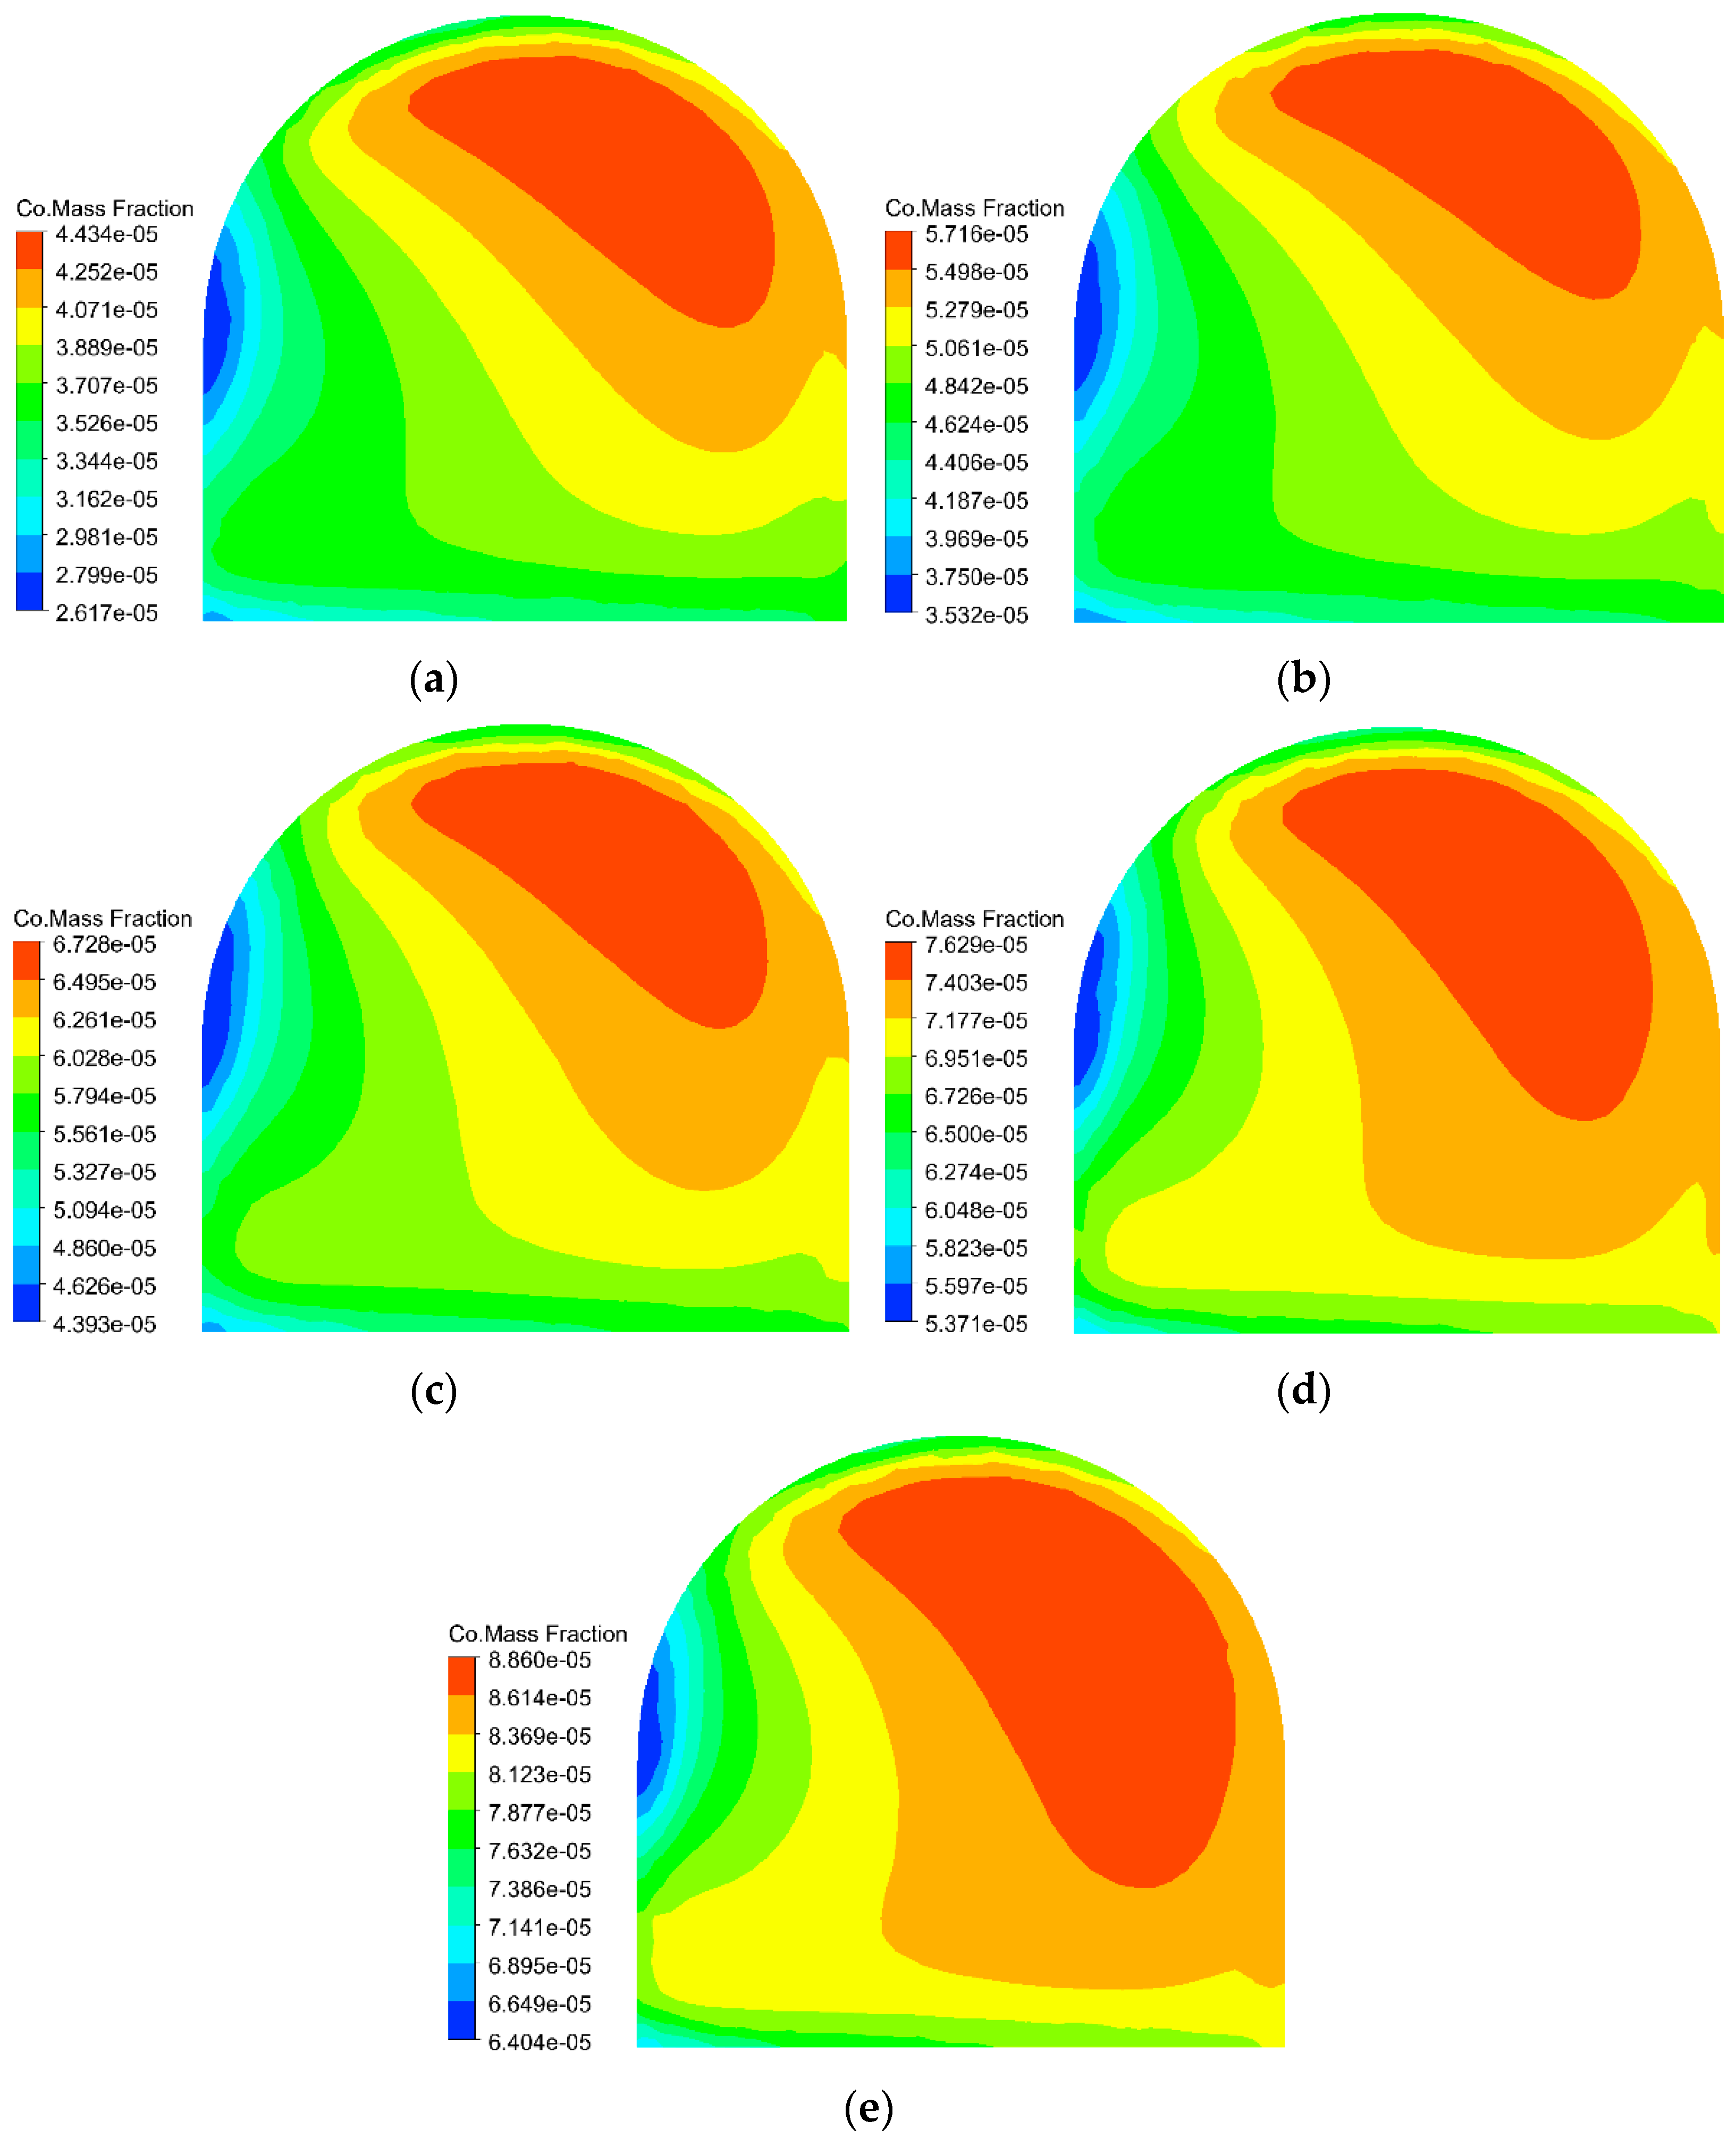
Figure 14 illustrates the CO concentration distribution at the working face after 500 s with a middle roadway. In this configuration, the CO concentration displays higher values in the upper right region and lower values in the lower left, showing a consistent decreasing gradient from upper right to lower left. Notably, despite examining the same time point and cross–section, the peak CO concentrations vary significantly across different effective ranges: measuring 44.34 ppm (ER–1), 57.16 ppm (ER–2), 67.28 ppm (ER–3), 76.29 ppm (ER–4), and 88.6 ppm (ER–5), demonstrating the substantial influence of effective range on fume dispersion patterns.
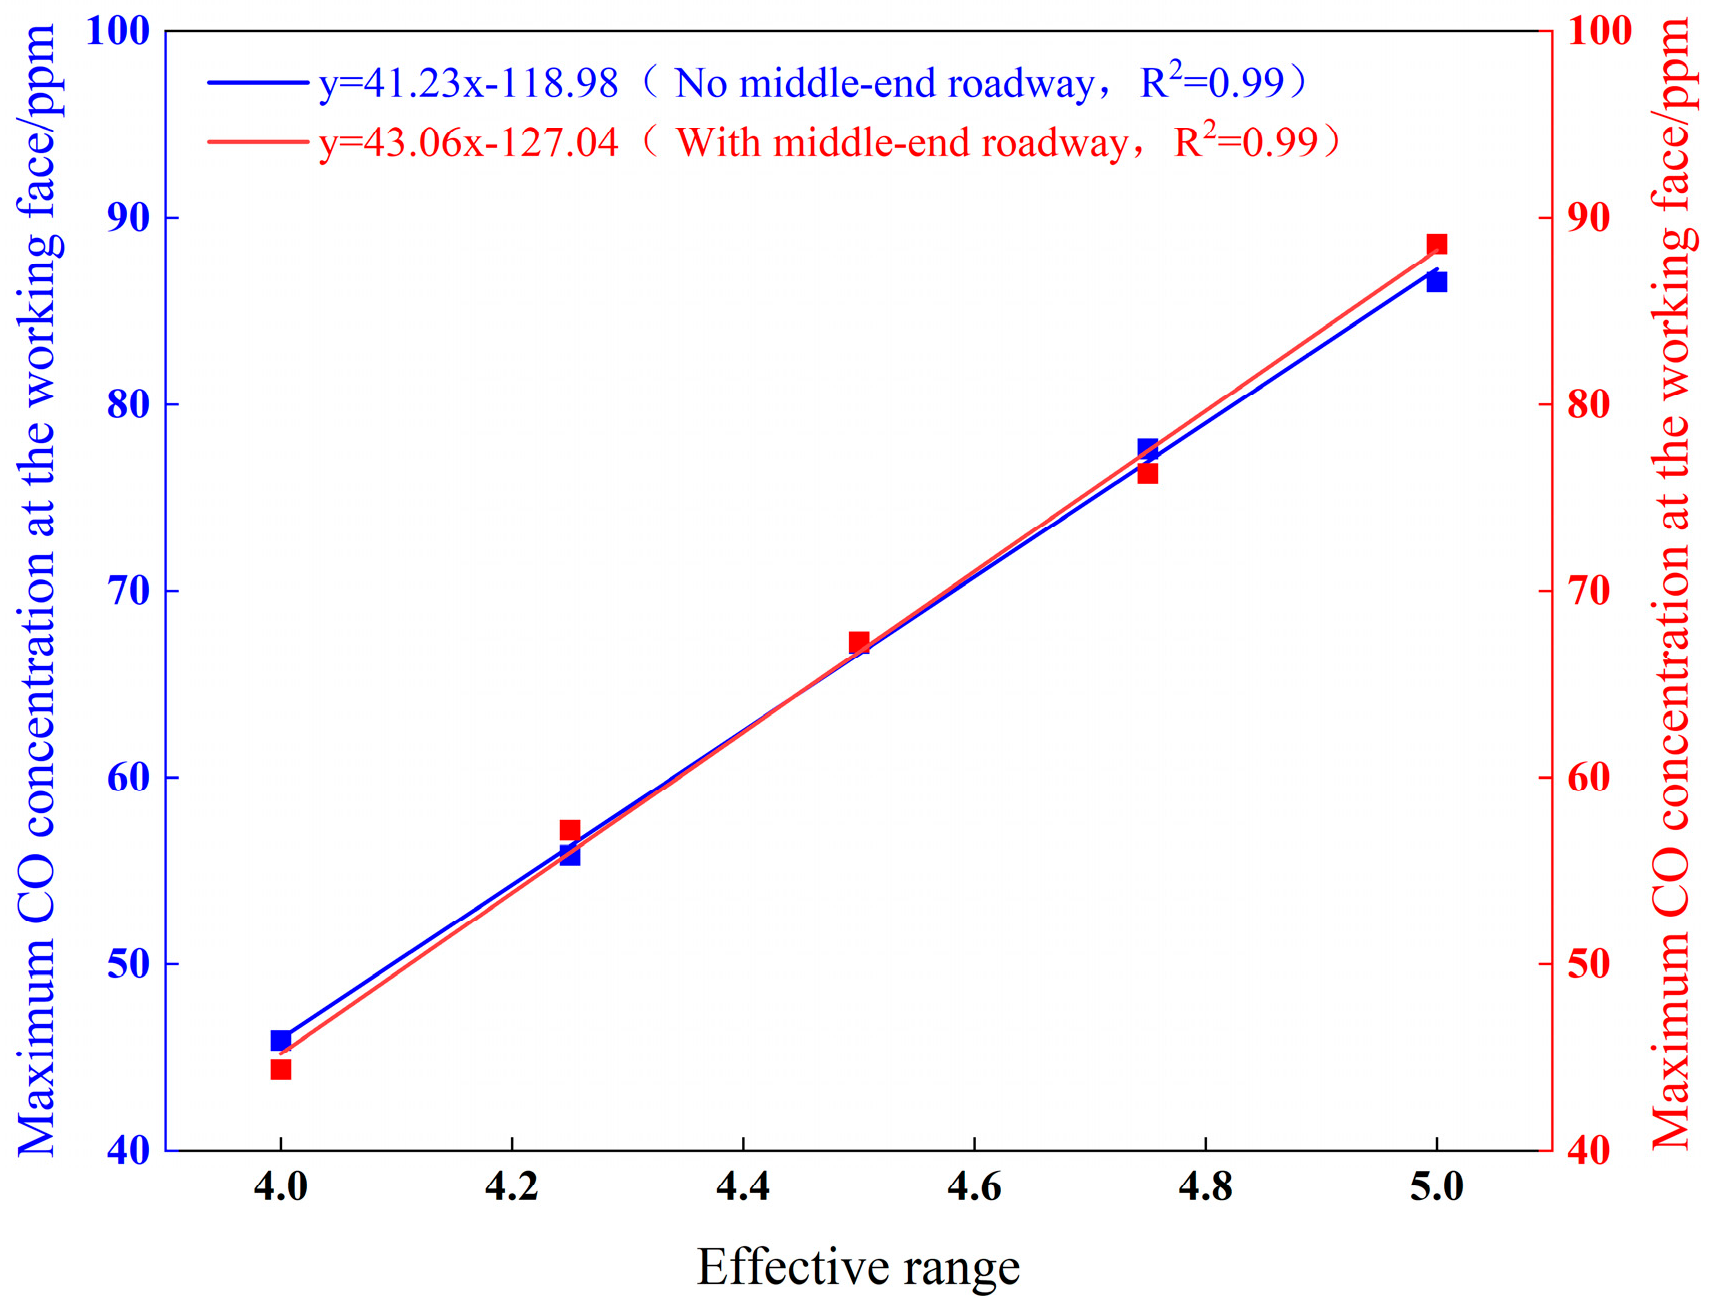
Figure 15 presents the fitted maximum CO concentrations at the working face, revealing a consistent linear increase with effective range regardless of middle roadway presence. In configurations without a middle roadway, concentrations rise from 45.92 ppm to 86.56 ppm, while those with a middle roadway increase from 44.34 ppm to 88.6 ppm. This trend stems from varying airflow velocities influencing CO transport capacity–higher velocities enhance momentum transfer to CO particles during collisions according to momentum conservation principles, thereby accelerating migration and improving dispersion. The negligible impact of roadway configuration (demonstrated by a maximum velocity difference of merely 0.028 m/s) confirms that middle roadway presence minimally affects CO dispersion dynamics near the working face.

4.3. The Variation Law of Concentration at Monitoring Points

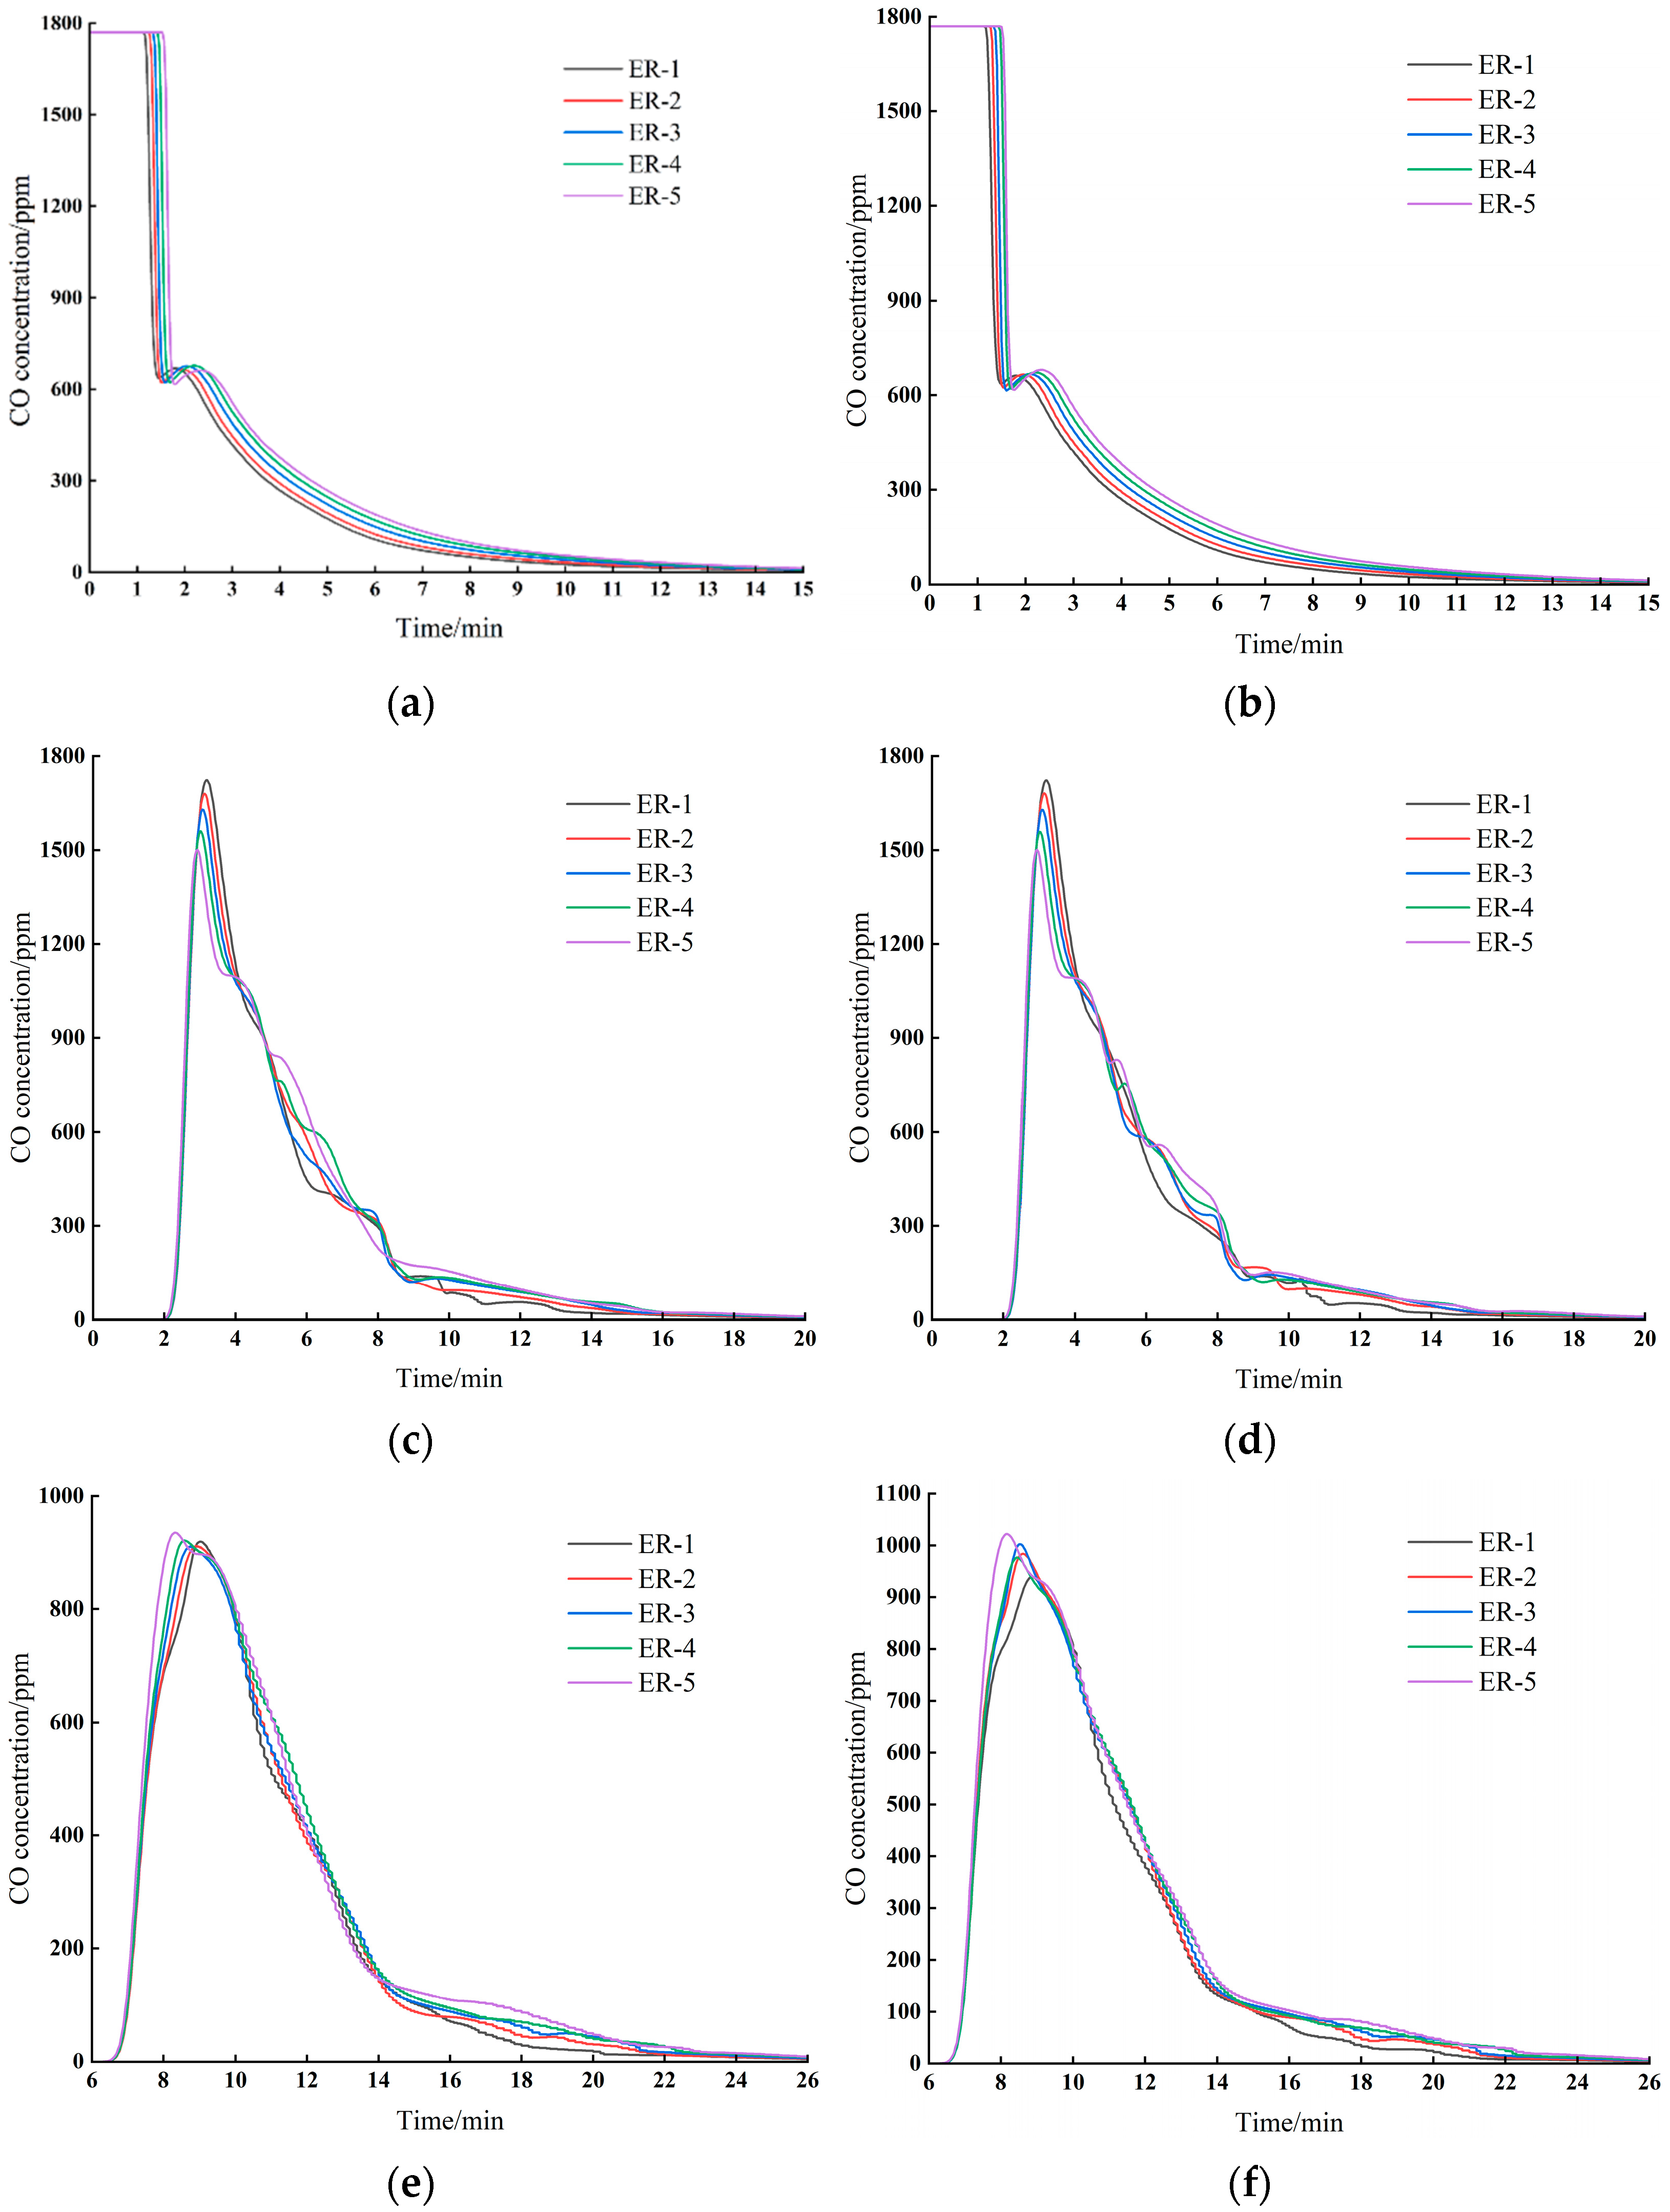
As illustrated in Figure 16a, for point A11 under ER–1 to ER–5, the CO concentration initiates its decline from 1770 ppm at 68 s, 74 s, 80 s, 86 s, and 92 s, respectively, and requires 616 s, 664 s, 710 s, 750 s, and 786 s, respectively, to fall below 24 ppm. Similarly, Figure 16b shows that for point B11 under ER–1 to ER–5, the CO concentration begins decreasing from 1770 ppm at 70 s, 76 s, 80 s, 86 s, and 90 s, respectively, and takes 604 s, 668 s, 708 s, 744 s, and 784 s, respectively, to reach below 24 ppm. The relative error in the time required for the CO concentration to drop below 24 ppm between points A11 and B11 (with and without a middle roadway) is 2%, 0.6%, 0.2%, 0.8%, and 0.2%, respectively.
As depicted in Figure 16c, for monitoring point A12 under ER–1 to ER–5, the CO concentration decreased below the safety threshold (24 ppm) at 808 s, 892 s, 916 s, 985 s, and 956 s, with corresponding concentrations of 23.8 ppm, 23.7 ppm, 23.6 ppm, 24.0 ppm, and 23.8 ppm, respectively. Similarly, Figure 16d shows that for point B12 under ER–1 to ER–5, the CO concentration fell below the safety level at 806 s, 904 s, 912 s, 944 s, and 1034 s, with measured values of 23.9 ppm, 23.8 ppm, 23.9 ppm, 24.0 ppm, and 23.9 ppm, respectively. The relative error in the time required to reach sub–24 ppm levels between A12 and B12 (with and without a middle roadway) was 0.2%, 1.3%, 0.4%, 4.3%, and 7.5%, respectively.
Figure 16e shows that the CO concentration at monitoring point A13 under ER–1 to ER–5 decreased below the safety threshold (24 ppm) at 1126 s, 1226 s, 1282 s, 1338 s, and 1356 s, with corresponding concentrations of 23.8 ppm, 23.7 ppm, 23.9 ppm, 23.7 ppm, and 23.8 ppm, respectively. Similarly, Figure 16f demonstrates that the CO concentration at point B13 under ER–1 to ER–5 fell below the safety level at 1204 s, 1264 s, 1280 s, 1330 s, and 1346 s, with measured concentrations of 23.6 ppm, 23.8 ppm, 23.8 ppm, 23.9 ppm, and 23.7 ppm, respectively. The relative time differences for the CO concentration to drop below 24 ppm between points A13 and B13, with and without a middle roadway, were 6.9%, 3.1%, 0.1%, 0.6%, and 0.7%, respectively.
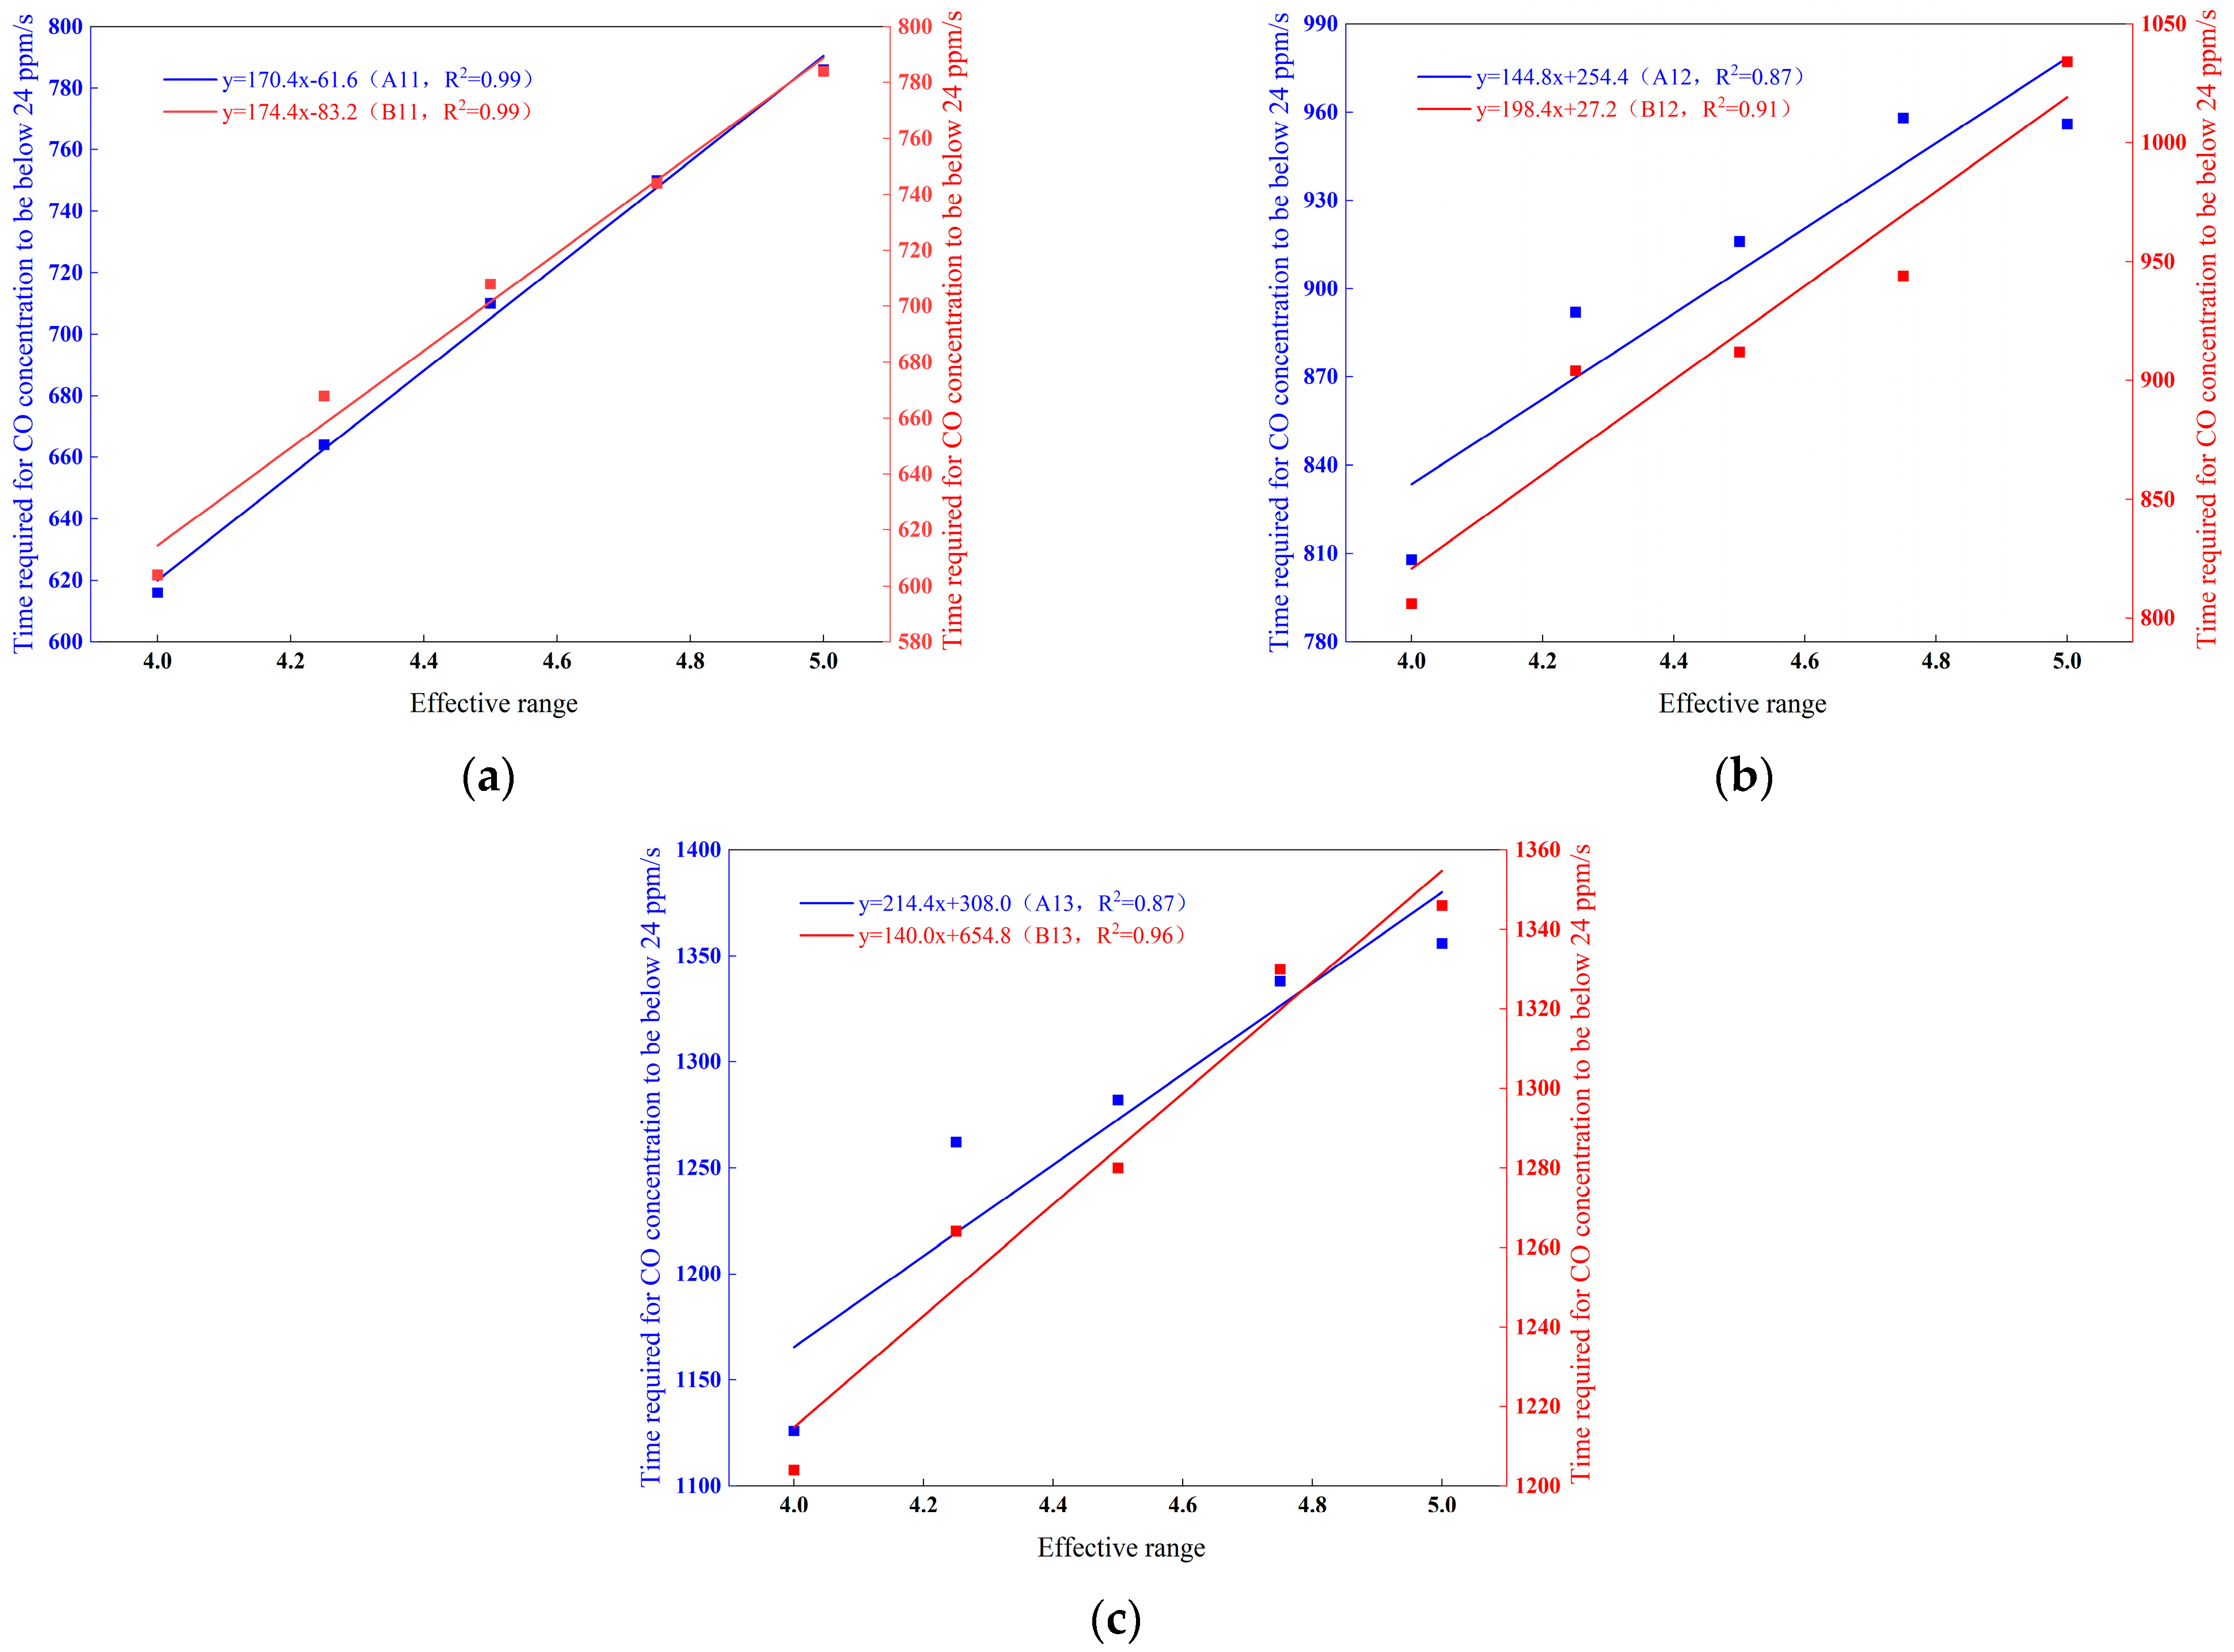
The time required for CO concentration to decrease to 24 ppm at each monitoring point was fitted as shown in Figure 17.
The results demonstrate a linear increase in the required time for CO concentration to decrease below 24 ppm with increasing effective range. This trend occurs because longer effective ranges produce extended vortex zones, leading to greater wind energy dissipation. The enhanced energy loss reduces momentum transfer to CO particles during collisions, thereby weakening their migration toward the stope exit and prolonging the clearance time. For monitoring points A11, A12, A13, B11, B12, and B13, the required time increases linearly from 616 s, 808 s, 1126 s, 604 s, 806 s, and 1206 s to 786 s, 956 s, 1356 s, 784 s, 1034 s, and 1346 s, respectively. The presence or absence of a middle roadway exhibits negligible influence on CO migration at these points, as the airflow velocity difference at the working face remains marginal in both configurations.
In summary, regardless of a middle roadway, CO concentration in the throwing zone decreases overall. Upon fan activation, blasting fumes disperse, reducing CO levels. Vortex zones temporarily hinder migration, causing a slight rise near 2 min, but continuous ventilation introduces fresh air, eventually lowering CO below 24 ppm. Initially confined to the throwing zone, CO later migrates outward, increasing external concentrations before declining as fumes exit the stope. Thus, outside the throwing zone, CO follows an initial rise followed by a drop.

4.4. Comparative Analysis of Experiment and Simulation

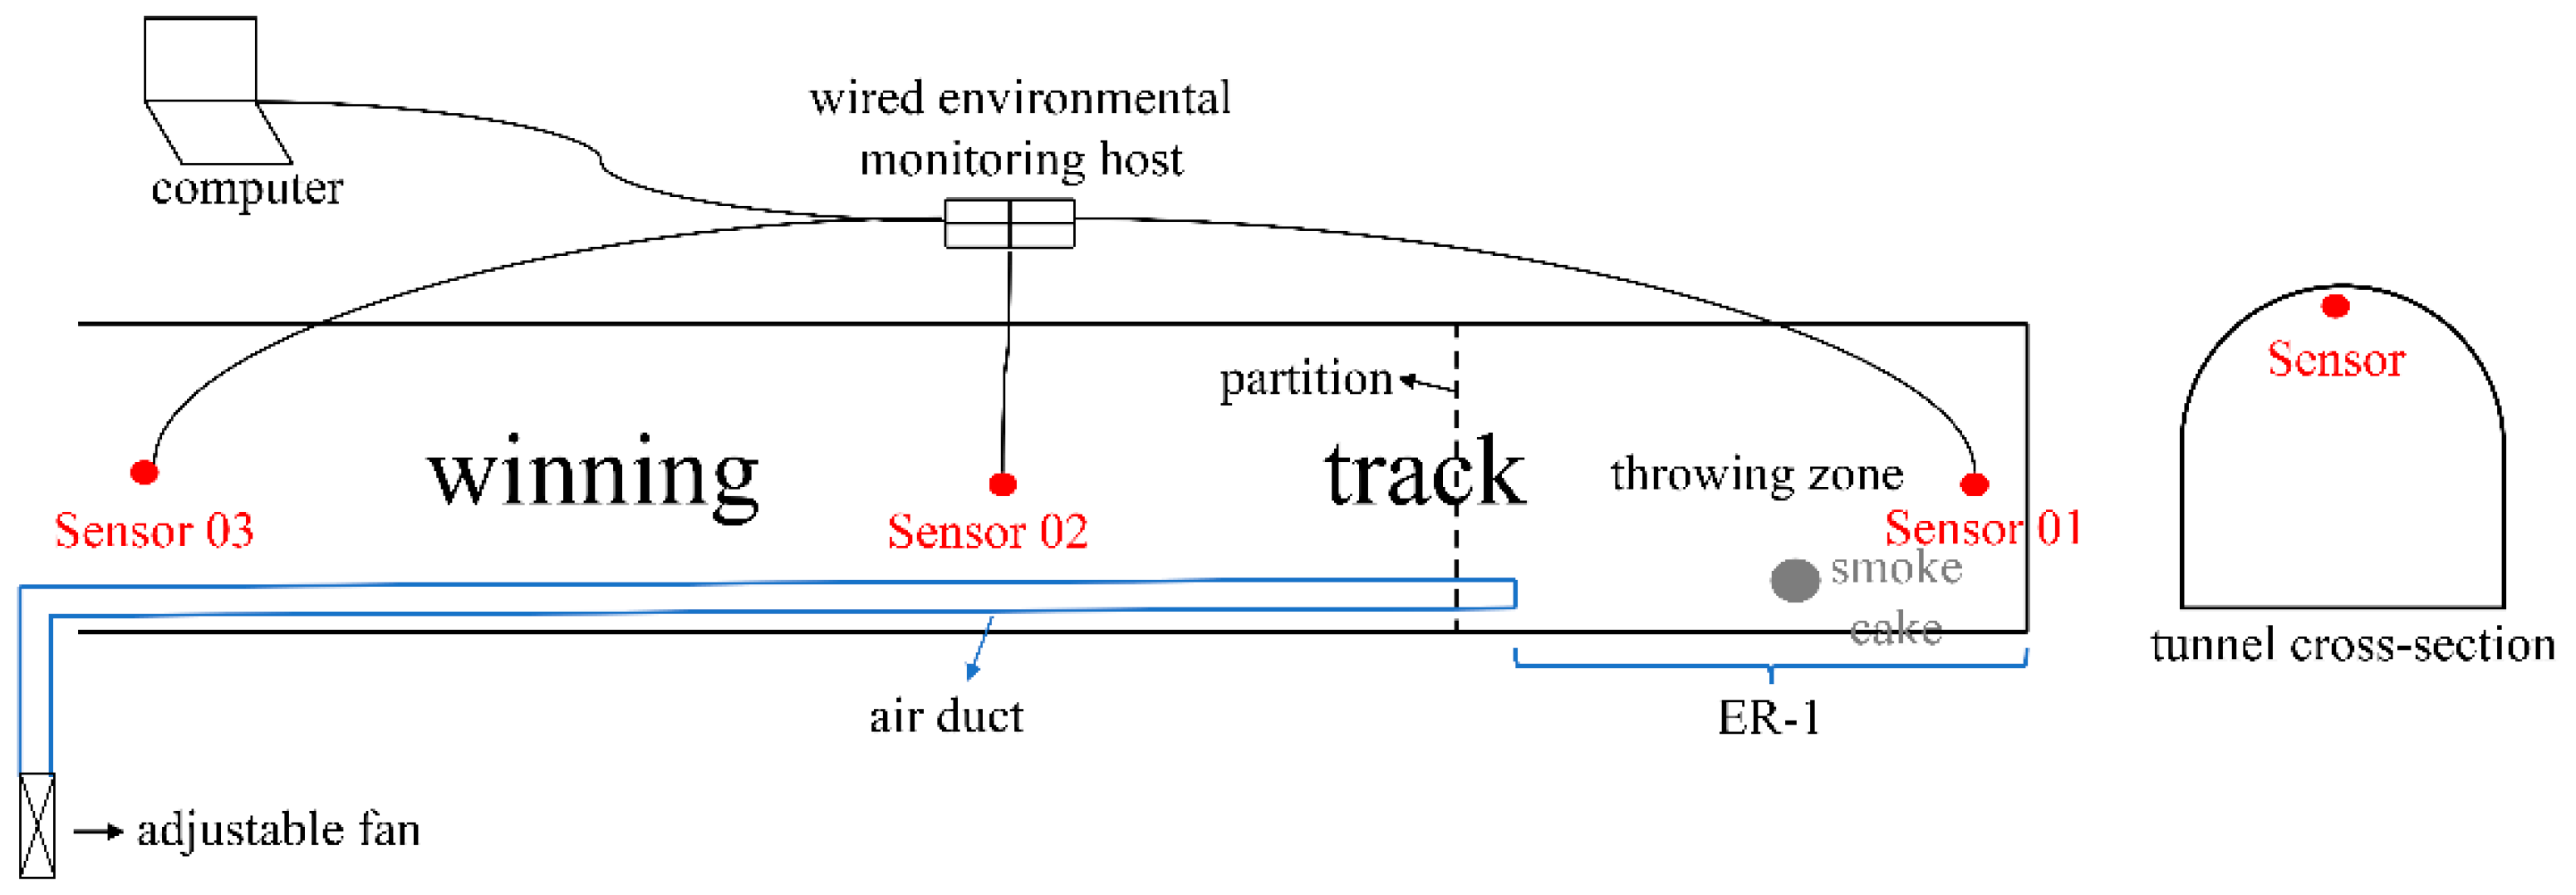
In this section, the accuracy of the simulation is verified through experimental research, as illustrated in Figure 18. In the initial stage, a partition is strategically placed at the boundary of the smoke–generating area to effectively control the smoke produced by the combustion of the smoke cake and prevent its diffusion into other areas of the tunneling roadway. The primary objective of this partition is to limit the spread of smoke using physical barriers, thereby ensuring both the safety of the experimental environment and the accuracy of the experimental results. To meet the required air volume, the JYF–50S adjustable fan has been selected as the air supply equipment, and CO sensors have been installed at three monitoring points.
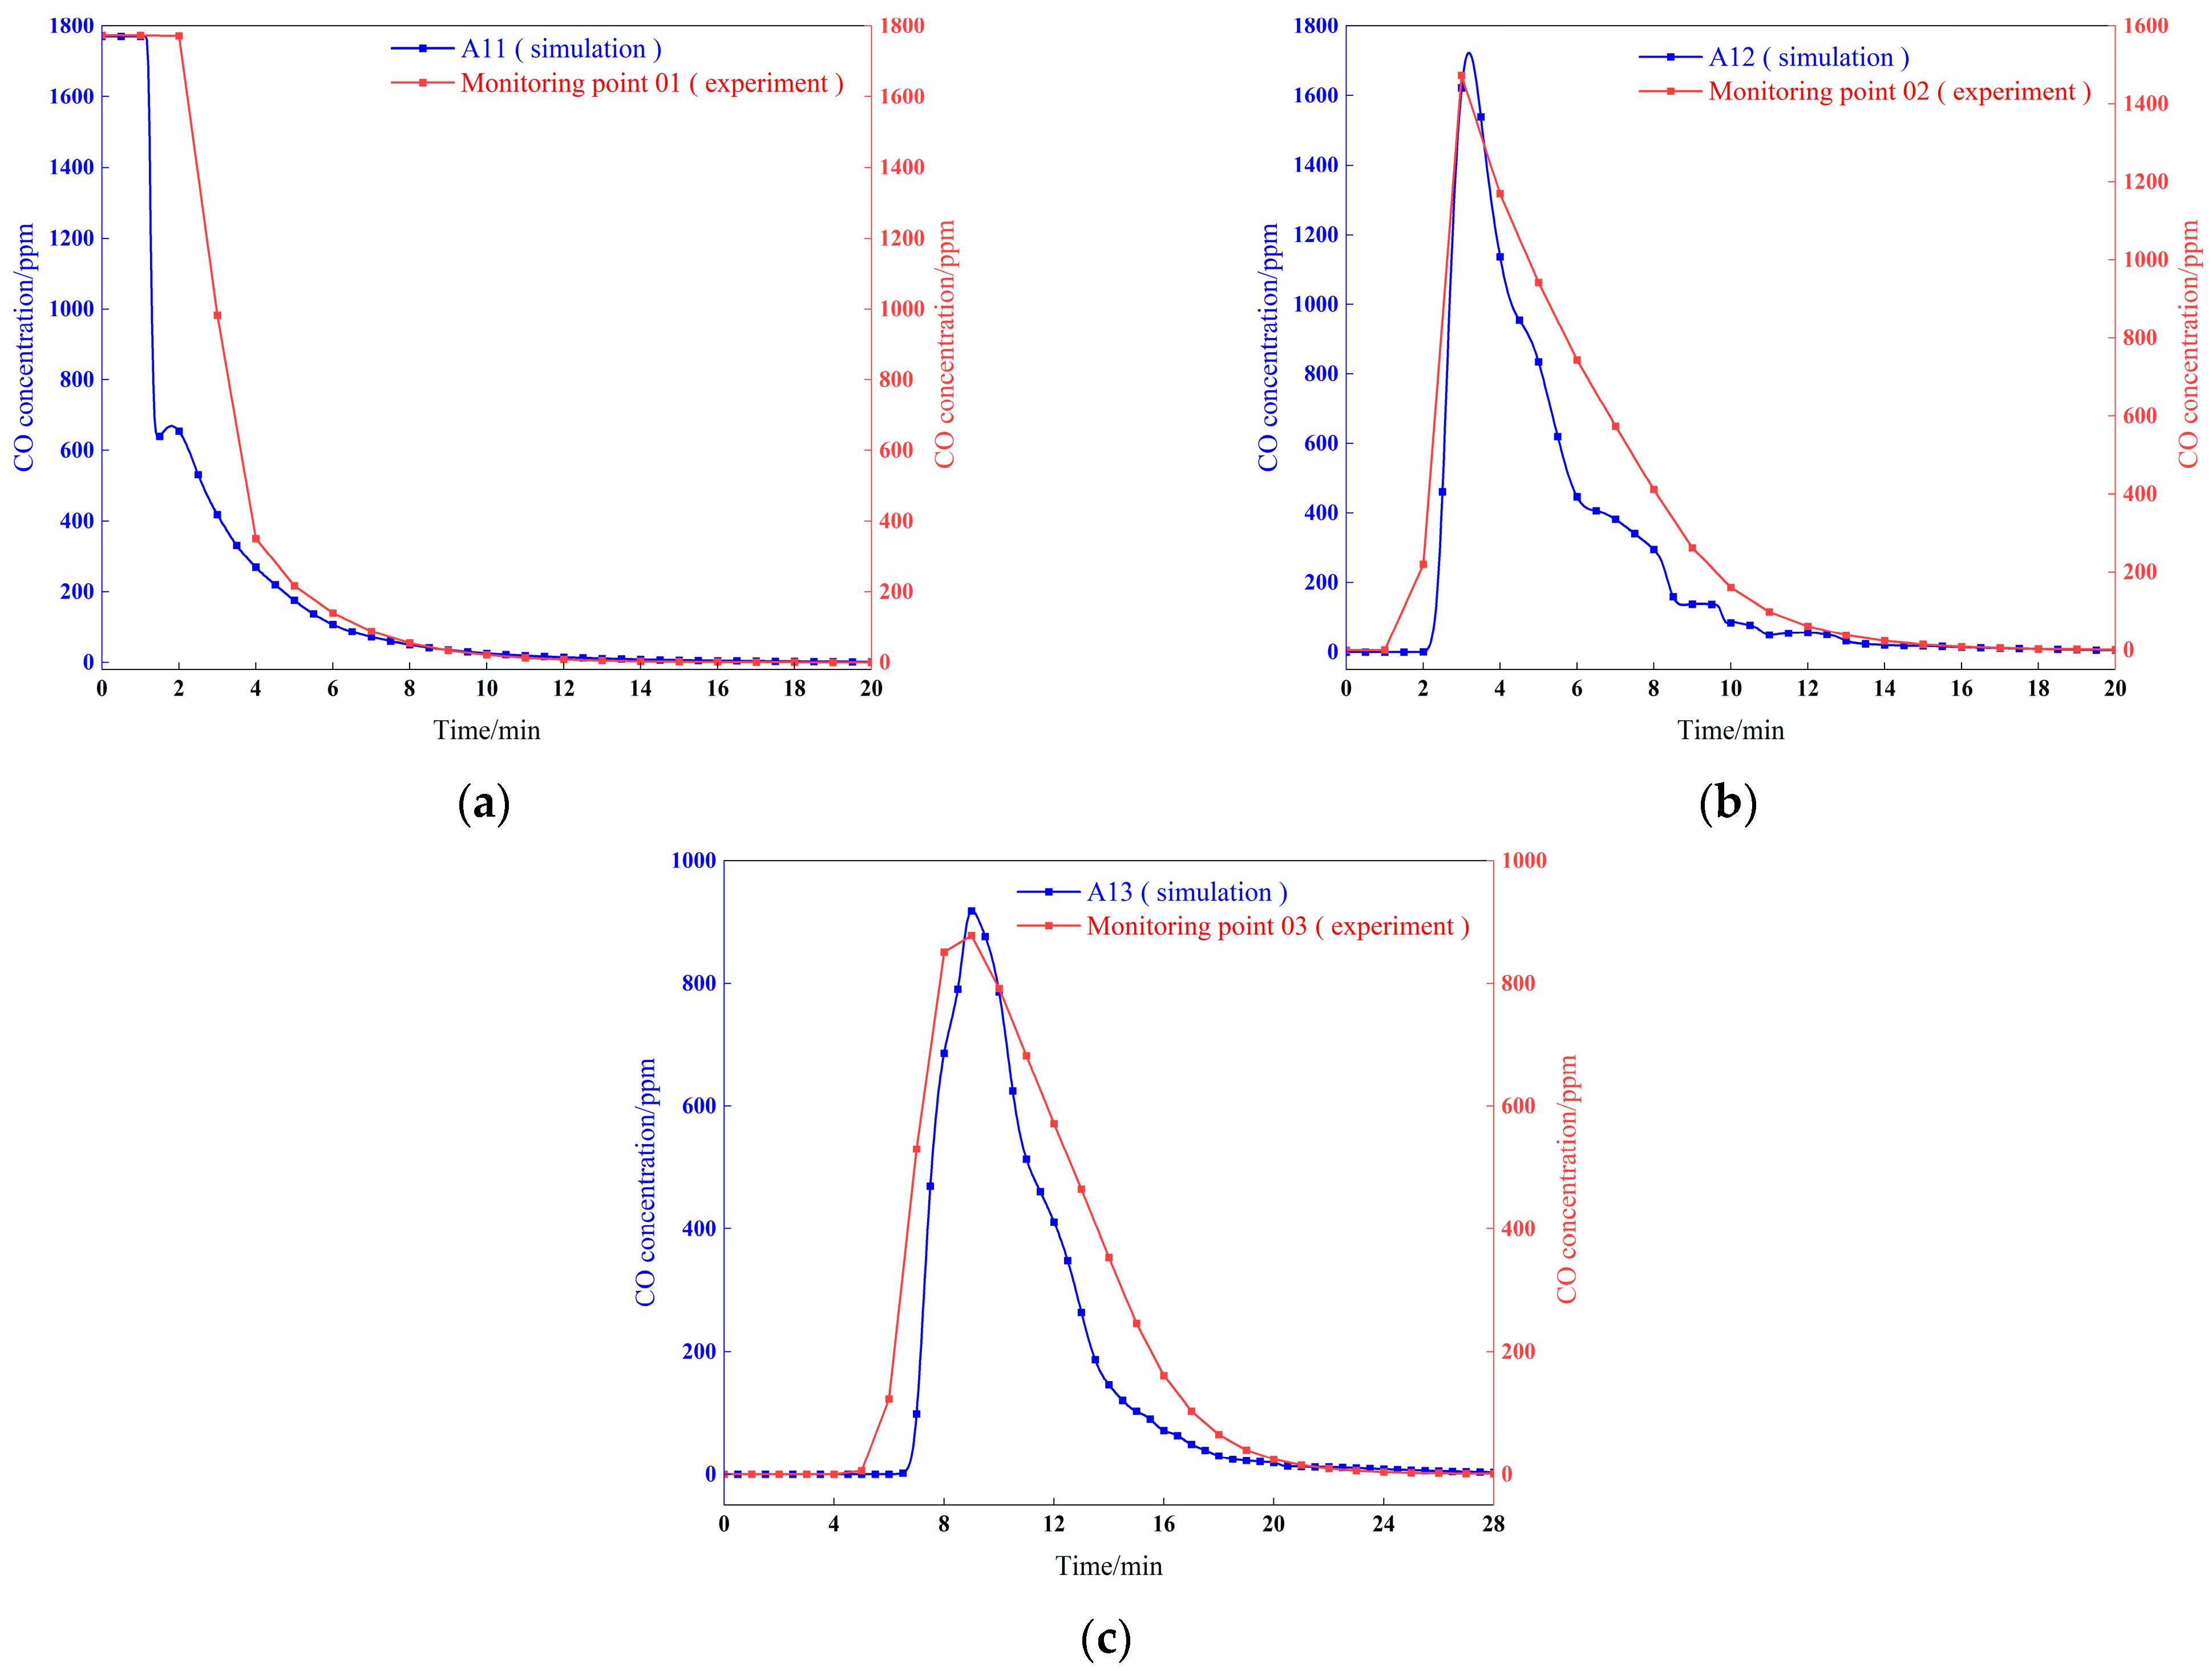
Due to the constraints imposed by the test site, the experimental system was constructed following a scale ratio of 1:16. The experimental model featured a stope length of 5 m, a roadway section wall height of 0.13 m, and a diameter of 0.28 m. The air duct had a diameter of 0.05 m, and the distance from the air duct outlet to the working face was 1.03 m. Carbon monoxide (CO) sensors were installed at distances of 13 cm, 250 cm, and 488 cm from the heading face. Additionally, the local fan was positioned 0.94 m from the excavation roadway exit, while the length of the throwing area was 1.31 m. Given the limitations of the experimental conditions, strict adherence to dynamic similarity was not required. The wind speed at the air duct outlet was scaled down, resulting in an air duct wind speed of 0.25 m/s, thereby ensuring that the flow processes of the experiment and simulation occurred on the same time scale [9]. The curve depicting CO concentration over time at each corresponding point in both the simulation and experiment is illustrated in Figure 19. Both the experiment and simulation indicate that the CO concentration within the throwing area consistently decreases, while the CO concentration outside the throwing area initially increases before subsequently decreasing. The simulation results align with the experimental findings, as the experimental design preserved the consistency of geometric and flow rate ratios, thus ensuring equivalence in the time scale. This similarity in design allows the gas concentration change curves obtained from both the experiment and simulation to exhibit comparable trends and morphological characteristics. The experimental data validate the concentration diffusion law derived from numerical simulation, encompassing the fundamental characteristics of concentration fluctuations.
At the monitoring points A11, A12, A13, 01, 02, and 03, the time required for the carbon monoxide (CO) concentration to decrease to 24 ppm was recorded as 616 s, 808 s, 1126 s, 600 s, 840 s, and 1260 s, respectively. The CO concentration peaked at the monitoring points A12, A13, 02, and 03 at 192 s, 542 s, 180 s, and 540 s, respectively, with peak values of 1723 ppm, 919 ppm, 1473 ppm, and 878 ppm, respectively. When the time required to reduce CO to 24 ppm is used as the criterion, the error between A11 and 01 is 2.67%, the error between A12 and 02 is 3.96%, and the error between A13 and 03 is 11.90%. Conversely, when the peak value is used as the criterion, the error between A12 and 02 is 16.97%, while the error between A13 and 03 is 4.67%. In summary, the error between the simulation and experimental results is within 16.97%.
There are several reasons for the observed error. First, this study employs a geometric scale of 1:16 to design the experimental model. If the Reynolds similarity criterion were strictly adhered to in determining the outlet wind speed parameters, the wind speed would theoretically need to be set at 64 m/s to satisfy complete similarity conditions. However, due to safety concerns and the practical operability of the experimental equipment, achieving such a high wind speed in a laboratory environment poses significant challenges and safety hazards. Consequently, the similarity criterion is simplified in the experimental design, with wind speed parameters being reduced directly in accordance with the geometric scale. While this simplification ensures the feasibility of the experiment, it inevitably results in a deviation between the measured concentration peak values and the predicted values from the numerical simulation, thereby affecting the accuracy of the time required for CO concentration to decrease to 24 ppm. Secondly, the location of the concentration sensor used in the experiment does not correspond precisely to the monitoring points in the numerical simulation. This slight discrepancy in spatial location is directly reflected in the concentration measurement results.
5. Conclusions

In this work, the steady–state airflow and diffusion modes of toxic gases with and without intermediate tunnels at different effective distances are studied by utilizing numerical simulation. A total of 5 different effective ranges of equal–length air ducts were selected to determine the best effective range. The main findings are summarized as follows:
(1) The presence or absence of intermediate roadways has negligible influence on blasting fume dispersion patterns within the stope. When the effective range is set to ER–1, the observed deviation is only 8 s. In complex mine ventilation systems, strategically positioned equipment in intermediate roadways can significantly enhance the extraction efficiency of blasting fumes from the stope.
(2) As the effective range increases, the time required to reduce CO concentration to 24 ppm follows a linearly increasing trend across the respiratory plane, overall space, and monitoring points. Correspondingly, the maximum airflow velocity at the working face exhibits a linearly decreasing trend, while peak CO concentration demonstrates a linearly increasing trend. Notably, when the effective range is set to ER–1, CO concentrations reach safe thresholds more rapidly.
(3) Over time, the CO concentration in the stope’s throwing area progressively decreases, while the concentration outside this area initially increases before declining. Experimental results demonstrate good agreement with numerical simulations, with a maximum deviation of 16.97%, confirming the accuracy of the simulation model.

Author Contributions

Conceptualization, L.C.; methodology, Y.T.; software, Y.T.; validation, Z.X.; formal analysis, N.Z. and Z.X.; investigation, L.C., N.Z. and Z.X.; resources, L.C.; data curation, Y.T. and N.Z.; writing—original draft, L.C. and Y.T.; writing—review and editing, Z.L.; supervision, Z.L.; funding acquisition, Z.L. All authors have read and agreed to the published version of the manuscript.

Funding

This research was funded by the Since Research Project of Hebei Education Department under Grant No. QN2025304, Hebei Natural Science Foundation under Grant No. E2025402033, Handan city social science federation annual key projects under Grant No. 2025483, National and Regional Research Center of the “Belt and Road” of the National Ethnic Affairs Commission–Japan Emergency Management Research Center under Grant No. 2024RBYJGL–3, and the Innovation Fund Project of Hebei University of Engineering under Grant No. SJ2401002066.

Data Availability Statement

All data generated or analyzed during this study are included in this published article.

Conflicts of Interest

The authors declare that they have no known competing financial interests or personal relationships that could have appeared to influence the work reported in this paper.

References

  1. Harris, M.L.; Mainiero, R.J. Monitoring and removal of CO in blasting operations. Saf. Sci. 2008, 46, 1393–1405. [Google Scholar] [CrossRef]
  2. Torno, S.; Toraño, J.; Ulecia, M.; Allende, C. Conventional and numerical models of blasting gas behaviour in auxiliary ventilation of mining headings. Tunn. Undergr. Space Technol. 2013, 34, 73–81. [Google Scholar] [CrossRef]
  3. Onder, M.; Sarac, S.; Cevik, E. The influence of ventilation variables on the volume rate of airflow delivered to the face of long drivages. Tunn. Undergr. Space Technol. 2006, 21, 568–574. [Google Scholar] [CrossRef]
  4. Cao, Y.; Ji, H.; Zhang, Y.; Li, S. Study on distribution of CO and concentration prediction in blind gallery after blasting operation. Arch. Min. Sci. 2018, 63, 283–300. [Google Scholar] [CrossRef]
  5. Kosutova, K.; Van Hooff, T.; Vanderwel, C.; Blocken, B.; Hensen, J. Cross–ventilation in a generic isolated building equipped with louvers: Wind–tunnel experiments and CFD simulations. Build. Environ. 2019, 154, 263–280. [Google Scholar] [CrossRef]
  6. Liu, Q.; Nie, W.; Hua, Y.; Peng, H.; Liu, C.; Wei, C. Research on tunnel ventilation systems: Dust diffusion and pollution behaviour by air curtains based on CFD technology and field measurement. Build. Environ. 2019, 147, 444–460. [Google Scholar] [CrossRef]
  7. Hua, Y.; Nie, W.; Cai, P.; Liu, Y.; Peng, H.; Liu, Q. Pattern characterization concerning spatial and temporal evolution of dust pollution associated with two typical ventilation methods at fully mechanized excavation faces in rock tunnels. Powder Technol. 2018, 334, 117–131. [Google Scholar] [CrossRef]
  8. Gao, W.J.; Liang, J.Q.; Xu, J.J.; Xia, F.S. Discussion on Ventilation of Single–head Roadway Blasting Driving. Min. Metall. Eng. 2021, 41, 16–20. (In Chinese) [Google Scholar]
  9. Li, H.K.; Wang, X.D.; Zhang, Y.; He, D.X.; Liu, J.; Guo, C.Y. Experiment on CO Concentration Characteristics and Ventilation Optimization of a Mine Roadway–type Stope under Multiple Factors. Min. Metall. 2023, 32, 10–17. (In Chinese) [Google Scholar]
  10. Wang, X.; Liu, X.; Sun, Y.; An, J.; Zhang, J.; Chen, H. Construction schedule simulation of a diversion tunnel based on the optimized ventilation time. J. Hazard. Mater. 2009, 165, 933–943. [Google Scholar] [CrossRef] [PubMed]
  11. Cong, H.; Bi, M.; Ren, J.; Li, B.; Bi, Y.; Li, Y.; Jiang, H.; Gao, W. Experimental studies on the smoke extraction performance by natural ventilation with a board–coupled shaft in a deep buried tunnel. Tunn. Undergr. Space Technol. 2020, 106, 103613. [Google Scholar] [CrossRef]
  12. De, S.E. Application of ventilation management programs for improved mine safety. Int. J. Min. Sci. Technol. 2017, 27, 647–650. [Google Scholar] [CrossRef]
  13. Huang, R.; Shen, X.; Wang, B.; Liao, X. Migration characteristics of CO under forced ventilation after excavation roadway blasting: A case study in a plateau mine. J. Clean. Prod. 2020, 267, 122094. [Google Scholar] [CrossRef]
  14. Ma, D.H.; Zuo, C.; Li, Z.M.; Zhang, S.G.; An, Y.L. Numerical Simulation Study on Ventilation Parameter Optimization for Blasting Fume Discharge in Single–head Roadways Based on CFD. Value Eng. 2023, 42, 103–107. (In Chinese) [Google Scholar]
  15. Wang, M.N.; Huang, G.; Cui, Y.T.; Ren, G.F. Study on the Diffusion Law of Blasting Fume in Roadway Development of Polymetallic Mines. China Min. Mag. 2022, 31, 113–120. (In Chinese) [Google Scholar]
  16. Li, M.; Aminossadati, S.M.; Wu, C. Numerical simulation of air ventilation in super–large underground developments. Tunn. Undergr. Space Technol. 2016, 52, 38–43. [Google Scholar] [CrossRef]
  17. Miroshnichenko, I.; Sheremet, M. Comparative study of standard k–ε and k–ω turbulence models by giving an analysis of turbulent natural convection in an enclosure. Eur. Phys. J. Conf. 2015, 82, 01057. [Google Scholar] [CrossRef]
  18. Li, J.; Yu, B.; Zhang, X.; Wang, Y. An improved convergence criterion based on normalized residual for heat transfer and fluid flow numerical simulation. Int. J. Heat. Mass. Transf. 2015, 91, 246–254. [Google Scholar] [CrossRef]
  19. Sa, Z.; Li, F.; Qin, B.; Pan, X. Numerical simulation study of dust concentration distribution regularity in cavern stope. Saf. Sci. 2012, 50, 857–860. [Google Scholar] [CrossRef]
  20. Zhou, W.; Nie, W.; Liu, C.; Liu, Q.; Hetang, W.; Wei, C.; Yan, J.; Yin, S.; Xiu, Z.; Xu, C. Modelling of ventilation and dust control effects during tunnel construction. Int. J. Mech. Sci. 2019, 160, 358–371. [Google Scholar] [CrossRef]
Figure 1. Physical Model. (a) Five effective ranges. (b) Model of a non–middle tunneling system. (c) Model of a middle tunneling system.
Gases 05 00020 g001
Figure 2. Schematic of roadway model grid (a) Grid diagram when there is a middle roadway. (b) Grid diagram without middle end roadway. (c) Local grid diagram.
Gases 05 00020 g002
Figure 3. Monitoring line AB.
Gases 05 00020 g003
Figure 4. Wind speed distribution along line AB for different grid resolutions.
Gases 05 00020 g004
Figure 5. Wind speed contour map and streamline diagram. (a) Wind speed contour map without the influence of intermediate tunnels. (b) Grid diagram without middle end roadway. (c) Wind speed contour map under the influence of intermediate tunnels. (d) Streamline Diagram Under the Influence of Intermediate Tunnels.
Gases 05 00020 g005
Figure 6. Wind speed distribution map. (a) When there is no middle end roadway. (b) When there is a middle–end roadway.
Gases 05 00020 g006
Figure 7. Wind field at the working face without considering intermediate tunnels. (a) ER–1. (b) ER–2. (c) ER–3. (d) ER–4. (e) ER–5.
Gases 05 00020 g007
Figure 8. Wind field at the working face considering intermediate tunnels. (a) ER–1. (b) ER–2. (c) ER–3. (d) ER–4. (e) ER–5.
Gases 05 00020 g008
Figure 9. Fitted curve of maximum wind speed at the working face.
Gases 05 00020 g009
Figure 10. CO Concentration map at 60 s. (a) Absence of a mid–range tunneling system. (b) Presence of a mid–range tunneling system.
Gases 05 00020 g010
Figure 11. CO Concentration map at 500 s. (a) Absence of a mid–range tunneling system. (b) Presence of a mid–range tunneling system.
Gases 05 00020 g011
Figure 12. The fitting diagram of the time required to reduce the CO concentration in the respiratory plane and the whole space to 24 ppm. (a) Respiratory plane. (b) The whole space.
Gases 05 00020 g012
Figure 13. The concentration field at the working face when there is no middle end roadway. (a) ER–1. (b) ER–2. (c) ER–3. (d) ER–4. (e) ER–5.
Gases 05 00020 g013
Figure 14. The concentration field at the working face when there is a middle end roadway. (a) ER–1. (b) ER–2. (c) ER–3. (d) ER–4. (e) ER–5.
Gases 05 00020 g014
Figure 15. Fitting diagram of maximum concentration of CO at working face.
Gases 05 00020 g015
Figure 16. The variation in CO concentration with time at each measuring point. (a) A11. (b) B11. (c) A12. (d) B12. (e) A13. (f) B13.
Gases 05 00020 g016
Figure 17. The fitting diagram of the time required for the CO concentration at each sensor to be reduced to 24 ppm. (a) Monitoring points A11 and B11. (b) Monitoring points A12 and B12. (c) Monitoring points A13 and B13.
Gases 05 00020 g017
Figure 18. Schematic of experimental setup.
Gases 05 00020 g018
Figure 19. Simulation and experimental comparison diagram. (a) Monitoring points A11 and 01. (b) Monitoring points A12 and 02. (c) Monitoring points A13 and 03.
Gases 05 00020 g019
Table 1. The time required for the CO concentration in the breathing plane and the whole space to be less than 24 ppm when there is no middle end roadway.
Effective RangeER–1ER–2ER–3ER–4ER–5
Breathing plane12701336135214701480
The whole space14061478153015601580
Table 2. The time required for the CO concentration in the breathing plane and the whole space to be less than 24 ppm when there is a middle tunnel.
Effective RangeER–1ER–2ER–3ER–4ER–5
Breathing plane13341374142614521454
The whole space14141480147615281568
Disclaimer/Publisher’s Note: The statements, opinions and data contained in all publications are solely those of the individual author(s) and contributor(s) and not of MDPI and/or the editor(s). MDPI and/or the editor(s) disclaim responsibility for any injury to people or property resulting from any ideas, methods, instructions or products referred to in the content.