1. Introduction
The European Union, through the Green Deal [
1] and the Fit for 55 package [
2], aims to reduce CO
2 emissions by 55% by 2030 compared to 1990 levels, to achieve climate neutrality by 2050. Key instruments such as the RePowerEU Plan [
3] and the Net Zero Industry Act [
4] are accelerating the transition to alternative energy sources and reducing the use of fossil fuels, establishing a clear pathway to climate neutrality and more efficient resource use while also offering incentives for technological innovation and decarbonization. In this context, a central role is played by the European ETS System [
5], which regulates CO
2 emission allowances through a trading mechanism, thus incentivizing companies to invest in more sustainable solutions. At the Italian level, the National Integrated Energy and Climate Plan (PNIEC) [
6] and the National Recovery and Resilience Plan (PNRR) [
7] represent the regulatory framework for the transition of the glass sector. Finally, the National Circular Economy Strategy [
8] emphasizes the enhancement of recycling and the use of innovative materials, promoting a more sustainable and resilient production model. Special attention is given to the “
hard-to-abate” sectors, including the glass industry, which will benefit from incentives for the use of clean technologies, such as hydrogen, and energy efficiency improvements. The glass industry is particularly developed in Italy [
9]. Glass sector activities in Italy are classified according to ATECO codes [
9] and are primarily divided into two main areas: manufacturing, which involves four main types of glass—flat glass, hollow glass, glass wool, and glass fibers—as well as other productions such as artistic glass, and processing, which covers the stages following manufacturing, such as the treatment and finishing of glass products.
Italian companies play a key role in glass production at the European level. In 2022, total European production (EU27 + UK) [
10] was just under 40 million tons; considering only the flat glass and hollow glass sectors, Italy contributed nearly 6 million tons produced in the same year, representing 15% of the total European production.
The glass industry includes a variety of production processes, depending on the type of final product and its applications. However, all these processes involve glass melting at temperatures reaching up to 1600 °C, resulting in energy consumption and CO₂ emissions. As already reported in the literature [
11], the main glass sectors in terms of production, and thus consumption and emissions, are flat and hollow glass. In the flat glass production process, known as the “float glass” process, molten glass is poured out of the furnace and allowed to float on a layer of liquid tin, then properly cooled and cut into standard-sized sheets. These “float” sheets undergo further treatments such as coating or lamination. In glass processing companies, standard sheets are cut and worked according to various applications and needs, such as enameling, tempering, and assembly into insulating glazing units. Hollow glass containers are industrially produced through the fusion of raw materials in a furnace, followed by shaping and annealing processes. Secondary processing of hollow glass can include decoration, screen printing, painting, sandblasting, and satin finishing.
This study provides an integrated assessment of decarbonization pathways for the Italian glass industry, with a specific focus on achieving net-zero emissions by 2050. Supported by the Italian Glass Industry Association, data and decarbonization initiatives were collected from multiple national companies, enabling the identification of seven key decarbonization levers.
These levers were applied to two differentiated and plausible transition scenarios. The modeling relied on a combination of validated technical data, sector-specific assumptions provided by industry experts, and publicly available studies, ensuring alignment with the characteristics of the national context.
Building on this framework, a techno-economic analysis was conducted to estimate the cost implications of the proposed strategies over the long term (to 2050). Additionally, a simplified transition pathway was developed for the flat glass processing segment, accounting for its unique technological and operational features. This study further explores the main barriers and limitations associated with each lever and provides a comparative perspective with national strategies adopted by other major glass-producing countries.
From a scientific standpoint, this study introduces a new framework that combines multiple transition levers—including energy efficiency, cullet reuse, electrification, green fuels, and CCS deployment—thereby enhancing both the theoretical and applied understanding of industrial decarbonization.
Finally, through a quantitative evaluation of investment and infrastructure needs, this research delivers actionable insights for industry stakeholders and policymakers. To the best of the authors’ knowledge, this is the first study to address the decarbonization of Italy’s energy-intensive glass sector through a context-specific and cross-lever approach.
This led to a techno-economic analysis estimating the implementation costs of the two strategies by 2050. A simplified pathway was also developed for the flat glass processing sector, taking into account its specific characteristics. The limitations and barriers associated with each decarbonization lever were examined, and a comparison was conducted against the national strategies of other major glass-producing countries.
Finally, this study provides a comprehensive contribution—endorsed by leading Italian experts—on the potential pathways for the Italian glass industry to reach net-zero emissions by 2050. Grounded in a detailed analysis of the national context, it offers a clear assessment of the sector’s current status and identifies the key infrastructural and non-infrastructural enablers for a feasible decarbonization trajectory.
This study introduces an innovative framework that integrates multiple transition levers, including energy efficiency measures, increased use of recycled cullet, electrification, the adoption of green fuels, and the deployment of carbon capture and storage (CCS) technologies. In doing so, it advances both theoretical understanding and practical knowledge of industrial decarbonization.
Furthermore, it delivers a robust empirical contribution through the quantitative evaluation of investment needs and infrastructure requirements, offering strategic insights for industrial stakeholders and policymakers.
To the best of the authors’ knowledge, this is the first study to address the decarbonization of energy-intensive glass industries in Italy through an integrated and context-specific approach.
2. Materials and Methods
This study was developed with the contribution of a group of industry experts, researchers from the Stazione Sperimentale del Vetro, and energy managers from Italian companies. Data and insights were collected through surveys and consultations with glass industry associations, which also informed the definition of the applicable decarbonization levers. For the development of the strategy, reference was also made to the main decarbonization strategies developed internationally (France, UK, Germany) by authoritative institutions, in addition to an analysis of the existing literature [
12,
13,
14,
15].
The strategy adopts 2022 as the reference year. Economic outputs are benchmarked against the 2022 baselines values, while the CO2 reduction results are evaluated relative to a Business As Usual (BAU) scenario. The BAU scenario assumes emissions in 2030 and 2050 increase proportionally with expected production growth, while maintaining constant emission intensity based on 2022 levels. The report presents the outcomes of the sector’s decarbonization strategy for 2035 and 2050, aligned with the European Union’s climate targets. The enabling technologies for the sector’s decarbonization considered in the report include technologies available from research studies, operational technological prototypes globally, and solutions shared by the members of the sector working group. The decarbonization scenarios assume economic and infrastructural national contexts suitable for achieving the objectives.
For the calculation of CO₂ emissions and their categorization into Scopes 1, 2, and 3, the European Parliament Directive 87/2003 [
16] and the GHG Protocol [
17] were used. The applied emission factors were based on specific data provided by the working group and national factors developed by the Ministry of Environment and Energy Security. In the absence of specific data, emission factors from internationally recognized standards, such as those developed by the Department for Environment, Food and Rural Affairs (DEFRA) [
18], referenced by the GHG Protocol, were used. Scope 1 emissions, generated directly by the industrial activities of the glass sector (such as the melting process), have been thoroughly analyzed in this study, as they represent the main source of direct emissions. Scope 2 emissions, related to the consumption of purchased electricity, are instead linked to the national energy mix. It has been assumed that, in line with national and European decarbonization targets, the carbon intensity of the energy mix will progressively decrease. Nevertheless, this work also proposes a series of measures to reduce electricity consumption and to promote the direct procurement of energy from renewable sources. On the other hand, Scope 3 emissions, while important for a comprehensive life cycle assessment, are currently considered marginal for the Italian glass sector and are difficult to quantify with reliable and sector-specific data. Although Scope 3 emissions, related to upstream and downstream activities outside direct production processes, are an important part of the overall carbon footprint, in the specific case of the Italian glass sector, their impact is currently considered minor compared to direct emissions (Scope 1) and indirect emissions from purchased energy (Scope 2). Furthermore, the quantification of Scope 3 emissions remains highly uncertain due to the lack of standardized and sector-specific data. For these reasons, Scope 3 emissions were not included in the detailed quantitative analysis of this study but are acknowledged as an area for potential future investigation.
2.1. Decarbonization Levers
The decarbonization strategies focus on seven main levers to reduce emissions in the sector.
2.1.1. Green Fuels
The “Green Fuels” lever refers to the transition from fossil methane, the primary fuel used in the glass melting processes, to alternative gases such as biomethane or hydrogen. The former is obtained through a purification (upgrading) process of biogas, which is itself the result of anaerobic digestion (utilizing the spontaneous fermentation of organic material) of agricultural or livestock waste, or even an organic fraction of municipal solid waste (OFMSW). Unlike natural gas, biomethane is carbon-neutral, as it comes from recently formed organic material. Hydrogen, on the other hand, is found in nature only in pure form in geological formations that are difficult to exploit (referred to as White Hydrogen or Natural Hydrogen). It must thus be produced by synthesis starting from water (through electrolysis), natural gas, coal, or biomass (via thermochemical processes like methane steam reforming) exploiting reactions that consume energy. When used as a fuel, there are no direct carbon dioxide emissions, but the real decarbonization potential (or, on the contrary, the associated GHG indirect burden) depends on the production process, and specifically, on the energy used to power it; it will be emission-free if produced with renewable energy (Green Hydrogen), nuclear energy (Pink Hydrogen), or fossil fuels with CO
2 capture (Blue Hydrogen), but will contribute to climate altering emissions if produced from natural gas or coal without CCS measures (Gray and Black Hydrogen, respectively) [
19,
20].
2.1.2. Carbon Capture and Storage
The Carbon Capture and Storage (CCS) technology involves the capture, transport, storage, or reuse of CO
2 emissions associated with combustion and production processes in the glass sector and is a key technology for the sector’s decarbonization. While combustion emissions can be eliminated by switching fuels, process emissions are more challenging and may require the use of CCS. CCS enables the capture of combustion exhaust CO
2 from off-gases by separating CO
2 from other pollutants through various possible chemical processes. Once separated, CO
2 can either be used as a raw material in another process or be injected deep underground to store it indefinitely, thus preventing it from contributing to global warming. The most common CCS process for the glass sector involves CO
2 absorption with monoethanolamine (MEA). Through absorption and desorption, thermal energy is used to separate CO
2 from furnace gases, while electricity is used to compress the CO
2 into a liquid form. Other hypothesized processes include the use of hot potassium carbonate solution as absorption medium (LIFE project GLASS2LIFE) and CO
2 mineralization via electrolysis, using electricity to convert sodium chloride (NaCl) and CO
2 into NaHCO
3, Cl
2, and H
2 [
21,
22].
2.1.3. Energy Efficiency
Energy efficiency systems primarily involve improving the production process, optimizing manufacturing systems, and recovering waste heat to reduce energy demand. Various energy efficiency sub-levers can be implemented depending on the specific characteristics of the sites and facilities. A useful study serving as a reference for the hollow glass sector regarding energy performance indicators was recently made available in the scientific domain [
23]. A detailed analysis of energy efficiency measures can be found in the literature [
11,
24].
2.1.4. Further Electrification
The proposed technology involves replacing traditional furnaces with hybrid alternatives, promoting the electrification of existing plants. This revision of production processes allows electricity to replace fossil fuels. Electric boosting through the installation of electrodes in traditional furnaces is already widely used, generally covering up to 20% of the energy demand. Full electrification in the glass production process consists of using electric furnaces that, in a full Electric Melting configuration, take advantage of the electrical conductivity of molten glass, determined by its chemical composition, to reach the required melting temperatures. Current development projects foresee a maximum production capacity of 250 tons per day, while present day operating facilities typically have capacities lower than 100 tons per day [
12]. The main advantage of electric furnaces remains their higher efficiency, given the significant reduction in heat losses typically associated with combustion furnaces, both from unavoidable loss of enthalpy with flue gases and from heat losses through the crown and superstructure refractories, that typically have much higher service temperatures, and thus heat dispersions, in combustion furnaces compared to cold top all electric melters. Additionally, the investment, operational, and maintenance costs for this type of furnace may be lower due to simpler and less expensive components. Electrification becomes increasingly advantageous when electricity prices are competitive, and from an environmental perspective, it contributes more to emission reduction the more the electricity supply is decarbonized [
25,
26].
2.1.5. Further Use of Cullet
The use of cullet, or recycled glass, in place of virgin raw materials represents a significant decarbonization solution. Increasing the use of cullet reduces both the amount of carbonate raw materials required for glass production and the CO
2 emissions generated by the process. Each ton of cullet reused to produce new glass products saves 1.2 tons of raw materials and reduces process emissions by approximately 300 kg at the glass production site [
11]. Furthermore, a 10% increase in cullet use results in a 2.5–3% reduction in furnace energy consumption and a 10% reduction in process direct CO
2 emissions (as a result of less fuel combustion and less calcination gases from less primary carbonated raw material usage). Data presented by the Italian Consortium for the Recovery of Glass (CoReVe) demonstrate a new milestone reached by Italy in the circular economy challenge. Italy not only remains above the EU target set for 2030 for the recycling rate, which is 75%, for the fourth consecutive year but has also managed to exceed the threshold of 2.5 million tons of glass collected in a single year [
27].
2.1.6. Pre-Calcined Raw Materials
Pre-calcined raw materials undergo a preliminary thermal treatment known as calcination before being used in melting furnaces. During this phase, carbonate compounds like calcium carbonate (CaCO
3) or dolomite (CaCO
3·MgCO
3) are heated to high temperatures, between 900 °C and 1000 °C, releasing a significant portion of the CO
2 contained within them. This process transforms carbonates into calcium (and/or magnesium) oxides or other carbonate-free compounds, thus eliminating the CO
2 emissions that would be released inside the furnace during the glass melting process. In traditional production, the direct use of carbonates in furnaces causes the thermal decomposition of these materials, generating carbon dioxide as a process emission. The use of precalcined raw materials prevents this reaction inside the melting furnace, reducing direct emissions and improving overall process efficiency. Another advantage concerns energy efficiency; the use of pre-calcined raw materials optimizes the melting process since the materials do not need to undergo endothermic calcination reactions inside the furnace. Moreover, there is a further benefit for global CO
2 emissions, since the calcination kilns of the plants that produce precalcined raw materials are specifically optimized for this type of reaction and thus are more efficient than glass furnaces in performing carbonate calcination. These raw materials are compatible with electric or hybrid furnaces, where reducing process emissions is crucial for further improving efficiency, controlling energy costs, and even approaching higher decarbonization goals [
28,
29].
2.1.7. Sourcing of Green Energy
Sourcing green energy involves procuring electricity generated exclusively from renewable sources, such as photovoltaic solar, onshore and offshore wind, hydroelectric, biomass, and geothermal sources. This allows indirect Scope 2 emissions to also be abated. Companies can access green energy through various means: long-term contracts with renewable energy producers (Power Purchase Agreements—PPA); certified green energy, tracked through systems like Guarantees of Origin (GO), ensuring the traceability and renewable origin of the purchased electricity; or on-site self-production, for example, with photovoltaic installations at manufacturing sites. Power Purchase Agreements, in particular, offer a strategic advantage by providing long-term energy cost stability and protection from the volatility of fossil fuel prices and the spot energy market.
2.2. Definition of Sectors and Data Collection
The glass industry encompasses various types of production, each with distinct characteristics that are not always comparable. Given the complexity and diversification of the sector, it was necessary to adopt an approach based on the “clustering” of the industry according to production process types. This division allowed for a detailed and targeted analysis of the production stages and the applicability of decarbonization levers to each cluster. Two main macro-categories were analyzed:
Primary Production, subdivided into
Flat Glass: production mainly intended for the construction, furniture, and automotive markets.
Container Glass: manufacturing of products such as bottles and jars, primarily for the packaging, food, and cosmetic sectors.
Other Glass: includes domestic glass and other specific types of production, often with varied and customized processes depending on the final application.
Glass Transformation, subdivided into
Gas-Intensive Transformers: processes with high natural gas consumption, such as those related to automotive glass production, tempering, and other gas-intensive transformations.
Electricity-Intensive Transformers: processes with a high dependence on electricity, such as flat glass production for construction.
For each cluster, the applicable decarbonization levers were analyzed. In the first cluster of primary production, decarbonization primarily focuses on a mix of levers, with the predominant ones being the replacement of traditional fuels with green fuels and the application of CCS technology to intercept process and residual combustion emissions. In the second cluster, gas-intensive transformers stand out because electrification of the processes emerges as a priority solution to replace the use of natural gas, combined with energy efficiency improvements. For electricity-intensive transformers, sourcing green energy is crucial to reducing indirect emissions, along with energy efficiency solutions.
The various levers identified by the decarbonization strategy are applied differently across the various stages of the glass production process, depending on the energy vectors used and the specific operational needs. A detailed description of production processes is widely available in the literature [
11,
30]. Data collection through lists and questionnaires was conducted with the support of the industry association Assovetro.
2.3. Baseline Definition
Emissions in the glass sector are primarily classified as Scope 1 and Scope 2. Scope 1 emissions originate from the combustion of fossil fuels in the melting furnaces and from the process-related chemical reactions of raw materials (particularly the decomposition of lime and soda). Scope 2 emissions result from electricity consumption associated with powering the production processes. Thanks to data collection and consultation of the ETS registry for production sites, it was found that in 2022, the glass sector in Italy emitted 3,739,539 tons of CO2 per year. Of these, approximately 75% are direct Scope 1 emissions (2,797,307 tons of CO2), meaning emissions generated within the company perimeter. These emissions mainly stem from the combustion of fossil fuels in the melting furnaces and the chemical reactions of raw materials, particularly the decomposition of lime and soda. In addition to direct emissions, Scope 2 emissions are generated indirectly through the procurement of electricity for the production plants, which account for 25% of the total emissions (942,232 tons of CO2). Natural gas and electricity consumption, and consequently the related CO2 emissions, are geographically concentrated primarily in the regions of Northern Italy.
2.4. Definition of Decarbonization Scenarios
The decarbonization strategy for the glass sector aims to reduce the environmental impact. As already reported, an ad hoc strategy has been developed that also evaluated the main decarbonization roadmaps for glass developed at the international level, including the decarbonization roadmaps by CEMBUREAU [
31] and by WBCSD [
32].
2.4.1. Emissions Projections for the Sector 2035–2050
To build the transition pathway, it is essential to assess the projection of CO
2 emissions for the Italian glass sector in the BAU (Business as Usual) scenario until 2035 and 2050, divided between Scope 1 and Scope 2 emissions. The first step in constructing a decarbonization strategy is projecting CO
2 emissions for both the “mid-term” 2035 and “long-term” 2050, based on baseline data and the expected Compound Annual Growth Rate (CAGR) for sector production. The CAGR represents the average percentage growth of a quantity over a period of time [
33].
In our case, the equation for the calculation will be
where
is the forecasted production for year n + 1.
is the production value for year n (in the initial case , which represents the actual production in the year 2022).
C is the CAGR index, estimated as per the guidelines provided by the working group.
The CAGR has been assumed, with the agreement of the working group, to be 1.5% per year until 2035 for the production of glass containers, and 0.5% from 2036 to 2050. For the other clusters (flat glass production, others, and electric and gas transformers), the CAGR is 1% and 0.5%, respectively. This approach made it possible to outline the Business as Usual (BAU) scenario, i.e., the emission trajectory in the absence of decarbonization interventions, and to quantify the gap relative to the emission reduction curve defined by the Paris Agreement necessary to achieve the net zero emissions target by 2050.
This allows for delineation of the BAU scenario—i.e., the emissions trajectory in the absence of decarbonization interventions—and quantifies the gap compared to the emission reduction curve defined by the Paris Agreement necessary to achieve the net-zero target by 2050.
National glass production is expected to grow from 6.7 million tons in 2022 to 7.7 million tons in 2035 and 8.3 million tons in 2050. Without decarbonization strategies, this production growth will result in an absolute increase in CO2 emissions generated by the sector in the coming years. For this reason, it is essential to intervene with a strategy targeting both direct emissions (Scope 1) and indirect emissions (Scope 2), as already described.
The emission trend presented in the
Figure 1 illustrates the projected CO
2 emissions for the Italian glass sector in 2035 and 2050 under the BAU scenario. Two key dynamics are highlighted: Increase in Scope 1 emissions—as production volumes grow, direct emissions from process-related fossil fuel combustion rise proportionally. These represent the dominant share of total sectoral emissions.
Decrease in Scope 2 emissions—indirect emissions from electricity consumption are expected to decline due to a progressive decarbonization of the national energy mix, with a growing share of renewable energy, as projected by the International Energy Agency (IEA) [
34].
In 2022, total sector emissions amounted to 3.7 million tons of CO2, split between Scope 1 and Scope 2. Under the BAU scenario, total emissions are projected to slightly decrease by 2050, reaching 3.43 million tons of CO2. However, this reduction remains insufficient to meet the targets outlined in the Paris Agreement, as shown by the reference decarbonization curve. Without substantial policy acceleration—such as a potential revision of the EU ETS that anticipates net-zero targets by 2040—the current trajectory falls short of global climate goals.
This analysis underscores the need for urgent and concrete actions to enhance energy efficiency and accelerate the integration of low-carbon technologies across the sector. While the projected decrease in Scope 2 emissions is promising, its realization will depend critically on the national energy system’s ability to consistently support a transition toward renewable sources.
2.4.2. Green Fuels and CCS Scenarios
The BAU scenario analyzed from 2022 to 2050 serves as the reference trajectory for defining the decarbonization strategy of the Italian glass sector. The strategy is designed based on available technologies and adapted to the sector’s operational characteristics. A total of seven decarbonization levers are considered, with six targeting direct emissions (Scope 1) and one, sourcing green energy, addressing indirect emissions (Scope 2).
These levers are intended to be flexibly combined, depending on plant-specific constraints and production types. Diversification across solutions is considered essential for reaching net-zero objectives.
Regarding direct emission reductions, two differentiated strategies are foreseen for glass manufacturers (container, flat, and other types of glass) and transformers. In the first case, for glass manufacturers, the strategies to consider are Green Fuels or CCS.
The Green Fuels strategy integrates six decarbonization levers for reducing direct emissions, with Green Fuels and CCS being the most impactful. The interventions are structured in different time phases, as follows:
Furnace efficiency improvement—further efficiency upgrades yield a 5% reduction in emissions by 2035. This reduction will be maintained at a constant level from 2035 to 2050 compared to the BAU scenario. The impact is limited due to already high efficiency levels in Italian glassworks.
Increase in the use of secondary raw materials—raises the share of recycled glass, with a 2.8% emission reduction by 2035. This reduction will remain constant from 2035 to 2050 compared to the BAU scenario. Adoption is constrained by technical limitations.
Large-scale electrification—electrification of furnaces requires plant modifications, making full implementation of this strategy unlikely by 2035. Therefore, electrification interventions are divided into two main phases:
- ○
Pre-2035: a gradual emission reduction of up to 9% (vs. BAU).
- ○
Post-2035: a gradual emission reduction of up to 16% (vs. BAU).
Alternative raw materials—the use of decarbonized raw materials is also considered to further reduce process emissions. However, the impact of this lever will be limited (gradual reduction in emissions to 4.3% by 2035) due to the limited availability of these materials on the market.
Alternative fuels—in the coming years, the use of alternative fuels such as biomethane and hydrogen is expected, while maintaining the current furnace infrastructure. Their use will grow progressively until 2050, resulting in a significant reduction in emissions, amounting to 45% compared to the BAU scenario.
CCS—due to the low technological maturity of this lever, CCS implementation is not expected before 2035. By 2050, CCS plants are expected to be implemented to capture residual process emissions, completing the transition to a low-emission scenario.
The CCS strategy, in the event of possible unavailability of Green Fuels, initially involves a phase of energy efficiency and electrification, which reduces emissions by a total of 21%. The implementation of the Green Fuels lever will contribute to an additional reduction of 7%. The fourth lever, cullet (recycled glass), has an insignificant impact, contributing to a reduction of 3%. Finally, the CCS technology comes into play in the final phase, significantly reducing residual emissions by 69%, equivalent to 1.9 million tons of CO2eq. CCS is therefore applied to all emissions not covered by the other five levers.
In the CCS scenario, a series of emission reduction interventions are foreseen, structured in different time phases, as follows:
Furnace efficiency improvement—as per the Green Fuels scenario.
Increase in the use of secondary raw materials—same as above.
Large-scale electrification—same as above.
Alternative raw materials—considered zero in this scenario.
Alternative fuels—in the coming years, the use of alternative fuels such as biomethane and hydrogen is expected while maintaining the current furnace infrastructure. Their use will grow progressively until 2050, resulting in a reduction of emissions by 7%.
CCS—by 2050, CCS plants will be implemented as the central element of the emission reduction strategy. This technology will manage not only residual process emissions but also combustion-related emissions, contributing to a total reduction of emissions by about 70% compared to BAU.
As mentioned, Scope 2 emissions for both strategies are addressed through a dedicated lever focused on the progressive decarbonization of the energy supply. The strategy is articulated in three main phases:
Initially, energy consumption is reduced through efficiency interventions. Although the impact of this lever is limited, it is an essential step to maintain high production standards and optimize the use of available energy.
Subsequently, a significant portion of the required energy will be provided through off-site PPAs (Power Purchase Agreements), enabling direct access to zero-emission green energy. However, the full utilization of this solution requires the development of a more dynamic and liquid market that offers competitive prices and encourages wide adoption. To maximize the benefits, on-site energy generation with self-consumption should be increased.
Finally, to manage residual emissions, certified green energy will be purchased through Guarantees of Origin, completing the process and ensuring the achievement of climate neutrality goals.
2.4.3. Strategy for the Glass Transformer Sector
The glass transformer sector, which includes over 300 companies, is primarily made up of small and medium-sized enterprises with a turnover exceeding 500,000 euros in 2022. This segment of the glass industry is divided into two main categories: transformers related to the automotive sector and those related to construction. Based on operational characteristics, some companies primarily use electricity, while others combine electricity with natural gas.
In 2022, the sector emitted a total of 149,844 tons of CO2 equivalent. Of this, 15% (22,476 tons) comes from Scope 1 (direct emissions), while 85% (127,368 tons) is attributed to Scope 2 (indirect emissions related to the electricity consumed).
Scope 1 emissions mainly come from the use of natural gas in tempering processes, which is particularly important in the automotive sector. To reduce these emissions, the proposed strategy focuses on increasing the electrification of production processes, replacing some of the gas usage with electricity. This approach aims for a 7% reduction in Scope 1 emissions.
Scope 2 emissions, which make up the majority of the sector’s total emissions, are linked to the consumption of purchased electricity. The strategy for these emissions involves a shift to a more sustainable Italian energy mix, with greater penetration of renewable energy sources. Additionally, the adoption of Power Purchase Agreements (PPAs) to purchase certified renewable energy will help reduce residual emissions, supporting a faster transition toward an overall reduction in Scope 2 emissions. As outlined in the text, these decarbonization strategies indicate that for the transformer sector, energy efficiency and electrification are key solutions, but the shift to renewable energy sources is also a crucial priority for reducing emissions in the long term.
2.4.4. Technical-Economic Assumptions
The next section presents a summary of the technical–economic assumptions for the glass sector’s decarbonization strategy. These assumptions result from the reworking of data received from the sector’s working group, market research, and available research, aiming to outline the optimal transition path for the industrial sector towards lower carbon intensity.
Table 1 summarizes the main numerical assumptions used in the analysis and drafting of the decarbonization strategies for the glass sector, including data on projected emissions and the technologies involved.
Additional assumptions are as follows:
Biogas can be burned in the furnace as if it were natural gas, so there is no capex related to potential plant modifications to be made, as would be the case with hydrogen combustion.
The strategy involves replacing 20% of the remaining natural gas demand with biomethane. The remaining 80% of the natural gas demand is replaced with green hydrogen.
The electrification strategy aims to cover up to 40% of the energy input for glass melting and up to 80% for other stages of the process.
Since large-scale electrification is primarily feasible during furnace reconstruction, it is unlikely that this strategy can be fully implemented by 2035. Consequently, the interventions are divided into two phases (pre- and post-2035).
For the calculation of greenhouse gas emissions and the construction of projections to 2050, the emission and conversion factors provided by DEFRA (Department for Environment, Food & Rural Affairs) were used.
3. Results
The projection of CO2 emissions reduction by 2050 highlights the contribution of each lever in the strategy. Scope 1 emissions, which amounted to 2.7 million tons of CO2 equivalent in 2022, are progressively reduced until they are eliminated through the combined adoption of the levers.
3.1. Results of the Green Fuels Scenario
In the initial phase, the implementation of energy efficiency and electrification levers allows for a reduction of 5% and 16%, respectively, compared to baseline levels. Subsequently, the adoption of Green Fuels proved to be the most effective measure, leading to a reduction of 45% compared to the initial condition. The use of cullet further contributes, with a 3% reduction. Finally, carbon capture and storage (CCS) represents the second most significant lever, contributing to a reduction of 26%. This technology is capable of eliminating the residual emissions that cannot be removed by the previous levers. Lastly, the use of alternative raw materials (precalcined, MPA) further reduces emissions by 4%, ultimately bringing them to zero by 2050. It should be noted that the adoption of alternative raw materials was not significantly included in the strategy. This is because CCS technologies, applied at the final stage, fully eliminate process emissions, making the use of a high-cost technological lever, which has limited availability on the market, unnecessary. Thanks to the overall contribution of these levers, Scope 1 emissions will be reduced to zero by 2050, in line with the commitments of the Paris Agreement.
In summary, in the Green Fuels strategy, the Green Fuels and CCS levers play a central role. The former involves reducing the consumption of traditional fossil fuels, primarily natural gas, by using alternative fuels such as biomethane and hydrogen. The latter applies CCS technology at the final stage, addressing only the residual emissions that cannot be eliminated by the previous levers. Additionally, the strategy integrates the use of alternative raw materials (MPA), which are not included in the CCS strategy. A projection of Scope 1 emissions over the years, as a result of the implementation of the described strategy, is shown in
Figure 2, where it can also be compared with the emissions trend in the BAU scenario, with no intervention.
The strategy involves increasing annual costs and imposing progressively higher financial burdens on glass sector companies. To illustrate the economic impact of this strategy, two key years have been identified: 2035 and 2050.
The year 2035 represents the “threshold year”, from which point the large-scale implementation of significant measures is anticipated, such as the adoption of CCS technologies and the refurbishment of furnaces to make them compatible with hydrogen use (“hydrogen-ready”).
The year 2050 is the target year for achieving full decarbonization, in line with the European Union’s climate objectives. In these reference years, companies are expected to incur considerable additional costs, resulting both from investments in capital expenditure (Capex) and operational expenditure (Opex). However, potential savings are expected from the reduction in CO2 emissions due to the reduced energy consumption following the application of measures such as energy efficiency improvements and further use of glass cullet.
In comparison with the CCS-based strategy, a critical element is the high costs associated with sourcing green hydrogen and biofuels. These energy vectors are essential for reducing emissions, but their use presents significant economic and infrastructure challenges.
Additionally, this strategy includes the use of decarbonized raw materials. While this contributes to further reducing the overall carbon footprint, it incurs additional costs related to sourcing and managing the new supply chain.
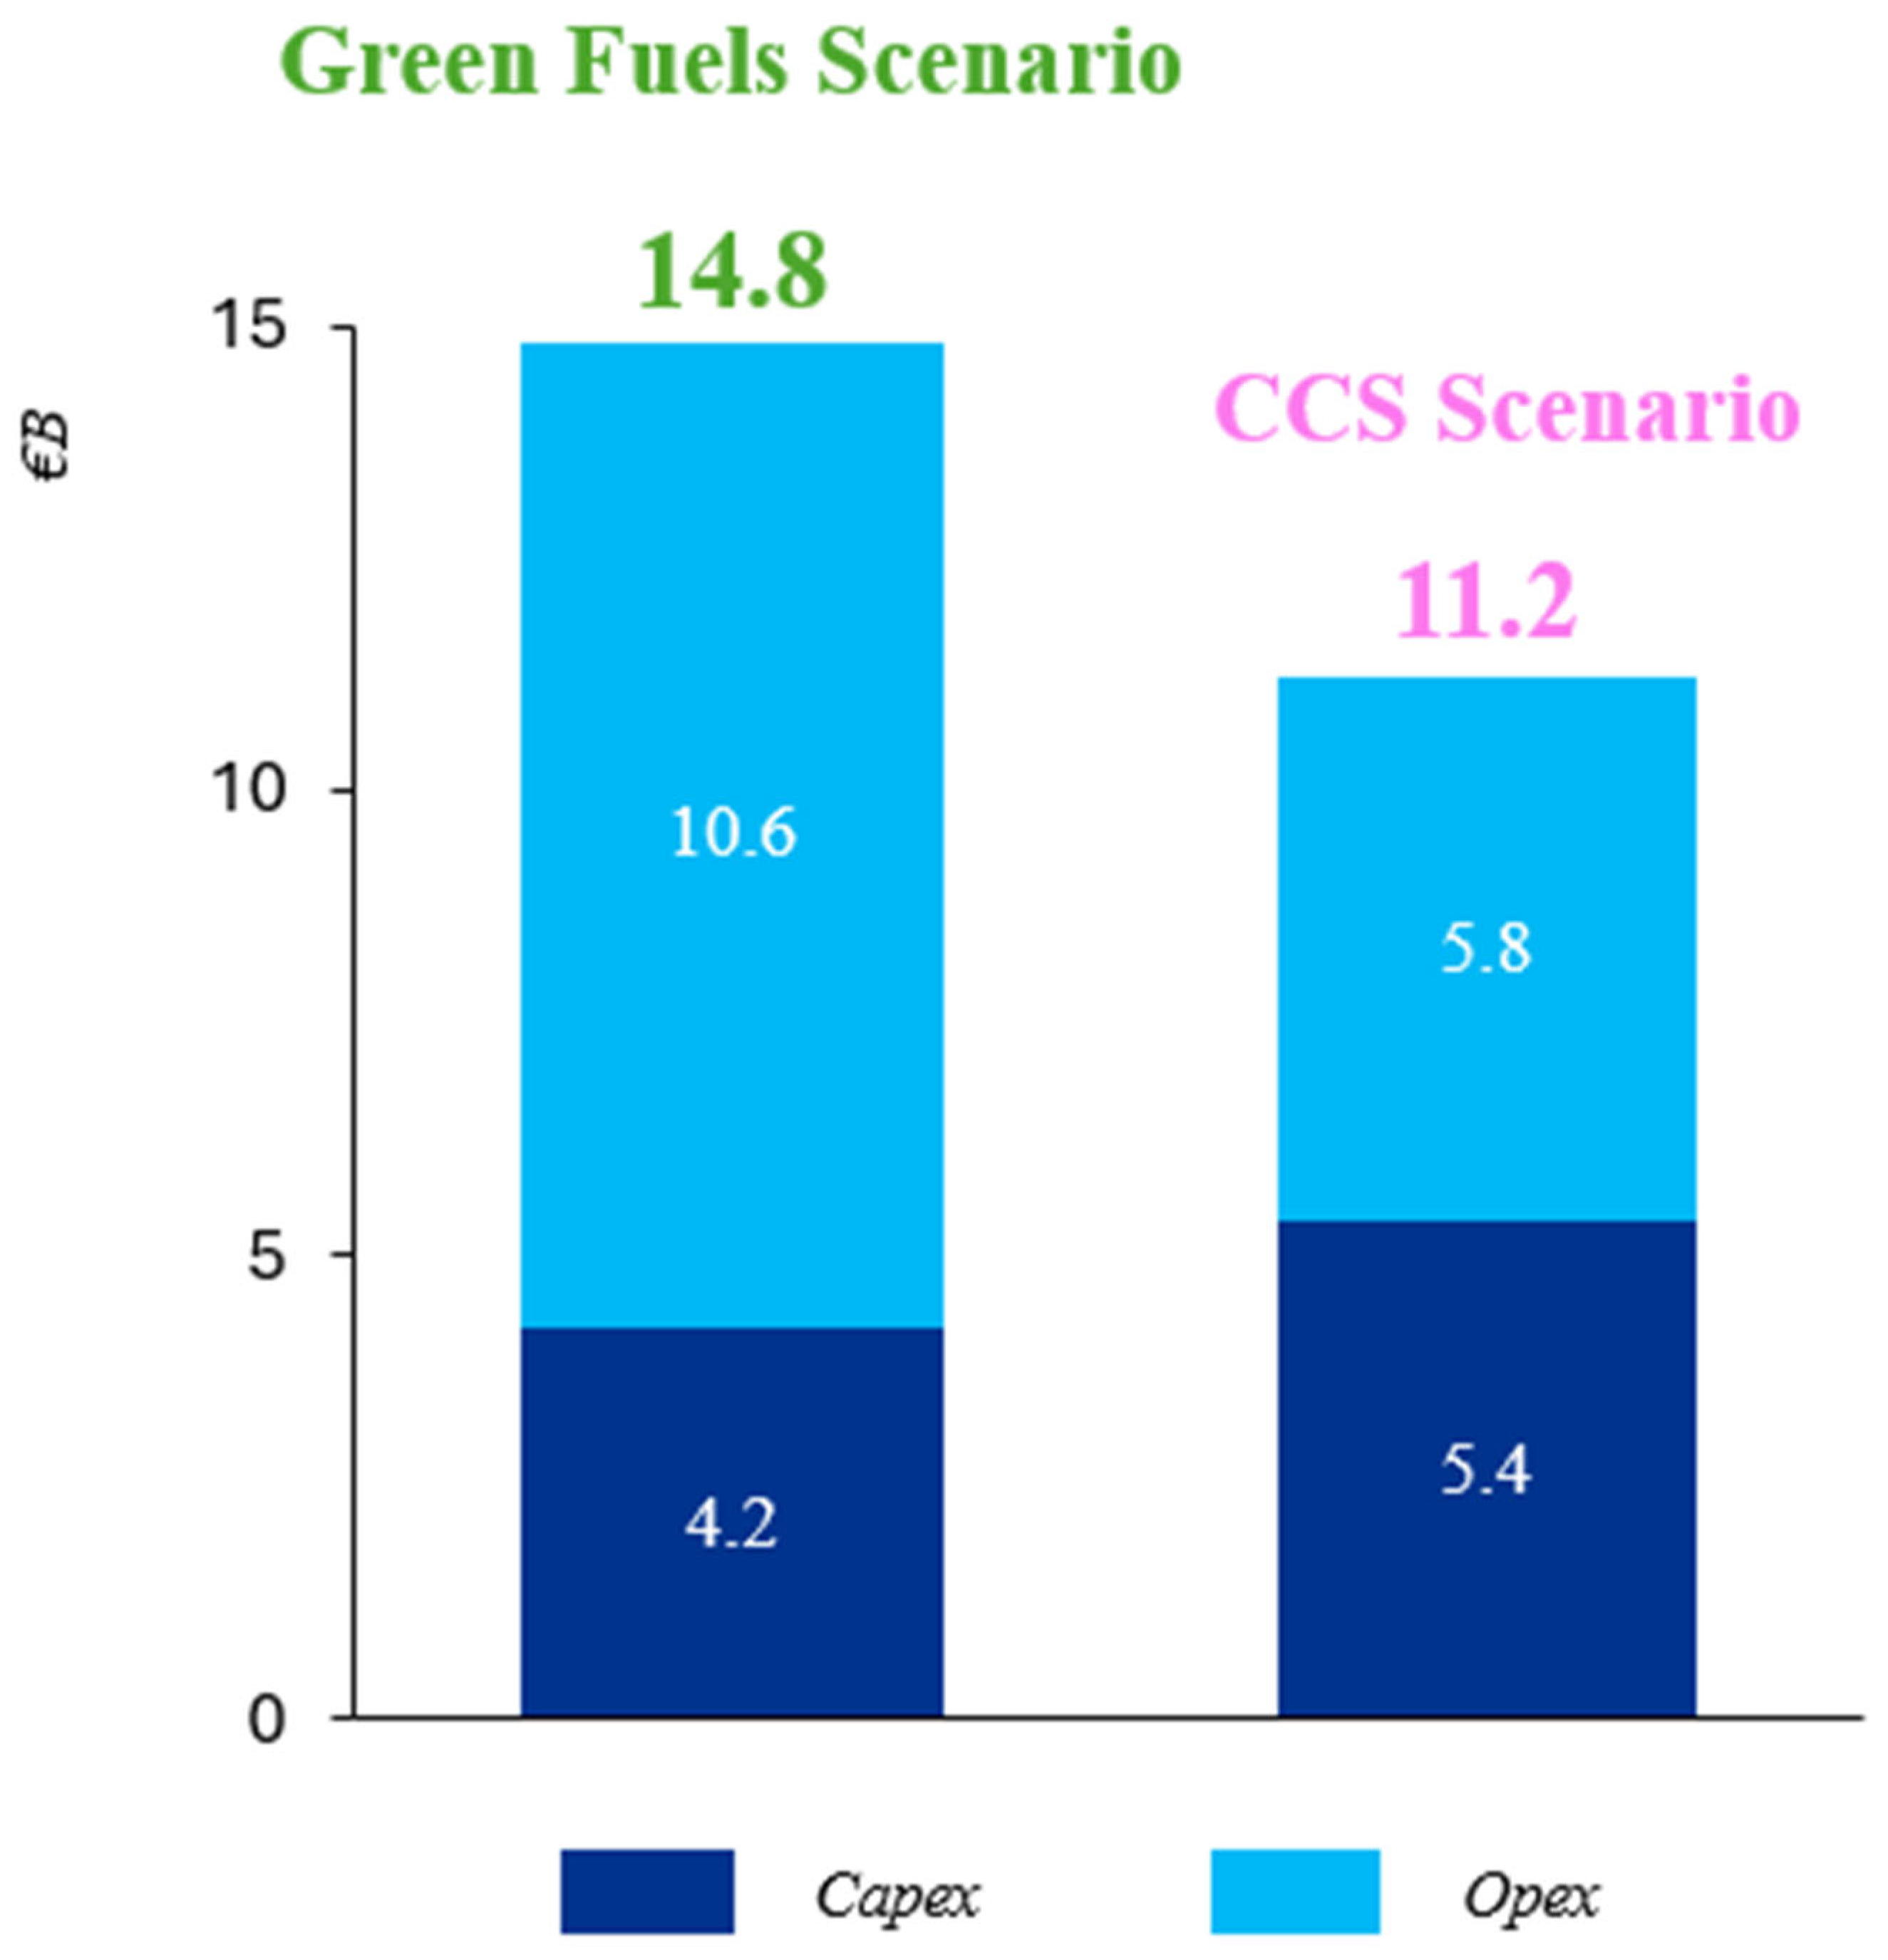
The total cumulative cost by 2050 for this strategy is EUR 14.81 billion, divided into EUR 4.24 billion for Capex and EUR 10.58 billion for Opex.
3.2. Results of the CCS Scenario
Thanks to the combined contribution of all these measures, Scope 1 emissions are reduced to zero by 2050, thereby achieving the carbon neutrality target. The initial measures have a gradual and limited impact, while CCS technologies play a crucial role in managing residual emissions. Similar to the Green Fuels strategy, the CCS strategy also presents a comparison between the BAU scenario and the CCS strategy concerning the reduction in Scope 1 emissions and the growth of production in the glass sector. As shown in
Figure 3, the BAU scenario predicts a constant increase in CO
2 emissions alongside production growth.
In contrast, the CCS strategy shows a significant reduction in Scope 1 emissions despite increased production. Starting from 2.7 million tons of CO2 in 2022, emissions follow a decreasing trajectory; until 2035, the year the CCS technology is expected to be operational, and the other planned measures contribute to a −22% reduction in emissions. From 2035 onwards, the trend continues to decline until it reaches zero, mainly due to the implementation of CCS technologies to capture and store residual emissions.
Unlike the Green Fuels strategy, the CCS strategy incurs higher capital expenditures (Capex), not in 2035 but in 2050, when the construction of CCS plants is estimated to begin. The total cumulative costs by 2050 for this strategy amount to EUR 11.23 billion, divided into EUR 5.39 billion for Capex and EUR 5.84 billion for Opex.
3.3. Comparison Between the Two Scenarios
The estimated additional costs by 2050 for implementing the various decarbonization measures vary depending on the scenario considered. Specifically, the additional annual costs by 2050, including both Opex and Capex, are approximately EUR 15 billion in the Green Fuels Scenario and about EUR 11 billion in the CCS Scenario. These costs are accompanied by a reduction of 2.8 million tons of CO2 emissions compared to the Business As Usual (BAU) scenario.
In the Green Fuels scenario, the higher expenditure is attributed to the lack of competitiveness of green fuels in the market. In this strategy, green fuels (green hydrogen and biofuels) represent the main decarbonization vector, but their high production and procurement costs significantly impact the total operating costs.
In the CCS scenario, however, the strategy requires substantial initial investments for the construction of large carbon capture plants. These plants are designed to capture up to 70% of the total CO2 equivalent emissions produced by the glass sector. While investment costs are high, CCS provides a long-term solution with relatively lower operational costs compared to green fuels.
In conclusion, while the Green Fuels strategy involves continuous operating costs and depends on fuels with currently high prices, the CCS strategy requires high initial investments but offers a reduction in emissions with a more stable cost structure in the long run.
Figure 4 shows the decarbonization strategy costs per ton of glass, considering the impact of the EU ETS system. In the scenario where Net Zero is achieved by 2050, the ETS costs will be zero, in line with the Paris Agreement targets. In
Figure 5, the final results of the two strategies, divided into capex and opex, are reported.
In the end, in this study, a set of formulas and methodologies were applied to calculate the emission reductions across various decarbonization levers for the Italian glass sector. The model calculates residual emissions based on specific emission factors and the contribution of each lever. Each lever’s impact is quantified by calculating the emissions reduced per year, factoring in energy savings and associated costs. Economic savings from reduced energy use are also calculated, and costs for each lever are derived from assumptions about CAPEX, OPEX, and the price of energy sources.
3.4. Comparison with Other International Strategies
For this study, publications analyzing the glass sector across all its segments have been thoroughly examined. In the context of European analysis, it is crucial to also consider country-specific factors, such as energy costs, which can vary significantly. This section provides a brief comparison of the conclusions from analyses of Germany, France, and the United Kingdom—three countries with industrial characteristics similar to Italy’s, both in terms of the importance of the glass sector and its production segmentation and technological level (
Table 2).
For Germany and the United Kingdom, industry associations have already released detailed studies regarding the prospects for emission reductions. The scientific committee assigned to the Fédération des Chambres Syndicales des Industries du Verre in France has also carried out similar work [
43].
In general, these publications identify a decarbonization framework consistent with the one presented in this publication. For the French and UK sectors, the scenarios outlined in these documents foresee a more prominent role for full electrification. The German median scenario (referred to as the “hybrid scenario”) focuses more on the gradual penetration of various hybrid furnace technologies, starting in 2025, maintaining a natural gas component while increasing the percentage of electrification (up to 60–80% in so-called “super-hybrid” furnaces) only after 2035. It is only in the second decade of the decarbonization period that the spread of hybrid and super-hybrid furnaces fueled by hydrogen for combustion and a relatively small component of full-electric furnaces is expected.
Moreover, the French and British strategies emphasize the need to consider, at least in the short term, the contribution of alternative fuels such as biomethane or liquid biofuels. In contrast, the decarbonization model developed by the German industry envisages limited use of Carbon Capture and Storage (CCS), as it is considered less applicable due to widespread public opposition, limiting the technology’s application to an alternative of Carbon Capture and Utilization (reuse of carbon dioxide in other production processes). The French approach to CCUS is similar. British glass, however, does include this lever in its decarbonization framework. Regardless, all documents assert that achieving carbon neutrality by 2050 is feasible for the sector, although they emphasize that the actual goal will depend on having a favorable overall context, determined by competitive energy prices, fuels, and alternative production technologies, as well as regulatory support.
4. Technical Barriers
To analyze the decarbonization levers of the sector, it is essential to consider the key challenges in their implementation. Each lever will require different timelines based on its regulatory, technical, infrastructural, and economic feasibility. Major obstacles include the costs of alternative energy carriers and carbon capture, which are critical for emission reduction technologies. Two key aspects arise: the first is the timing of the levers, with some, like CCS, potentially only being applicable in a later phase due to ongoing technological development; the second is the intensity of their contribution to decarbonization. Aside from the temporal dimension, implementation challenges need to be addressed. The use of Green Fuels would have a significant impact economically, normatively, technically, and infrastructurally. In summary, the application of decarbonization levers faces four main barriers: economic, regulatory, technical, and infrastructural.
Barriers to applying the levers include the following:
For green fuels, biogas can be burned in existing furnaces without modifications, while hydrogen may require changes at high blending percentages. The main obstacle lies in the availability of hydrogen and biomethane in sufficient quantities to replace natural gas in high-consumption industries like glass production. Additionally, logistical, organizational, and financial challenges arise if hydrogen or biomethane cannot pass through the existing gas network. Regarding operational costs, hydrogen supply is currently prohibitively expensive without significant price reductions or strong incentives.
For energy efficiency, barriers include high investment costs, especially considering diminishing returns, and logistical challenges in implementing heat recovery systems due to the existing production line configurations.
For electrification, barriers include the limited capacity of electric furnaces compared to gas-fired ones, the need for significant changes to production lines when transitioning to electric furnaces, and the incompatibility of electric furnace technology with current thermal recovery initiatives. Moreover, electric furnaces have shorter lifespans and higher operating costs due to electricity prices.
Regarding the increased use of cullet (scrap glass), challenges include inconsistent collection and selection rates by glass type, the limited domestic availability of cullet due to export, and significant price fluctuations in the cullet market.
For pre-calcined raw materials, barriers include high production costs, limited calcination facility availability, emissions during calcination, potential furnace redesign costs, and challenges in material composition affecting the final product. The lack of economic support makes these materials less competitive.
For green energy sourcing, barriers include the need for significant investment in PPAs or self-production, insufficient renewable energy supply, and grid integration challenges due to the intermittent nature of renewable sources.
Regarding CCS technology, barriers include difficulty finding suitable geological storage sites, the complexity and high cost of CO2 separation, and the energy-intensive nature of CCS, which raises operational costs. There are also risks of long-term CO2 leakage and the lack of transportation infrastructure for CO2. Regulatory hurdles and delays in obtaining permits further complicate CCS implementation.
5. Discussion
The emissions reduction strategy represents a complex and demanding challenge. Public institutions must play a leading role in this process. In this context, the main systemic issues hindering the implementation of the strategy can be grouped into three broad categories:
This section presents several proposals that could positively contribute to achieving carbon neutrality for businesses. Specific regulatory proposals for each decarbonization lever are also discussed.
Support for Production Process: Change to support the transition to more sustainable production processes, and economic support for investments necessary to modify production processes for industrial transition must be considered. An additional key element is supporting the purchase of zero-emission energy, such as decarbonized electricity and hydrogen, to ensure that production costs remain competitive and that there are balanced competition conditions among Member States.
Bureaucratic simplification and priority support are other aspects to consider in making key resources more accessible, such as increasing available electricity generation and transport capacity and the possibility of purchasing energy from renewable or decarbonized sources, as well as simplifying the use of public lands for renewable energy facilities. It is also crucial to ensure that European funds are available to small and medium-sized enterprises, reducing investment risks and making the transition accessible to all production entities.
Finally, to protect the sector from unfair practices, strengthening trade defense measures against imports from third countries with less advanced environmental regulations is necessary. This can be achieved by accelerating the introduction of anti-dumping and anti-circumvention tariffs, as well as promoting new measures to protect domestic production and incentivize global environmental sustainability.
Infrastructure: The development of network infrastructures is another key element to support the energy transition. The proposal includes strengthening the electrical system, implementing CCS technology, and developing networks dedicated to hydrogen. To enable this, particular attention must be paid to cost distribution through appropriate tariffing methods and to implementation timelines, which must proceed in parallel with the adaptation of manufacturing plants. This is necessary to avoid critical situations, such as the push for the electrification of furnaces without first ensuring systemically an adequate and resilient energy supply grid.
Green Sourcing: Green energy sourcing requires specific measures. First, it is essential to define a production plan with predetermined quantities at fixed prices, using mechanisms such as ex-ante auctions. This is complemented by area planning, identifying public spaces exclusively for facilities dedicated to supplying energy-intensive processes. In this context, the most energy-intensive industrial processes must be considered a priority to allow them to decarbonize ahead of other sectors.
6. Conclusions
This study has examined decarbonization pathways available to the Italian glass sector, identifying effective combinations of technological levers capable of aligning with national and European climate targets. The analysis confirms that the path to climate neutrality is technically and economically feasible, provided it is enabled by a favorable regulatory framework, further development of infrastructures (e.g., for “clean” electricity production and distribution, green fuel production and distribution, CO2 transport, etc.), adequate financial support, and shared commitment between industry, stakeholders and institutions. The strategy centered on “green fuels”—particularly hydrogen—is a promising option for the Italian context, despite requiring substantial and well-coordinated infrastructure investments and being subject to hardly predictable geo-political pressures (wars, tariffs, “environmentally unfair” competition, legislative framework changes, resource scarcity crises, etc.). This approach offers a key advantage: it reduces emissions at the source, effectively preventing their generation, unlike the alternative strategy of carbon capture, which merely relocates emissions through safe geological storage, and has to face the additional potential geopolitical risk of storage scarcity crises. The proposed decarbonization levers are broadly applicable to other countries, provided they are adapted to local conditions. However, the relative degree to which they can be implemented—especially in terms of deployment percentages—depends heavily on each country’s specific circumstances. This became evident in the comparison with other national strategies. This study also provided a quantitative assessment of investment needs, estimating over EUR 10 billion in cumulative expenditure by 2050 under both scenarios. Ensuring the financial sustainability of this transition will require either public support or a virtuous investment cycle within the industry.
Grounded in the specific characteristics of the Italian context, this research provided a detailed assessment of the sector’s current state and highlighted the key factors, both infrastructural and non-infrastructural, necessary for a viable decarbonization path. It proposed an innovative framework that integrates multiple transition levers, such as energy efficiency improvements, increased use of recycled cullet, further electrification, adoption of green fuels, and carbon capture and storage (CCS) technologies. These strategies not only contribute to theoretical advancements but also enhance the practical understanding of industrial decarbonization processes. Furthermore, this study provided a quantitative evaluation of the required investments and infrastructure, offering strategic insights to guide decision-making for industrial stakeholders and policymakers. Through its integrated approach, this work made a contribution to the literature on decarbonizing energy-intensive industries, particularly in the Italian context. The main limitation of this study lies in the difficulty of predicting which technologies will ultimately be the most successful, whether the necessary infrastructures for implementing the transition levers will be developed by institutions, and whether the assumptions made will hold true in the future. The ongoing development of this study will involve periodic updates to reflect new developments and the evolving landscape of the sector. Despite these uncertainties, this study offers a validated reference framework for policymakers and industrial stakeholders and makes a meaningful contribution to the literature on decarbonizing energy-intensive industries in Europe.


 ,
, 


