Article

The Modification of Dairy Cow Rations with Feed Additives Mitigates Methane Production and Reduces Nitrate Content During In Vitro Ruminal Fermentation

by
Everaldo Attard
1,*,
Jamie Buttigieg
1,
Kalliroi Simeonidis
2 and
Grazia Pastorelli
2
1
Division of Rural Sciences and Food Systems, Institute of Earth Systems, University of Malta, MSD 2080 Msida, Malta
2
Department of Veterinary Medicine and Animal Sciences, University of Milano, Via dell’Università 6, 26900 Lodi, Italy
*
Author to whom correspondence should be addressed.
Gases 2025, 5(3), 12; https://doi.org/10.3390/gases5030012
Submission received: 5 February 2025 / Revised: 15 May 2025 / Accepted: 11 June 2025 / Published: 23 June 2025
(This article belongs to the Section Gaseous Pollutants)

Abstract

This study evaluated the effects of feedstuffs and additives in dairy cow rations on rumen methane production and nitrate content in groundwater. Two basal rations and their supplements were analyzed in regard to proximate parameters, and an in vitro rumen fermentation system assessed methane release and nitrate levels over 72 h. Supplementing dairy cow rations with Brassica rapa (BR) boosted the ether extract content, while silage produced the highest amount of methane. Rapidly degrading substrates like BR and ground maize produced methane faster, but in smaller amounts, than straw and silage. BR, Opuntia ficus-indica (OFI), and Posidonia oceanica (PO)-supplemented rations had mixed effects; PO reduced the methane yield, while OFI increased methane production rates. BR-supplemented rations had the lowest nitrate levels, making it suitable for anaerobic digestion. The multivariate analysis showed strong correlations between crude protein, dry matter, and ash, while high-nitrate substrates inhibited methane production, supporting the literature on the role of nitrates in reducing methanogenesis. These results emphasize the need to balance nutrient composition and methane mitigation strategies in dairy cow ration formulations.

1. Introduction

The dairy industry plays a vital role in global agriculture, providing essential nutrients to human populations and contributing significantly to the economy. However, it also faces considerable environmental challenges [1], particularly in regard to methane emissions and nitrate leaching, which have detrimental effects on the atmosphere and water systems, respectively. Methane, a potent greenhouse gas, is predominantly produced during enteric fermentation in the digestive system of ruminants, such as dairy cows [2]. Meanwhile, nitrates from manure and fertilizers can leach into groundwater, posing risks to ecosystems and human health. Such issues should be addressed to achieve sustainable agricultural practices and mitigate climate change [3]. By optimizing feed composition and enhancing digestibility, it is possible to reduce methane emissions and improve nitrogen utilization, thereby minimizing nitrate leaching [4].
Methane (CH4) production is an inherent result of the microbial breakdown of dietary carbohydrates in the foregut of ruminant animals, which supports ongoing microbial activity. However, methane is a potent greenhouse gas (GHG) [5] and represents a form of dietary energy loss for the host. Ruminant enteric fermentation is the largest biogenic source of methane, as a greenhouse gas [6], accounting for approximately 40% of the agricultural sector’s methane emissions globally. While it is evident that GHG emissions from the dairy industry have increased overall, dairy farming practices have become much more efficient, hence reducing the amount of GHG emissions per product [7]. Studies have shown that, on a global scale, the emission intensity (GHG/kg of milk) decreased by approximately 11% between 2005 and 2015 [7]. Nevertheless, the same studies also showed that there were distinct and large differences between the emission intensities in different regions. Developing regions were found to have higher emissions than developed regions. Furthermore, some areas within the same region were also found to have large variations in their emission intensities. Therefore, this implies that there are significant numbers of GHG mitigating measures that can be adopted by all regions [7]. Methane emissions can be mitigated by optimizing the feeding and nutrition of dairy cows [8]. This can be achieved through the use of balanced diets, improved feeding management, and the use of feed additives, as recently reviewed by Martin [9].
In addition to methane emissions, another group of problematic pollutants is that of nitrogen compounds, particularly nitrates [10]. Nitrate is a common pollutant found in water bodies, and its presence in high concentrations can lead to environmental and health hazards [11]. Nitrate pollution in water bodies is mainly caused by excess fertilizer application and the leaching of nitrogen compounds from livestock manure [10]. Dairy farming is one of the leading sources of nitrate pollution and, therefore, there is a need for effective mitigation methods [12]. One of the most effective ways to mitigate nitrate pollution in dairy farming involves the implementation of good nutrient management practices [13]. On the other hand, the utilization of animal manure as fertilizer also contributes to nitrate leaching. However, this can be mitigated by optimizing the amount and timing of fertilizer application, which reduces nitrogen inputs and improves the efficiency of nutrient uptake by crops [13]. This can be achieved through regular soil testing and the use of precision agriculture technologies [14].
The European Union has implemented several directives and policies aimed at reducing the environmental impact of agriculture, including dairy farming. These regulations provide a framework for member states to promote sustainable practices and mitigate greenhouse gas emissions and water pollution. The Common Agricultural Policy (CAP) is a comprehensive policy framework that supports farmers and promotes sustainable agriculture in Europe. It includes measures to reduce greenhouse gas emissions and improve nutrient management. The CAP’s Greening measures, and Rural Development Programs incentivize practices that enhance feed quality and reduce environmental impacts [15]. Launched in 2020, the EU Methane Strategy [16] aims to cut down methane emissions across the energy, agriculture, and waste sectors. In regard to agriculture, the strategy focuses on improving livestock management, including feed strategies to reduce enteric fermentation. The Nitrates Directive (91/676/EEC) requires member states to identify vulnerable zones and establish action programs to reduce nitrate leaching [17]. Improved feed quality and manure management are key aspects of these action programs [18].
In Malta, an archipelago of islands at the centre of the Mediterranean, a census, in 2020, carried out by the National Statistics Office (NSO), showed that, in total, there were 241 cattle farms that formed a total population of 14,447 heads of cattle [19]. Of this total, 5996 were dairy cows [19]. It is estimated that, in 2018, Malta generated 60,000 metric tons of CO2-equivalent methane from agricultural activities, with farms being the main contributor to these emissions [20]. Malta is amongst the European Union member states with the highest concentration of nitrates in its groundwater, with more than 70% of the groundwater exceeding 50 mg nitrates per liter [21].
Several studies have evaluated feedstuffs using in vitro fermentation methods. These methods were initially developed to assess the rate and extent of fermentation of feeds in ruminants; primarily focusing on forages and fibrous by-products [22,23], as well as estimating the fermentability of concentrate feeds (e.g., cereals, protein sources) to report their use in mixed rations. More recently, in vitro techniques have been used to determine the nutritive value of feeds in all-concentrate diets. Additionally, researchers have investigated the relationship between feed fermentation and gas quality, with particular attention to methane as a by-product [23,24]. As the dairy sector continues to evolve, ongoing research and innovation in feed quality and management practices remain essential.
We hypothesized that Opuntia ficus-indica, Brassica rapa and Posidonia oceanica, due to their abundance of bioactive compounds, could influence the ruminal microbiota. According to the literature on rumen modifiers, such substances typically do not act directly on methanogens but rather on the conditions that promote methanogenesis.
This study therefore aims to examine how modifying conventional feed rations with the inclusion of common plant-based could reduce methane production and decrease nitrate content during ruminal fermentation within an in vitro setup. The primary objective was to perform an initial screening of ration combinations containing plant materials with potential methane- and nitrate-reducing properties. To achieve this, each feedstuff and plant additive was first assessed individually to determine its specific contribution to the fermentation process.

2. Materials and Methods

2.1. Feed Resources

Two feed rations commonly used in Malta were studied. The individual feedstuffs comprising these rations were procured and mixed according to the recommended formulations. The feedstuffs included Special Dairy, Dairy B, Summer Dairy feeds, ground maize, sugar beet, hay, alfalfa, silage and straw (Table 1). Three locally abundant plant species were selected as feed additives for this study: Opuntia ficus-indica (L.) Mill. (OFI) cladodes, Posidonia oceanica (L.) Delile (PO) leaves and Brassica rapa L. (BR) aerial parts. These three plant species were incorporated within the basal feed ration as outlined in Table 1. They are generally considered either wastes or weeds of cultivation.

2.2. Proximate Analysis

All feedstuffs, feed additives and feed rations were oven-dried at 40 °C for 48 h and then ground using a blender to pass through a 1-mm sieve and stored for subsequent analysis prior to near-infrared (NIR) analysis. Near-infrared spectra of feed samples were acquired using a SpectraStarTM XT NIR spectrophotometer (Unity Scientific, Brookfield, WI, USA). Approximately 30 g of each of the two basal feed rations and the individual feedstuffs were transferred to the quartz sample holder, sealed with a gold reflector, and placed over the sample window (1 cm of diameter) to ensure direct contact and minimize noise due to light scattering. During spectral acquisition, the sample was set to rotate and read three times (with a total of ninety determinations per sample) to ensure uniformity. Spectral data were recorded as absorbance spectra in wavelength range from 1400 to 2500 nm. All proximate analyses were performed in triplicate both on feedstuffs and feed additives (Table 2), as well as for the complete rations (Table 3). The parameters analyzed included dry matter (DM), crude protein (CP), ether extract (EE), Neutral Detergent Fiber (NDF), Acid Detergent Fiber (ADF) and total Ash [25].

2.3. Inoculum Sources

In Malta, the predominant breed of dairy cow is the Holstein-Friesian [26]. Rumen fluid was collected at a slaughterhouse from culled cows [27] that had been fed under controlled conditions during their lactation period (i.e., commercial cow feed and additionally wheat, sulla and clover) and transported from nearby farms. Inoculum samples were collected from three cows (1 L per cow), mixed, and delivered to laboratory within 30 min from slaughter. The samples were transported in vacuum-sealed flasks pre-flushed with CO2. The rumen fluid and digesta were homogenized in a sterilized blender that had also been flushed with CO2. Dimethyl sulfoxide (DMSO, 5%) was added to the rumen filtrate to enable cryopreservation at −80 °C. The rumen fluid/DMSO mixture was then distributed (4 mL) in 15-mL centrifuge tubes pretreated with CO2. These tubes were then placed in a −20 °C freezer in a bath of isopropanol for one hour to achieve a temperature drop of 1 °C per minute. Subsequently, the tubes were transferred to a −80 °C freezer, allowing the same cooling rate in isopropanol and were finally removed from the alcohol and stored at −80 °C for the rest of the experiment [25].

2.4. In Vitro Gas Production

In vitro fermentation of the samples was conducted in 250 mL gas jars equipped with a side arm fitted with a valve to facilitate gas sampling. Briefly, a buffered solution [28] was prepared and placed in a water bath at 39° C under continuous CO2 flushing. Five jars (250 mL) were then filled with 78 mL of buffered solution and 0.5 g of randomly assigned feedstuffs (two replicates per feedstuff and one control) per run. Five aliquots of cryopreserved rumen fluid in DMSO were transferred to the water bath for inoculum resuscitation. Blanks contained only the medium and rumen fluid. The gas jars were incubated at 39 °C for 72 h. The pH of the contents of these bottles was recorded (pH meter, Thermo Scientific Orion 4-Star, Thermo Fisher Scientific Inc., MA, USA) at time 0 and again at the end of the experimental period (72 h). The pH of the medium and CO2 saturation at time 0 was indicated by a color change in the resazurin indicator from purple to pink/colorless [25].

2.5. Methane and Nitrates Determinations

To determine gaseous methane content, measurements were recorded at 0, 24, 48 and 72 h. Liquid samples were collected at the end of the cycle at 72 h. For methane production, a handheld infrared methane reader (EIRAA, P.R.C.) was used. The outlet of the side arm was opened, and the methane concentration was measured after 5 s. Nitrate content was measured using a spectrophotometric method [29]. Briefly, a calibration curve was established for nitrate concentrations between 0 and 1000 mg L−1 at a wavelength of 240 nm (R2 = 0.9976).

2.6. Statistical Analysis

Repeated measures ANOVA was performed with SPSS software (version 26.0 for Windows, SPSS Inc., Chicago, IL, USA). Tukey’s test was applied to assess significant differences among the variables in terms of methane and nitrate contents. Methane production over time was modelled as a function of time by fitting the experimental data to a non-linear regression model. This model follows the first-order kinetics model proposed by Hashimoto [30] (Equation (1))
B M P t = B 0 ( 1 e x p k t )
where BMPt (BioMethane Production) represents the cumulative CH4 yield (L CH4 kg VS−1) at time t (days) expressed in days, B0 is the ultimate CH4 yield (L CH4 kgVS−1) and k is the BMP rate constant (day−1), which is substrate-specific and indicates the time required to achieve a certain fraction of B0.
Principal Component Analysis (PCA) was conducted on all proximate feed parameters using XLSTAT (Microsoft, version 19.4.46756, SAS Institute Inc., Marlow, Buckinghamshire, UK) to identify correlation or divergences among parameters of the basal and supplemented rations. For all statistical analyses, a significant level of p < 0.05 was considered.

3. Results

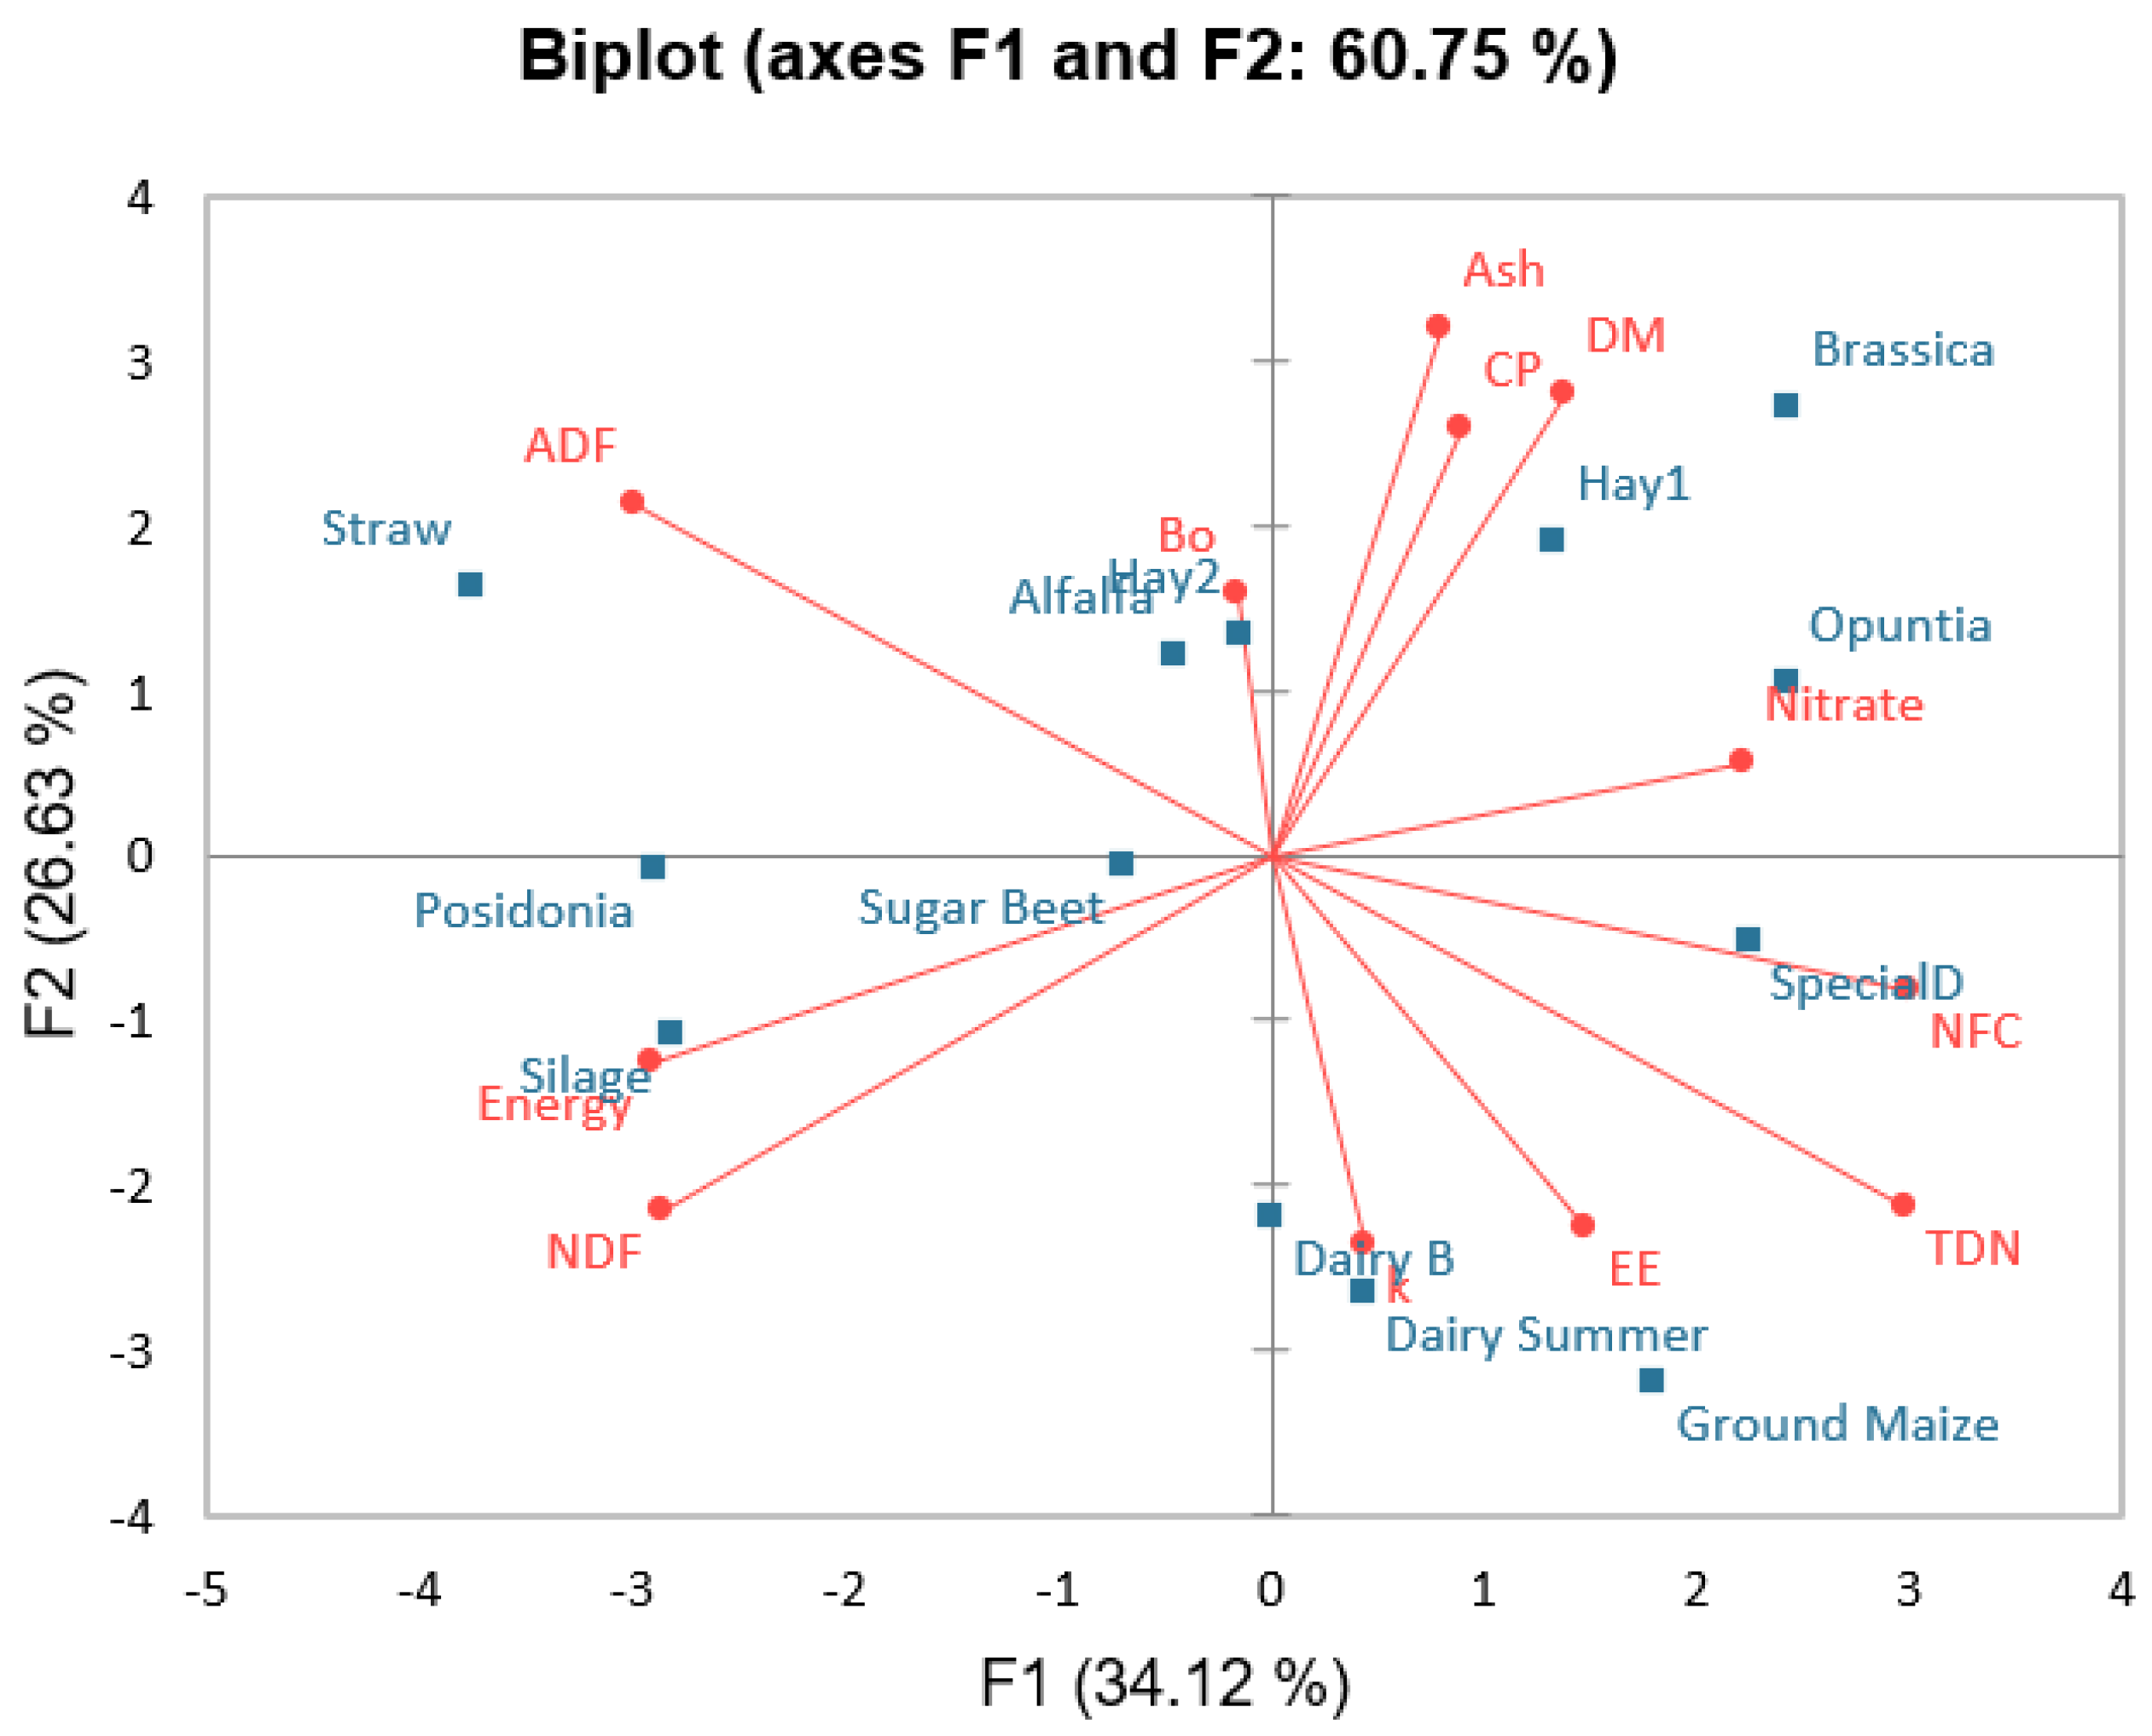
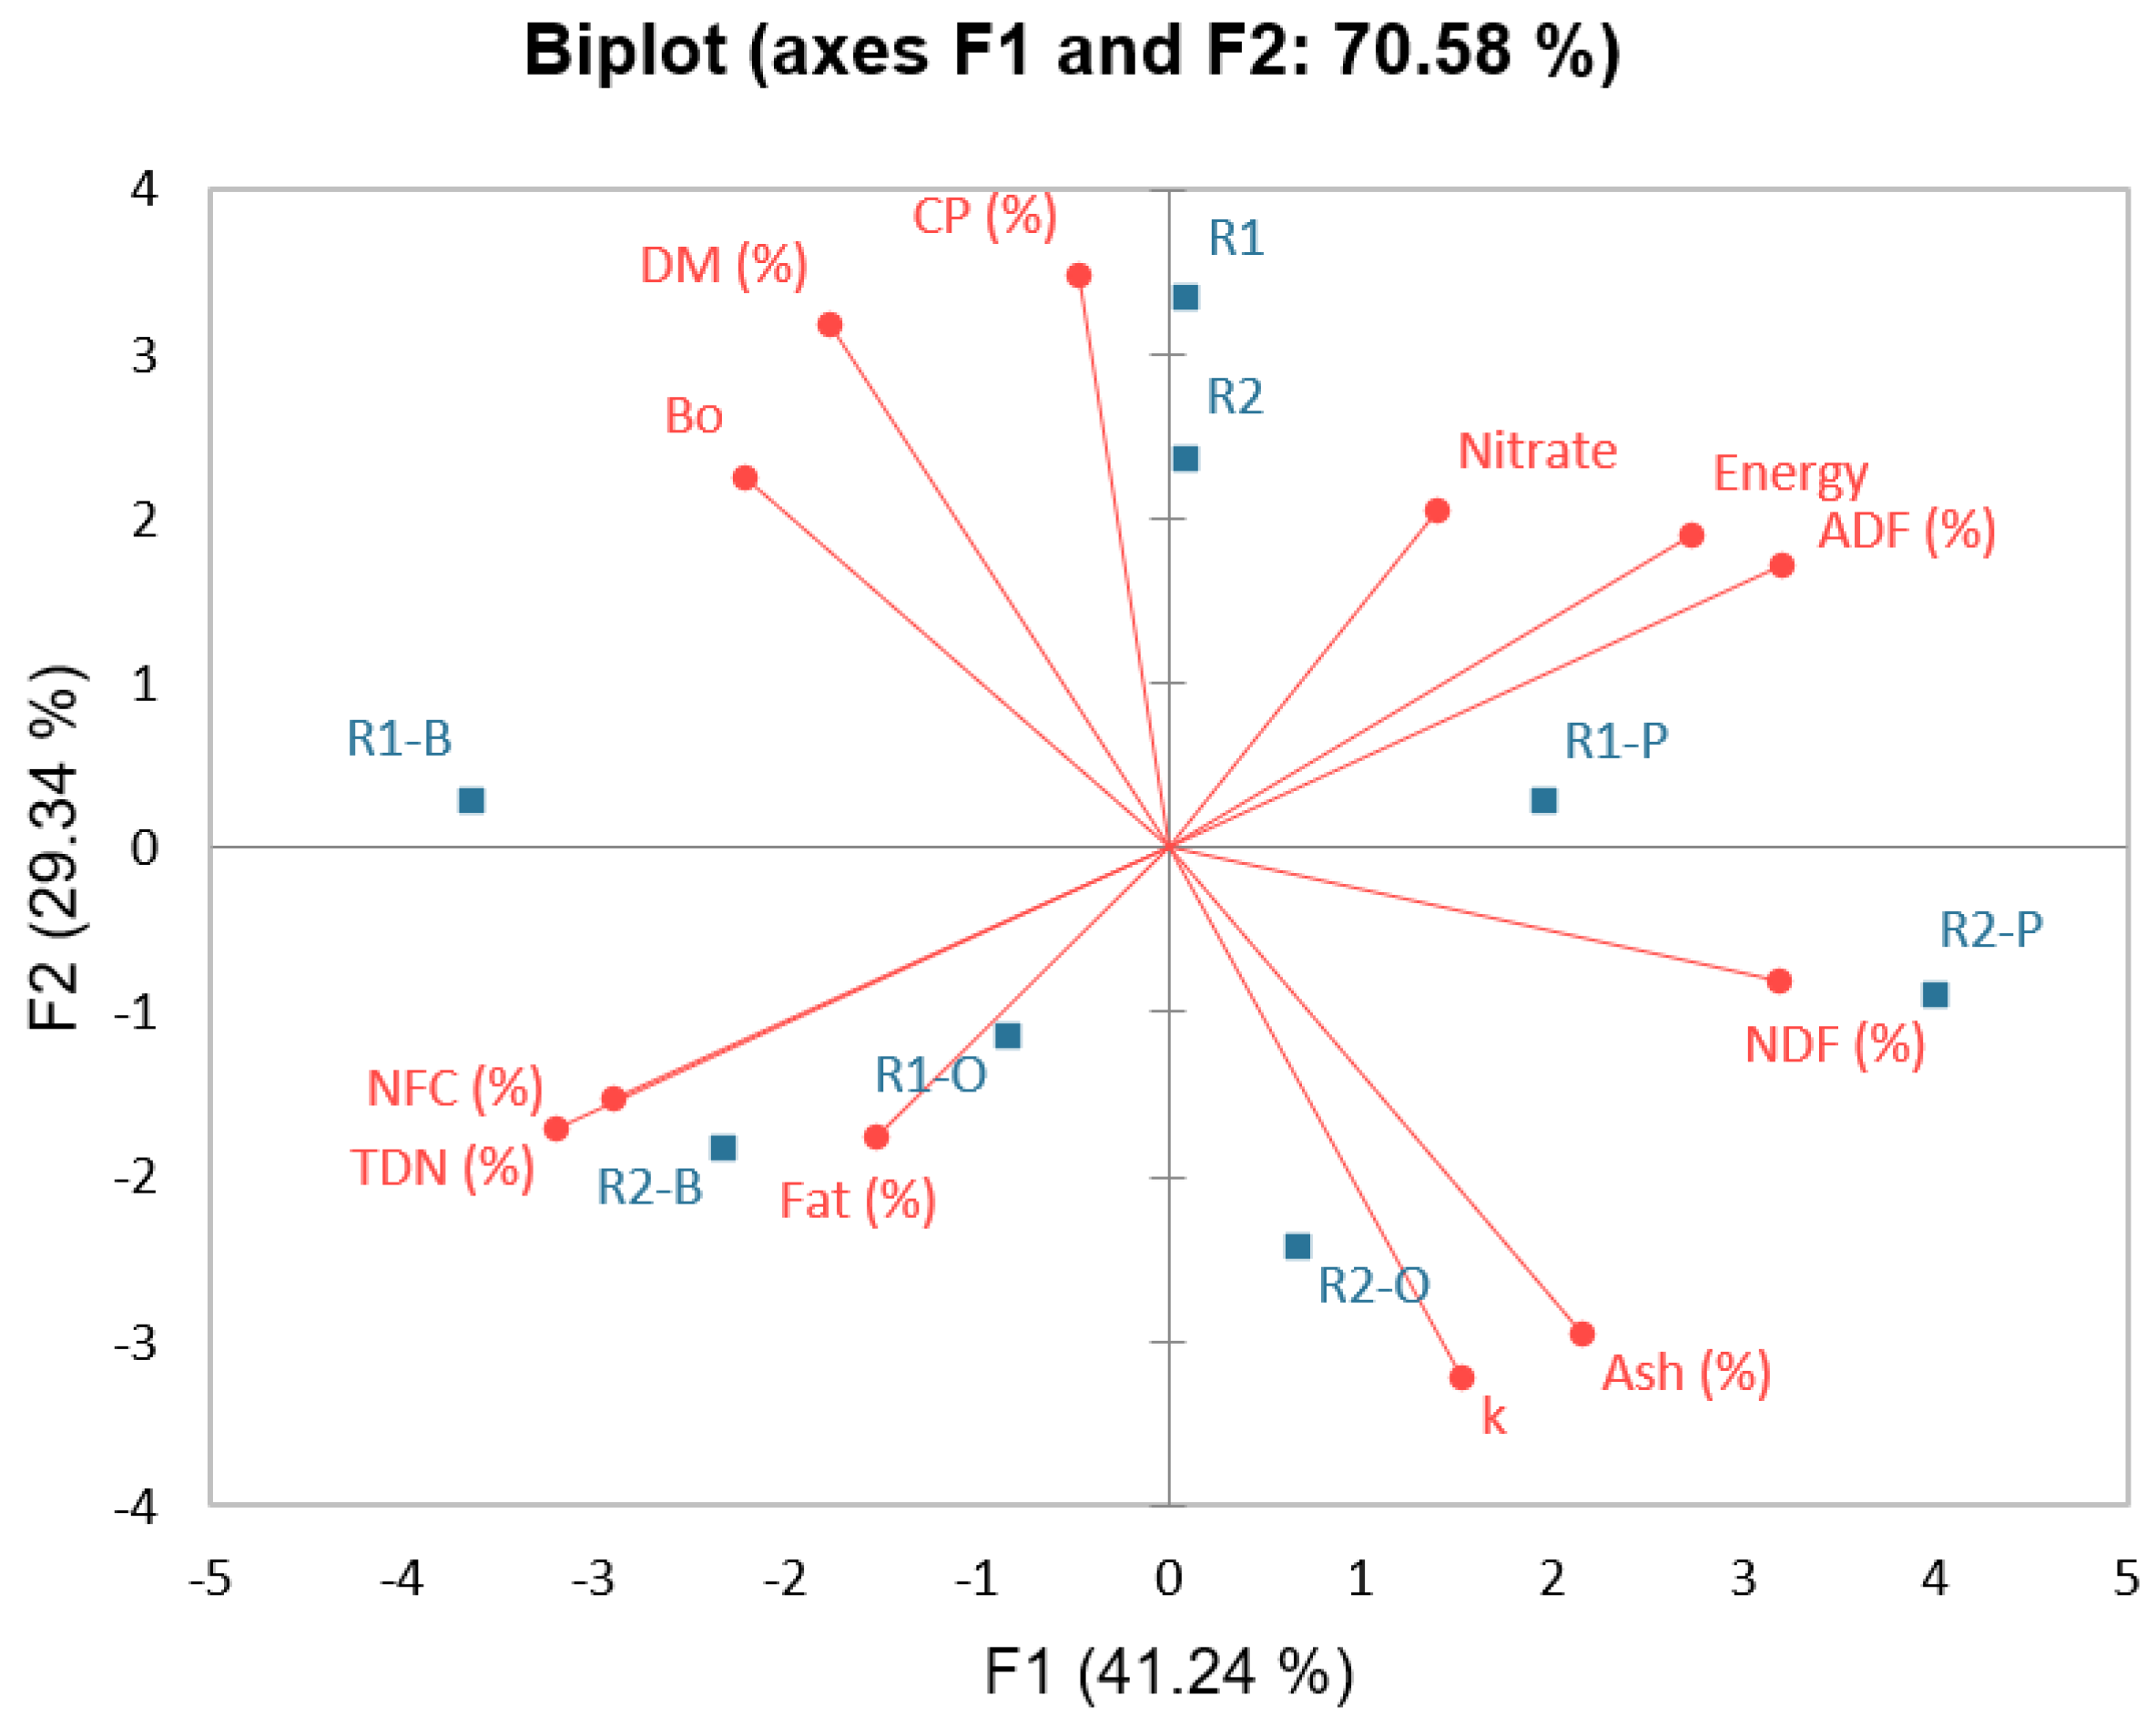
3.1. Feedstuff Composition Assessment

The proximate analyses of individual ingredients, as well as the basal and experimental rations are presented in Table 2 and Table 3, respectively. The plant additives varied in composition. Dry matter content ranged from 70.55% in Posidonia oceanica (PO) to 90.32% in Brassica rapa (BR). PO had the lowest ash and fat content (12.82 and 0.55%, respectively), but the highest fiber content with 49.27% NDF and 40.23% ADF. Opuntia ficus-indica (OFI) ranked lowest in crude protein (12.23%) and fiber content (30.16 NDF and 20.58% ADF), but highest in ash content (18.88%). BR ranked the highest for crude protein (25.28%) and fat content (1.6%) among the three additives.

3.2. Methane Production and Nitrate Content

Table 4 presents methane production and nitrate content over the 72-h period for all substrates. Special Dairy Plus Mash showed the high methane production at 48 h (181.98 L kg−1), but significantly lower values at 24 h (104.23 L kg−1) and 72 h (37.15 L kg−1). The Dairy B Mash exhibited high initial production at 24 h (180.26 L kg−1), which dropped sharply at 48 h (37.15 L kg−1), then rose again at 72 h (117.65 L kg−1). Conversely, Dairy Summer Mash produced methane at a lower consistent rate, peaking at 48 h (110.08 L kg−1). The two hay sources showed a different profiles. Hay 1 showed high methane production at 24 h (149.30 L kg−1) and 48 h (172.00 L kg−1), followed by a decline at 72 h (83.25 L kg−1), while Hay 2 had lower initial production that increased steadily peaking at 72 h (130.03 L kg−1). Straw exhibited very low initial production but peaking at 72 h (128.31 L kg−1). Silage had a low initial value (43.00 L kg−1), with significant increases at 48 h (124.18 L kg−1) and a peak at 72 h (217.41 L kg−1).
Feedstuffs of plant origin exhibited diverse methane production profiles. Ground maize had relatively stable output, peaking at 24 h (177.16 L kg−1) and decreasing at 48 h (60.54 L kg−1) and 72 h (102.86 L kg−1). Ground sugar beet followed a similar pattern, peaking at 24 h (142.07 L kg−1), and gradually decreasing to 102.86 L kg−1 at 48 h and 76.37 L kg−1 at 72 h. Alfalfa showed a consistent production profile, with the highest value at 72 h (141.38 L kg−1). The three feed additives behaved differently. BR had a similar trend, peaking at 24 h (92.19 L kg−1). OFI exhibited moderate production with slight fluctuations, peaking at 48 h (114.55 L kg−1). PO showed consistently low methane production across all time periods (<135.19 L kg−1), although it was still higher than that of the other two additives.
Some feedstuffs showed peak methane production at different time points. For example, silage showed a continuous increase in methane production over time, whereas Dairy B Mash demonstrated a decrease at 48 h followed by an increase at 72 h. Feedstuffs like Dairy B Mash, ground maize, and Hay 1 produced higher methane levels compared to others like PO and straw. Feedstuffs with peak methane production occurring after 24 or 48 h may indicate a shorter digestion period, which might be beneficial by providing rapid energy and essential nutrients required for high milk production and overall animal health.
Regarding nitrate content, the feedstuffs can be classified into different categories based on their soluble nitrate contents after fermentation. Feedstuffs with a high soluble nitrate concentration fermentation include Hay 2, ground maize, OFI, Special Dairy Plus Mash, Hay 1 and Dairy Summer Mash with concentrations of 307, 327, 353, 344, 406 and 804 mg L−1, respectively. Those with moderate nitrate content include PO, straw, silage, Dairy B Mash and BR with values of 199, 203, 227, 236, 265 mg L−1, respectively. Ground sugar beet had the lowest nitrate content (68 mg L−1, respectively).
Table 5 presents methane production and nitrate content over the 72-h period for all rations. The basal ration mixes, commonly used on dairy farms, displayed similar profiles. Ration 1 showed a significant increase in methane production at 72 h (184.73 L kg−1) compared to 24 h (149.98 L kg−1) and 48 h (146.89 L kg−1). Similarly, Ration 2 exhibited low initial production at 24 h (53.32 L kg−1), which increased substantially at 48 h (153.08 L kg−1) and slightly further at 72 h (157.55 L kg−1). The supplementation of both rations with additives resulted in different methane production profiles. For OFI-supplemented rations, Ration 1 had moderate methane production at 24 h (146.54 L kg−1), which decreased at 48 h (97.70 L kg−1) before rising again at 72 h (161.68 L kg−1). In contrast, Ration 2 began with a high value at 24 h (181.98 L kg−1), followed by a stepwise decreased at 48 h (158.24 L kg−1) and 72 h (112.83 L kg−1). BR-supplemented rations showed a similar trend, with slightly higher values for Ration 1 compared to Ration 2. In Ration 1, methane production peaked at 48 h (202.27 L kg−1) with high values also recorded at 24 h (148.95 L kg−1) and 72 h (168.90 L kg−1). Ration 2 showed moderate and stable production, with values of 127.62, 142.76, and 146.89 L kg−1 at 24, 48 and 72 h, respectively.
PO-supplemented rations produced the lowest methane levels compared to the OFI- and BR-supplemented rations. In Ration 1, PO supplementation resulted in a peak at 48 h (135.19 L kg−1) with lower production at 24 h (107.33 L kg−1) and 72 h (116.62 L kg−1). In Ration 2, PO supplementation exhibited consistently low production across all intervals with the lowest at 72 h (54.35 L kg−1).
Mash ration mixes 1 and 2 exhibited moderate and low nitrate levels after 72 h (211 and 98 mg L−1, respectively), both of which are below levels quoted elsewhere [31]. OFI exerted a positive effect on the two rations, reducing the nitrate levels by approximately half to 121 and 49 mg L−1, respectively. PO further lowered nitrate concentrations to 44 and 75 mg L−1 in Rations 1 and 2, respectively. BR produced the most significant reduction in nitrate levels, decreasing them to 22 mg L−1 and 23 mg L−1 in Rations 1 and 2, respectively.

4. Discussion

In this study, fermentation experiments were conducted to assess methane production during ruminal fermentation. It is recognized that ration feedstuffs influence the microbial population within the ruminal fluid [32]. The nutritive potential of the individual feedstuffs and ration mixes was investigated to identify which compositional parameters may affect the fermentation process.
The feedstuffs, constituting the two commonly used rations, were analyzed individually for their nutritional composition. As expected, the substrates can be classified based on their chemical profiles. The individual feedstuffs, supplements, and the supplemented ration mixes differed significantly in their energy values (p < 0.05). The incorporation of PO in both rations resulted in higher energy levels compared to the addition of other supplements (p < 0.02) Methane production is generally influenced by substrate type, digestion duration and feed efficiency [33]. This study examined several ration feedstuffs, such as Special Dairy Plus Mash, Dairy B Mash, ground maize, and silage, which exhibited distinct methane production rates at 24, 48, and 72 h, reflecting different temporal patterns. Notably, silage showed a significant increase in methane production over time, peaking at 72 h (p < 0.05 compared to earlier time points). Similar studies have shown that substrate characteristics significantly influence methane yields [34,35,36]. For example, the anaerobic digestion of energy crops like maize and silage, is typically associated with high methane production [37], which aligns with our findings. This variability is also well-documented in the literature, where maize silage often outperforms other substrates such as straw or vegetable residues in of methane output [38,39]. Substrate efficiency was also evaluated in this study. Feedstuffs such as Special Dairy Plus Mash and ground maize, produced more methane than others like PO and straw. This finding is consistent with broader research showing that substrates rich in readily degradable organic matter, such as food waste and certain energy crops [40], yield more methane than lignocellulosic substrates like straw [39]. However, in the context of this study, substrate efficiency also considers low methane-producing feedstuffs. Additionally, other factors may influence methane production and nutrient digestibility. Notably, certain fodder crops contain high levels of antinutrients such as tannins that would limit digestibility and fermentation performance [41].
Considering methane production following the introduction of supplements into conventional rations, it was observed that supplements affected methane output in both ration mixes with significant supplementation x time interactions (p < 0.001). The inclusion of supplements like OFI and PO produced mixed results. While OFI reduced methane production in the rations, PO had a greater impact, resulting in even lower methane production compared to OFI-supplemented rations. This is consistent with PO’s lower degradability, as reported in previous studies [42].
According to the Hashimoto first-order kinetics model for substrates [30], B0 represents the maximum potential methane production from a substrate under ideal conditions, assuming sufficient digestion time for complete degradation. A high B0 value, such as B0 of 100 for straw, silage and PO, indicates that the substrates have a high methane production potential. This is likely due to their high organic matter content, which can be efficiently converted to biogas. In contrast, substrates such as OFI, BR and ground sugar beet, degrade more rapidly (as reflected by their k value) but have lower overall methane production potential. This may be attributed to their lower biodegradable organic matter content or to compositional differences that limit methane generation, especially in their dried state [43].
A high k value (e.g., k = 0.999 for BR) indicates that the substrate is rapidly degraded and converted to methane. Conversely, a low k value (e.g., k = 0.001 for PO) indicates that the substrate degrades much more slowly, requiring a longer time to reach its full methane potential. This slow degradation rate is likely due to the complex structure and high lignin content of PO (101.48 L kg−1) [44], which makes it more resistant to microbial breakdown. A similar pattern was observed for straw.
When selecting substrates for rations, both type of substrate and the digestion time must be considered. If the goal is to reduce biogas (methane) production, substrates with high B0 values should be minimized. However, the rate of degradation (k) also plays a crucial role in determining both the efficiency and speed of methane production. Substrates, such as straw, PO and silage with a high B0 values (100) but low k values (<0.0055) may require longer digestion times to achieve their full methane production. In contrast, substrates, like BR, ground sugar beet and ground maize with lower B0 (<33), having higher k values (0.9877) might produce methane faster but in smaller quantities.
Rations such as Ration 2, BR-supplemented Ration 1, and Ration 1 had high methane production (B0 > 49.45), making them less desirable for use in dairy cows if methane is mitigated properly. In contrast, PO-supplemented Ration 2 exhibited lower methane production (B0 = 21.83), suggesting its potential suitability for low-emission feeding strategies.
Accordingly, the feedstuffs and rations in this study can be categorized into four groups (Table 6) based on their methane production.
Dairy Summer Mash (804 mg L−1) and hay are considered high-nitrate substrates. These elevated nitrate levels are consistent with findings from studies on nitrogen-rich substrates [45]. High nitrate concentrations can inhibit methane production by competing with methanogens for hydrogen, thus reducing overall methane yield [46,47]. This supports previous studies reporting the inhibitory effects of elevated nitrate and nitrite levels on anaerobic digestion [48,49]. Special Dairy Plus Mash, ground maize, and OFI are considered as moderate-nitrate substrates. While moderate nitrate levels may still influence anaerobic digestion, their effect is less pronounced compared to high-nitrate substrates. Research suggests that moderate nitrate concentrations do not usually cause significant inhibition, but proper management is required to avoid potential negative impacts on methanogenesis [50]. Low-nitrate substrates include ground sugar beet and silage. These feedstuffs have lower nitrate concentrations, posing minimal risk of inhibition in anaerobic digestion. Studies have shown that low-nitrate substrates are generally favorable for methane production as they do not significantly hinder methanogenic activity [49]. This creates a paradox for animal nutritionists and stakeholders within the dairy industry: substrates that are more digestible and nutritious may also contribute more to methane emissions.
High nitrate levels can suppress methane production by outcompeting methanogens for hydrogen [51]. In this study, rations supplemented with BR produced low nitrate levels, which reduces their potential to mitigate methane production and may result in increased methane levels. This is consistent with literature findings that low nitrate concentrations (<100 mg L−1) are generally non-inhibitory and often lead to increased methane production [48,49]. OFI-supplemented rations exhibited lower nitrate levels compared to the base rations, enhancing their suitability for anaerobic digestion by reducing methane production. PO-supplemented rations contained low to moderate nitrate concentrations and consistently low methane production over the 72-h period, suggesting their suitability for anaerobic digestion.
Multivariate analysis, using the principal feedstuffs, was performed to identify latent traits within the feedstuff and ration datasets. Spearman correlation (Table 7) for the individual feedstuffs revealed strong positive correlations between crude protein content and both dry matter and ash contents (rs > 0.527), differing from trends reported in feedstuffs for other ruminants [25]. Total digestible nutrients (TDN) showed a strong positive correlation with both fat content and NFC (rs > 0.654), indicating that dairy feeds rich in NFC or fat tend to be more energy-dense [52]. Conversely, neutral detergent fiber was negatively correlated with all three parameters (rs < −0.560), and acid detergent fiber correlated negatively with the ether extract (rs = −0.654). There was also a negative correlation between B0 and k. This relationship reflects the complex interplay between feed composition, microbial activity, and methane production dynamics [53]. Substrates with high B0 values are typically slower to ferment, leading to a lower methane production rate (k), while fast-fermenting substrates tend to have lower total methane potential. This correlation is crucial for formulating dairy rations that balance productivity with reduced environmental impacts [54]. Rapidly fermenting feeds can also affect animal product quality, as they promote the proliferation of ruminal amylolytic bacteria, which in turn increase propionate production, a precursor for odd-chain FAs production in milk and meat [55]. Two latent factors had an eigenvalue greater than 1 and together explained 60.75% of the total variance. The factor loadings demonstrated two main variable clusters. The first factor was loaded on most parameters, whereas the second factor was heavily loaded on ether extract, acid detergent fiber, and nitrate content. The observations biplot (Figure 1) reveals that the ration feedstuffs differed in nutritional characteristics, influencing their suitability in ration formulations. For example, Dairy summer, Dairy B, ground maize, special Dairy and silage are high in ether extract (>1.62%), whereas hay, alfalfa, OPI and BR are high in ash and crude protein contents (>12.54% and >21.68%, respectively). Straw, silage and PO possess a high neutral detergent fiber content (>49.27%). Within these clusters, Dairy B, Dairy Summer, ground maize, hay and PO exhibit rapid methane production rates (k > 0.9877) while straw, silage and BR are potential high methane producers (B0 = 100). Combining these substrates within rations may result in varying profiles, potentially leading to agonistic, synergistic and antagonistic effects across key parameters.
Spearman correlation (Table 8) was also conducted on the basal and supplemented rations. Dry matter correlated positively with crude protein (rs = 0.667) and negatively with ash, NDF and k (rs < −0.595). Ash content correlated positively with k (rs = 0.714) but negatively with B0 (rs = −0.881). Total digestible nutrients (TDN) were negatively correlated with ADF (rs = −1.000) which aligns with findings by Weiss [56]. Crude protein correlated negatively with k (rs = −0.714) and ether extract correlated negatively with ADF and nitrate content (rs < −0.524). NDF correlated positively with ADF (rs = 0.619), which in turn correlated positively with nitrate content (rs = 0.500). The methane-related parameters (B0 and k) were negatively correlated with each other (rs = −0.690). Considering the feed-supplemented rations, two latent factors had an eigenvalue greater than 1, which together explained 70.58% of the total variance. The factor loadings demonstrated different groups of variables. The parameters were grouped within the two factors as previously observed for the ration feedstuffs. The biplot (Figure 2) showed that the ration additives (BR, PFI and PO) clustered the two rations indicating that these additives characterized the overall nutritive value of the two conventional rations. Supplementing the rations with OFI resulted in a fast rate of methane production but lower overall methane yield, indicating its potential use as an alternative feed additive [57]. PO supplementation reduced methane production, although the rate of production varied significantly between the two rations (k = 0.086 and 0.977 for supplemented Ration 1 and 2, respectively). Notably, PO-supplemented rations had higher energy values compared to the other supplemented rations. BR-supplemented rations exhibited elevated ether extract values (>1.78%).

5. Conclusions

This study demonstrated the efficacy of feed supplements measured under in vitro conditions in mitigating methane production and nitrate content.
The results are consistent with findings, indicating that substrate type and digestion time significantly influence methane production. Moreover, understanding the temporal production patterns of methane generation can aidss in optimizing the digestion process to minimize emissions. Although OFI exhibited a low rate of methane production as an individual additive, rations supplemented with OFI showed relatively high methane production rates. In contrast BR consistently resulted in low methane production, both as a standalone feed additive and when incorporated into rations. PO alone exhibited low methane production, however its supplementation produced low methane production in Ration 1 and high in Ration 2.
Nitrate levels varied among rations, with BR-supplemented rations showing the lowest concentrations, making them potentially suitable for anaerobic digestion. The moderate nitrate levels observed in other supplemented rations suggest they can be used effectively with minimal risk of increasing methane production. These findings align with broader research highlighting the need to manage nitrate concentrations as a strategy for methane control. Further research on nitrate management in anaerobic digestion is recommended for deeper insights.
An effective co-digestion strategy should be considered to maintain low levels of environmental contaminants following ruminal fermentation. Combining high-nitrate substrates with low-nitrate ones can help balance the nitrate concentrations while sustaining reduced methane yield.
This study confirms that methane production and nitrate content can be influenced through dietary manipulation. Key strategies include optimizing diet composition, improving feed efficiency, incorporating plant-based supplements and balancing protein intake. These should be paired with ongoing monitoring of atmospheric methane levels and nitrate concentrations in manure. To build on these initial findings, further studies are necessary, particularly focusing on the production of volatile fatty acids during fermentation. An in vivo experimental setup is essential to provide a clearer, more comprehensive understanding. Ultimately, a predictive model incorporating both in vitro and in vivo data will be developed to optimize ration formulations and supplement use in dairy nutrition.

Author Contributions

Conceptualization, E.A. and G.P.; methodology, E.A. and G.P.; validation, J.B. and K.S.; formal analysis, E.A.; investigation, J.B. and K.S.; resources, E.A.; data curation, J.B.; writing—original draft preparation, E.A.; writing—review and editing, G.P.; supervision, E.A. and G.P.; project administration, E.A.; funding acquisition, E.A. All authors have read and agreed to the published version of the manuscript.

Funding

This research was funded by Xjenza Malta under the FUSION R&I: Research Excellence Programme, Grant REP-2022-018.

Data Availability Statement

The original contributions presented in this study are included in the article. Further inquiries can be directed to the corresponding author.

Conflicts of Interest

The authors declare no conflicts of interest. The funders had no role in the design of the study; in the collection, analyses, or interpretation of data; in the writing of the manuscript; or in the decision to publish the results.

References

  1. Lee, C.; Beauchemin, K.A. A review of feeding supplementary nitrate to ruminant animals: Nitrate toxicity, methane emissions, and production performance. Can. J. Anim. Sci. 2014, 94, 557–570. [Google Scholar] [CrossRef]
  2. Moss, A.R.; Jouany, J.P.; Newbold, J. Methane production by ruminants: Its contribution to global warming. Ann. Zootech. 2000, 49, 231–253. [Google Scholar] [CrossRef]
  3. Misselbrook, T.H.; Del Prado, A.; Chadwick, D.R. Opportunities for reducing environmental emissions from forage-based dairy farms. Agric. Food Sci. 2013, 22, 93–107. [Google Scholar] [CrossRef]
  4. Dijkstra, J.; Oenema, O.; Bannink, A. Dietary strategies to reducing N excretion from cattle: Implications for methane emissions. Curr. Opin. Environ. Sustain. 2011, 3, 414–422. [Google Scholar] [CrossRef]
  5. Gerber, P.J.; Steinfeld, H.; Henderson, B.; Mottet, A.; Opio, C.; Dijkman, J.; Falcucci, A.; Tempio, G. Tackling Climate Change Through Livestock–A Global Assessment of Emissions and Mitigation Opportunities; FAO: Rome, Italy, 2013; Available online: http://www.fao.org/docrep/018/i3437e/i3437e00.htm (accessed on 1 May 2025).
  6. Capelari, M.; Powers, W. The effect of nitrate and monensin on in vitro ruminal fermentation. Anim. Sci. J. 2017, 95, 5112–5123. [Google Scholar] [CrossRef]
  7. Food and Agriculture Organization of the United Nations (FAO). Global Dairy and GHG Emissions: FAO Analysis 2005–2015; FAO: Rome, Italy, 2019; Available online: https://www.fao.org/3/CA3165EN/ca3165en.pdf (accessed on 1 May 2025).
  8. Patra, A.K. Enteric methane mitigation technologies for ruminant livestock: A synthesis of current research and future directions. Environ. Monit. Assess. 2012, 184, 1929–1952. [Google Scholar] [CrossRef]
  9. Martin, G.B. Perspective: Science and the future of livestock industries. Front. Vet. Sci. 2024, 11, 1359247. [Google Scholar] [CrossRef]
  10. Fang, Q.; Ma, Y.; Zhang, X.; Wei, S.; Hou, Y. Mitigating nitrogen emissions from dairy farming systems in China. Front. Sustain. Food Syst. 2020, 4, 44. [Google Scholar] [CrossRef]
  11. Ward, M.H.; Jones, R.R.; Brender, J.D.; De Kok, T.M.; Weyer, P.J.; Nolan, B.T.; Vilanueva, C.M.; Van Breda, S.G. Drinking water nitrate and human health: An updated review. Int. J. Environ. Res. Public Health 2018, 15, 1557. [Google Scholar] [CrossRef]
  12. Cellone, F.; Carol, E.; Pugliese, I.; Córdoba, J.; Butler, L.; Lamarche, L. Nitrate pollution in dairy farms and its impact on groundwater quality in a sector of the Pampas plain, Argentina. Environ. Earth Sci. 2020, 79, 1–7. [Google Scholar] [CrossRef]
  13. Mahmud, K.; Panday, D.; Mergoum, A.; Missaoui, A. Nitrogen losses and potential mitigation strategies for a sustainable agroecosystem. Sustainability 2021, 13, 2400. [Google Scholar] [CrossRef]
  14. Stafford, J. Site-specific nutrient management systems. In Precision Agriculture for Sustainability; Long, D.S., Ed.; Burleigh Dodds Science Publishing: Cambridge, UK, 2019; pp. 319–342. [Google Scholar]
  15. EEIG Alliance Environnement. Evaluation Study of the Impact of the CAP on Climate Change and Greenhouse Gas Emissions; European Commission, Directorate-General for Agriculture and Rural Development: Brussels, Belgium, 2019. [CrossRef]
  16. European Commission: Directorate-General for Energy. EU Methane Strategy; Publications Office of the European Union: Luxembourg, 2020. [CrossRef]
  17. Council Directive 91/676/EEC. The protection of waters against pollution caused by nitrates from agricultural sources. Off. J. Eur. Union 1991, L 375, 1–8. [Google Scholar]
  18. Elbasiouny, H.; Elbanna, B.A.; Al-Najoli, E.; Alsherief, A.; Negm, S.; Abou El-Nour, E.; Nofal, A.; Sharabash, S. Agricultural waste management for climate change mitigation: Some implications to Egypt. In Waste Management in MENA Regions; Springer: Cham, Switzerland, 2019; pp. 183–201. [Google Scholar] [CrossRef]
  19. National Statistics Office (NSO). Census of Agriculture; NSO: Valletta, Malta, 2022.
  20. Malta Resources Authority. Malta’s National Inventory Document of Greenhouse Gas Emissions & Removals; UNFCC: Rio de Janeiro, Brazil; New York, NY, USA, 2024; Available online: https://unfccc.int/sites/default/files/resource/Malta_GHGInv_1990-2022_NID_Sep2024.pdf (accessed on 1 May 2025).
  21. Grizzetti, B.; Bouraoui, F.; Billen, G.; van Grinsven, H.; Cardoso, A.C.; Thieu, V.; Garnier, J.; Curtis, C.; Howarth, R.W.; Johnes, P. Nitrogen as a threat to European water quality. In European Nitrogen Assessment; Sutton, M.A., Howard, C.M., Erisman, J.W., Billen, G., Bleeker, A., Grennfelt, P., van Grinsven, H., Grizzetti, B., Eds.; Cambridge University Press: Cambridge, UK, 2011; pp. 379–404. [Google Scholar]
  22. Feyissa, F.; Kitaw, G.; Assefa, G. Nutritional qualities of agro-industrial by-products and local supplementary feeds for dairy cattle feeding. Ethiop. J. Agric. Sci. 2015, 26, 13–26. [Google Scholar]
  23. Tuyen, D.V.; Phuong, H.N.; Cone, J.W.; Baars, J.J.P.; Sonnenberg, A.S.M.; Hendriks, W.H. Effect of fungal treatments of fibrous agricultural by-products on chemical composition and in vitro rumen fermentation and methane production. Bioresour. Technol. 2013, 129, 256–263. [Google Scholar] [CrossRef]
  24. Jayanegara, A.; Yantina, N.; Novandri, B.; Laconi, E.B.; Nahrowi, N.; Ridla, M. Evaluation of some insects as potential feed ingredients for ruminants: Chemical composition, in vitro rumen fermentation, and methane emissions. J. Indones. Trop. Anim. Agric. 2017, 42, 247–254. [Google Scholar] [CrossRef]
  25. Pastorelli, G.; Simeonidis, K.; Faustini, M.; Le Mura, A.; Cavalleri, M.; Serra, V.; Attard, E. Chemical characterization and in vitro gas production kinetics of alternative feed resources for small ruminants in the Maltese islands. Metabolites 2023, 13, 762. [Google Scholar] [CrossRef]
  26. Agius, A.; Pastorelli, G.; Attard, E. Cows fed hydroponic fodder and conventional diet: Effects on milk quality. Arch. Anim. Breed. 2019, 62, 517–525. [Google Scholar] [CrossRef]
  27. Alba, H.D.R.; Lima, V.G.O.; Carvalho, S.T.; Ítavo, L.C.V.; Pinto, L.F.B.; Carneiro, P.L.S.; Oliveira, R.L. Rumen content from slaughterhouse as an alternative inoculum source for in vitro analysis of feeds: A multivariate approach. Ruminants 2023, 3, 360–372. [Google Scholar] [CrossRef]
  28. Menke, K.H.; Raab, L.; Salewski, A.; Steingass, H.; Fritz, D.; Schneider, W. The estimation of the digestibility and metabolizable energy content of ruminant feedingstuffs from the gas production when they are incubated with rumen liquor in vitro. J. Agric. Sci. 1979, 93, 217–222. [Google Scholar] [CrossRef]
  29. Silva, M.F.; Bermejo de Lima, L.; de Camargo, C.; Telles Benatti, C. Usability of simplified UV–Vis spectrophotometric methods for the determination of nitrate in the presence of organic matter and chloride as interfering factors. Water Pract. Technol. 2024, 19, 1061–1070. [Google Scholar] [CrossRef]
  30. Hashimoto, A.G. Effect of inoculum/substrate ratio on methane yield and production rate from straw. Biol. Wastes 1989, 28, 247–255. [Google Scholar] [CrossRef]
  31. Hancock, D.W. Nitrate Toxicity; University of Georgia Cooperative Extension: Athens, GA, USA, 2013; Available online: https://extension.uga.edu/publications/detail.html?number=C915&title=Nitrate%20Toxicity (accessed on 2 March 2025).
  32. Chuang, S.T.; Li, K.Y.; Tu, P.W.; Ho, S.T.; Hsu, C.C.; Hsieh, J.C.; Chen, M.J. Investigating the Reciprocal Interrelationships among the Ruminal Microbiota, Metabolome, and Mastitis in Early Lactating Holstein Dairy Cows. Animals 2021, 11, 3108. [Google Scholar] [CrossRef] [PubMed]
  33. Shibata, M.; Terada, F. Factors affecting methane production and mitigation in ruminants. Anim. Sci. J. 2010, 81, 2–10. [Google Scholar] [CrossRef]
  34. Kim, E.T.; Lee, S.J.; Lee, S.M.; Lee, I.D.; Lee, S.K.; Lee, S.S. Effects of flavonoid-rich plant extracts on in vitro ruminal methanogenesis, microbial populations, and fermentation characteristics. Asian-Australas. J. Anim. Sci. 2015, 28, 530. [Google Scholar] [CrossRef]
  35. Duarte, A.C.; Holman, D.B.; Alexander, T.W.; Durmic, Z.; Vercoe, P.E.; Chaves, A.V. The type of forage substrate preparation included as substrate in a RUSITEC system affects the ruminal microbiota and fermentation characteristics. Front. Microbiol. 2017, 8, 704. [Google Scholar] [CrossRef]
  36. Choi, Y.; Lee, S.J.; Kim, H.S.; Eom, J.S.; Jo, S.U.; Guan, L.L.; Seo, J.; Kim, H.; Lee, S.S. Effects of seaweed extracts on in vitro rumen fermentation characteristics, methane production, and microbial abundance. Sci. Rep. 2021, 11, 24092. [Google Scholar] [CrossRef]
  37. Moate, P.J.; Williams, S.R.O.; Deighton, M.H.; Hannah, M.C.; Ribaux, B.E.; Morris, G.L.; Jacobs, J.L.; Hill, J.; Wales, W.J. Effects of feeding wheat or corn and of rumen fistulation on milk production and methane emissions of dairy cows. Anim. Prod. Sci. 2018, 59, 891–905. [Google Scholar] [CrossRef]
  38. Gebreeyessus, G.D. Comparative evaluation of the biochemical methane potential of waste activated sludge acetic acid and cellulose substrates under mesophilic and thermophilic anaerobic digestion. SN Appl. Sci. 2020, 2, 1546. [Google Scholar] [CrossRef]
  39. Zhang, Y.; Kusch-Brandt, S.; Salter, A.M.; Heaven, S. Estimating the methane potential of energy crops: An overview on types of data sources and their limitations. Processes 2021, 9, 1565. [Google Scholar] [CrossRef]
  40. Varsha, S.S.V.; Soomro, A.F.; Baig, Z.T.; Vuppaladadiyam, A.K.; Murugavelh, S.; Antunes, E. Methane production from anaerobic mono- and co-digestion of kitchen waste and sewage sludge: Synergy study on cumulative methane production and biodegradability. Biomass Convers. Biorefin. 2020, 12, 3911–3919. [Google Scholar] [CrossRef]
  41. Boukrouh, S.; Noutfia, A.; Moula, N.; Avril, C.; Hornick, J.L.; Chentouf, M.; Cabaraux, J.F. Effects of sulla flexuosa hay as alternative feed resource on goat’s milk production and quality. Animals 2023, 13, 709. [Google Scholar] [CrossRef] [PubMed]
  42. Yasser, H.; Amal, J.; El Mejdoub, H.; Wafa, Y.; Fortina, R. Seagrass debris as a source of fiber and bioactive compounds in feed for dairy goats. Int. J. Agric. Biol. 2021, 26, 722–730. [Google Scholar] [CrossRef]
  43. Singh, S. Non-Conventional Fodder Resources for Feeding Livestock. Recent Approaches in Crop Residue Management and Value Addition for Entrepreneurship Development; ICAR-Indian Grassland and Fodder Research Institute: Jhansi, Indian, 2016; pp. 7–12. [Google Scholar]
  44. Kaal, J.; Serrano, O.; del Río, J.C.; Rencoret, J. Radically different lignin composition in Posidonia species may link to differences in organic carbon sequestration capacity. Org. Geochem. 2018, 124, 247–256. [Google Scholar] [CrossRef]
  45. Kamra, D.N.; Agarwal, N.; Chaudhary, L.C. Nitrate/nitrite toxicity and possibilities of their use in ruminant diet. In Rumen Microbiology; Springer: New Delhi, India, 2015; pp. 343–353. [Google Scholar] [CrossRef]
  46. Zhou, Z.; Yu, Z.; Meng, Q. Effects of nitrate on methane production, fermentation, and microbial populations in in vitro ruminal cultures. Bioresour. Technol. 2012, 103, 173–179. [Google Scholar] [CrossRef]
  47. Yang, C.; Rooke, J.A.; Cabeza, I.; Wallace, R.J. Nitrate and inhibition of ruminal methanogenesis: Microbial ecology, obstacles, and opportunities for lowering methane emissions from ruminant livestock. Front. Microbiol. 2016, 7, 132. [Google Scholar] [CrossRef]
  48. Fernandez-Bayo, J.D.; Simmons, C.W.; VanderGheynst, J.S. Characterization of digestate microbial community structure following thermophilic anaerobic digestion with varying levels of green and food wastes. J. Ind. Microbiol. Biotechnol. 2020, 47, 1031–1044. [Google Scholar] [CrossRef]
  49. Su, R.; Zhou, L.; Ding, L.; Fu, B.; Fu, H.; Shuang, Y.; Ye, L.; Hu, H.; Ma, H.; Ren, H. How anaerobic sludge microbiome respond to different concentrations of nitrite, nitrate, and ammonium ions: A comparative analysis. Environ. Sci. Pollut. Res. 2023, 30, 49026–49037. [Google Scholar] [CrossRef]
  50. Bartocci, P.; Massoli, S.; Zampilli, M.; Liberti, F.; Yunjun, Y.; Yang, Q.; Yang, H.; Zhou, H.; Gul, E.; Bidini, G.; et al. Substrate characterization in the anaerobic digestion process. In Bioenergy Research; Springer: Singapore, 2021; pp. 307–342. [Google Scholar] [CrossRef]
  51. Van Zijderveld, S.M.; Gerrits, W.J.J.; Apajalahti, J.A.; Newbold, J.R.; Dijkstra, J.; Leng, R.A.; Perdok, H.B. Nitrate and sulfate: Effective alternative hydrogen sinks for mitigation of ruminal methane production in sheep. J. Dairy Sci. 2010, 93, 5856–5866. [Google Scholar] [CrossRef]
  52. Jayanegara, A.; Ridla, M.; Nahrowi Laconi, E.B. Estimation and validation of total digestible nutrient values of forage and concentrate feedstuffs. IOP Conf. Ser. Mater. Sci. Eng. 2019, 546, 042016. [Google Scholar] [CrossRef]
  53. Brask, M.; Weisbjerg, M.R.; Hellwing, A.L.F.; Bannink, A.; Lund, P. Methane production and diurnal variation measured in dairy cows and predicted from fermentation pattern and nutrient or carbon flow. Animal 2015, 9, 1795–1806. [Google Scholar] [CrossRef] [PubMed]
  54. Hawkins, J.; Weersink, A.; Wagner-Riddle, C.; Fox, G. Optimizing ration formulation as a strategy for greenhouse gas mitigation in intensive dairy production systems. Agric. Syst. 2015, 137, 1–11. [Google Scholar] [CrossRef]
  55. Boukrouh, S.; Noutfia, A.; Moula, N.; Avril, C.; Louvieaux, J.; Hornick, J.L.; Cabaraux, J.F.; Chentouf, M. Growth performance, carcass characteristics, fatty acid profile, and meat quality of male goat kids supplemented by alternative feed resources: Bitter vetch and sorghum grains. Arch. Anim. Breed. 2024, 67, 481–492. [Google Scholar] [CrossRef]
  56. Weiss, W.P. Estimating the available energy content of feeds for dairy cattle. J. Dairy Sci. 1998, 81, 830–839. [Google Scholar] [CrossRef]
  57. Pastorelli, G.; Serra, V.; Vannuccini, C.; Attard, E. Opuntia spp. as alternative fodder for sustainable livestock production. Animals 2022, 12, 1597. [Google Scholar] [CrossRef]
Figure 1. The biplot for the thirteen ration feedstuffs (Blue colour) with proximate, methane and nitrate results (Red colour).
Gases 05 00012 g001
Figure 2. The biplot for the basal and supplemented rations (Blue colour) with proximate, methane and nitrate results (Red colour).
Gases 05 00012 g002
Table 1. Composition of basal rations and experimental diets (%DM).
Basal RationsOpuntia ficus indicaPosidonia oceanicaBrassica rapa
Ration 1Ration 2Ration 1Ration 2Ration 1Ration 2Ration 1Ration 2
Special Dairy 118.8 14.6 18.5 14.6
Dairy B 222.9 18.8 22.6 18.8
Summer Dairy 3 45.8 45.3 45.4 41.2
Ground maize8.36.38.36.28.05.94.21.3
Sugar beet8.3 8.3 8.0 4.2
Alfalfa Hay 18.88.314.68.218.58.014.63.4
Alfalfa 14.68.310.48.214.38.010.43.4
Corn Silage 22.9 6.2 22.6 18.1
Straw8.38.38.38.28.08.04.23.4
OFI 4 16.717.7
PO 5 2.12.1
BR 6 29.229.4
1 Special dairy pellets supplied by Kooperattiva Produttori Tal-Ħalib Ltd. (Marsa, Malta), containing soybean meal, maize, protected fats, wheat pollards, and barley (closed formula). 2 Dairy pellets supplied by Kooperattiva Produttori Tal-Ħalib Ltd. (Marsa, Malta), containing maize, barley wheat pollards, soybean meal, and alfalfa (closed formula). 3 Summer Dairy pellets supplied by Kooperattiva Produttori Tal-Ħalib Ltd. (Marsa, Malta), containing ground maize, sugar beet, hay, alfalfa, silage and straw (closed formula).4 OFI = Opuntia ficus-indica; 5 PO = Posidonia oceanica; 6 BR = Brassica rapa.
Table 2. Chemical composition (%) of individual feedstuffs.
DM
%
Ash
%
CP
%
EE
%
NDF
%
ADF
%
NFC
%
Energy (kcal/100 g)
Special Dairy88.17 ± 1.0110.48 ± 0.0819.54 ± 0.332.42 ± 0.0338.89 ± 0.6716.23 ± 0.1428.67 ± 1.05255.50
Dairy B84.79 ± 0.739.87 ± 0.0815.86 ± 0.181.62 ± 0.0145.71 ± 0.3918.54 ± 0.1626.94 ± 0.81260.86
Summer Dairy 83.91 ± 1.409.47 ± 0.1516.45 ± 0.271.65 ± 0.0144.6 ± 0.38114.94 ± 0.2527.83 ± 0.90259.05
Ground Maize85.92 ± 0.745.45 ± 0.0411.78 ± 0.192.16 ± 0.0145.84 ± 0.395.473 ± 0.0434.77 ± 0.79249.92
Sugar Beet87.07 ± 1.008.22 ± 0.0617.55 ± 0.140.49 ± 0.0143.18 ± 0.3634.19 ± 0.2930.56 ± 0.75247.33
Hay187.66 ± 0.7515.34 ± 0.1325.09 ± 0.210.86 ± 0.0034.88 ± 0.2927.45 ± 0.2323.83 ± 0.79247.62
Hay287.46 ± 1.0012.68 ± 0.1421.68 ± 0.240.91 ± 0.0940.15 ± 0.3430.66 ± 0.2624.58 ± 0.9255.51
Alfalfa 87.55 ± 0.7512.54 ± 0.1022.43 ± 0.190.83 ± 0.0938.72 ± 0.3330.86 ± 0.2625.48 ± 0.84252.07
Straw88.12 ± 1.5210.22 ± 0.0812.74 ± 0.100.19 ± 0.0965.47 ± 0.7543.07 ± 0.3711.38 ± 1.00314.55
Silage37.83 ± 0.649.89 ± 0.168.22 ± 0.062.17 ± 0.0160.5 ± 0.5139.04 ± 0.3419.22 ± 0.86294.41
OFI86.14 ± 0.7418.88 ± 0.1512.23 ± 0.200.71 ± 0.0630.16 ± 0.2520.58 ± 0.3538.02 ± 0.81175.95
PO70.55 ± 0.6012.82 ± 0.1019.88 ± 0.160.55 ± 0.0149.27 ± 0.8440.23 ± 0.3417.48 ± 1.05281.55
BR90.32 ± 1.5513.65 ± 0.1128.28 ± 0.241.6 ± 0.0124.63 ± 0.2021.81 ± 0.2531.84 ± 0.75226.04
DM, dry matter; ash content; CP, crude protein; EE, ether extract; NDF, neutral detergent fiber; ADF, acid detergent fiber; NFC, non fiber carbohydrate; OFI = Opuntia ficus-indica; PO = Posidonia oceanica; BR = Brassica rapa.
Table 3. Chemical composition (%) of basal and experimental rations integrated with plant additives.
Ration 1Ration 2OFI-SupplementedBR-SupplementedPO-Supplemented
Ration 1Ration 2Ration 1Ration 2Ration 1Ration 2
DM (%)86.24 ± 0.2986.16 ± 0.0486.16 ± 0.1483.74 ± 0.0686.17 ± 0.0685 ± 0.1285.35 ± 0.1684.09 ± 0.21
Ash (%)11.71 ± 0.0611.02 ± 0.2512.12 ± 0.1612.21 ± 0.4411.78 ± 0.3712.2 ± 0.2112.29 ± 0.1612.47 ± 0.36
CP (%)19.89 ± 0.0717.03 ± 0.0914.83 ± 0.1513.41 ± 0.2317.4 ± 0.2916.89 ± 0.1817.92 ± 0.1215.37 ± 0.22
Fat (%)1.19 ± 0.061.587 ± 0.011.533 ± 0.031.497 ± 0.041.78 ± 0.061.787 ± 0.041.383 ± 0.141.603 ± 0.13
NDF (%)43.33 ± 0.0346.65 ± 0.2743.84 ± 0.7247.69 ± 0.8241.57 ± 1.0142.34 ± 0.6544.58 ± 0.8649.41 ± 1.08
ADF (%)25.93 ± 0.3525.71 ± 0.9424.16 ± 0.7522.17 ± 0.8921.22 ± 1.2618.61 ± 0.9126.55 ± 1.7929.59 ± 2.38
NFC (%)23.89 ± 0.0623.72 ± 0.5727.68 ± 0.5825.2 ± 0.6727.47 ± 0.6826.77 ± 0.6723.83 ± 0.9821.15 ± 1.35
Energy (kcal/100 g)263.59269.03248.45257.9251.9253.03262.42273.52
OFI = Opuntia ficus-indica; PO = Posidonia oceanica; BR = Brassica rapa.
Table 4. Methane production over the 72-h period, and nitrate content at 72 h for all the substrates.
Methane Production (L CH4. kg−1) Nitrate Content (mg L−1)
24 h48 h72 hBok
Special Dairy104.23 ± 24.28181.86 ± 31.2537.04 ± 51.9331.510.170344.50 ± 56.07
Dairy B180.37 ± 29.9637.04 ± 56.84117.65 ± 22.6532.470.996236.10 ± 54.13
Dairy Summer177.05 ± 25.5860.66 ± 18.89102.86 ± 32.0733.000.99780.07 ± 5.87
Ground Maize142.07 ± 8.1197.93 ± 64.0676.48 ± 40.4230.670.988326.80 ± 80.43
Sugar Beet68.23 ± 11.63110.08 ± 28.6541.97 ± 20.5221.690.12866.5 ± 21.50
Hay1149.29 ± 48.16172.11 ± 77.5983.13 ± 37.6739.200.995405.50 ± 5.67
Hay281.64 ± 29.75118.79 ± 15.95130.15 ± 55.2441.030.034306.70 ± 43.73
Alfalfa76.83 ± 19.17114.55 ± 19.8080.84 ± 50.1728.090.07854.60 ± 3.15
Straw7.57 ± 11.8319.03 ± 5.1835.55 ± 47.84100.000.001203.50 ± 88.57
Silage43.00 ± 13.07124.18 ± 10.58217.41 ± 54.96100.000.011227.20 ± 14.30
OFI106.41 ± 13.15116.73 ± 14.41141.38 ± 36.4239.570.058353.10 ± 22.27
PO92.19 ± 6.54100.45 ± 28.1080.84 ± 41.5626.501.000198.60 ± 6.29
BR10.55 ± 2.3078.09 ± 40.20128.31 ± 50.58100.000.005264.50 ± 70.76
OFI = Opuntia ficus-indica; PO = Posidonia oceanica; BR = Brassica rapa.
Table 5. Methane production over the 72-h period and nitrate content at 72 h for all rations.
SupplementationTimeMethane Production (L CH4. kg−1)BokNitrate Content (mg L−1)
24 h48 h72 h
NoneRation 1150.10 ± 19.17146.89 ± 33.44184.61 ± 6.7849.4510.080211.40 ± 39.80
Ration 253.43 ± 15.69153.08 ± 33.23157.55 ± 28.1680.7470.01397.09 ± 71.03
OFI-supplementedRation 1146.54 ± 22.7097.52 ± 47.64161.68 ± 52.2939.3330.990120.90 ± 14.72
Ration 2181.98 ± 45.75158.24 ± 44.72112.83 ± 2.7543.9001.00049.40 ± 6.77
BR-supplementedRation 1148.95 ± 14.10202.10 ± 0.86168.90 ± 30.2754.0480.07421.55 ± 0.80
Ration 2127.45 ± 51.43142.76 ± 49.19146.72 ± 45.5842.5360.08523.25 ± 5.14
PO-supplementedRation 1107.16 ± 37.67135.19 ± 62.95116.44 ± 54.8736.6020.08644.40 ± 10.46
Ration 290.47 ± 1.7280.49 ± 17.8954.35 ± 5.5021.8330.97774.60 ± 9.229
OFI = Opuntia ficus-indica; PO = Posidonia oceanica; BR = Brassica rapa.
Table 6. Classification of feedstuffs and supplemented rations by methane production.
Substrates (Feedstuffs)Supplemented Rations
High B0 and Low kPO and Straw have a very high methane production potential but degrade very slowly, making them suitable for systems with longer retention timesRation 2: has a high methane production potential but degrades very slowly, making it suitable for systems with longer retention times to achieve full methane yield.
High B0 and High kHay 1, despite a high potential, degrades very quickly, providing rapid methane productionBR-supplemented ration 1 offers high methane production potential with a moderate degradation rate, suitable for systems balancing both yield and degradation rate.
Moderate B0 and High kSubstrates like Dairy B Mash, Maize Ground, and Ground Sugar Beet have moderate methane potential but degrade rapidly, suitable for fast biogas generation.OFI-supplemented rations and PO-supplemented ration 2. These rations provide moderate methane production but degrade very quickly, making them suitable for systems requiring rapid methane production.
Moderate B0 and Moderate/Low kSubstrates like Dairy Summer Mash and PO provide moderate methane production at a slower rate, balancing between yield and degradation speed.Ration 1, BR-supplemented ration 2, PO-supplemented ration 1: These rations offer a balanced approach with moderate methane production and a steady degradation rate.
OFI = Opuntia ficus-indica; PO = Posidonia oceanica; BR = Brassica rapa.
Table 7. Spearman correlation matrix for all ration substrates.
VariablesAshCPEENDFADFNFCBokNitrateTDNEnergy
DM0.3680.577−0.154−0.560−0.0160.1430.221−0.4650.2860.016−0.401
Ash 0.527−0.297−0.6100.214−0.0990.331−0.1950.440−0.214−0.324
CP −0.198−0.6210.099−0.093−0.1100.063−0.016−0.099−0.330
EE −0.005−0.6540.2580.1380.1570.3300.6540.082
NDF 0.352−0.555−0.0390.107−0.390−0.3520.841
ADF −0.7200.122−0.385−0.445−1.0000.401
NFC −0.1930.0250.2910.720−0.791
Bo −0.6830.354−0.1220.160
k −0.0390.3850.069
Nitrate 0.445−0.374
TDN −0.401
Table 8. Spearman correlation matrix for all rations.
VariablesAsh (%)CP (%)Fat (%)NDF (%)ADF (%)NFC (%)EnergyTDN (%)BokNitrate
DM (%)−0.7380.667−0.214−0.667−0.0240.333−0.2380.0240.476−0.5950.310
Ash (%) −0.3810.0480.4760.310−0.2380.119−0.310−0.8810.714−0.333
CP (%) −0.286−0.4760.262−0.2140.238−0.2620.286−0.7140.000
Fat (%) −0.262−0.5240.190−0.2140.5240.048−0.238−0.595
NDF (%) 0.619−0.6900.643−0.619−0.3810.4760.333
ADF (%) −0.7620.738−1.000−0.4520.0950.500
NFC (%) −0.9760.7620.1670.167−0.214
Energy −0.738−0.071−0.2140.333
TDN (%) 0.452−0.095−0.500
Bo −0.6900.024
k 0.095
Disclaimer/Publisher’s Note: The statements, opinions and data contained in all publications are solely those of the individual author(s) and contributor(s) and not of MDPI and/or the editor(s). MDPI and/or the editor(s) disclaim responsibility for any injury to people or property resulting from any ideas, methods, instructions or products referred to in the content.

