Article

Immune Cell–Cytokine Interplay in NSCLC and Melanoma: A Pilot Longitudinal Study of Dynamic Biomarker Interactions

by
Alina Miruna Grecea-Balaj
1,2,
Olga Soritau
3,
Ioana Brie
3,
Maria Perde-Schrepler
3,
Piroska Virág
3,
Nicolae Todor
4,
Tudor Eliade Ciuleanu
1 and
Cosmin Andrei Cismaru
5,*
1
Department of Medical Oncology, Oncology Institute “Prof. Dr. Ion Chiricuta”, 400015 Cluj-Napoca, Romania
2
Department of Medicine, University of Medicine and Pharmacy “Iuliu Hatieganu”, 400012 Cluj-Napoca, Romania
3
Department of Tumor Biology and Radiobiology, Oncology Institute “Prof. Dr. Ion Chiricuta”, 400015 Cluj-Napoca, Romania
4
Department of Biostatistics, Oncology Institute “Prof. Dr. Ion Chiricuta”, 400015 Cluj-Napoca, Romania
5
Department of Genomics, Institute of Biomedical Research–MEDFUTURE, University of Medicine and Pharmacy “Iuliu Hatieganu”, 400012 Cluj-Napoca, Romania
*
Author to whom correspondence should be addressed.
Immuno 2025, 5(3), 29; https://doi.org/10.3390/immuno5030029
Submission received: 1 June 2025 / Revised: 14 July 2025 / Accepted: 21 July 2025 / Published: 24 July 2025

Abstract

The tumor microenvironment (TME) in advanced solid tumors is determined by immune checkpoints (PD-1, CTLA-4, and CD95) and cytokine networks (IL-2, IL-10, and TNF-α) that drive CD8+ T cell exhaustion, metabolic reprogramming, and apoptosis resistance, enabling immune evasion. Some studies revealed PD-1/CD95 co-expression is a marker of T cell dysfunction, while CTLA-4 upregulation correlates with suppressed early T cell activation. IL-10 has emerged as a potential biomarker for chemoresistance and tumor aggressivity, consistent with its role in promoting anti-apoptotic signaling in cancer stem cells (CSCs). Engineered IL-2 variants and TNF-α modulation are highlighted as promising strategies to revitalize exhausted CD8+ T cells and disrupt CSC niches. This prospective single-center study investigated the dynamic TME alterations in 16 patients with immunotherapy-naïve stage IV non-small-cell lung cancer (NSCLC) and metastatic melanoma treated with anti-PD-1 nivolumab. The longitudinal immunophenotyping of peripheral blood lymphocytes (via flow cytometry) and serum cytokine analysis (via ELISA) were performed at the baseline, >3, and >6 months post-treatment to evaluate immune checkpoint co-expression (PD-1/CD95 and CTLA-4/CD8+) and the cytokine profiles (IL-2, IL-10, and TNF-α).

1. Introduction

The tumor microenvironment (TME) in solid tumors is shaped by a complex interplay between inhibitory immune checkpoints, cytotoxic T cell dynamics, and cytokine networks that collectively drive immune evasion. This lively ecosystem has its immune evasion mechanisms coordinated by inhibitory receptors and ligand interactions that critically undermine CD8+ cytotoxic T lymphocyte (CTL) efficacy. The key players in this process include programmed death-1 (PD-1), cytotoxic T-lymphocyte-associated protein 4 (CTLA-4), and CD95 (Fas), which collectively drive T cell exhaustion, metabolic reprogramming, and apoptotic resistance in solid tumors. Cytokines such as interleukin-2 (IL-2), interleukin-10 (IL-10), and tumor necrosis factor-alpha (TNF-α) modulate these interactions to either enhance or weaken antitumor immunity [1,2,3].
PD-1 mediates immunosuppression through PD-L1/PD-L2 binding, inducing CD8+ T cell cycle arrest, metabolic shifts from glycolysis to fatty acid oxidation, and mitochondrial dysfunction, ultimately promoting apoptosis [4,5,6]. In contrast, CTLA-4 functions earlier in the immune response, primarily during T cell priming in lymphoid tissues. With a 20-fold higher level of affinity for CD80/CD86 ligands compared to CD28, CTLA-4 destabilizes the immunological synapse and suppresses early T cell activation [2,5,7]. The co-expression of PD-1 and CTLA-4 on tumor-infiltrating CD8+ T cells correlates with severe functional exhaustion, characterized by diminished cytokine production and proliferative capacity [8,9]. While PD-1 blockade rejuvenates the effector functions in differentiated T cells, CTLA-4 inhibition broadens the repertoire of circulating tumor-reactive CD8+ T cells, supporting their non-redundant roles and the rationale for combination therapies [10,11].
CD95L-expressing tumors adopt a “counterattack” strategy by inducing apoptosis in CD95-sensitive CD8+ T cells, while simultaneously activating the pro-tumorigenic pathways in cancer cells. These include the nuclear factor kappa-light-chain-enhancer of activated B cells (NF-κB) and the proto-oncogene tyrosine-protein kinase Src/phosphoinositide 3-kinase (Src/PI3K) signaling cascade, which support cancer stem cell (CSC) survival and epithelial–mesenchymal transition [12,13]. This axis is further reinforced by IL-10, which suppresses CD95-mediated apoptosis in cancer cells and upregulates anti-apoptotic Bcl-2 family proteins, fostering chemoresistance [14,15]. PD-1/CD95 interplay creates a permissive niche where exhausted T cells coexist with apoptosis-resistant CSCs, perpetuating immune escape.
Regarding cytokine cross regulation in the TME, IL-2 signaling is often deficient, diminishing CTL expansion. Engineered IL-2 variants such as PD-1-targeted IL-2 (PD-1-IaIL-2) selectively target PD-1+CD8+ T cells, revitalizing dysfunctional populations and enhancing checkpoint blockade efficacy [16,17]. Produced by tumors and regulatory T cells, IL-10 dampens T helper cell subtypes such as Th1, promotes Th2/Th3 polarization, and protects CSCs from CD95-driven apoptosis [18]. High IL-10 levels correlate with tumor aggressiveness and a poor prognosis in thyroid and hepatocellular carcinomas [15,18]. TNF-α also sustains CSC niches and contributes to inflammatory pro-tumorigenic signaling, highlighting its context-dependent roles [16,18].
Dissecting the nuanced functions of PD-1, CTLA-4, and CD95 in CD8+ T cell exhaustion, metabolic adaptation, and tumor immune editing reveals promising opportunities for combinatorial targeting. Overcoming resistance mechanisms—such as CSC persistence mediated by CD95 and lymphoid-primed CTLA-4-dependent suppression—will require integrated approaches that address both checkpoint-driven exhaustion and tumor-intrinsic survival pathways. Combination therapies that simultaneously target these immune checkpoints and regulate cytokine networks—such as PD-1-targeted IL-2 fusion proteins and anti-IL-10 antibodies—could address therapeutic resistance by revitalizing antitumor immunity [5,10]. However, the dual nature of TNF-α and IL-10—exhibiting both immunostimulatory and immunosuppressive effects—demands precise therapeutic modulation to avoid aggravating immune dysfunction or inadvertently promoting metastasis [14].
This study aims to longitudinally characterize the dynamic immune landscape in patients with advanced non-small-cell lung cancer (NSCLC) and metastatic melanoma undergoing anti-PD-1 therapy with nivolumab. Specifically, this study investigates the alterations in immune checkpoint expression (PD-1, CTLA-4, and CD95) and cytokine profiles (IL-2, IL-10, and TNF-α) in peripheral blood over time. By correlating cellular and humoral immune markers with the clinical outcomes, this study seeks to identify the potential biomarkers of therapeutic response and resistance.
This prospective single-center study provides the detailed temporal analysis of immune parameters before and after treatment initiation, offering insights into tumor-specific immune remodeling and informing strategies for personalized immunotherapy.

2. Materials and Methods

2.1. Study Design

This single-center, prospective, interventional investigation enrolled patients with advanced stage IV non-small-cell lung cancer (NSCLC) and metastatic melanoma at the Oncology Institute “Prof. Dr. I. Chiricuta” (Cluj-Napoca, Romania), who received monotherapy with the anti-programmed cell death protein 1 (anti-PD-1) immune checkpoint inhibitor (ICI) nivolumab between January 2018 and May 2019. The longitudinal immunophenotypic profiling of peripheral blood lymphocytes was conducted through serial flow cytometry analyses at three defined intervals: the baseline (pre-treatment) and post-treatment (>3 and >6 months after immunotherapy initiation). The key immune markers evaluated included surface receptor expression PD-1, CD95 (Fas receptor), and CD8+ T cell populations and CTLA-4. Co-expression ratios were also evaluated: PD-1/CD95 and CD8/CTLA-4. Concurrent cytokine analysis quantified the serum concentrations of interleukin-2 (IL-2), interleukin-10 (IL-10), and tumor necrosis factor-alpha (TNF-α) at matched time points.

2.2. Inclusion and Exclusion Criteria

The participants were eligible for inclusion if they had a pathology-confirmed diagnosis of stage IV melanoma or stage IV non-small-cell lung cancer (NSCLC). Eligible patients were required to be 18 years of age or older, immunotherapy-naïve, and receiving either first-line or subsequent lines of therapy with nivolumab. Written informed consent was obtained from all the participants. The exclusion criteria included pregnancy or lactation, any prior history of malignancy (apart from non-melanoma skin cancer or in situ cervical carcinoma), and any previous exposure to immunotherapy.

2.3. Methods and Statistical Analysis

Analyses were conducted in a descriptive and exploratory manner, without predefined hypotheses. The results are summarized in tables and interpreted descriptively. The categorical variables are reported as counts and percentages, while the continuous variables are described using standard statistics (number of observations, missing values, mean, standard deviation, median, minimum, and maximum) [19].
Statistical analyses were conducted using IBM SPSS Statistics software version 30, with a significance threshold set at p < 0.05 and no multiple-testing correction applied due to the exploratory nature and limited sample size of this study.
The longitudinal data were analyzed using analysis of variance (ANOVA) for both within-group and between-group comparisons of marker expression and ratios across the three time points.
Correlation analyses were performed employing the non-parametric Spearman rank correlation test. Spearman’s rank correlation coefficient was used to assess the associations between immune cell marker levels (including all ratios) and clinical outcomes (e.g., survival), as well as between the cellular and cytokine parameters. This method was chosen for its robustness to non-normal distributions and outliers, which are common in immunophenotyping datasets.
Cytokine concentrations were determined utilizing enzyme-linked immunosorbent assay (ELISA) DuoSet kits (R&D Systems). Immunophenotyping was conducted via flow cytometry to quantify the percentage expression of PD-1, CD95, CD8, and CTLA-4 in peripheral blood lymphocyte populations at the three time points aforementioned (baseline, >3 months, and >6 months). Co-expression ratios (PD-1/CD95, CD8/CTLA-4, and CD8/CTLA-5) were calculated as ratios of the respective marker percentages within the lymphocyte gate following established immunophenotyping protocols. Molecule expression was evaluated in percentage as per laboratory internal practice.

2.4. Study Objectives

This study has been designed to address three primary objectives: (1) to evaluate the dynamic alterations within the tumor microenvironment (TME) by analyzing peripheral activated lymphocyte populations both prior to and following ICI therapy with nivolumab, thereby elucidating the nature of the immune response; (2) to identify if specific inflammatory cytokines may serve as predictive biomarkers for responsiveness to immunotherapy having correspondence with survival; and (3) to investigate the correlation between cellular immune responses and humoral immune responses in patients diagnosed with non-small-cell lung cancer and melanoma.

3. Results

Between January 2018 and May 2019, a total number of 59 patients was screened. Statistical analysis was performed in January 2025, with a median follow-up of 22 months. A survival update was conducted in May 2025 since some of the patients are long-term survivors. Only nine patients with NSCLC and seven patients with melanoma met the eligibility criteria of respecting the time points of immunophenotyping and cytokine detection. We have selected patients with at least two peripheral immunophenotyping and in agreement TNF-α, IL-2 and IL-10 dosage at 3 time points. Two patients with melanoma had only 2 time points listed, the baseline and >3 months since the ICI had been administered. The median age at study entry was 57 years, and the majority were smokers (62.5%). Most patients received nivolumab as second line therapy, with a median number of 20 cycles, and nearly half of the patients received further lines of treatment, such as targeted therapy, chemotherapy, or combinations. The median overall survival is 22.66 months (Table 1).

3.1. Temporal Dynamics of Immune Checkpoint Molecules

Taking into consideration patient lymphocyte phenotyping, the consolidated dataset encompasses immune biomarker measurements, comprising both non-small-cell lung cancer (NSCLC) and melanoma cases tracked across three critical time points during immunotherapy treatment. The temporal framework establishes the baseline measurements (timeline 0), followed by assessments at 3 months (timeline 1) and 6 months (timeline 2) post-immunotherapy initiation, as seen in Table 2 and Table 3. The NSCLC cohort included nine patients with comprehensive biomarker profiles measured across the treatment timeline (Table 2). Similarly, the melanoma cohort encompasses seven patients with parallel measurements, enabling robust comparative analysis between the cancer types (Table 3). The biomarker panel evaluates six key immune parameters: PD-1 expression, the CD95 level, the CD8+ T cell population, CTLA-4 expression, and the PD-1/CD95 and CD8-CTLA-4 ratios, all expressed as percentages.
Longitudinal biomarker analyses of the two cancer cohorts reveal distinct immunophenotypic patterns with considerable inter-patient variability. The NSCLC group (n = 9) showed low-level baseline PD-1 expression (mean 1.4% ± 1.1%), which appeared stable at 6 months (mean 9.5% ± 24.2%). However, an apparent increase was driven almost entirely by a single outlier (Patient 9, 74.7%). CD95 expression showed moderate variation (baseline: 42.3% ± 13.1%; 6 months: 35.4% ± 20.8%). The CD8+ T cell percentages remained relatively stable (from 28.2% ± 6.8% to 31.9% ± 9.4%).
The patients with melanoma (n = 7) exhibited higher baseline PD-1 expression levels (3.4% ± 1.4%), which remained steady at 3.5% ± 0.5% after 6 months. The amount of CD95 increased modestly from 28.1% ± 2.8% to 32.5% ± 2.6%, and the CD8+ T cell percentages increased slightly from 23.7% ± 5.5% to 25.3% ± 8.7%.
The CTLA-4 expression level remained consistently low (<1.1%) across both the groups, suggesting limited Treg activation. The outlier-driven PD-1 variability in NSCLC contrasts with melanoma’s more uniform patterns, reflecting potential differences in the immune checkpoint dynamics. These findings suggest that the immunological changes following therapy are more subtle and variable, with the most notable alterations being individual patient responses rather than consistent population-level trends. This highlights the importance of personalized biomarker interpretation in immuno-oncology research.
Considering the biomarker ratios, the PD-1/CD95 ratio in the patients with NSCLC decreased progressively from the baseline (mean 4.68%, range 1.1–12.3%) to 6 months (mean 3.39%, range 0.7–6.5%). The patients with melanoma had significantly higher baseline ratios (mean 14.43%, range 7.2–19.0%) with a decline at 3 months (mean 9.81%) and partial rebound at 6 months (mean 12.14%). This indicates early checkpoint modulation and subsequent immune rebalancing.
The CD8/CTLA-4 ratio showed similar baseline values in both the cohorts (NSCLC: 0.50%; melanoma: 0.74%). The patients with NSCLC experienced a noticeable increase at 6 months (mean 1.40%), influenced by one outlier (9.0%). The patients with melanoma maintained relatively stable ratios (0.67% at 3 months, 0.70% at 6 months). These findings suggest differential immunological responses to nivolumab between the tumor types, with the patients with melanoma showing greater baseline immune checkpoint activation, but more stable cytotoxic-to-regulatory T cell ratios over time, potentially reflecting distinct underlying tumor immunobiology and therapeutic mechanisms.

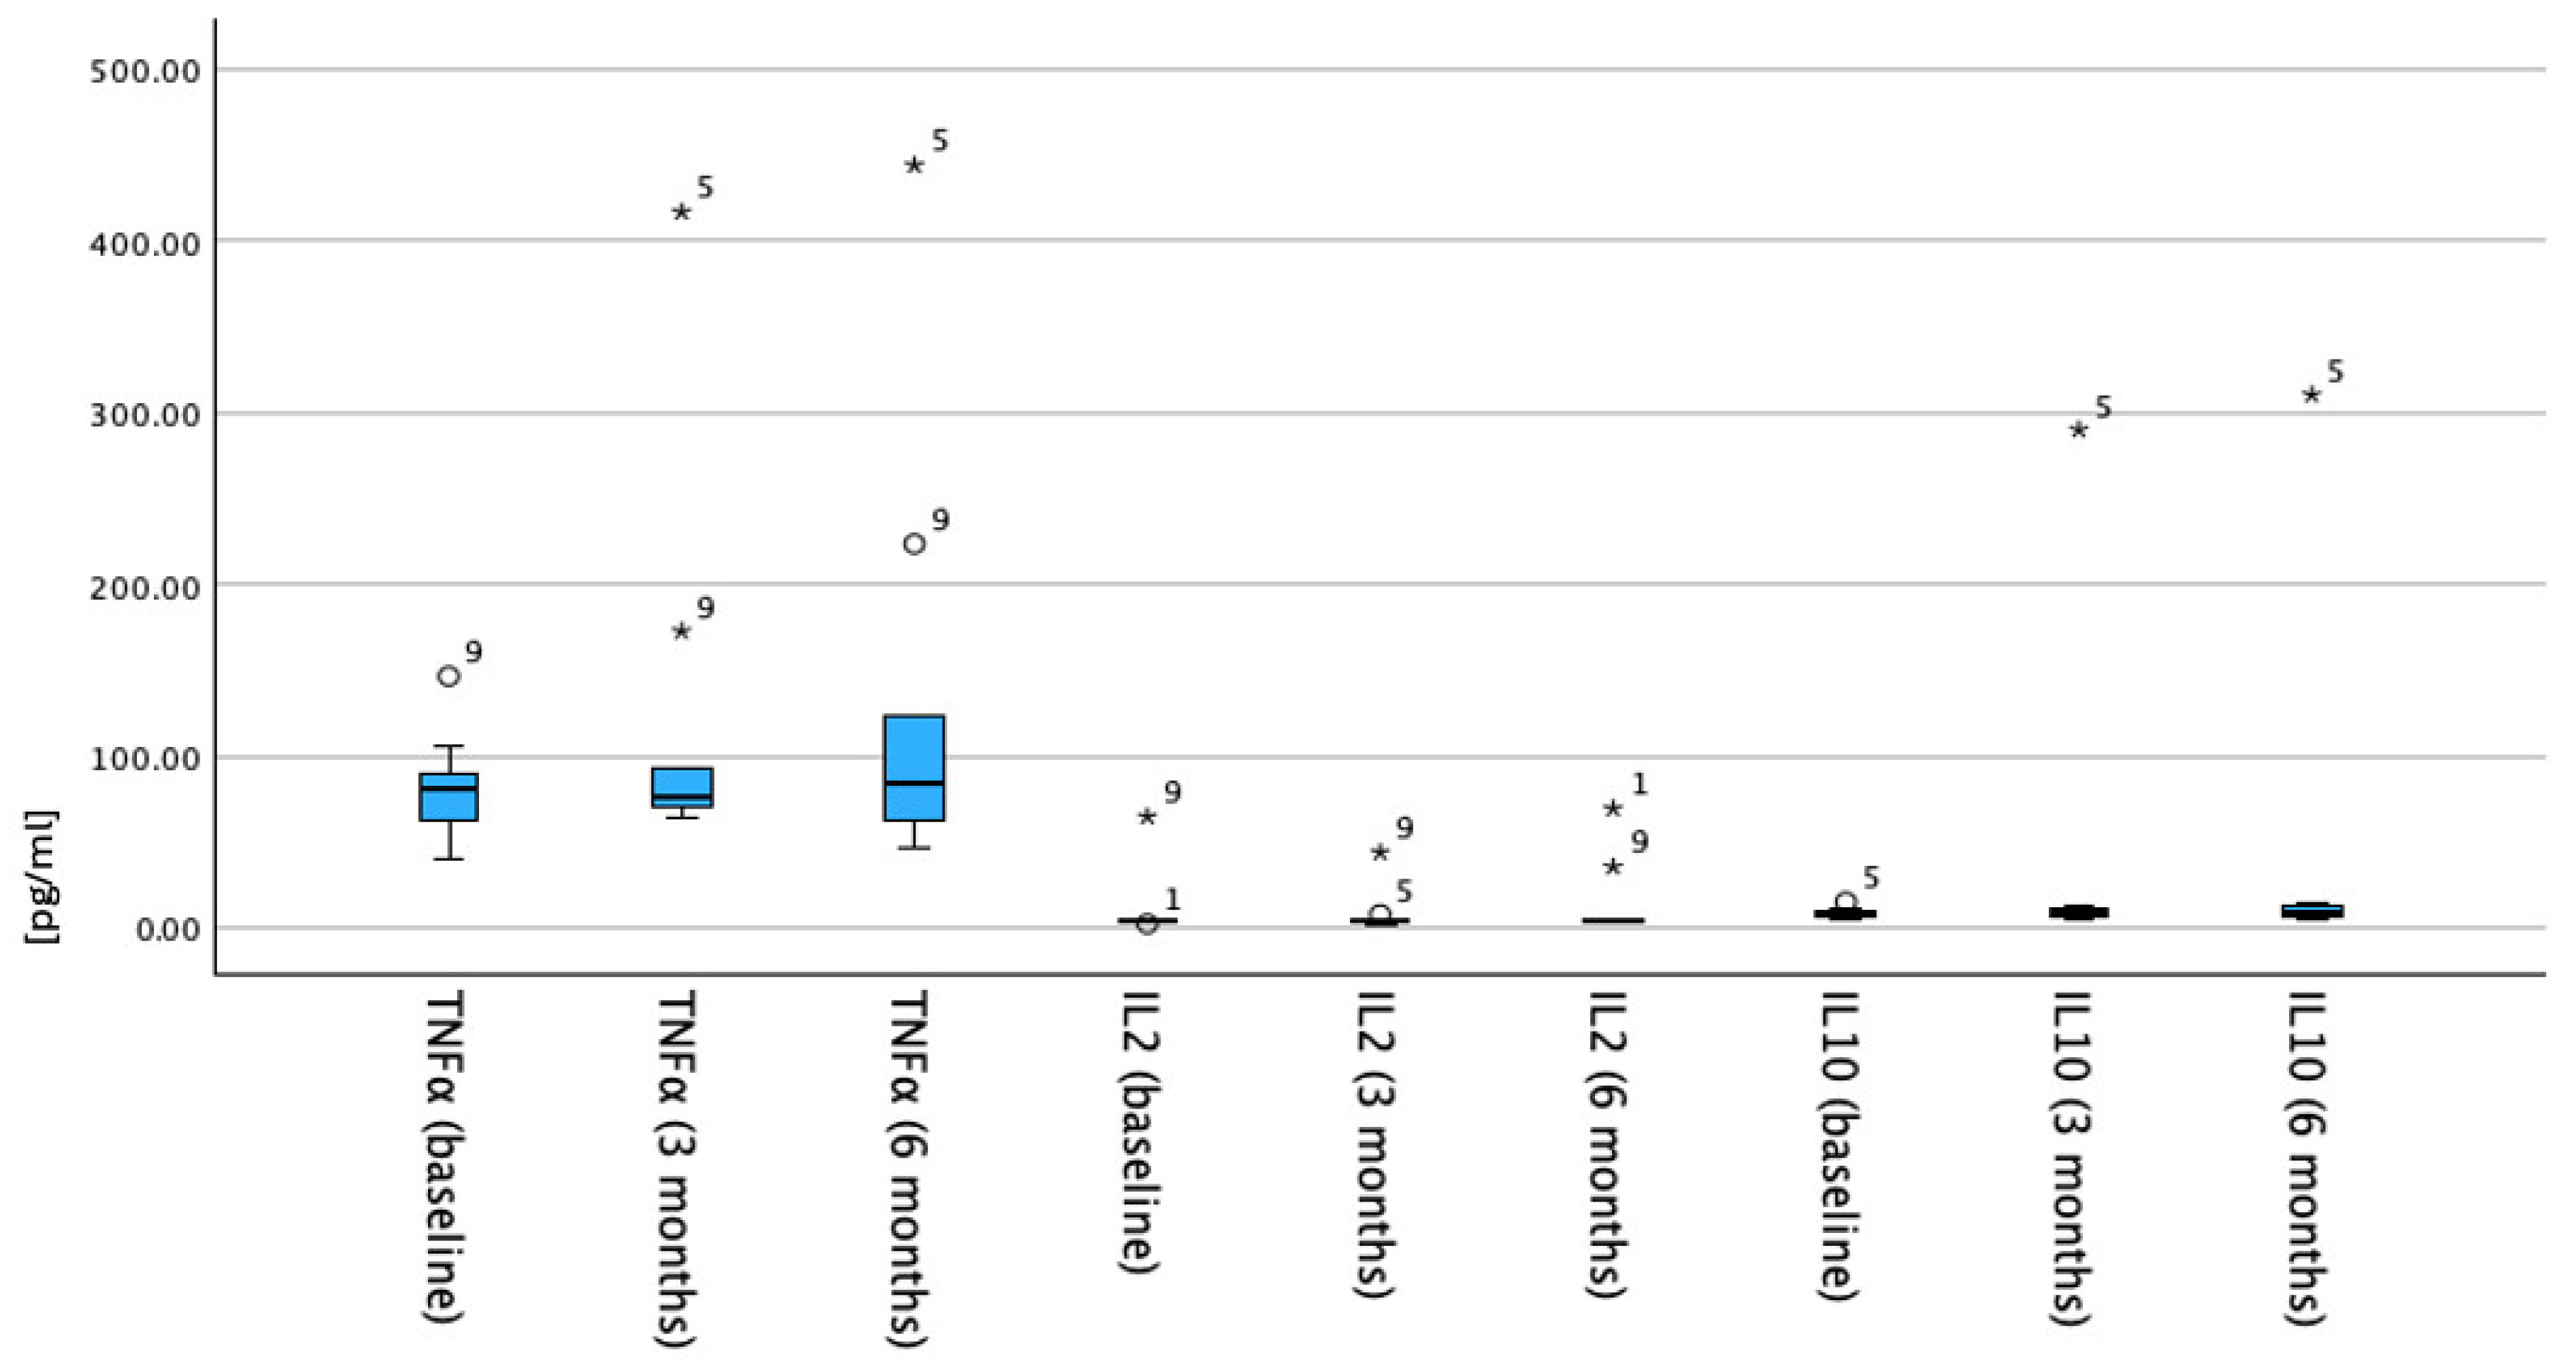
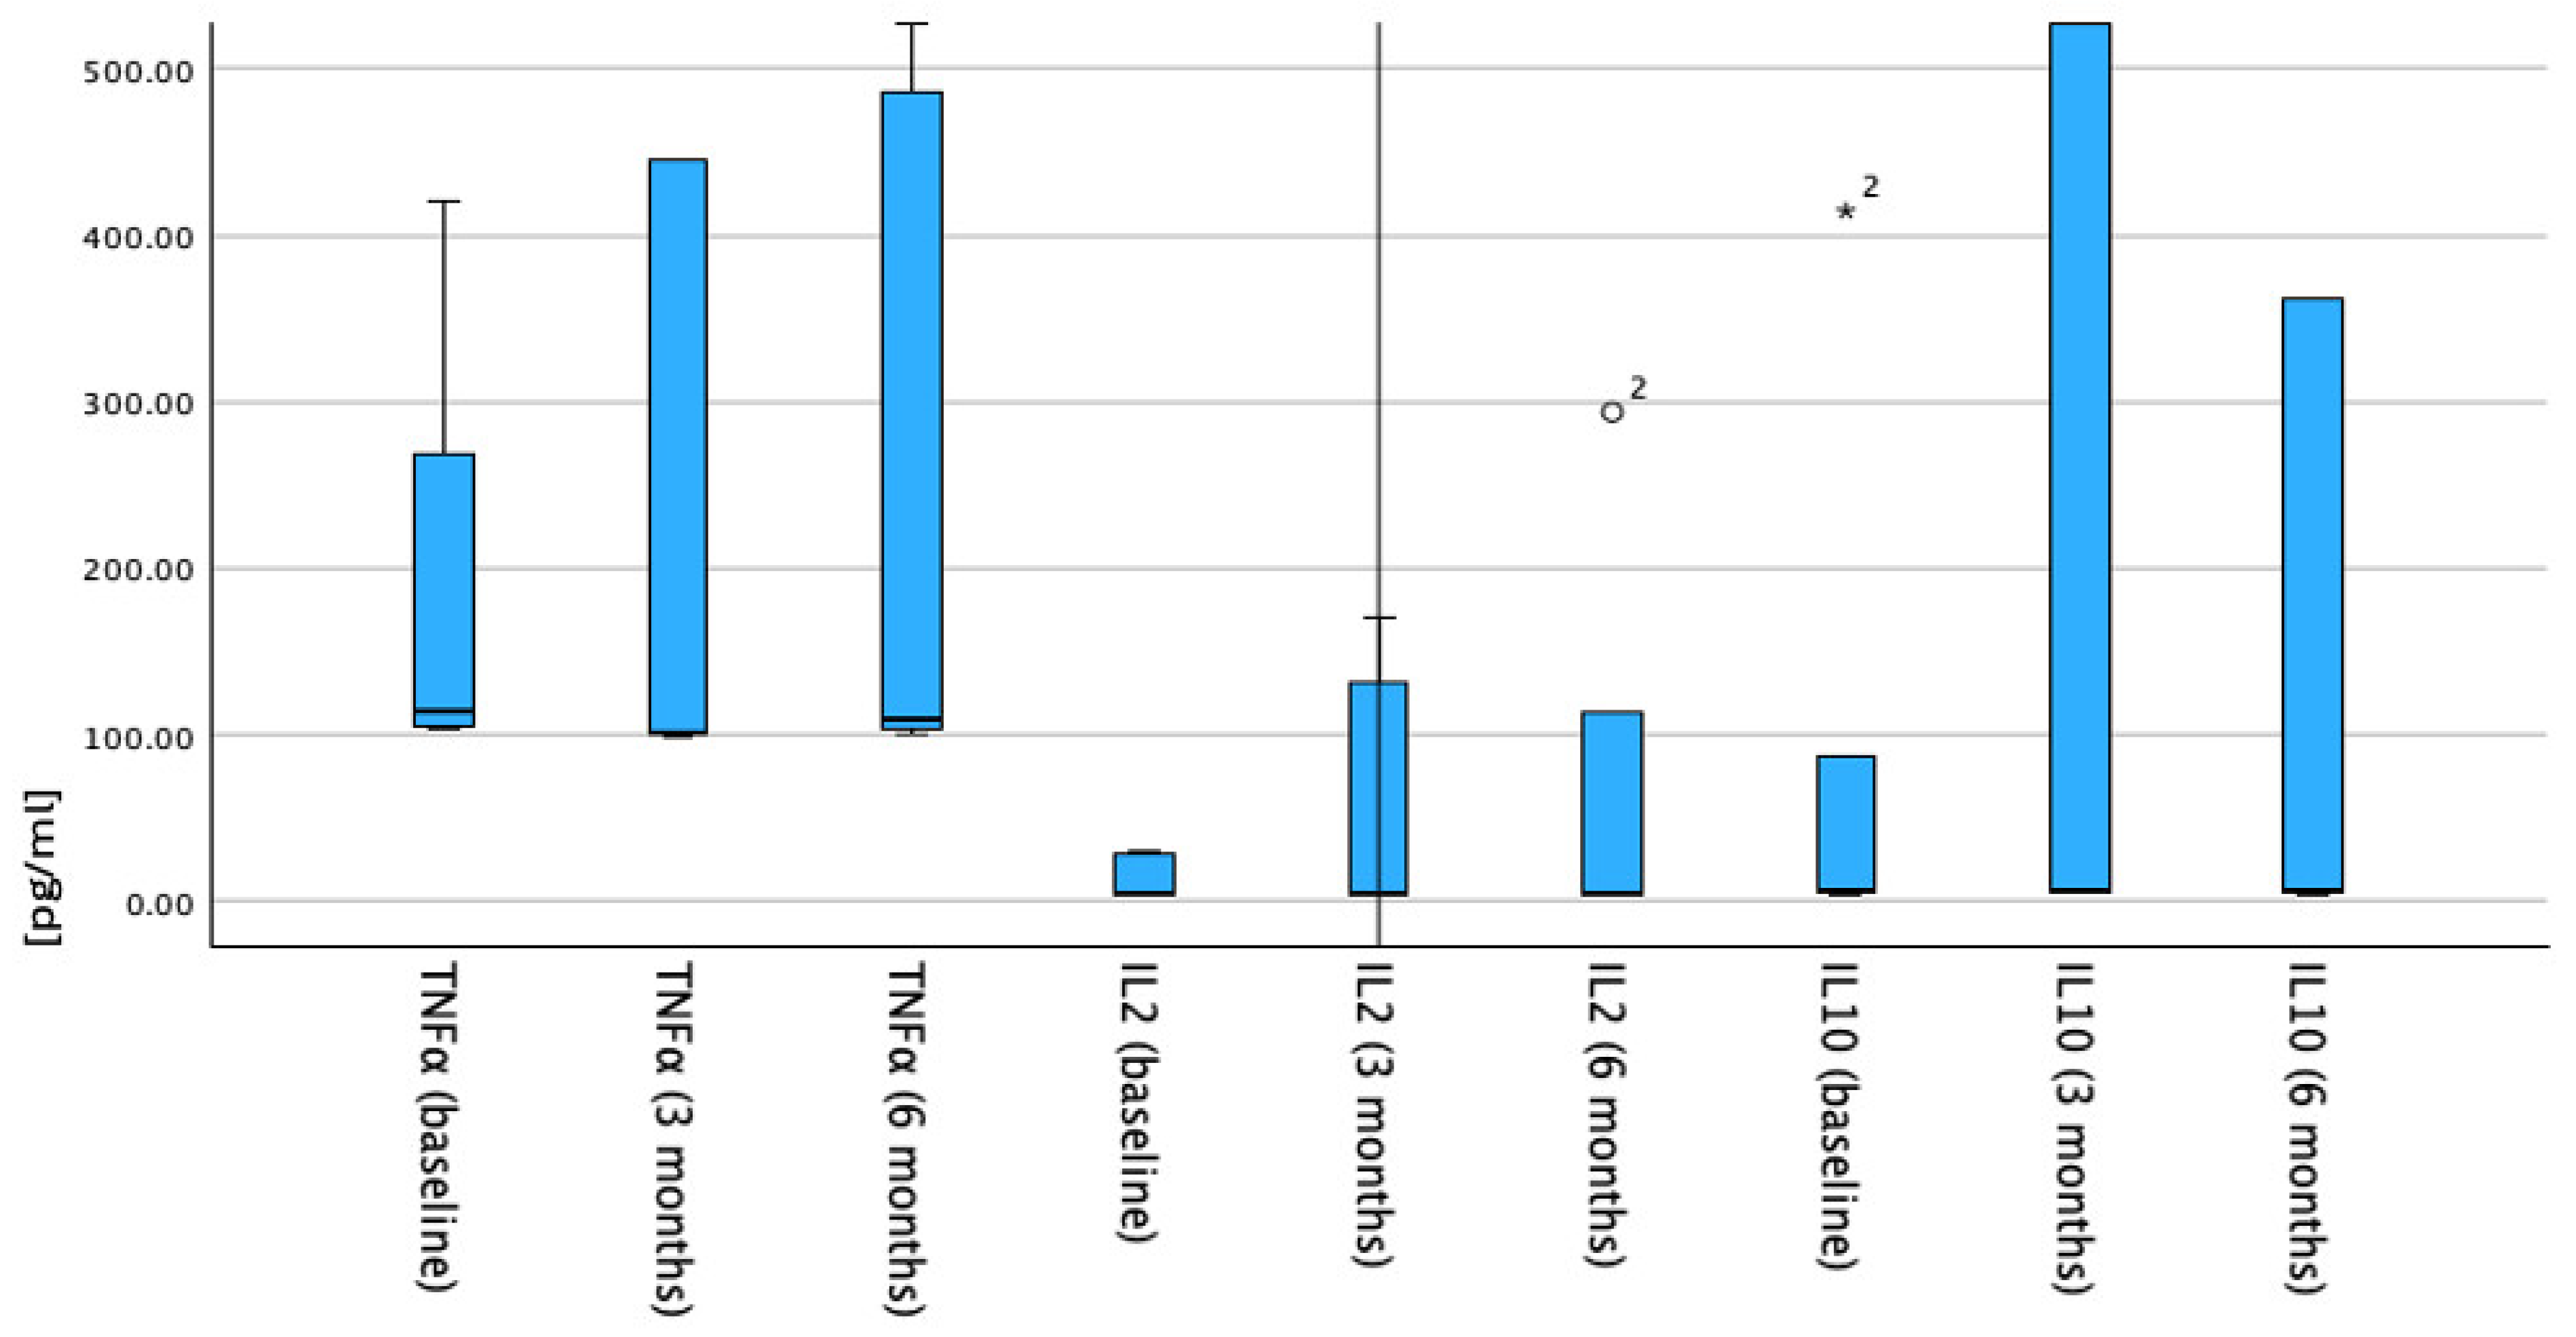
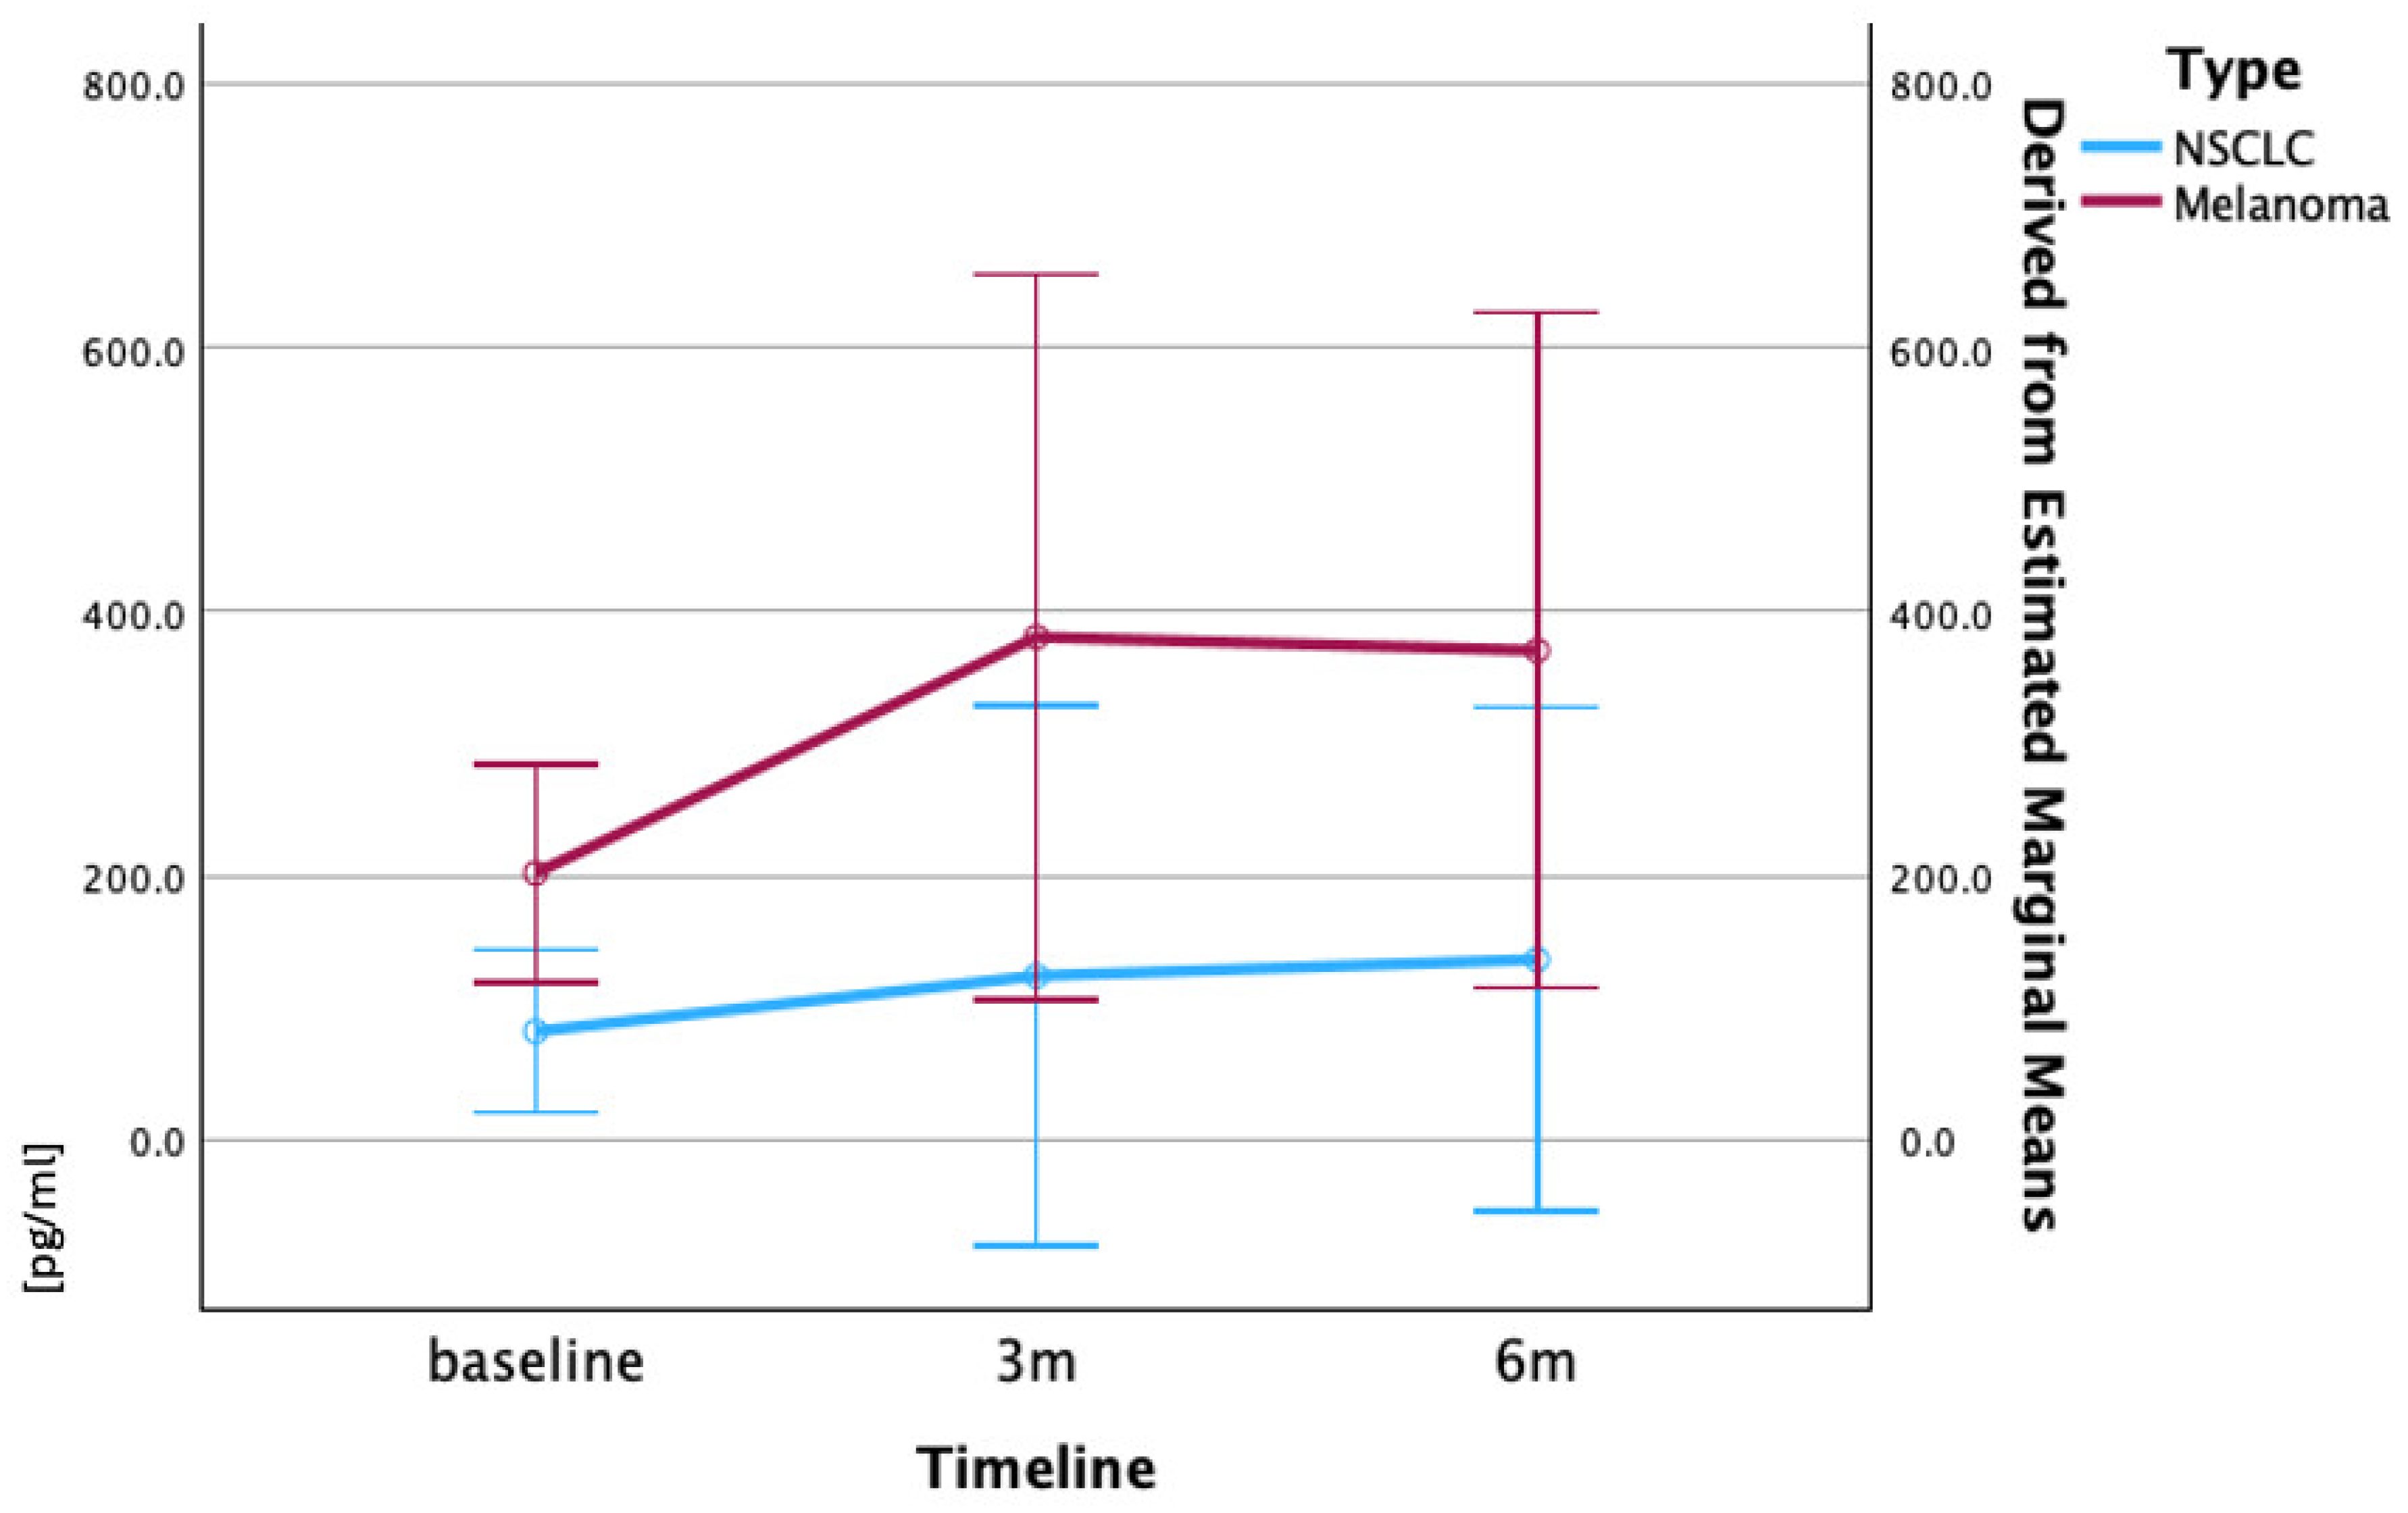
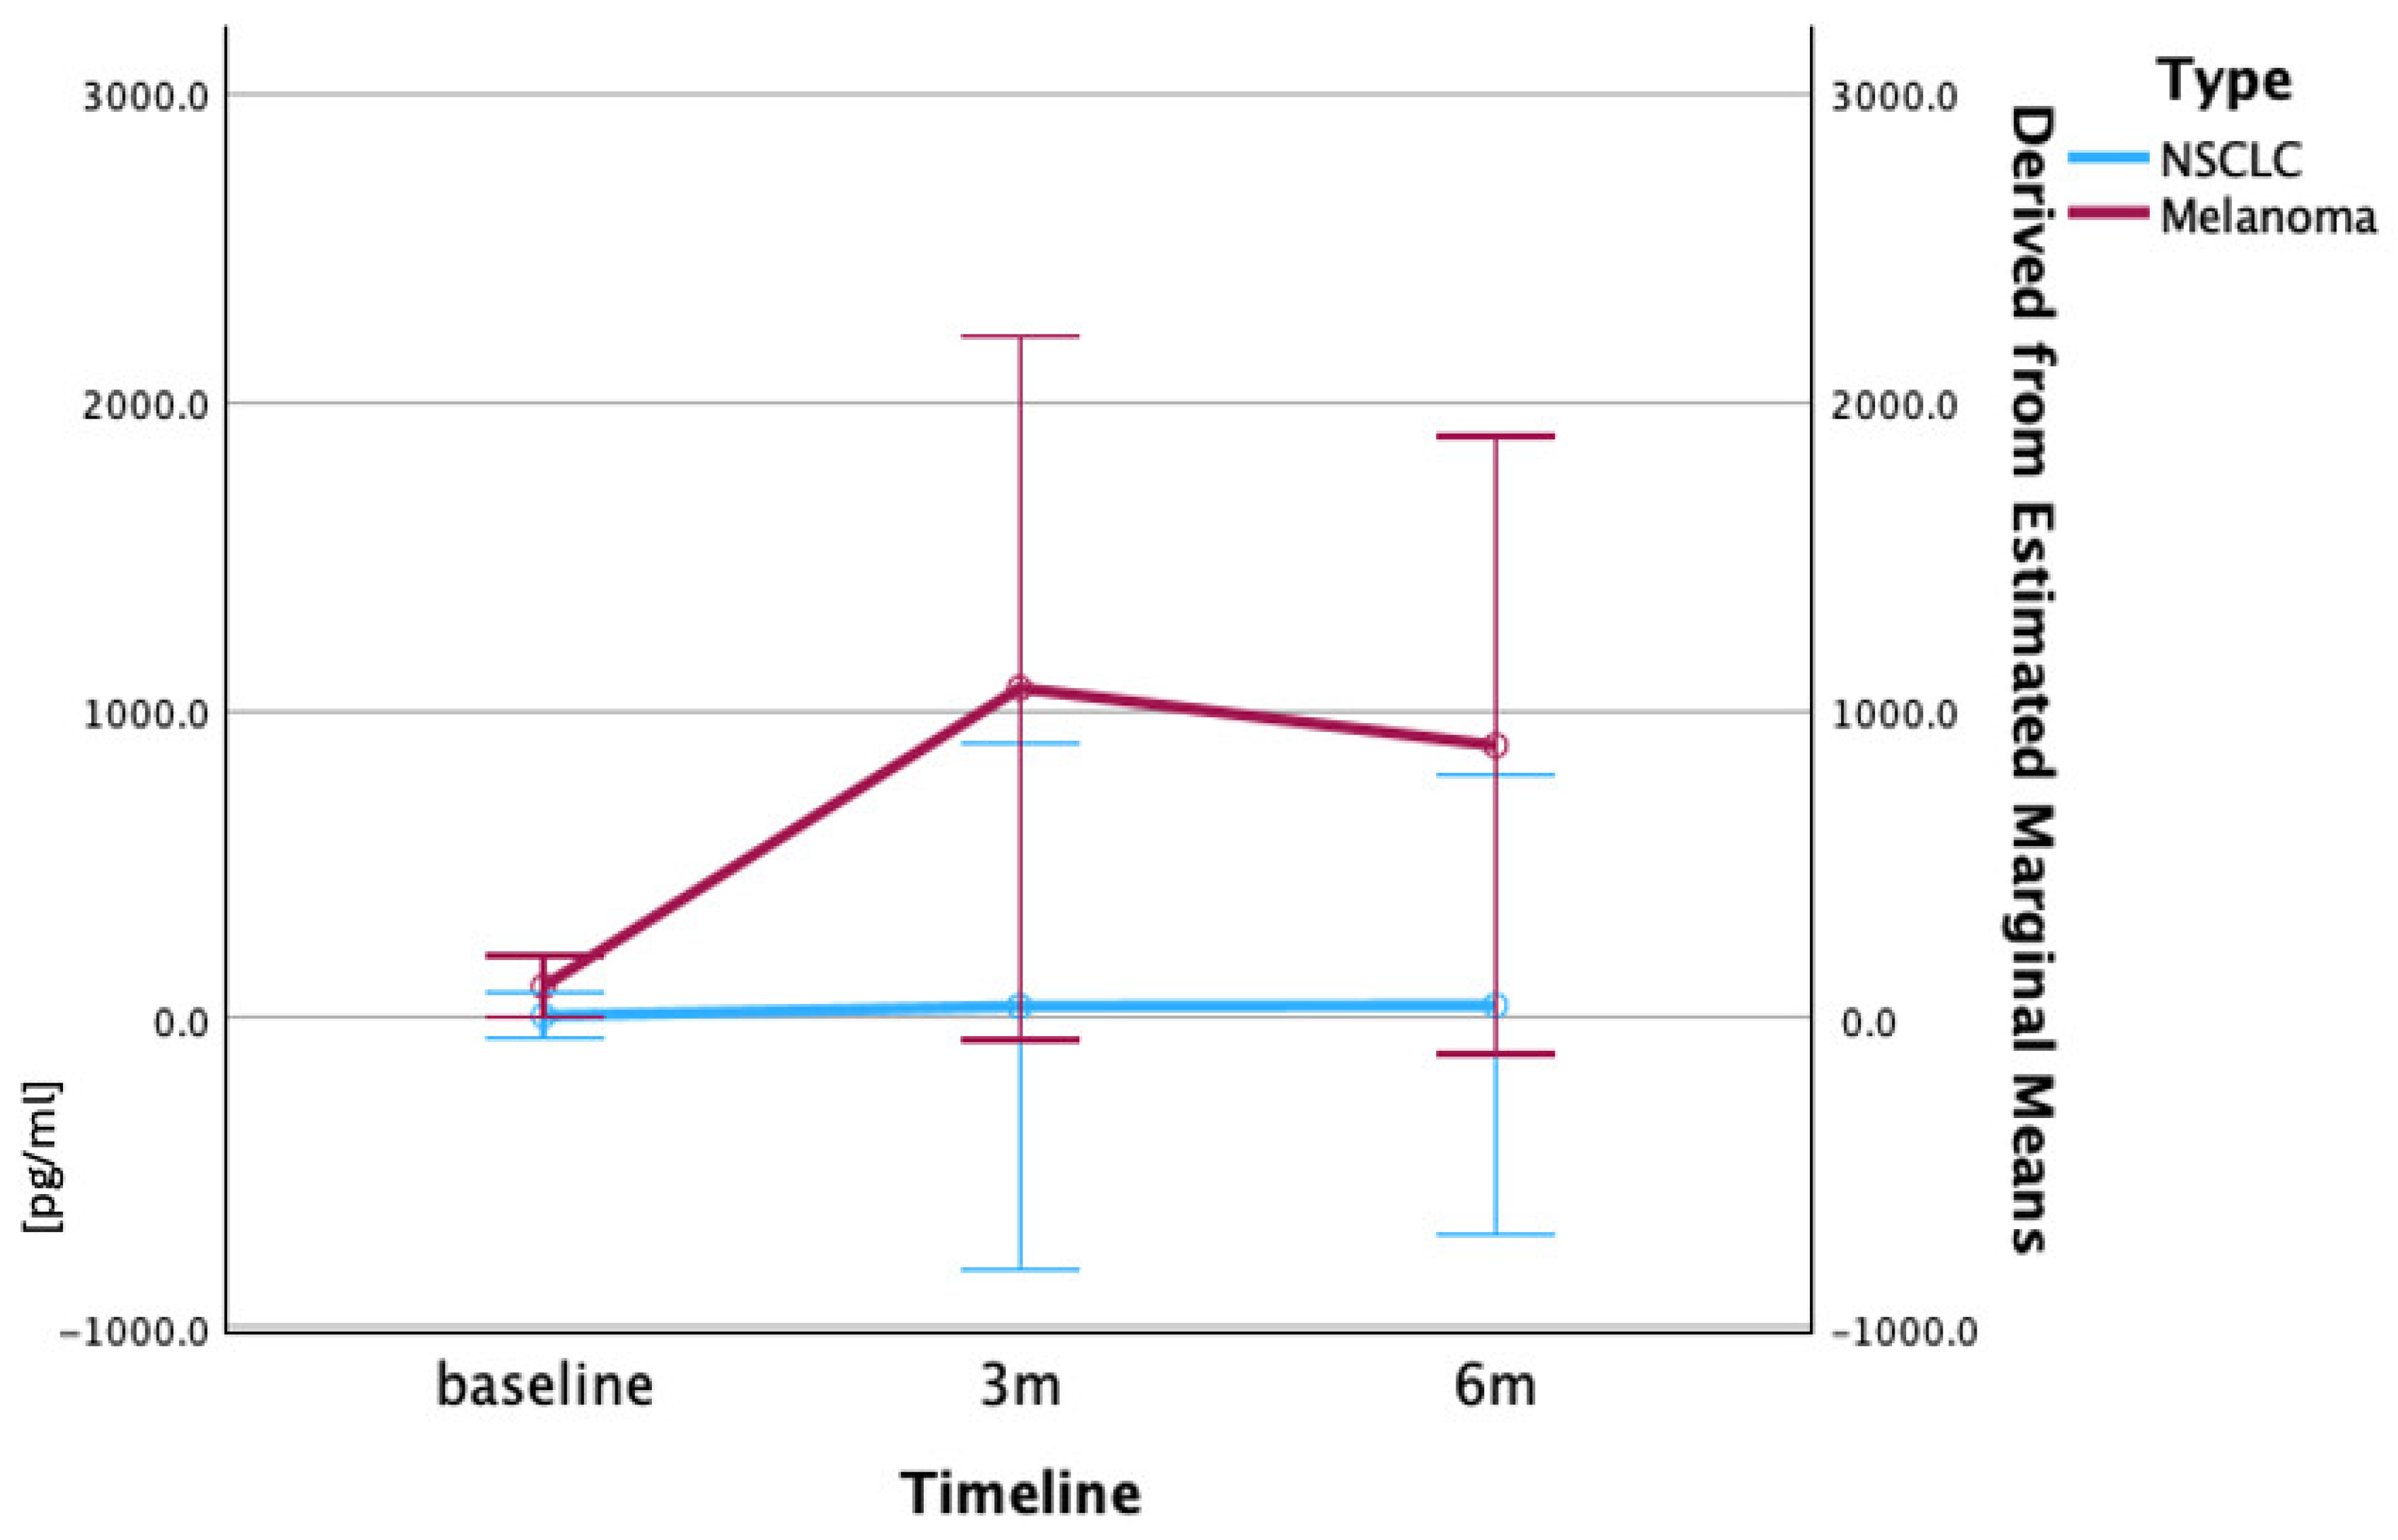
3.2. Temporal Trends of Cytokines Correlated with Survival

This study analyzed the cytokine profiles of the 16 patients receiving anti-PD-1 nivolumab.
The baseline cytokine levels demonstrated significant differences between the cancer types, with the patients with melanoma exhibiting substantially higher mean levels across all the measured cytokines compared to the patients with NSCLC (Figure 1 and Figure 2). The data were analyzed and plotted using IBM SPSS Statistic software version 30 (accessed on May 2025). All the cytokine serum levels are expressed in pg/mL.
The baseline TNF-α levels showed marked variation between the patient cohorts, with the patients with melanoma demonstrating a mean baseline concentration of 202.2 pg/mL compared to 82.3 pg/mL in the patients with NSCLC. During the treatment course, the patients with NSCLC exhibited a progressive increase in TNF-α levels from the baseline (82.3 pg/mL) to 3 months (124.3 pg/mL) and 6 months (136.7 pg/mL). In contrast, the patients with melanoma showed an initial elevation at 3 months (380.9 pg/mL), followed by a slight decrease at 6 months (370.8 pg/mL), though the levels remained above the baseline throughout the observation period (Figure 3).
The IL-2 concentrations at the baseline were comparable between the two cancer types, with the patients with NSCLC showing a mean of 10.07 pg/mL, and that of the patients with melanoma being 13.9 pg/mL. However, the treatment response patterns differed substantially. The patients with NSCLC maintained relatively stable IL-2 levels with minor fluctuations throughout the treatment period. The patients with melanoma demonstrated a dramatic progressive increase from baseline (13.9 pg/mL) to 3 months (62.9 pg/mL), and further elevation to 6 months (83.7 pg/mL), representing a more than six-fold increase from the baseline (Figure 4).
The most striking differences were observed in the IL-10 levels, where the patients with melanoma exhibited baseline concentrations nearly 12-fold higher than those of the patients with NSCLC (103.5 pg/mL versus 8.4 pg/mL). The patients with NSCLC showed a modest, but consistent increase in IL-10 levels from the baseline (8.4 pg/mL) to 3 months (39.4 pg/mL) and 6 months (42.1 pg/mL). The patients with melanoma demonstrated massive elevations in IL-10 levels, increasing from the baseline (103.5 pg/mL) to 1071 pg/mL at 3 months and reaching 885.5 pg/mL at 6 months, representing a more than five-fold increase from the already elevated baseline levels (Figure 5).
Regarding cytokine and survival correlation, the analysis identified the IL-2 levels at three months as the most robust predictor of patient survival, with a strong positive correlation (ρ = 0.756, p < 0.001) (Table 4). This finding indicates that elevated IL-2 concentrations at the three-month mark are significantly associated with prolonged survival times. The baseline IL-2 levels also demonstrated a notable positive correlation with the survival outcomes (ρ = 0.674, p = 0.004), further underscoring the prognostic value of this cytokine.
TNF-α exhibited consistent positive correlations with survival across all the assessed time points, with the most pronounced association observed at six months (ρ = 0.670, p = 0.009) (Table 5). This is particularly noteworthy given TNF-α’s conventional characterization as a pro-inflammatory marker, suggesting a potentially beneficial role in this context.
In contrast, the IL-10 levels did not display significant correlations with survival at any measured interval (correlation coefficients ranging from 0.064 to 0.359; all p-values > 0.05), indicating limited prognostic utility for this cytokine within the studied cohort (Table 6).
The patients who survived for longer than 60 months, including patients 5 and 8 with NSCLC (66.33 and 64.55 months) and patients 11, 13, and 14 with melanoma (87.42, 83.02, and 84.03 months), demonstrated distinct cytokine response patterns characterized by the sustained elevation of multiple cytokines during treatment.
Individual patient analysis revealed notable patterns among the long-term survivors. Patient 5 (NSCLC) showed dramatic cytokine level elevation during treatment despite the modest baseline levels, while patient 8 (NSCLC) maintained stable cytokine profiles throughout treatment. Among the patients with melanoma, patient 11 presented with extremely high baseline TNF-α (1309.5 pg/mL) and IL-10 levels (582.2 pg/mL), while patients 13 and 14 showed high baseline levels with sustained elevation throughout treatment. Conversely, the patients with poor prognosis (survival <20 months) generally exhibited lower baseline cytokine levels and minimal treatment-induced changes.
The magnitude of cytokine response during treatment appeared more prognostically significant than the absolute baseline levels. The patients demonstrating robust cytokine elevation during immunotherapy, particularly in IL-10 and IL-2, showed improved survival outcomes regardless of their baseline levels. The cancer type significantly influenced both the baseline cytokine profiles and the treatment-induced changes, with the patients with melanoma consistently showing more dramatic inflammatory responses compared to the patients with NSCLC, suggesting distinct immunological mechanisms underlying the treatment response in these different malignancies.

3.3. Correlation of Cellular and Humoral Immune Responses

The longitudinal analysis of the 16 patients undergoing nivolumab therapy reveals critical insights into immune–cytokine dynamics.
The baseline CD8+ T cell levels inversely correlated with TNF-α ( r = 0.515 , p = 0.041 ) and show borderline significance with IL-2 ( r = 0.497 , p = 0.0499 ), suggesting early cytotoxic activity may suppress cytokine expression. While the baseline CD8+ levels did not predict subsequent PD1+ T cell exhaustion ( r = 0.307 , p = 0.248 ), they demonstrated strong temporal stability with the CD8+ levels at 3 months ( r = 0.785 , p = 0.0003 ), highlighting their persistence as a feature of treatment response.
At 6 months, the PD1/CD95 ratio exhibited a moderate, but non-significant correlation with TNF-α ( r = 0.431 , p = 0.124 ), weakening the support for its role as a biomarker of cytokine-driven activation. Similarly, the CTLA-4+ T cells showed no robust association with IL-10 ( r = 0.328 , p = 0.212 ), contradicting the hypotheses about Treg-mediated IL-10 regulation. Attrition at 6 months ( n = 14 ) reduced the statistical power, potentially obscuring subtle relationships like the weak CD8+/IL-10 correlation ( r = 0.356 , p = 0.212) (Supplementary Material Table S1).
The analysis underscores CD8+/cytokine interplay as a principal signal, with TNF-α and IL-2 modulation tied to cytotoxic T cell activity. However, the lack of significance in checkpoint receptor ratios and Treg–cytokine relationships emphasizes the need for larger cohorts and functional validation.

4. Discussion

Even with a very scarce cohort, this small sample study provides real-world insights into dynamic changes in immune checkpoint expression and cytokine profiles in patients with advanced NSCLC and melanoma treated with nivolumab. These findings, when contextualized with the recent literature, further illuminate the complexity of the tumor microenvironment (TME), the challenges of immune evasion, and the evolving strategies to overcome resistance in cancer immunotherapy [20,21].

4.1. Immune Checkpoints: Distinct Roles and Therapeutic Implications

In the patients with NSCLC (n = 9), the baseline PD-1 expression level on CD8+ T cells was remarkably low (1.4% ± 1.1%), with stability at follow-up (9.5% ± 24.2%) driven largely by a single outlier (74.7%) (Table 1). This outlier-dominated pattern aligns with the emerging evidence of hyperprogressive disease subtypes in NSCLC, where extreme PD-1 fluctuations may indicate distinct biological trajectories [22,23]. This pattern has significant implications for treatment monitoring and may indicate the need for combination therapies or treatment modifications to identify hyperprogressors [24]. CD95 expression showed moderate variability (from 42.3% ± 13.1% at the baseline to 35.4% ± 20.8% at 6 months). The initial CD95 elevation corresponds temporally with PD-1 suppression, potentially indicating enhanced apoptotic susceptibility in tumor cells during early therapeutic response. The subsequent decline may reflect either successful tumor elimination or development of apoptosis resistance mechanisms. This biomarker combination provides insights into the balance between immune activation and tumor cell death pathways during treatment [13,25,26]. CD8+ infiltration remained stable (from 28.2% ± 6.8% to 31.9% ± 9.4%), consistent with the previous findings that high CD8+ tumor-infiltrating lymphocyte levels are predictive of better outcomes with immune checkpoint inhibitor therapy, while their stability may reflect ongoing immune surveillance in the tumor microenvironment [27,28,29].
The patients with melanoma (n = 7) demonstrate a more moderate and consistent PD-1 expression pattern throughout immunotherapy treatment, Table 2, supporting theories of alternative immune checkpoint dominance in cutaneous malignancies [30]. This represents a more balanced trajectory without the extreme fluctuations observed in the patients with NSCLC. The relatively stable PD-1 expression in melanoma may indicate a more sustained therapeutic response or different underlying tumor immunobiology compared to that of lung cancer [31,32]. The CD95 level increases (from 28.1% ± 2.8% to 32.5% ± 2.6%) paralleled the NSCLC trends, but within narrower ranges, potentially reflecting faster apoptotic control mechanisms [33]. CD8+ infiltration showed minimal progression (from 23.7% ± 5.5% to 25.3% ± 8.7%), consistent with melanoma’s variable response patterns to immunotherapies.
Both the cohorts demonstrated negligible CTLA-4 expression (<1.1%), challenging the assumptions about regulatory T cell activation timelines. This finding aligns with the recent critiques of CTLA-4’s predictive utility in early treatment monitoring [34,35,36,37]. The stark contrast in PD-1 variability between NSCLC (outlier-driven) and melanoma (uniformly low) suggests divergent resistance mechanisms, potentially informing cohort-specific therapeutic strategies [36].
These findings are consistent with the broader literature, which demonstrates that dual checkpoint blockade (e.g., nivolumab plus ipilimumab) leads to improved survival in both melanoma and NSCLC, albeit at the cost of increased toxicity [32,37,38,39,40]. The non-overlapping mechanisms of PD-1 and CTLA-4 inhibition justify combination strategies, as supported by meta-analyses and clinical trials showing enhanced efficacy [2,32].

4.2. Biomarker Ratio Analysis and Integrated Immune Assessment

The PD-1/CD95 ratio provides insights into the balance between immune exhaustion and apoptotic signaling pathways [41]. In the patients with NSCLC (Table 1), this ratio shows relative stability with modest fluctuations, whilst the patients with melanoma demonstrate higher baseline ratios with significant reductions afterwards, suggesting different immune exhaustion states (Table 2) [42]. The contrasting ratio patterns between NSCLC and melanoma reflect a complex interplay between checkpoint expression and apoptotic signaling. In melanoma, the reduction at 3 months, followed by partial recovery, suggests the dynamic rebalancing of these pathways during treatment. These ratio dynamics may serve as composite biomarkers for treatment response monitoring [43,44].
The CD8/CTLA-4 ratio reflects the balance between effector T cell populations and checkpoint inhibition. Both the cancer types showed similar baseline ratios (~0.5–0.7), with NSCLC showing an increase at 6 months (primarily driven by one outlier value of 9.0), while the melanoma ratios remained relatively stable throughout treatment.
The divergent patterns suggest cancer-specific differences in immune checkpoint regulation and T cell activation dynamics [45,46,47].

4.3. Cytokine Changes and Survival Correlation

This study reveals significant differences in cytokine dynamics between patients with NSCLC and melanoma undergoing anti-PD-1 therapy, with implications for survival outcomes. The patients with melanoma exhibited substantially higher baseline levels of TNF-α (Figure 3) (202.2 vs. 82.3 pg/mL) and IL-10 (Figure 5) (103.5 vs. 8.4 pg/mL) compared to those of the patients with NSCLC, suggesting the pre-existing inflammatory microenvironments may differ between the cancer types, as already highlighted before [48,49,50,51]. While the patients with NSCLC showed progressive increases in TNF-α levels throughout treatment, the patients with melanoma demonstrated an initial spike followed by decline, potentially reflecting distinct immune activation patterns as already stated [52,53,54,55,56,57].
From a clinical perspective, these findings highlight the importance of the temporal monitoring of cytokine profiles, particularly IL-2 and TNF-α, as potential prognostic tools during immunotherapy. The three-month IL-2 measurement emerges as the most informative single predictor of survival. It is important to note that the correlation analyses at the six-month time point were conducted on a reduced sample size (n = 14) due to missing data from two patients; nevertheless, significant associations for TNF-α persisted. Collectively, these results suggest that IL2—especially at three months—and TNF-α represent promising biomarker candidates for predicting the survival outcomes of patients undergoing immunotherapy, with higher levels indicative of a more favorable prognosis in our study. This is highly contradictory with the preclinical existing data [48], showing that TNF-α is associated with invasion, metastasis, and immune evasion [56,57,58].
The sustained elevation of multiple cytokine levels in the long-term survivors (>60 months) highlights the importance of durable immune activation, particularly the six-fold IL-2 level increase in the patients with patients. The lack of IL-10 prognostic value contrasts with some studies linking it to immunosuppression [38,59,60,61], though its extreme elevation in melanoma (885.5 pg/mL at 6 months) may indicate context-dependent roles.
The increased prognostic value of treatment-induced cytokine changes over the baseline levels emphasizes the need for dynamic biomarker monitoring, supporting emerging strategies for adaptive immunotherapy dosing. These findings mark the complexity of cytokine networks in immunotherapy response and the necessity for cancer-specific biomarker frameworks to optimize treatment personalization.

4.4. Correlation Between Immune Profiling and Inflammatory Cytokines

The longitudinal analysis of the nivolumab-treated patients highlights CD8+ T cell dynamics as a central feature, with the baseline percentages showing inverse correlations to TNF-α and IL-2, suggesting cytotoxic activity may temper early pro-inflammatory responses. This is consistent with other studies showing nivolumab increases CD8+ T cell proportions and modulates their cytokine expression and effector function, supporting the role of CD8+ T cells in immune regulation during checkpoint blockade therapy [5,62,63]. The temporal stability of CD8+ levels, as observed by the strong correlation between the baseline and 3 months, highlights their persistence as a marker of treatment response, a finding echoed in research demonstrating sustained CD8+ T cell enrichment with ongoing nivolumab therapy [64,65].
In contrast, the checkpoint receptor ratios (PD-1/CD95) and the CTLA-4+ T cells showed only weak or non-significant associations with cytokines, such as TNF-α and IL-10, challenging the hypothesis that these markers robustly reflect cytokine-driven activation or Treg-mediated regulation in this context [66,67]. These null findings are in line with other studies indicating that the predictive value of baseline checkpoint molecule expression for clinical outcomes is limited and often context-dependent, particularly in small cohorts [67,68].
These findings align with broader evidence linking baseline cytokine profiles (e.g., IL-10 and chemokine C-X-C motif ligand 6-CXCL6) to immunotherapy outcomes, while highlighting the complexity of translating correlative data into mechanistic insights without longitudinal functional assays [59,69].
Methodologically, the absence of multiple testing correction across more than 30 correlations increases the risk of false discoveries, highlighting the need for cautious interpretation and larger, functionally validated cohorts. However, the observed immune response calls attention to the need for time-stratified treatment approaches that address phase-specific biological bottlenecks in cancer immunotherapy.

5. Conclusions

Despite the success of immune checkpoint inhibitors (ICIs), resistance remains a major challenge. This study’s exploration of cytokine and immune cell ratios as prognostic markers and corroborated with overall survival is in line with ongoing efforts to identify robust biomarkers for immunotherapy response [70].
Despite the limited cohort size, distinct immunophenotypic and cytokine response patterns were observed between the tumor types, highlighting the importance of tumor-specific immune dynamics.
The key findings include the prognostic relevance of treatment-induced increases in IL-2 and TNF-α levels, particularly at three and six months post-initiation of therapy. Elevated IL-2 levels at three months emerged as the strongest predictor of overall survival, suggesting its potential role as an early biomarker for a favorable response. TNF-α also correlated positively with survival, contrary to its traditional association with tumor progression, indicating a context-dependent role in immunotherapy.
In contrast, the IL-10 level showed limited prognostic utility despite its dramatic elevation in the patients with melanoma. Similarly, the immune checkpoint receptor ratios (PD-1/CD95 and CD8/CTLA-4) exhibited inter-patient variability, but did not consistently correlate with survival or the cytokine patterns, emphasizing the need for further validation.
Future research should focus on validating these dynamic immune and cytokine biomarkers in larger cohorts, exploring combination therapies that target multiple checkpoints and cytokine pathways, and developing adaptive, time-stratified immunotherapy strategies guided by real-time biomarker monitoring. Further investigation into the dual roles of IL-10 and TNF-α will be essential for optimizing personalized immunotherapy and overcoming resistance in both NSCLC and melanoma.

Supplementary Materials

The following supporting information can be downloaded at: https://www.mdpi.com/article/10.3390/immuno5030029/s1, Table S1: All cytokines’ correlations.

Author Contributions

Conceptualization, A.M.G.-B. and O.S.; methodology, N.T.; writing—original draft preparation, A.M.G.-B., O.S., P.V., I.B., M.P.-S.; writing—review and editing, A.M.G.-B.; supervision, T.E.C. and C.A.C.; project administration, O.S.; funding acquisition, T.E.C. All authors have read and agreed to the published version of the manuscript.

Funding

This research was funded by the Executive Unit for Financing Higher Education, Research, Development and Innovation UEFISCDI; research grant “IDEI”, contract number 139/2017.

Institutional Review Board Statement

This study was conducted in accordance with the Declaration of Helsinki and approved by the Ethics Committee of the Oncology Institute “Prof. Dr. Ion Chiricuta” (approval no. 6623/20 June 2017).

Informed Consent Statement

Informed consent was obtained from all subjects involved in this study.

Data Availability Statement

The raw data supporting the conclusions of this article will be made available by the authors on request.

Conflicts of Interest

The authors declare no conflicts of interest.

References

  1. Zhang, B.; Liu, J.; Mo, Y.; Zhang, K.; Huang, B.; Shang, D. CD8+ T cell exhaustion and its regulatory mechanisms in the tumor microenvironment: Key to the success of immunotherapy. Front. Immunol. 2024, 15, 1476904. [Google Scholar] [CrossRef] [PubMed]
  2. Buchbinder, E.I.; Desai, A. CTLA-4 and PD-1 Pathways: Similarities, Differences, and Implications of Their Inhibition. Am. J. Clin. Oncol. 2016, 39, 98–106. [Google Scholar] [CrossRef] [PubMed]
  3. Lei, Q.; Wang, D.; Sun, K.; Wang, L.; Zhang, Y. Resistance Mechanisms of Anti-PD1/PDL1 Therapy in Solid Tumors. Front. Cell Dev. Biol. 2020, 8, 672. [Google Scholar] [CrossRef] [PubMed]
  4. Voss, K.; Larsen, S.E.; Snow, A.L. Metabolic reprogramming and apoptosis sensitivity: Defining the contours of a T cell response. Cancer Lett. 2017, 408, 190–196. [Google Scholar] [CrossRef] [PubMed]
  5. Raskov, H.; Orhan, A.; Christensen, J.P.; Gögenur, I. Cytotoxic CD8+ T cells in cancer and cancer immunotherapy. Br. J. Cancer 2021, 124, 359–367. [Google Scholar] [CrossRef] [PubMed]
  6. Dolina, J.S.; Van Braeckel-Budimir, N.; Thomas, G.D.; Salek-Ardakani, S. CD8+ T Cell Exhaustion in Cancer. Front. Immunol. 2021, 12, 715234. [Google Scholar] [CrossRef] [PubMed]
  7. Huang, M.; Wang, Y.; Fang, L.; Liu, C.; Feng, F.; Liu, L.; Sun, C. T cell senescence: A new perspective on immunotherapy in lung cancer. Front. Immunol. 2024, 15, 1338680. [Google Scholar] [CrossRef] [PubMed]
  8. Wu, B.; Zhang, B.; Li, B.; Wu, H.; Jiang, M. Cold and hot tumors: From molecular mechanisms to targeted therapy. Signal Transduct. Target. Ther. 2024, 9, 274. [Google Scholar] [CrossRef] [PubMed]
  9. Jiang, Y.; Li, Y.; Zhu, B. T-cell exhaustion in the tumor microenvironment. Cell Death Dis. 2015, 6, e1792. [Google Scholar] [CrossRef] [PubMed]
  10. Aksoylar, H.I.; Tijaro-Ovalle, N.M.; Boussiotis, V.A.; Patsoukis, N. T Cell Metabolism in Cancer Immunotherapy. Immunometabolism 2020, 2, e200020. Available online: https://journals.lww.com/10.20900/immunometab20200020 (accessed on 31 May 2025). [CrossRef] [PubMed]
  11. Gangaev, A.; Rozeman, E.A.; Rohaan, M.W.; Isaeva, O.I.; Philips, D.; Patiwael, S.; Berg, J.H.v.D.; Ribas, A.; Schadendorf, D.; Schilling, B.; et al. Differential effects of PD-1 and CTLA-4 blockade on the melanoma-reactive CD8 T cell response. Proc. Natl. Acad. Sci. USA 2021, 118, e2102849118. [Google Scholar] [CrossRef] [PubMed]
  12. Im, S.J.; Obeng, R.C.; Nasti, T.H.; McManus, D.; Kamphorst, A.O.; Gunisetty, S.; Prokhnevska, N.; Carlisle, J.W.; Yu, K.; Sica, G.L.; et al. Characteristics and anatomic location of PD-1+ TCF1+ stem-like CD8 T cells in chronic viral infection and cancer. Proc. Natl. Acad. Sci. USA 2023, 120, e2221985120. [Google Scholar] [CrossRef] [PubMed]
  13. Peter, M.E.; Hadji, A.; Murmann, A.E.; Brockway, S.; Putzbach, W.; Pattanayak, A.; Ceppi, P. The role of CD95 and CD95 ligand in cancer. Cell Death Differ. 2015, 22, 549–559. [Google Scholar] [CrossRef] [PubMed]
  14. Kartikasari, A.E.R.; Huertas, C.S.; Mitchell, A.; Plebanski, M. Tumor-Induced Inflammatory Cytokines and the Emerging Diagnostic Devices for Cancer Detection and Prognosis. Front. Oncol. 2021, 11, 692142. [Google Scholar] [CrossRef] [PubMed]
  15. Cunha, L.L.; Morari, E.C.; Nonogaki, S.; Marcello, M.A.; Soares, F.A.; Vassallo, J.; Ward, L.S. Interleukin 10 expression is related to aggressiveness and poor prognosis of patients with thyroid cancer. Cancer Immunol. Immunother. 2017, 66, 141–148. [Google Scholar] [CrossRef] [PubMed]
  16. Yi, M.; Li, T.; Niu, M.; Zhang, H.; Wu, Y.; Wu, K.; Dai, Z. Targeting cytokine and chemokine signaling pathways for cancer therapy. Signal Transduct. Target. Ther. 2024, 9, 176. [Google Scholar] [CrossRef] [PubMed]
  17. Ren, Z.; Zhang, A.; Sun, Z.; Liang, Y.; Ye, J.; Qiao, J.; Li, B.; Fu, Y.-X. Selective delivery of low-affinity IL-2 to PD-1+ T cells rejuvenates antitumor immunity with reduced toxicity. J. Clin. Investig. 2022, 132, e153604. [Google Scholar] [CrossRef] [PubMed]
  18. Wang, J.; Wang, Z.; Tan, T. Association of CTLA-4, TNF alpha and IL 10 polymorphisms with susceptibility to hepatocellular carcinoma. Scand. J. Immunol. 2019, 90, e12819. [Google Scholar] [CrossRef] [PubMed]
  19. Rosner, B. Fundamentals of Biostatistics, 8th ed.; Cengage Learning: Boston, MA, USA, 2016. [Google Scholar]
  20. Zhang, D.; Zhao, J.; Zhang, Y.; Jiang, H.; Liu, D. Revisiting immune checkpoint inhibitors: New strategies to enhance efficacy and reduce toxicity. Front. Immunol. 2024, 15, 1490129. [Google Scholar] [CrossRef] [PubMed]
  21. Nagasaki, J.; Ishino, T.; Togashi, Y. Mechanisms of resistance to immune checkpoint inhibitors. Cancer Sci. 2022, 113, 3303–3312. [Google Scholar] [CrossRef] [PubMed]
  22. Li, Y.; Chen, T.; Nie, T.Y.; Han, J.; He, Y.; Tang, X.; Zhang, L. Hyperprogressive disease in non-small cell lung cancer after PD-1/PD-L1 inhibitors immunotherapy: Underlying killer. Front. Immunol. 2023, 14, 1200875. [Google Scholar] [CrossRef] [PubMed]
  23. Kim, C.G.; Kim, K.H.; Pyo, K.H.; Xin, C.F.; Hong, M.H.; Ahn, B.C.; Kim, Y.; Choi, S.J.; Yoon, H.I.; Lee, J.G. Hyperprogressive disease during PD-1/PD-L1 blockade in patients with non-small-cell lung cancer. Ann. Oncol. 2019, 30, 1104–1113. [Google Scholar] [CrossRef] [PubMed]
  24. Zhao, H.; Huang, S.; Wu, J.; Lu, Y.; Zou, Y.; Zeng, H.; Li, C.; Wang, J.; Zhang, X.; Duan, S. Efficacy and safety of first-line PD-1/PD-L1 inhibitor in combination with CTLA-4 inhibitor in the treatment of patients with advanced non-small cell lung cancer: A systemic review and meta-analysis. Front. Immunol. 2025, 16, 1515027. [Google Scholar] [CrossRef] [PubMed]
  25. Paulsen, M.; Janssen, O. Pro- and anti-apoptotic CD95 signaling in T cells. Cell Commun. Signal. 2011, 9, 7. [Google Scholar] [CrossRef] [PubMed]
  26. Risso, V.; Lafont, E.; Le Gallo, M. Therapeutic approaches targeting CD95L/CD95 signaling in cancer and autoimmune diseases. Cell Death Dis. 2022, 13, 248. [Google Scholar] [CrossRef] [PubMed]
  27. Li, L.; Lu, G.; Liu, Y.; Gong, L.; Zheng, X.; Zheng, H.; Gu, W.; Yang, L. Low Infiltration of CD8+ PD-L1+ T Cells and M2 Macrophages Predicts Improved Clinical Outcomes After Immune Checkpoint Inhibitor Therapy in Non-Small Cell Lung Carcinoma. Front. Oncol. 2021, 11, 658690. [Google Scholar] [CrossRef] [PubMed]
  28. Bai, Z.; Cheng, X.; Ma, T.; Li, G.; Wang, X.; Wang, Z.; Yi, L.; Liu, Z. CD8+ T cells infiltrating into tumors were controlled by immune status of pulmonary lymph nodes and correlated with non-small cell lung cancer (NSCLC) patients’ prognosis treated with chemoimmunotherapy. Lung Cancer 2024, 197, 107991. [Google Scholar] [CrossRef] [PubMed]
  29. Li, F.; Li, C.; Cai, X.; Xie, Z.; Zhou, L.; Cheng, B.; Zhong, R.; Xiong, S.; Li, J.; Chen, Z.; et al. The association between CD8+ tumor-infiltrating lymphocytes and the clinical outcome of cancer immunotherapy: A systematic review and meta-analysis. eClinicalMedicine 2021, 41, 101134. [Google Scholar] [CrossRef] [PubMed]
  30. Tumeh, P.C.; Harview, C.L.; Yearley, J.H.; Shintaku, I.P.; Taylor, E.J.M.; Robert, L.; Chmielowski, B.; Spasic, M.; Henry, G.; Ciobanu, V. PD-1 blockade induces responses by inhibiting adaptive immune resistance. Nature 2014, 515, 568–571. [Google Scholar] [CrossRef] [PubMed]
  31. Topalian, S.L.; Hodi, F.S.; Brahmer, J.R.; Gettinger, S.N.; Smith, D.C.; McDermott, D.F.; Powderly, J.D.; Carvajal, R.D.; Sosman, J.A.; Atkins, M.B. Safety, Activity, and Immune Correlates of Anti–PD-1 Antibody in Cancer. N. Engl. J. Med. 2012, 366, 2443–2454. [Google Scholar] [CrossRef] [PubMed]
  32. Karlsson, A.; Saleh, S. Checkpoint inhibitors for malignant melanoma: A systematic review and meta-analysis. Clin. Cosmet. Investig. Dermatol. 2017, 10, 325–339. [Google Scholar] [CrossRef] [PubMed]
  33. Peter, M.E.; Budd, R.C.; Desbarats, J.; Hedrick, S.M.; Hueber, A.O.; Newell, M.K.; Owen, L.B.; Pope, R.M.; Tschopp, J.; Wajant, H. The CD95 Receptor: Apoptosis Revisited. Cell 2007, 129, 447–450. [Google Scholar] [CrossRef] [PubMed]
  34. Hossen, M.M.; Ma, Y.; Yin, Z.; Xia, Y.; Du, J.; Huang, J.Y.; Huang, J.J.; Zou, L.; Ye, Z.; Huang, Z. Current understanding of CTLA-4: From mechanism to autoimmune diseases. Front. Immunol. 2023, 14, 1198365. [Google Scholar] [CrossRef] [PubMed]
  35. Gramantieri, L.; Montagner, A.; Arleo, A.; Suzzi, F.; Bassi, C.; Tovoli, F.; Bruccoleri, M.; Alimenti, E.; Fornari, F.; Iavarone, M.; et al. Early CTLA4 increase in CD45+ blood cells: An emerging biomarker of atezolizumab–bevacizumab resistance and worse survival in advanced hepatocarcinoma. ESMO Open 2025, 10, 104289. [Google Scholar] [CrossRef] [PubMed]
  36. Ascierto, M.L.; Makohon-Moore, A.; Lipson, E.J.; Taube, J.M.; McMiller, T.L.; Berger, A.E.; Fan, J.; Kaunitz, G.J.; Cottrell, T.R.; Kohutek, Z.A.; et al. Transcriptional Mechanisms of Resistance to Anti–PD-1 Therapy. Clin. Cancer Res. 2017, 23, 3168–3180. [Google Scholar] [CrossRef] [PubMed]
  37. Chai, Q.Q.; Du, J.Y.; Zhu, J.; Wu, B. The Differences in the Safety and Tolerability of Immune Checkpoint Inhibitors as Treatment for Non–Small Cell Lung Cancer and Melanoma: Network Meta-Analysis and Systematic Review. Front. Pharmacol. 2019, 10, 1260. [Google Scholar] [CrossRef] [PubMed]
  38. Chen, Y.M. First-line combination immunotherapy for metastatic non-small cell lung cancer. J. Chin. Med. Assoc. 2020, 83, 433–441. [Google Scholar] [CrossRef] [PubMed]
  39. Sundar, R.; Cho, B.C.; Brahmer, J.R.; Soo, R.A. Nivolumab in NSCLC: Latest evidence and clinical potential. Ther. Adv. Med. Oncol. 2015, 7, 85–96. [Google Scholar] [CrossRef] [PubMed]
  40. Niyongere, S.; Saltos, A.; Gray, J.E. Immunotherapy combination strategies (non-chemotherapy) in non-small cell lung cancer. J. Thorac. Dis. 2018, 10, S433–S450. [Google Scholar] [CrossRef] [PubMed]
  41. Datar, I.; Sanmamed, M.F.; Wang, J.; Henick, B.S.; Choi, J.; Badri, T.; Dong, W.; Mani, N.; Toki, M.; Mejías, L.D. Expression Analysis and Significance of PD-1, LAG-3, and TIM-3 in Human Non–Small Cell Lung Cancer Using Spatially Resolved and Multiparametric Single-Cell Analysis. Clin. Cancer Res. 2019, 25, 4663–4673. [Google Scholar] [CrossRef] [PubMed]
  42. Figueiredo, A.B.; Barros, E.; Silva, M.J.; Evangelista, G.F.D.B.; Galdino, N.A.D.L.; Kuil, L.D.M.; Santos, I.P.; Morais, K.L.P.; Cavalcanti, C.M.; Moredo, L.F.; et al. Immune mechanisms and predictive biomarkers related to neoadjuvant immunotherapy response in stage III melanoma. Heliyon 2024, 10, e32624. [Google Scholar] [CrossRef] [PubMed]
  43. Chow, A.; Perica, K.; Klebanoff, C.A.; Wolchok, J.D. Clinical implications of T cell exhaustion for cancer immunotherapy. Nat. Rev. Clin. Oncol. 2022, 19, 775–790. [Google Scholar] [CrossRef] [PubMed]
  44. Jacquelot, N.; Roberti, M.P.; Enot, D.P.; Rusakiewicz, S.; Ternès, N.; Jegou, S.; Woods, D.M.; Sodré, A.L.; Hansen, M.; Meirow, Y.; et al. Predictors of responses to immune checkpoint blockade in advanced melanoma. Nat. Commun. 2017, 8, 592. [Google Scholar] [CrossRef] [PubMed]
  45. Dyck, L.; Mills, K.H.G. Immune checkpoints and their inhibition in cancer and infectious diseases. Eur. J. Immunol. 2017, 47, 765–779. [Google Scholar] [CrossRef] [PubMed]
  46. Wei, S.C.; Levine, J.H.; Cogdill, A.P.; Zhao, Y.; Anang, N.A.A.S.; Andrews, M.C.; Sharma, P.; Wang, J.; Wargo, J.A.; Pe’Er, D.; et al. Distinct Cellular Mechanisms Underlie Anti-CTLA-4 and Anti-PD-1 Checkpoint Blockade. Cell 2017, 170, 1120–1133.e17. [Google Scholar] [CrossRef] [PubMed]
  47. Pardoll, D.M. The blockade of immune checkpoints in cancer immunotherapy. Nat. Rev. Cancer 2012, 12, 252–264. [Google Scholar] [CrossRef] [PubMed]
  48. Landskron, G.; De La Fuente, M.; Thuwajit, P.; Thuwajit, C.; Hermoso, M.A. Chronic Inflammation and Cytokines in the Tumor Microenvironment. J. Immunol. Res. 2014, 2014, 149185. [Google Scholar] [CrossRef] [PubMed]
  49. Ramachandran, S.; Verma, A.K.; Dev, K.; Goyal, Y.; Bhatt, D.; Alsahli, M.A.; Rahmani, A.H.; Almatroudi, A.; Almatroodi, S.A.; Alrumaihi, F.; et al. Role of Cytokines and Chemokines in NSCLC Immune Navigation and Proliferation. Oxid. Med. Cell Longev. 2021, 2021, 5563746. [Google Scholar] [CrossRef] [PubMed]
  50. Wang, H.; Zhou, F.; Zhao, C.; Cheng, L.; Zhou, C.; Qiao, M.; Li, X.; Chen, X. Interleukin-10 Is a Promising Marker for Immune-Related Adverse Events in Patients With Non-Small Cell Lung Cancer Receiving Immunotherapy. Front. Immunol. 2022, 13, 840313. [Google Scholar] [CrossRef] [PubMed]
  51. Kucera, R.; Topolcan, O.; Treskova, I.; Kinkorova, J.; Windrichova, J.; Fuchsova, R.; Svobodova, S.; Treska, V.; Babuska, V.; Novak, J.; et al. Evaluation of IL-2, IL-6, IL-8 and IL-10 in Malignant Melanoma Diagnostics. Anticancer Res. 2015, 35, 3537–3541. [Google Scholar] [PubMed]
  52. Anichini, A.; Tassi, E.; Grazia, G.; Mortarini, R. The non-small cell lung cancer immune landscape: Emerging complexity, prognostic relevance and prospective significance in the context of immunotherapy. Cancer Immunol. Immunother. 2018, 67, 1011–1022. [Google Scholar] [CrossRef] [PubMed]
  53. Lauss, M.; Phung, B.; Borch, T.H.; Harbst, K.; Kaminska, K.; Ebbesson, A.; Hedenfalk, I.; Yuan, J.; Nielsen, K.; Ingvar, C.; et al. Molecular patterns of resistance to immune checkpoint blockade in melanoma. Nat. Commun. 2024, 15, 3075. [Google Scholar] [CrossRef] [PubMed]
  54. Cuevas, E.S.; Mouret, S.; Vayssière, G.; Kerboua, S.; Girard, P.; Molens, J.P.; Manceau, M.; Charles, J.; Saas, P.; Aspord, C.; et al. Circulating immune landscape in melanoma patients undergoing anti-PD1 therapy reveals key immune features according to clinical response to treatment. Front. Immunol. 2024, 15, 1507938. [Google Scholar] [CrossRef] [PubMed]
  55. Carbone, D.P.; Gandara, D.R.; Antonia, S.J.; Zielinski, C.; Paz-Ares, L. Non–Small-Cell Lung Cancer: Role of the Immune System and Potential for Immunotherapy. J. Thorac. Oncol. 2015, 10, 974–984. [Google Scholar] [CrossRef] [PubMed]
  56. Montfort, A.; Colacios, C.; Levade, T.; Andrieu-Abadie, N.; Meyer, N.; Ségui, B. The TNF Paradox in Cancer Progression and Immunotherapy. Front. Immunol. 2019, 10, 1818. [Google Scholar] [CrossRef] [PubMed]
  57. Bertrand, F.; Montfort, A.; Marcheteau, E.; Imbert, C.; Gilhodes, J.; Filleron, T.; Rochaix, P.; Andrieu-Abadie, N.; Levade, T.; Meyer, N.; et al. TNFα blockade overcomes resistance to anti-PD-1 in experimental melanoma. Nat. Commun. 2017, 8, 2256. [Google Scholar] [CrossRef] [PubMed]
  58. Gong, K.; Guo, G.; Beckley, N.; Zhang, Y.; Yang, X.; Sharma, M.; Habib, A.A. Tumor necrosis factor in lung cancer: Complex roles in biology and resistance to treatment. Neoplasia 2021, 23, 189–196. [Google Scholar] [CrossRef] [PubMed]
  59. Salkeni, M.A.; Naing, A. Interleukin-10 in cancer immunotherapy: From bench to bedside. Trends Cancer. 2023, 9, 716–725. [Google Scholar] [CrossRef] [PubMed]
  60. Somasundaram, R.; Herlyn, M.; Wagner, S.N. The Role of Tumor Microenvironment in Melanoma Therapy Resistance. Melanoma Manag. 2016, 3, 23–32. [Google Scholar] [CrossRef] [PubMed]
  61. Carlini, V.; Noonan, D.M.; Abdalalem, E.; Goletti, D.; Sansone, C.; Calabrone, L.; Albini, A. The multifaceted nature of IL-10: Regulation, role in immunological homeostasis and its relevance to cancer, COVID-19 and post-COVID conditions. Front. Immunol. 2023, 14, 1161067. [Google Scholar] [CrossRef] [PubMed]
  62. Yin, Y.; Sakakibara, R.; Honda, T.; Kirimura, S.; Daroonpan, P.; Kobayashi, M.; Ando, K.; Ujiie, H.; Kato, T.; Kaga, K.; et al. High density and proximity of CD8+ T cells to tumor cells are correlated with better response to nivolumab treatment in metastatic pleural mesothelioma. Thorac. Cancer. 2023, 14, 1991–2000. [Google Scholar] [CrossRef] [PubMed]
  63. Xiong, Y.; Neskey, D.M.; Horton, J.D.; Paulos, C.M.; Knochelmann, H.M.; Armeson, K.E.; Young, M.R.I. Immunological effects of nivolumab immunotherapy in patients with oral cavity squamous cell carcinoma. BMC Cancer. 2020, 20, 229. [Google Scholar] [CrossRef] [PubMed]
  64. Yuan, Y.; Zhu, Z.; Lan, Y.; Duan, S.; Zhu, Z.; Zhang, X.; Li, G.; Qu, H.; Feng, Y.; Cai, H.; et al. Development and Validation of a CD8+ T Cell Infiltration-Related Signature for Melanoma Patients. Front. Immunol. 2021, 12, 659444. [Google Scholar] [CrossRef] [PubMed]
  65. Singla, N.; Nirschl, T.R.; Obradovic, A.Z.; Shenderov, E.; Lombardo, K.; Liu, X.; Pons, A.; Zarif, J.C.; Rowe, S.P.; Trock, B.J.; et al. Immunomodulatory response to neoadjuvant nivolumab in non-metastatic clear cell renal cell carcinoma. Sci. Rep. 2024, 14, 1458. [Google Scholar] [CrossRef] [PubMed]
  66. Hou, Y.; Li, X.; Yang, Y.; Shi, H.; Wang, S.; Gao, M. Serum cytokines and neutrophil-to-lymphocyte ratio as predictive biomarkers of benefit from PD-1 inhibitors in gastric cancer. Front. Immunol. 2023, 14, 1274431. [Google Scholar] [CrossRef] [PubMed]
  67. Ottonello, S.; Genova, C.; Cossu, I.; Fontana, V.; Rijavec, E.; Rossi, G.; Biello, F.; Bello, M.G.D.; Tagliamento, M.; Alama, A.; et al. Association Between Response to Nivolumab Treatment and Peripheral Blood Lymphocyte Subsets in Patients With Non-small Cell Lung Cancer. Front. Immunol. 2020, 11, 125. [Google Scholar] [CrossRef] [PubMed]
  68. Chen, C.; Li, Y. Predictive value of co-expression patterns of immune checkpoint molecules for clinical outcomes of hematological malignancies. Chin. J. Cancer Res. 2023, 35, 245–251. [Google Scholar] [CrossRef] [PubMed]
  69. Chen, J.; Tarantino, G.; Severgnini, M.; Baginska, J.; Giobbie-Hurder, A.; Weirather, J.L.; Manos, M.; Russell, J.D.; Pfaff, K.L.; Rodig, S.J.; et al. Circulating cytokine associations with clinical outcomes in melanoma patients treated with combination nivolumab plus ipilimumab. OncoImmunology 2025, 14, 2432723. [Google Scholar] [CrossRef] [PubMed]
  70. Gérard, A.; Doyen, J.; Cremoni, M.; Bailly, L.; Zorzi, K.; Ruetsch-Chelli, C.; Brglez, V.; Picard-Gauci, A.; Troin, L.; Esnault, V.L.; et al. Baseline and early functional immune response is associated with subsequent clinical outcomes of PD-1 inhibition therapy in metastatic melanoma patients. J. Immunother. Cancer. 2021, 9, e002512. [Google Scholar] [CrossRef] [PubMed]
Figure 1. Timeline trends of serum cytokine levels (TNF-α, IL-2, and IL-10) in NSCLC cohort. Cytokine concentrations (x-axis) are shown at baseline, 3 months, and 6 months after anti-PD-1 start date. y-axis delineates cytokine levels ranging from 0 to 500 expressed in pg/mL. Box plots display median values with interquartile ranges; whiskers denote range. Left-sided boxplots represent TNF-α levels, which show slight increase over time. Central and right-sided boxplots represent IL-2 and IL-10 levels, respectively, both of which remain low and exhibit minimal change throughout study period. Numbers 1, 5, and 9 indicate individual patients identified as statistical outliers.
Immuno 05 00029 g001
Figure 2. Timeline trends of serum cytokine levels (TNF-α, IL-2, and IL-10) in patients with melanoma. Cytokine concentrations (x-axis) are displayed at baseline, 3 months, and 6 months after anti-PD-1 start date. Each set of box plots shows distribution per cytokine. Median values with interquartile ranges are plotted; error bars represent full range. First three box plots depict TNF-α levels with increase from baseline to 6 months. Next three boxplots illustrate IL-2 levels, which remain low and stable over timeline. Final three boxplots show IL-10 levels, which are elevated at 3 months and decrease at 6 months. Outlier values are indicated by circles and asterisks above respective boxplots.
Immuno 05 00029 g002
Figure 3. Mean serum TNF-α levels (pg/mL) in patients with melanoma and NSCLC over time. Mean TNF-α levels (pg/mL) at baseline, 3 months, and 6 months are shown for melanoma (red) and NSCLC (blue) cohorts. Patients with melanoma exhibited higher baseline TNF-α, with levels increasing at 3 months and remaining elevated at 6 months. Patients with NSCLC showed progressive increase over time. Data are expressed as mean ± standard error of mean (SEM). Statistical comparisons of temporal changes within each cancer cohort were performed using repeated measures ANOVA. Error bars represent standard error of mean.
Immuno 05 00029 g003
Figure 4. Mean serum IL-2 concentrations (pg/mL) in patients with NSCLC and melanoma during treatment. Mean serum IL-2 concentrations (±SEM) at baseline, 3 months, and 6 months are shown for patients with NSCLC (blue) and melanoma (red). Patients with melanoma exhibited marked increase in IL-2 level over time, while NSCLC levels remained stable. Values are shown as mean ± SEM, CI 95%. Data derived from ELISA analysis of serum samples. Repeated measures ANOVA was conducted to assess changes in IL-2 levels over time within each cohort.
Immuno 05 00029 g004
Figure 5. Longitudinal IL-10 serum concentrations (pg/mL) in patients with melanoma and NSCLC. Patients with melanoma exhibited markedly higher baseline IL-10 concentrations than patients with NSCLC, with IL-10 levels rising sharply at 3 and 6 months in melanoma, but only modestly in NSCLC. Serum IL-10 levels (pg/mL) are presented as mean ± SEM at baseline, 3 months, and 6 months post-nivolumab treatment. Data represent mean values derived from ELISA analysis. Repeated measures ANOVA was used to evaluate the significance of changes in IL-10 levels over time.
Immuno 05 00029 g005
Table 1. Patient characteristics in both cohorts.
CharacteristicMedian (Min–Max)Additional Details
Age at study entry (years)57 (30–77)
Sex50% male, 50% female8 males, 8 females
Cancer type56% NSCLC, 44% melanoma9 NSCLC, 7 melanoma
Smokers62.5%7 NSCLC, 3 melanoma
Nivolumab cycles20 (8–114)
Metastatic line setting of nivolumab2 (1–4)
Subsequent treatments7/16 (44%) had none Most common: Docetaxel (3); others: Gemcitabine, Carboplatin+VP16, Navelbine, Ipilimumab, Dacarbazine+Adriamycine, Dabrafenib+Trametinib
Overall survival (months)22.7 (6.1–87.4)
Table 2. Immunophenotypic characterization of peripheral blood lymphocytes in cohort of patients with non-small-cell lung cancer (NSCLC) undergoing nivolumab therapy. For each patient, immunophenotyping was performed at three time points: baseline (timeline 0), after more than 3 months (timeline 1), and after more than 6 months (timeline 2) from initiation of anti-PD-1 treatment. Table reports percentage expression of PD-1, CD95, CD8, and CTLA-4 on lymphocyte populations, as well as co-expression ratios PD-1/CD95 and CD8/CTLA-4. These immunological parameters are presented as percentages, reflecting the proportion of positive cells within analyzed population at each time point.
No of TestsPatientType of cancerTimelinePD1(%)CD95(%)CD8 (%)CTLA-4 (%)PD1/CD95 (%)CD8/CTLA4 (%)
1 NSCLC00.847.237.30.541
21 10.257.943.40.26.30.4
3 2145.937.20.13.10.7
4 NSCLC0148.418.20.46.20.6
52 10.451.32217.21.2
6 25.320.121.81.46.51.4
7 NSCLC0236.127.50.312.30.3
83 10.846.528.40.590.3
9 274.74.426.717.74.19
10 NSCLC03.821.530.60.23.20.2
114 12.242.138.10.18.60.1
12 21.45.643.203.60.5
13 NSCLC01.443.728.21.22.61.4
145 10.555.744.20.11.10.3
15 20.650.2400.22.10.2
16 NSCLC01.528.822.50.12.70.2
176 11.82625.10.31.50.3
18 20.828.419.20.21.30.1
19 NSCLC01.152.635.30.13.30.5
207 10.457.542.80.21.10.2
21 20.258.833.80.40.70.4
22 NSCLC00.163.133.10.31.10.1
238 10.359.440.90.30.90.6
24 20.46543.60.13.60.1
25 NSCLC00.939.5210.16.70.2
269 10.453.521.50.21.10.4
27 21.340.421.60.26.20.2
Table 3. Longitudinal immunophenotyping analysis of patients with melanoma receiving nivolumab. Data represent flow cytometric analysis of immune cell surface markers in seven patients with melanoma at three sequential time points: baseline (timeline 0), >3 months post-treatment initiation (timeline 1), and >6 months post-treatment initiation (timeline 2). Individual marker expression is reported as percentage of positive cells for programmed cell death protein 1 (PD-1), cluster of differentiation 95 (CD95), CD8, and cytotoxic T-lymphocyte-associated protein 4 (CTLA-4). Co-expression ratios are calculated as PD-1/CD95 and CD8/CTLA-4 to assess immune activation states and T cell exhaustion profiles throughout course of anti-PD-1 immunotherapy. Each row represents individual measurement time point, with patients tracked longitudinally to evaluate temporal changes in immune cell phenotypes during nivolumab treatment.
No of TestsPatient Type of CancerTimelinePD1(%)CD95(%)CD8 (%)CTLA-4 (%)PD1/CD95 (%)CD8/CTLA4(%)
1 05.129.819.91.1190.6
21melanoma12.737.821.20.411.50.4
3 24.234.2160.416.90.4
4 03.528.619.50.516.90.6
52melanoma14.628.521.90.511.10.4
6 23.233.524.90.4110.6
73melanoma05.430.8230.415.40.5
812.632.4290.49.90.5
9 0229.420.80.611.20.3
104melanoma11.234.927.60.38.20.4
11 23.930.123.20.712.31.4
12 01.625.923.80.17.20.2
135melanoma12.332.926.20.32.70.6
14 23.12923.70.490.4
15 04.329.435.70.418.32.7
166melanoma13.531.629.70.713.92
17 22.935.838.80.211.50.7
187melanoma02.122.923.30.2130.3
1911.628.320.10.211.40.4
Table 4. Spearman correlation analysis of IL-2 levels and survival in both cohorts. Three-month IL-2 levels showed strong positive correlation with survival (ρ = 0.756, p < 0.001), while baseline IL-2 also correlated positively (ρ = 0.674, p = 0.004), highlighted in blue. ** signifies that the correlation is significant at the 0.01 level (2-tailed). * signifies that the correlation is significant at the 0.05 level (2-tailed).
IL2Baseline-IL2 (pg/mL)3 Months-IL26 Months-IL2Survival in Months
Spearman’s rhoBaseline-TNFα pg/mLCorrelation Coefficient0.891 **0.879 **0.4910.553 *
Sig. (2-tailed)<0.001<0.0010.0740.026
Baseline-IL2 (pg/mL)Correlation Coefficient1.0000.902 **0.4210.692 **
Sig. (2-tailed)0.0<0.0010.1340.003
Baseline-IL10 (pg/mL)Correlation Coefficient0.0770.3740.1470.376
Sig. (2-tailed)0.7780.1540.6150.151
3 months-TNFαCorrelation Coefficient0.876 **0.915 **0.4440.650 **
Sig. (2-tailed)<0.001<0.0010.1110.006
3 months-IL2Correlation Coefficient0.902 **1.0000.4180.762 **
Sig. (2-tailed)<0.0010.00.137<0.001
3 months-IL10Correlation Coefficient0.1690.3370.4160.295
Sig. (2-tailed)0.5300.2010.1390.268
6 months-TNFαCorrelation Coefficient0.713 **0.842 **0.4880.670 **
Sig. (2-tailed)0.004<0.0010.0760.009
6 months-IL2Correlation Coefficient0.4210.4181.0000.356
Sig. (2-tailed)0.1340.1370.00.211
6 months-IL10Correlation Coefficient0.1500.2950.3610.064
Sig. (2-tailed)0.6090.3060.2040.828
Survival in monthsCorrelation Coefficient0.692 **0.762 **0.3561.000
Sig. (2-tailed)0.003<0.0010.2110.0
Table 5. Spearman correlation analysis of TNF-α levels and survival in both cohorts. All three time points of TNF-α levels showed positive correlation with survival, especially at 6 months (ρ = 0.670, p = 0.009), highlighted in blue. ** signifies that the correlation is significant at the 0.01 level (2-tailed). * signifies that the correlation is significant at the 0.05 level (2-tailed).
TNF-αBaseline-TNFα pg/mL3 Months-TNFα6 Months-TNFαSurvival in Months
Spearman’s rhoBaseline-TNFα pg/mLCorrelation Coefficient1.0000.937 **0.880 **0.553 *
Sig. (2-tailed)0.0<0.001<0.0010.026
Baseline-IL2 (pg/mL)Correlation Coefficient0.891 **0.876 **0.713 **0.692 **
Sig. (2-tailed)<0.001<0.0010.0040.003
Baseline-IL10 (pg/mL)Correlation Coefficient0.2860.4290.3800.376
Sig. (2-tailed)0.2840.0970.1800.151
3 months-TNFαCorrelation Coefficient0.937 **1.0000.855 **0.650 **
Sig. (2-tailed)<0.0010.0<0.0010.006
3 months-IL2Correlation Coefficient0.879 **0.915 **0.842 **0.762 **
Sig. (2-tailed)<0.001<0.001<0.001<0.001
3 months-IL10Correlation Coefficient0.3380.4090.3920.295
Sig. (2-tailed)0.2010.1150.1660.268
6 months-TNFαCorrelation Coefficient0.880 **0.855 **1.0000.670 **
Sig. (2-tailed)<0.001<0.0010.00.009
6 months-IL2Correlation Coefficient0.4910.4440.4880.356
Sig. (2-tailed)0.0740.1110.0760.211
6 months-IL10Correlation Coefficient0.3170.3100.4820.064
Sig. (2-tailed)0.2690.2800.0810.828
Survival in monthsCorrelation Coefficient0.553 *0.650 **0.670 **1.000
Sig. (2-tailed)0.0260.0060.0090.0
Table 6. Spearman correlation analysis of IL-10 levels and survival in both cohorts. IL-10 levels showed no significant association with survival at any time point (correlation coefficients: 0.064–0.359; all p-values > 0.05), highlighted in blue. ** signifies that the correlation is significant at the 0.01 level (2-tailed). * signifies that the correlation is significant at the 0.05 level (2-tailed).
IL10Baseline-IL10 (pg/mL)3 Months-IL106 Months-IL10Survival in Months
Spearman’s rhoBaseline-TNFα pg/mLCorrelation Coefficient0.2860.3380.3170.553 *
Sig. (2-tailed)0.2840.2010.2690.026
Baseline-IL2 (pg/mL)Correlation Coefficient0.0770.1690.1500.692 **
Sig. (2-tailed)0.7780.5300.6090.003
Baseline-IL10 (pg/mL)Correlation Coefficient1.0000.769 **0.623 *0.376
Sig. (2-tailed)0.0<0.0010.0170.151
3 months-TNFαCorrelation Coefficient0.4290.4090.3100.650 **
Sig. (2-tailed)0.0970.1150.2800.006
3 months-IL2Correlation Coefficient0.3740.3370.2950.762 **
Sig. (2-tailed)0.1540.2010.306<0.001
3 months-IL10Correlation Coefficient0.769 **1.0000.894 **0.295
Sig. (2-tailed)<0.0010.0<0.0010.268
6 months-TNFαCorrelation Coefficient0.3800.3920.4820.670 **
Sig. (2-tailed)0.1800.1660.0810.009
6 months-IL2Correlation Coefficient0.1470.4160.3610.356
Sig. (2-tailed)0.6150.1390.2040.211
6 months-IL10Correlation Coefficient0.623 *0.894 **1.0000.064
Sig. (2-tailed)0.017<0.0010.00.828
Survival in monthsCorrelation Coefficient0.3760.2950.0641.000
Sig. (2-tailed)0.1510.2680.8280.0
Disclaimer/Publisher’s Note: The statements, opinions and data contained in all publications are solely those of the individual author(s) and contributor(s) and not of MDPI and/or the editor(s). MDPI and/or the editor(s) disclaim responsibility for any injury to people or property resulting from any ideas, methods, instructions or products referred to in the content.

