Article

Anxiety Disorder: Measuring the Impact on Major Depressive Disorder

1
Diagnostic and Neurosignal Processing Research Laboratory, Biomedical Engineering Program, University of Manitoba, Riverview Health Centre, Winnipeg, MB R3T 5V6, Canada
2
Monash Alfred Psychiatry Research Centre, Melbourne, VIC 3004, Australia
*
Author to whom correspondence should be addressed.
Psychiatry Int. 2025, 6(3), 94; https://doi.org/10.3390/psychiatryint6030094 (registering DOI)
Submission received: 29 May 2025 / Revised: 5 July 2025 / Accepted: 1 August 2025 / Published: 5 August 2025

Abstract

Background: About half of all Major Depressive Disorder (MDD) patients have anxiety disorder. There is a neurologic basis for the comorbidity of balance (vestibular) disorders and anxiety. To detect comorbid anxiety disorder in MDD patients and, importantly, to investigate its relationship with depressive severity, we use Electrovestibulography (EVestG), which is predominantly a measure of vestibular response. Methods: In a population of 42 (26 with anxiety disorder) MDD patients, EVestG signals were measured. Fourteen (eight with anxiety disorder) were not on any anti-depressants, anti-psychotics or mood stabilizers. Using standard questionnaires, participants were depression-wise labelled as reduced symptomatic (MADRS ≤ 19, R) or symptomatic (MADRS > 19, S) as well as with or without anxiety disorder. Analyses were conducted on the whole data set, matched (age/gender/MADRS) subsets and compared with medication free subsets. Low-frequency EVestG firing pattern modulation was measured. Results: The main differences between MDD populations with and without anxiety disorder populations, regardless of being medicated or not, were (1) the presence of an increased 10.8 Hz component in the dynamic movement phase recordings, (2) the presence of asymmetric right versus left 7.6–8.9 Hz and 12.1–13.8 Hz frequency bands in the no motion (static) phase recordings, and (3) these differences were dependent on depressive severity. Conclusions: The EVestG measures are capable of quantifying anxiety in MDD patients. These measures are functions of depressive severity and are hypothesized to be linked to Hippocampal Theta (~4–12 Hz).

1. Introduction

Anxiety disorder is present in about half of all Major Depressive Disorder (MDD) patients [1]. There is a neurologic basis for the comorbidity of balance (vestibular) disorders and anxiety [2]. In a recent study of the depressive phase of a Bipolar Disorder (BD) population, using the Electrovestibulography (EVestG) firing pattern change measure, the presence of anxiety disorder was observed as an increase in spectral energy proximal to 8–9 Hz, which was partially suppressed by Mood Stabilizers [3]. Hippocampal theta (4–13 Hz) has been linked to anxiety as both an EEG [4] and a vestibuloacoustic biomarker [5]. EVestG, a vestibuloacoustic measure, detects spontaneous and evoked mini field potentials (FPs), believed to be originating from vestibuloacoustic afferent activity, and analyzes changes in their average waveform and firing patterns as potential biomarkers for diagnosis, severity assessment and evaluation of treatment efficacy [6,7,8]. More particularly, EVestG [9,10] has been applied to quantitatively detect, separate and monitor major depression and bipolar disorders [6,7,8]. Those early studies concluded some depression features might have been influenced by anxiety.
The general limitations of clinical interviews related to anxiety assessment include subjectivity and bias, language dependency, inconsistency, time consumption, symptom exaggeration and memory distortion [11]. More specifically for the STAI test, it has a degree of self-report dependency, it is not physiologically grounded, and there can be a trait vs. state based confusion due to overlapping responses or current mood states [12]. EVestG has the potential to overcome some of these limitations, as it is an objective neurophysiological measurement potentially providing direct biomarkers of anxiety that are independent of patient self-report or clinician interpretation; measures are standardized and repeatable; it is unaffected by social desirability or cognitive biases; and there is the potential to provide early and differential detection (e.g., distinguishing anxiety from depression or vestibular disorders).
Anxiety is clinically assessed by interviewing the patient, and its severity is determined by a questionnaire such as the State Trait Anxiety Inventory (STAI) [13]. The correct diagnosis is often made by observing the patient over a period [14]. Of great interest would be a clinically relevant quantitative and physiological anxiety test/measure beyond the standard questionnaire. For MDD with and without anxiety disorder, an improved understanding of the physiological differences is desired. Anxiety can often be a hidden influencer of treatment efficacy. Therefore, teasing out the effect of anxiety disorder from depression and having a robust way to measure it will significantly improve our understanding of how treatments can be effective.
The present study’s aim is to look at a new population of a closely related pathology, namely MDD; as with our previous BD study [3], we focus on any detected firing pattern changes observed with and without anxiety disorder. This study also considers the effects of depressive severity and medication on the measured anxiety disorder features as well as any differences between the manifestation of anxiety disorder in MDD and BD.
The goal of this study is to detect and measure anxiety disorder in a closely related pathology, namely MDD. We hypothesize that in the MDD population (1) EVestG features can robustly detect and measure anxiety disorder, and (2) anxiety disorder is a measurable covariate of depression whose manifestation is dependent on the severity of depression. This study is the first to attempt to tease out anxiety disorder in an MDD population using an objective otoacoustic measure. Its outcomes can be used to improve and personalize treatment efficacy by quantifying both pathology and comorbidity treatment impacts.

2. Methods

2.1. Population Data

The 42 MDD (26 with comorbid anxiety disorder) individuals were diagnosed by referring psychiatrists. Each patient’s EVestG recording was made immediately after they were recruited (recruitment was over about 4 years) and in their current depressive or asymptomatic disease phase. Utilizing predominantly the Mini-International Neuropsychiatric Interview assessment, the presence of comorbid anxiety (or stress)-related disorders (International Classification of Diseases, ICD-10: F40, F41, F43) (in particular Generalized Anxiety Disorder (F41.1), social (F40.1) or specific phobias (F40.2), PTSD (F43.1), or panic disorder (F41.0) [15]) within this MDD population was determined [16]. The Mini Mental State Exam (MMSE) [17] was applied to all participants for a measure of cognitive status; the Montgomery Asberg Depression Rating Scale (MADRS) [18] was applied as a measure of depression at the time of testing and CORE [19] was used as a measure of melancholia/psychomotor symptoms in MDD. We examined the firing pattern modulation (interval histogram, herein called IH33) responses for each population in each group and its severity subgroups. Fourteen MDD patients were not on anti-psychotic, anti-depressant or mood stabilizer medications (see Supplemental Table S1 for details). Table 1 presents the summarized demographic information for the MDD population.
As performed in [6,8] within the MDD population, EVestG responses were also investigated within reduced severity (R) subgroups: asymptomatic (MADRS ≤ 6) or mildly depressed (MADRS scores of 7 to 19) and a symptomatic population (S), who were moderately depressed (MADRS scores > 19).

2.2. EVestG Recording and Feature Extraction

The details of the EVestG recording methodology can be found in [8,9]. Briefly, left- and right-side reference electrodes were placed on the ear lobes or at the opening of the ear canals, active recording electrodes were placed proximal to the ear drum (Figure 1B), and a common lead was placed on the forehead. Subject responses (with eyes closed) were recorded in the sitting stationary position (Figure 1A) and in response to a backwards (40 degrees in the pitch plane; Figure 1A) tilt during the deceleration movement phase (Figure 1D,E). Using the NEER algorithm [9] (complex Morlet wavelet analysis of phase to detect FPs), EVestG recordings were analyzed offline to detect the FPs. A firing pattern interval histogram representing the time intervals between any two detected FPs was generated. The IH33 (Figure 1C) was generated as the interval (histogram) of every 33rd FP. The average of each 33rd FP was experimentally determined to be approximately 3.3 ms. To focus on the spectral content proximal to the hypothesized and potential links with the alpha band (8–13 Hz) and the lower end of vestibular efferent activity [6,7,8], looking for low-frequency modulations of the firing pattern proximal to 9 Hz (109 ms ~= 3.3 ms × 33), the gap between each 33 FPs is used.
The current main disadvantages of using EVestG are (1) the measurement requires about an hour for setup and recording; (2) the current setup requires an anechoic room for recording and sensitive recording equipment—a new mobile unit under development aims to overcome these limitations.
It is hypothesized that IH33 curves extracted from both the stationary (static: no motion, background) and dynamic (movement, backwards tilt deceleration phase) will be impacted by anxiety disorder. These histograms have been postulated to partially represent potential GABAergic changes that are also purportedly present in anxiety disorder [6,7,8,20]. Stationary (static, background) segments have the advantage of minimal patient movement-related artefact corruption. As otolithic responses have proved better features for depression and related pathologies [6,8,21] we also used the dynamic (movement) back-tilt deceleration phase, as we anticipate that the movement-generated IH33 plot will also be impacted by the presence of anxiety disorder. Thus, to extract features to detect the effect of comorbid anxiety disorder in an MDD population, we used the IH33 curve extracted from the above-mentioned time segments.

2.3. IH33 Curve Derivation

To derive the IH33 plots (Figure 2), first, the static recording segments analyzed herein were the average of five 1.5 s segments immediately preceding any applied whole-body tilt. Second, the deceleration phase (1.5 s) of the backwards (pitch) tilt was analyzed (Figure 1D,E). The backwards tilt is a 40-degree whole-body tilt following the velocity profile shown in Figure 1D. These segments were recorded in the sitting upright position with eyes closed. These plots enable detection of potential descending modulating frequency changes applied to vestibulo-acoustic afferents. Anxiety disorder features were derived by considering only the significantly different anxiety disorder minus non-anxiety disorder population (Diffanx) IH33 bins from analysis of the MDD (sub) population(s) (e.g., Figure 2C).
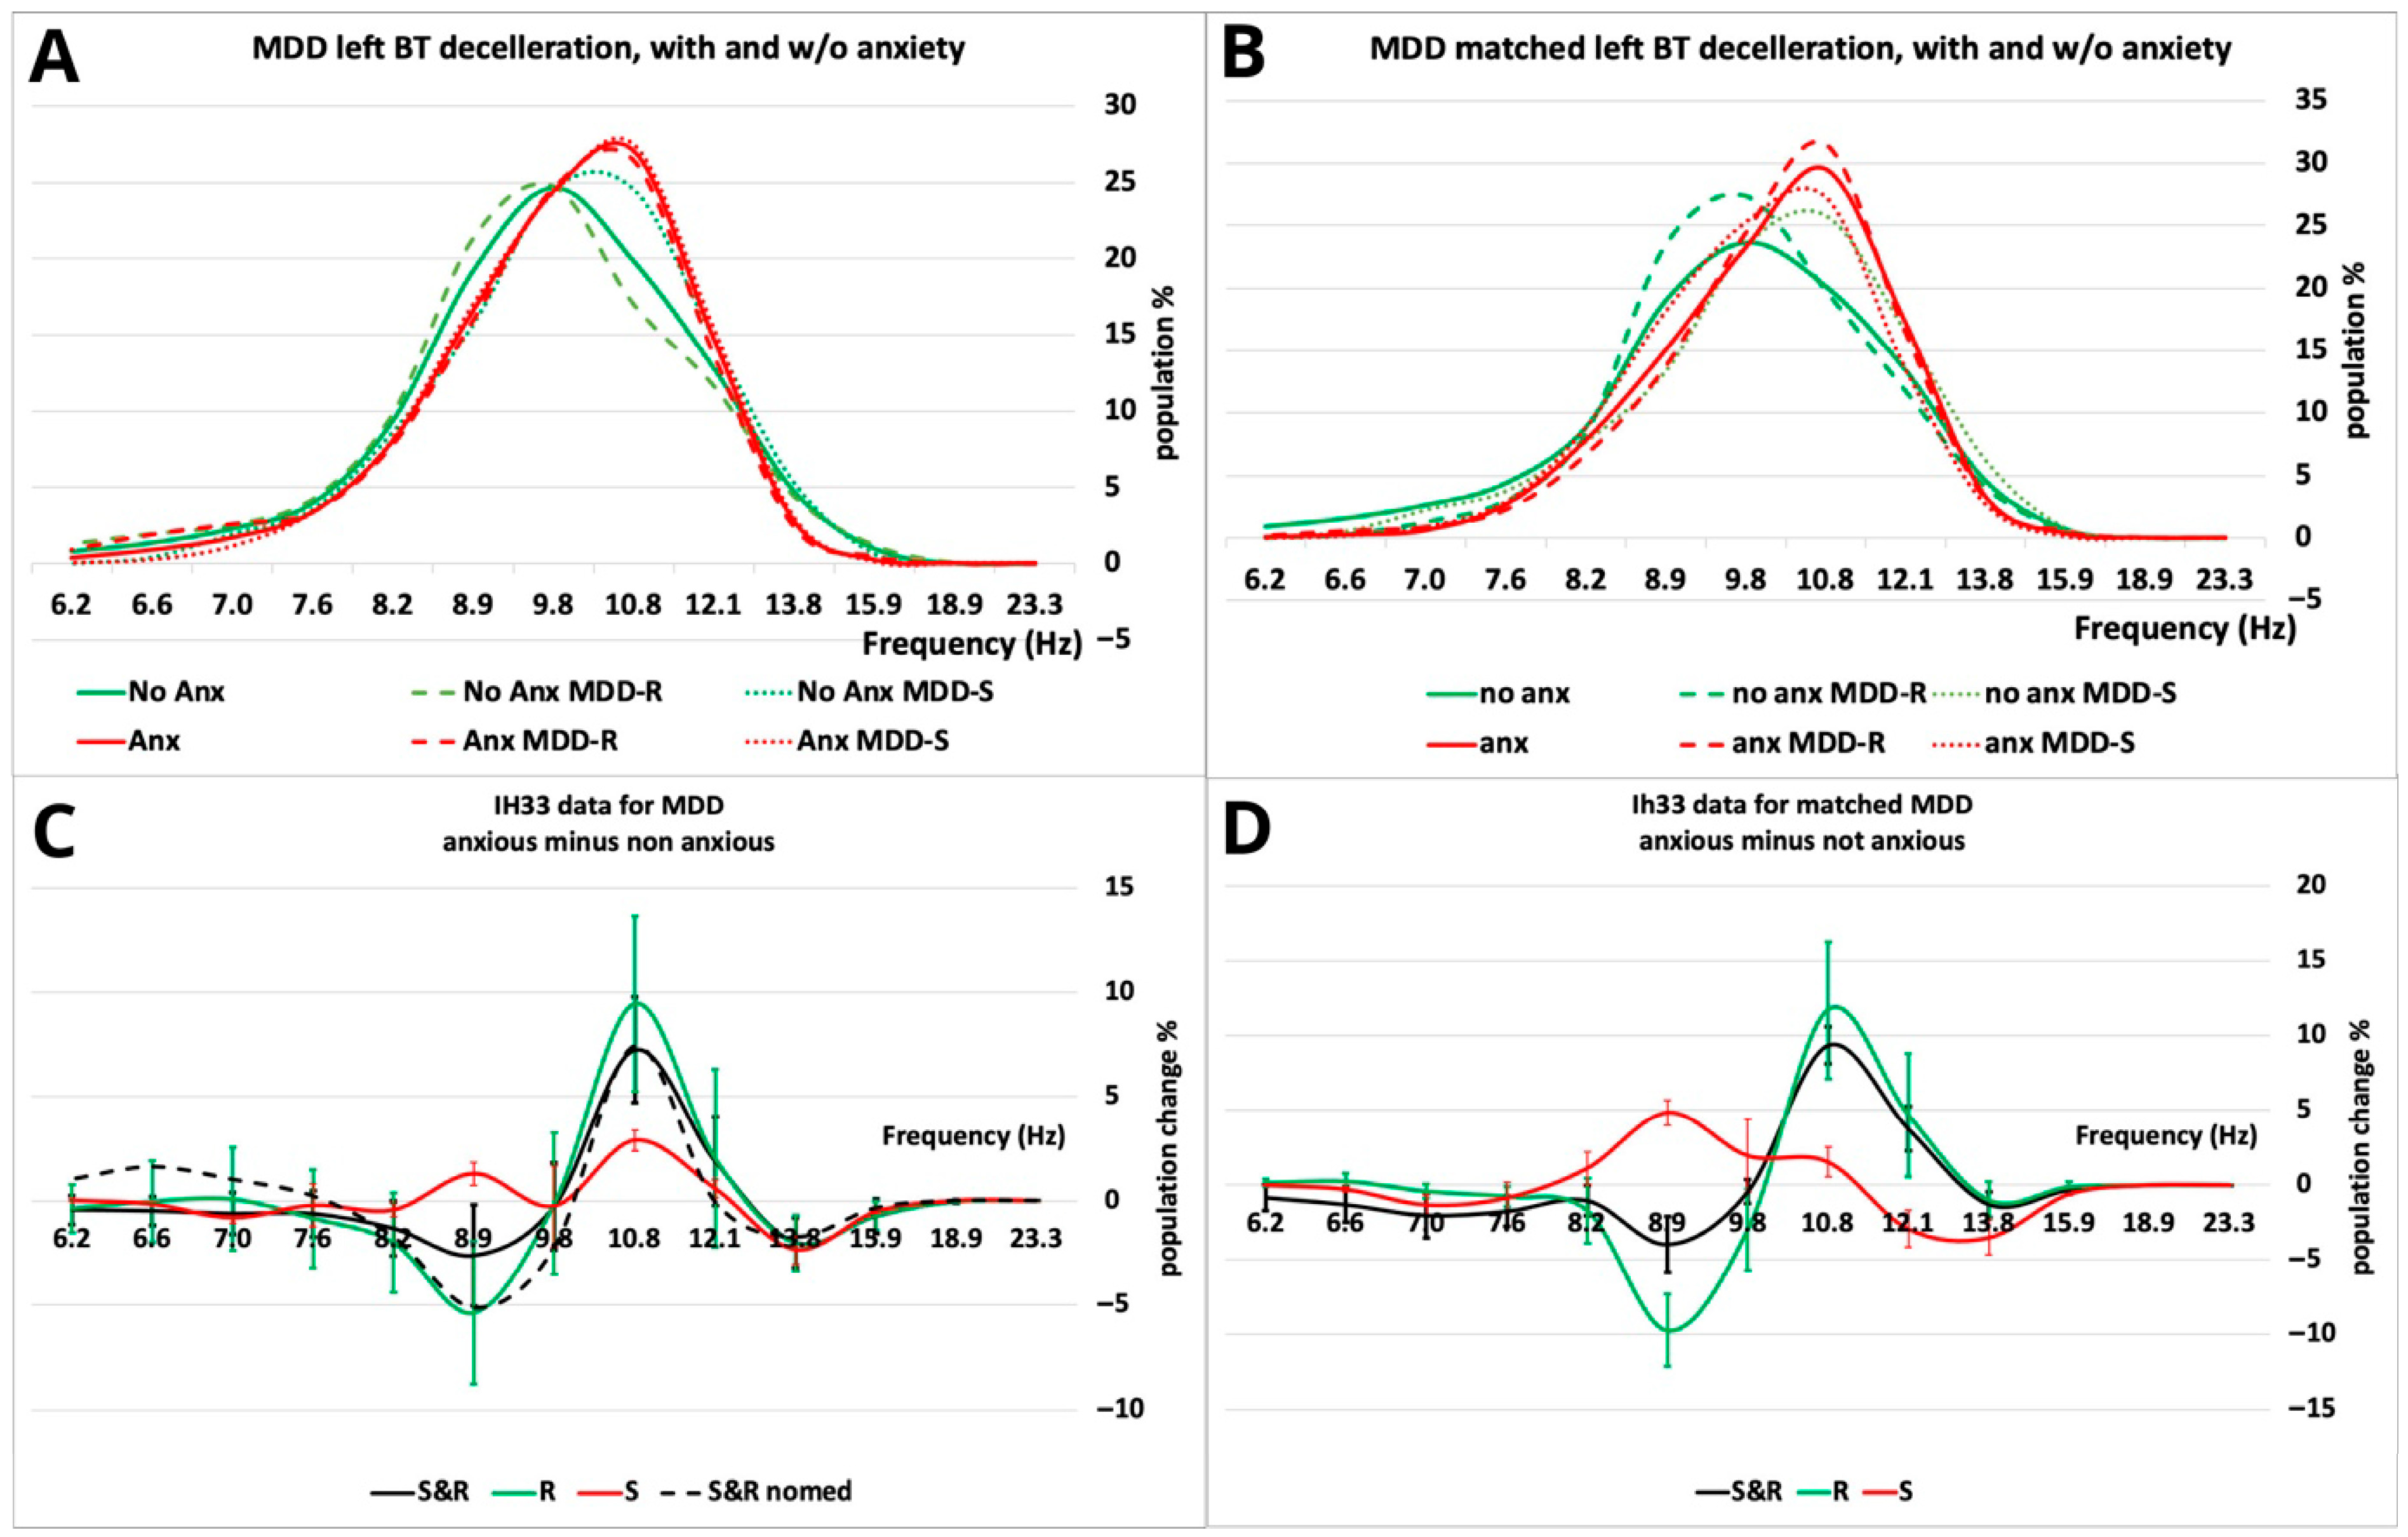
The IH33 curve of the background and deceleration segments of each individual’s data (2 ears’ data treated separately). The right minus left IH33 responses (an asymmetry feature as used in [3]) were generated (Figure 2C,D) from interval histogram firing pattern data (Figure 2A,B). The average IH33 Diffanx (the difference between anxiety disorder and non-anxiety disorder response curves) response curves from each subgroup (S&R, R, S) before and after matching (age, gender, MADRS) were compared for statistically significant differences with and ‘without medication’ effects. The matching subpopulations were selected by first matching gender, and secondly by best matching (using propensity score matching [22]) the MADRS and age combination whilst maintaining the largest population possible. Fourteen of the 42 MDD subjects were not on anti-psychotics, anti-depressants, or mood stabilizers, enabling a comparison with a “non-medicated” group. For classification, the matched population (N = 28, anxious = 14, non-anxious = 14) was treated as the training group and tested with the remaining unmatched population (N = 14). The results of test plus training datasets are presented as the “All” group in the figures.

2.4. Data Analysis: Statistical Tests

In subsequent Diffanx plots, error bars indicate 95% confidence intervals. To derive classification features (feature derivation is detailed below) to discriminate anxiety disorder from non-anxiety disorder groups a selection of significantly different Diffanx bins were used [23]. For statistical analysis of the derived features ROC values were generated. Quade ANCOVA with age, gender and MADRS as covariates was performed on populations, as some features failed to meet either normality or homogeneity of variance conditions. For classification, given the potential lack of normality, a Kernel Density estimate distribution and then a Naïve Bayes Classifier was applied to populations using combinations of derived features. Leave-one-out cross-validation was then applied, and these cross-validated results were presented. Analysis was performed using SPSS V28. Significance testing was adjusted for multiple testing.

3. Results

3.1. Feature Selection

The IH33 curves derived from the deceleration phase of backward tilt (BT) showed marked differences between anxious and non-anxious in the “all” and “matched” groups (Figure 2A,B). Figure 2C,D show the Diffanx (anxiety disorder group response minus no anxiety disorder group response) IH33 responses for the deceleration phase of a backward tilt when considered as S&R, R and S populations for the entire population and a matched subpopulation, respectively. In particular, from the differences between anxiety disorder and non-anxiety disorder plots shown in Figure 2C,D (Diffanx, Figure 2C derived from Figure 2A and Figure 2D derived from Figure 2B), it can be seen for the left-hand side the 10.8 Hz peak stands out as a common and a likely feature of anxiety disorder for both Figure 2C medicated and unmedicated populations. This 10.8 Hz bin value was selected as feature F1 (Table 2) for classification of anxiety disorder from non-anxiety disorder populations. In Figure 2D for the Diffanx measure, there is a shift in power spectral density to lower frequencies as the depressive severity is increased, i.e., there is a dependence on depressive severity.
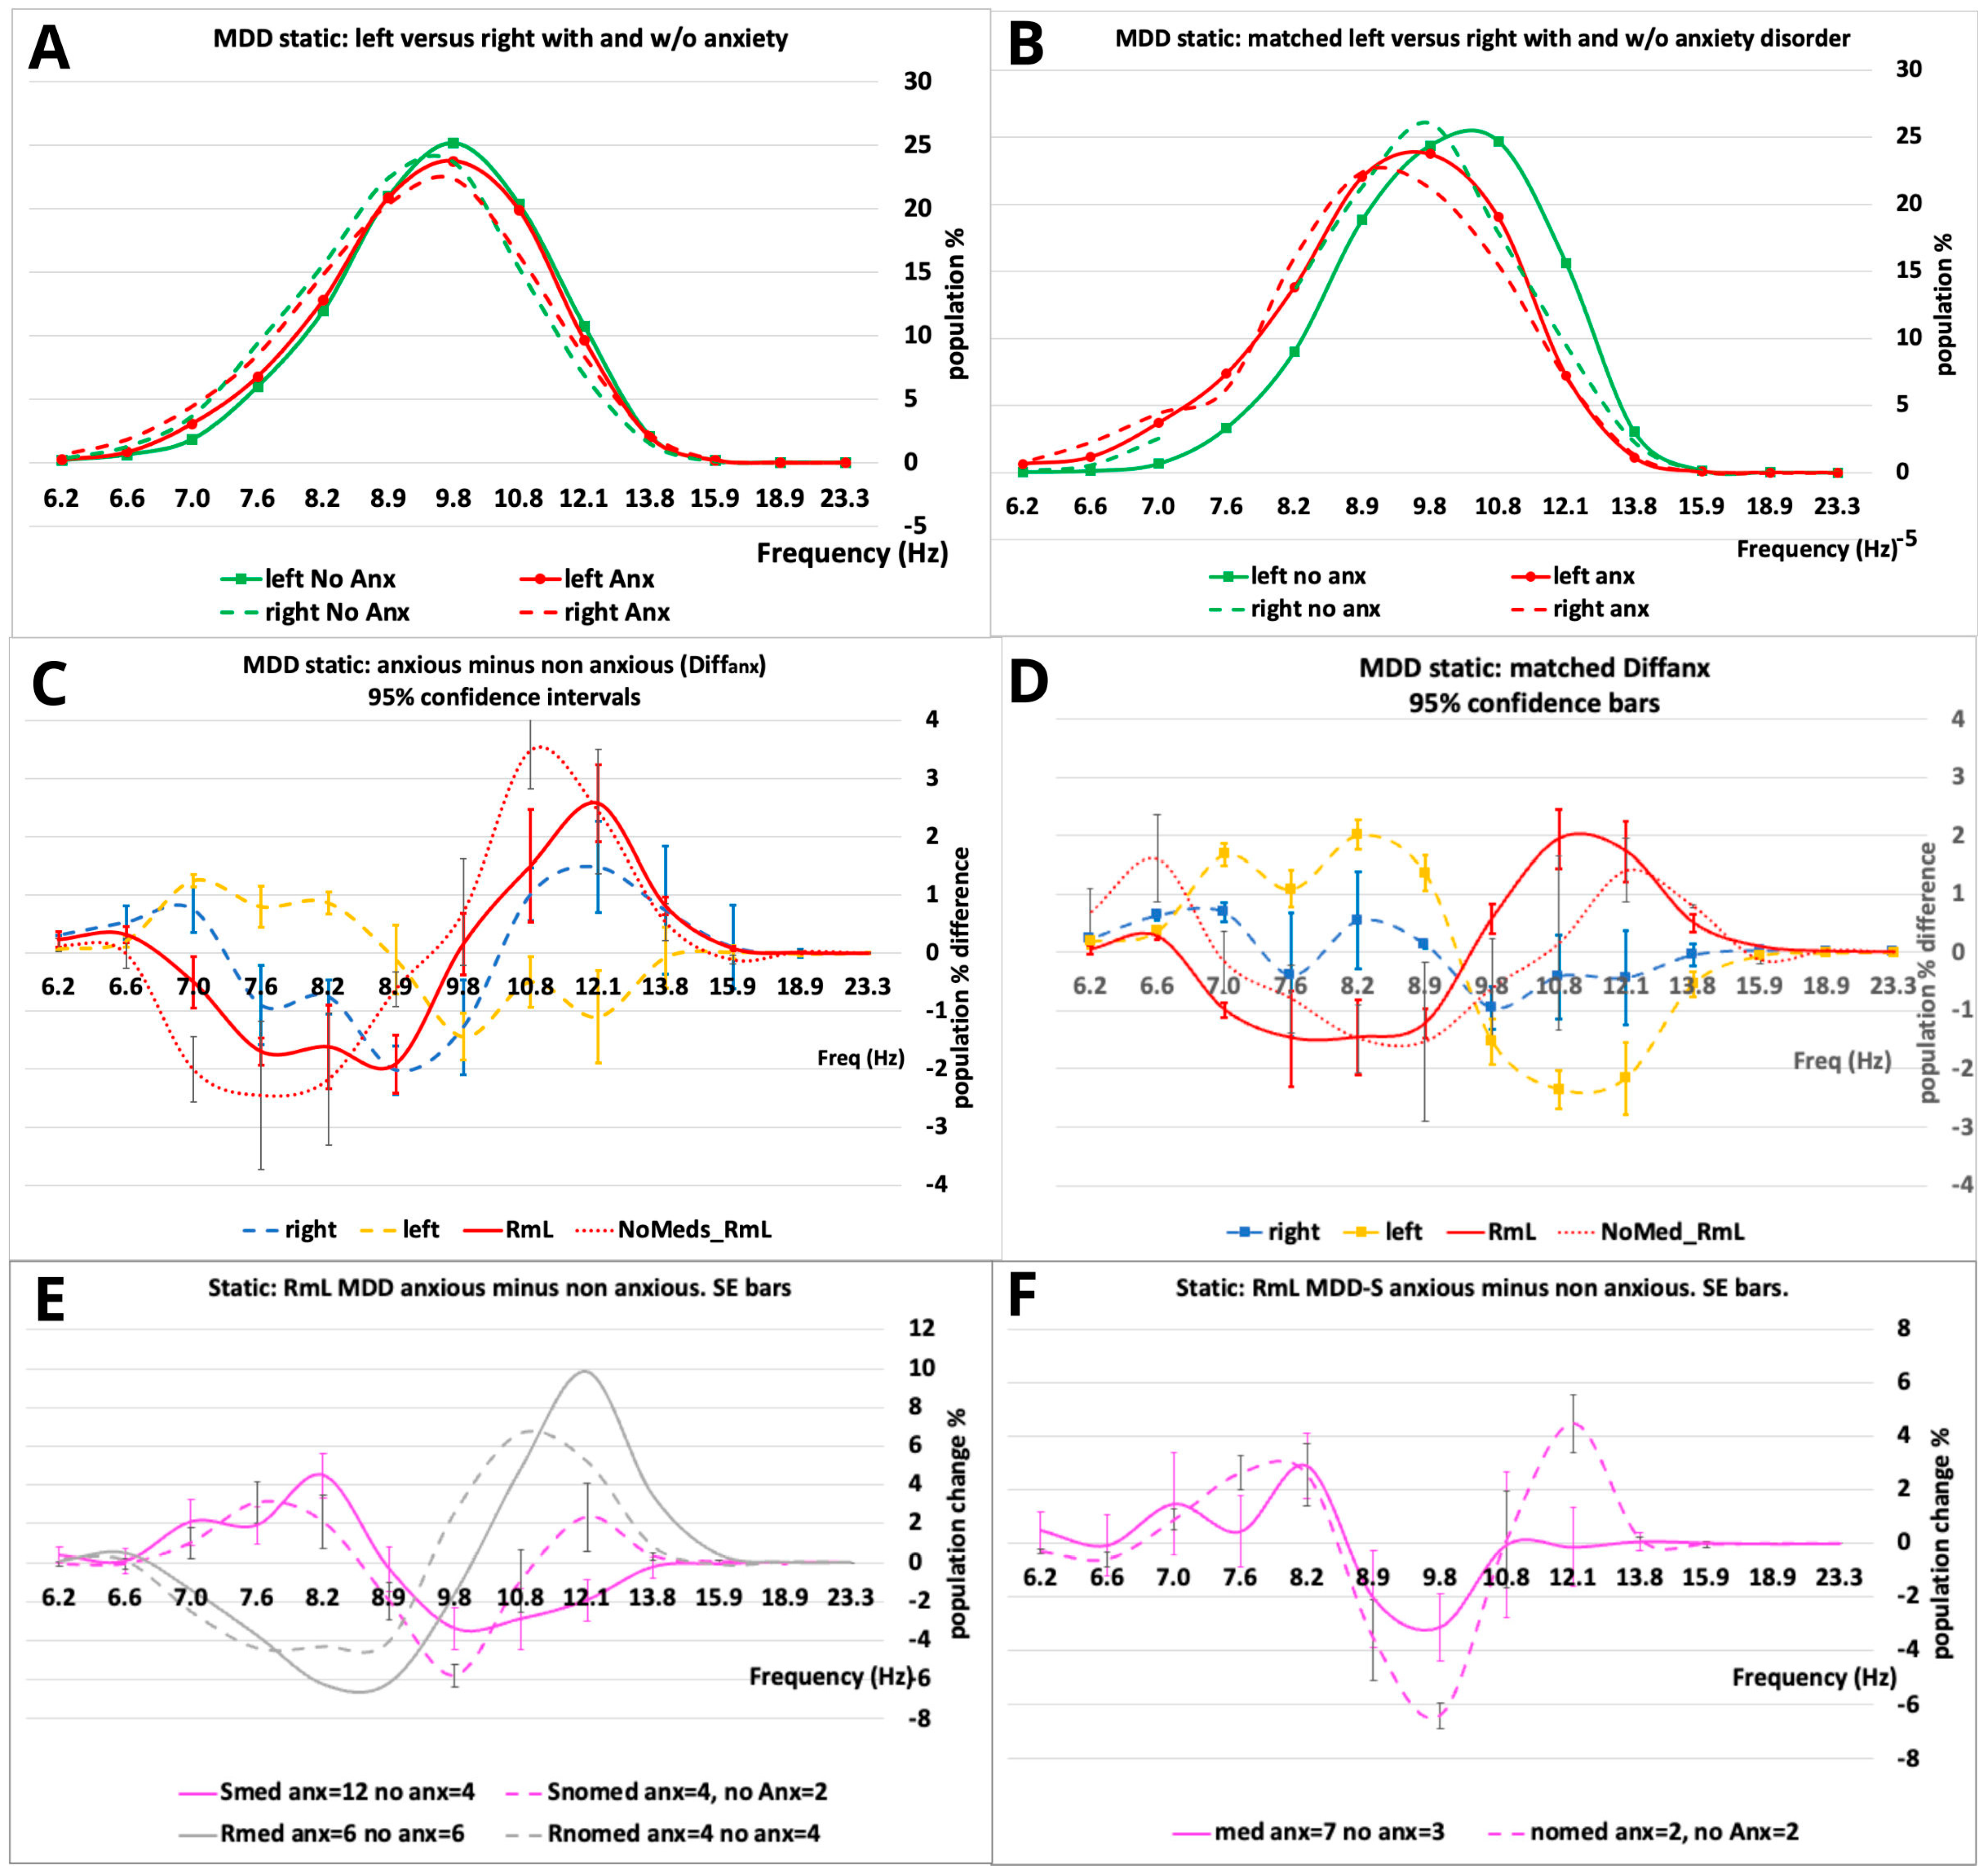
Figure 3A,B show the IH33 response plots, respectively, for unmatched and matched (for age, gender and MADRS) anxious and non-anxious populations derived from the static background recording for both left- and right-side responses. Figure 3C,D show the right and left side anxious minus non-anxious (Diffanx) response curves for the entire population and a matched subset, respectively. Overlaid in red and dotted red are the right minus left (RmL) response curves for the respective populations and their unmedicated subpopulations.
There is an asymmetry between the right and left side responses, which is significant for both unmedicated (dotted red curves) and medicated (solid red curves) populations. In Figure 2C,D, we noted the R and S population Diffanx responses differed markedly. The S&R and R population responses being similar but S quite different. Accordingly, in Figure 3E,F we look more closely at the S population RmL differences. Figure 3E,F show the Diffanx response for the All and matched S (Symptomatic) left-side medicated and no-medication subpopulations. (These error bars are standard error).
To improve our S population classification of anxious versus non-anxious subjects’ classification feature F2 was derived based on these S population curves. Note the biggest differences between the medicated and non-medicated S population RmL Diffanx responses are proximal to the 9.8 and 12.1 Hz bins. Accordingly, from Figure 3F, feature F2 is selected as the 9.8 minus 12.1 Hz bin values, with this feature selected to highlight the notable effects of medication on the anxious S population (see also Table 2). In Figure 3E the R population responses are overlaid to show the almost inverse response curves observed for R and S populations, whether medicated or not.
To account for medication effects and noting they mostly manifest proximal to the 9.8 Hz and 12.1 Hz bins within the S population for feature F3, we focus on the left side a-na med/nomed population responses main peak differences in Figure 2C, namely, the 10.8 Hz, 13.1 Hz and 8.9 Hz bin values. The feature is defined as the 10.8 Hz minus 13.1 Hz plus/minus 8.9 Hz bin values for S/R, respectively (see Table 2). Note: This definition, due to the S/R dependency, has an inherent MADRS dependency. It also highlights that medication impacts can differ between the S and R groups particularly proximal to 8.9 Hz.

3.2. Statistical Analysis

Table 3 shows the statistical analysis of the three derived features. In part A, ROC values for the three features for the S&R population and R and S subpopulations are presented, indicating particularly high ROC values for F1, F2 and F3 R-matched populations.
In part B, a Quade ANCOVA with age, gender and MADRS as covariates was performed on the matched populations, as not all features met normality and homogeneity of variance conditions. Feature F1 is likely robust (S&R: F(1,26) = 6.52, p = 0.017; R: F(1,12) = 5.77, p = 0.033) for the S&R and R population anxiety disorder versus non-anxiety disorder classification. Feature F2 is and is likely robust (S&R: F(1,26) = 6.72, p = 0.008; R: F(1,12) = 5.71, p = 0.034) for S&R and R population anxiety disorder versus non-anxiety disorder classification. Feature F3 is likely robust (S&R: F(1,26) = 10.15, p = 0.004; R: F(1,12) = 5.50, p = 0.037) for S&R and R population anxiety disorder versus non-anxiety disorder classification. Neither F1, F2 or F3 was particularly good at separating anxiety disorder and no anxiety disorder S populations, though F2 might be considered marginally effective (F(1,12) = 3.65, p = 0.080). The fact there are only six or eight subjects in the matched S/R subgroups is a recognized limitation with the possibility of overfitting in classification models.
Table 4 shows the significant non-parametric Spearman’s Rho correlations between features F1–3 for the matched SR population.

3.3. Classification

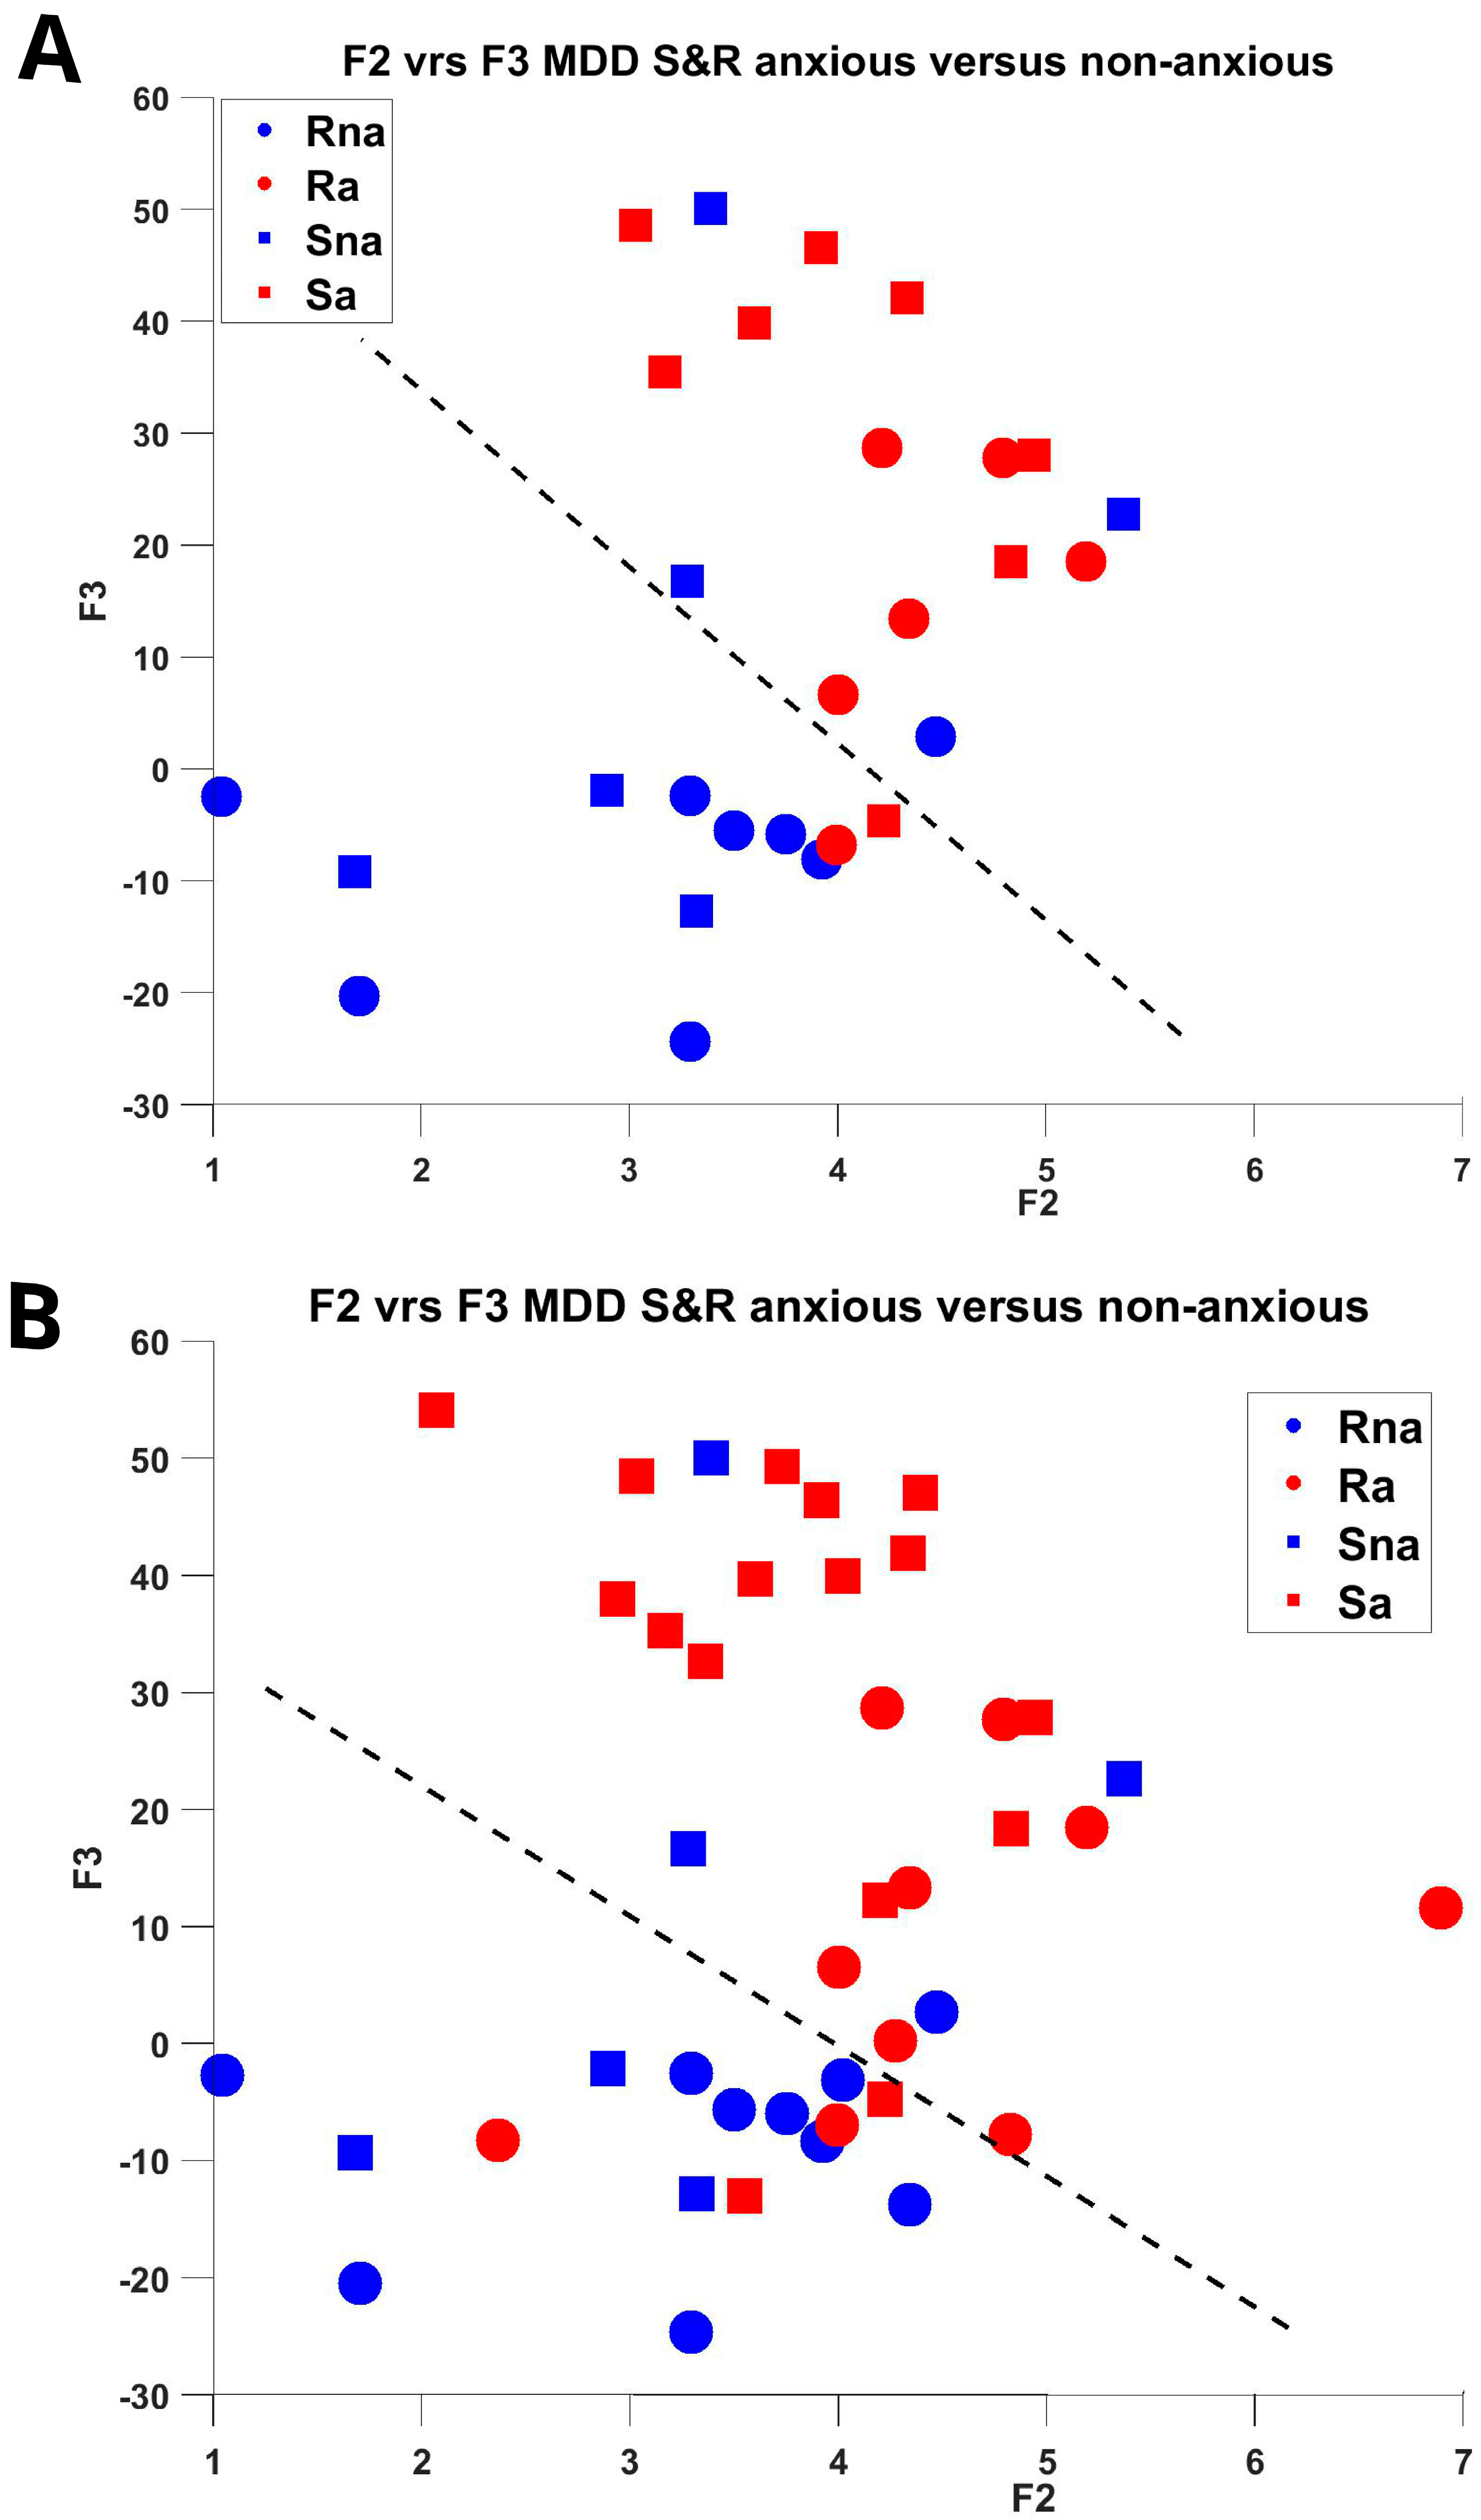
Table 3C shows the accuracy results of applying a Kernal Density estimate distribution and then a Naïve Bayes Classifier to the matched and unmatched populations using combinations of features F1 to F3. The S&R and R but not S populations were well classified. The results for the feature combination F2&F3 are shown in Figure 4. A clear separation of anxious and non-anxious groups is evident in both matched and unmatched populations. In Figure 4B the remaining 14 subjects not contained in the matched training population were overlaid onto Figure 3A (with the exact same axes and separator), supporting the use of these features. Two of the fourteen of the test population were located on the wrong side of the separator.

3.4. Medication

For the dynamic BT response, the general shape of the unmedicated Diffanx trace in Figure 2C is virtually overlapping with the comparable S&R unmedicated response. Both had prominent 10.8 Hz peaks. The RmL Diffanx unmedicated responses (dotted red) in Figure 3C,D are trend-wise relatively consistent with those of the comparable medicated (solid red) statistically generated responses. With respect to the S populations in Figure 3E,F, the impact of medication appears as a suppression of frequency component energies proximal to 12.1 Hz and an increase of those proximal to 8.9 Hz. From Figure 3E the R population effects of medication appear to act almost oppositely at these frequencies.

3.5. Depressive Severity

MADRS (depressive severity) was observed as being linked with anxiety disorder, i.e., more persons with anxiety disorder were observed as having S (N = 16) rather than R (N = 10) depressive levels.

3.6. Anxiety Definition

It is worth noting that the broad definition of anxiety disorder (including phobias, PTSD, etc.) certainly compromises the specificity of these results.

4. Discussion

This study found significant (p < 0.05) and measurable differences between MDD patients with and without anxiety disorder (Figure 2, Figure 3 and Figure 4). Our findings indicate there are motion-evoked differences between the MDD population with and without anxiety disorder (Figure 2) proximal to 10.8 Hz. However, when these responses are broken into reduced symptomatic (R) and symptomatic (S) depressive severities, the S population differences become less pronounced proximal to 10.8 Hz. In Figure 2D (and more so in Figure 2C), as depressive severity increases (R cf. S), there is a shift in spectral energy toward lower (8.9 Hz cf. 10.8 Hz) frequencies for the Diffanx measure. These findings support anxiety and depressive severity acting as potentially confounding influences on the physiology.
There is also a static (no motion/resting state) asymmetry between the left and right Diffanx S&R population curves (Figure 3C,D). A comparative look at the right minus left (RmL) Diffanx responses in both Figure 2C,D show for unmatched and matched populations a similar increase in high (10.8–12.1 Hz) and decrease in low (7.0–8.9 Hz) frequency spectral energy. There is already evidence of frontal alpha band asymmetry in MDD depression [24]. Additionally, there is evidence of asymmetry in the vestibular response to caloric stimulation in depression [25,26]. Supporting these three observations, it was noted in the statistical analysis that for the right minus left asymmetry feature F2 the Diffanx measure was generally similar in shape whether matched or not and medicated or not. A future study might look at asymmetry being a marker for anxiety disorder in newly diagnosed depressives.
When using the features F1 and F2, anxiety can be detected (matched: S&R accuracy = 79%, R accuracy = 86%, S accuracy = 79%) (see Figure 4A,B and Table 3C). The results herein also support anxiety affecting responses as a function of depressive severity (i.e., differently for R compared to S). Anxiety appears to manifest more as an increase in spectral energy proximal to 10.8 Hz for a dynamic tilt and as an asymmetry between right and left side static responses proximal to 10.8–12.1 Hz and 7.0–8.9 Hz. This might be suggestive of the presence of both dynamic (metabolic) and static anxiety disorder components.
Anxiety has been shown to be correlated with both the overlapping alpha and theta bands [27]. There is some evidence of EEG alpha band activity being successfully applied to predict depressive severity [28]. Additionally, low versus high theta current density in the frontal cortex and rostral anterior cingulate has been associated with response and non-response, respectively, to anti-depressants [29]. These findings indicate depressive severity might act as a potentially confounding influence on the effects medication groups may have on the Diffanx plots of Figure 2. Overall, as shown in Figure 2, depressive severity (R or S) can impact the encoding of anxiety, and maybe vice versa.
However, we note when considering the S&R populations, the 10.8 Hz component used in the dynamic feature F1 is present in the anxiety disorder (S&R) population (Figure 2C) whether they were on ‘medication’ or not (14/42 were not on medications, and 16/28 of the medicated population were on anti-depressants only; see Table S1). Excluding the S subpopulation, this lack of major difference is not unanticipated. Congruent with this observation, it was found mood stabilizers were most effective, anti-psychotics effective, and anti-depressants least effective in moderating the EVestG measured anxiety disorder response in Bipolar Disorder patients [3]. Herein most (25/28) medicated patients were on anti-depressants (N = 16) or anti-depressants with anti-psychotics (N = 5) or mood stabilizers (N = 4). For the S&R anxious population using the IH33 plot, comparisons of unmedicated and anti-depressant-medicated anxious groups indicate virtually no difference.

4.1. GABA in MDD

Previous studies [6,7,8] hypothesized a change in the firing pattern interval histogram (IH33) may be linked to a GABAergic change. There are also studies that support GABA being intimately involved in anxiety behaviour [20,30]. For example, in rats, intra-anterior cingulate cortex injections of GABAAR agonists have been shown to relieve anxiety-like behaviours [30]. In a review study on GABA and anxiety [20], GABAergic interneurons in the amygdala were thought to play a key role in the modulation of anxiety responses both in normal and pathological states.
We used the firing pattern interval histogram, IH33, as a feature hypothesized to be reflective of GABAergic change. Supporting this hypothesis, we note the following studies: There appears to be a strong association between MDD and polymorphisms at the level of GABAA receptor subunit genes [31]. The strongest evidence that GABAergic deficits may contribute to MDD depressive disorders is the observed reductions in GABA levels in plasma and cerebrospinal fluid or resected cortical tissue [31]. Interestingly, there are also GABAA receptor deficits observed in the temporal lobe of Generalized Anxiety Disorder and PTSD patients [32,33]. In MDD GABA is argued to be reduced [31] potentially changing the spontaneous discharge of the vestibular afferents. Lastly, activation of GABAB receptors on calyx terminals, causing an inhibition of potassium currents in the rat semicircular canal, results in excitatory modulation of calyx terminals [34]. Disruptions of inhibition associated with GABAergic activity might also have a vascular basis [35]. Activation of GABAB receptors is known to lead to vasoconstriction [36] and, as a consequence, potentially reduced neural activity.
We hypothesize that reduced GABA, as in depression, may then lead to a change (de-facilitation) in spontaneous discharge manifesting as a shift to lower frequencies for MDD-S (Figure 2C,E) compared to MDD-R. We also hypothesize it may well be that the MDD-S response change may be not only a consequence of a large GABAergic change but also another impacting physiological change, i.e., anxiety disorder. Alternative or additional to the de-facilitation process may also be a change in the afferent firing synchronization process linked to GABAergic-linked changes, particularly in the efferent system. Figure 3E,F show medication lessening the magnitude of the 12.1 Hz and 8.9 Hz peaks in the Diffanx S population response. That is, and noting that N is particularly small, the applied medication reduces Diffanx. The same cannot be said for the S&R dynamic (Figure 2C,D) and asymmetry measures (Figure 3C,D) wherein there is no highly marked change in the general overall shape of the plots when comparing medicated with non-medicated responses. Based on these observations we hypothesize the MDD-S 12.1 Hz and 8.9 Hz peak changes in Figure 3E,F are influenced more by depressive severity medications than anxiety-related impacts, as 16 of the 28 medicated MDD patients (the remaining medicated patients were on anti-depressant/mood-stabilizer or anti-depressant/anti-psychotic medication combinations) were only on anti-depressants, which appear to have a relatively weak impact on our EVestG anxiety measures. For our Bipolar Disorder study, we saw anti-depressants having the weakest impact on anxiety measures compared to anti-psychotics or mood stabilizers [3]. Figure 2C indeed shows the S&R anxious population IH33 plot comparison of unmedicated and anti-depressant-medicated anxious groups, indicating there are virtually no differences. Anxiety and depression appear intertwined.
The locus coeruleus has bidirectional links to the vestibular nucleus [2]. In the locus coeruleus there are glial changes [37] linkable to Glutamate signalling changes [37], which are also linkable (at least cortically) to GABA changes [38]. All these GABA-linked changes collectively are potentially able to influence the MDD response differences observed herein. Whilst we have focused on GABA-related pathways, it is important not to exclude the impacts of other drug groups such as SSRIs and SNRIs, which also will impact the responses of medicated subjects. However, we are encouraged by the S&R and R population non-medicated subject responses being similar in general shape to those of the medicated group and being a test of the utility of our features.

4.2. Hippocampal Theta

Previous EVestG studies hypothesized that the firing pattern (IH33) data was impacted by either alpha band activity or efferent vestibular system (EVS) modulation [6]. Whilst this remains plausible, the frequency bands of change in Figure 2 and Figure 3, i.e., ~6–13 Hz, lie within the same frequency range as hippocampal theta, which has been linked to anxiety circuits as a biomarker [4]. Hippocampal theta has been detected in the dorsal raphe nucleus of the vestibular system [39]. Hippocampal theta may also be found in the vestibular periphery given the vestibular nuclei (VN) have bidirectional projections from the dorsal raphe nuclei [40,41] and the VN then projects to the vestibular periphery via the positive feedback looping Efferent Vestibular System (EVS) [42]. Tai et al. (2012) has already noted that vestibular activity may be mediated by hippocampal theta [43]; that has been further supported by Bosecke et al. (2024) [5] who concludes that hippocampal theta “can modulate sensory signals during anxiety and posits that such modulation of vestibular signals may be an anxiety biomarker that could be detected non-invasively in humans… Critically, if hippocampal theta entrains the firing of any peripheral vestibular neurons, then EVestG may be detecting this entrainment.” Such entrainment could be a biomarker of anxiety as observed herein.

4.3. BD Versus MDD Anxiety

The features used for detection of anxiety disorder in BD [3] and MDD populations were not the same. Four static features were applied for BD anxiety disorder detection: right side 8.9 Hz; left side 6.6 Hz; left side 9.8 Hz and; RmL 6.6 Hz [3]. However, there are some similarities: In Figure 2 it can be seen that a major peak of interest was at 8.9 Hz for the static left hand side feature F3. That frequency was also used for BD classification on the right-hand side and as a static feature. Another commonality is for the static left-hand-side measure at 9.8 Hz herein used a medication-sensitive feature. Whilst there is overlap, it remains highly likely anxiety disorders in MDD and BD are not manifested identically.

4.4. Limitations of the Study

The main limitation of this study is its limited sample size. Another limitation is the applied broad definition of anxiety. Other limitations include the lack of standardized anxiety scales (only MINI was applied), potential confounds (e.g., disease comorbidities, multiple medications), and any limitations of the EVestG method itself. The likely different but perhaps overlapping physiological mechanisms behind each of the different included codes (encompassing ICD-10 codes F40, F41, and F43) in our definition of anxiety do limit the ability to generalize our findings for characterizing anxiety. Future studies should repeat this study on each separate group, e.g., GAD, PTSD, and panic disorders. A placebo-controlled study on a healthy group taking Anxiolytics whilst being given a targeted Anxiogenic stimuli is required. Whilst beyond the scope of this study, a future study of the detailed impacts of neurotransmitter level changes on the EVS would help explain some of the results herein.

5. Conclusions

This study has provided a novel analysis of EVestG data for a potentially clinically relevant baseline anxiety disorder test/measure, leading to an improved understanding of the physiology behind the depressive severity-based differences between MDD with and without anxiety disorder. Most importantly, the proposed methodology may lead to better monitoring and treatment of and consequently the reduction in the average MDD patients’ comorbid anxiety (and/or depressive severity). Although the results are promising, further studies with larger and controlled samples are needed before EVestG can be adopted as a clinical biomarker.

Supplementary Materials

The following supporting information can be downloaded at: https://www.mdpi.com/article/10.3390/psychiatryint6030094/s1, Table S1: Study participant’s demographics and psychiatric assessments.

Author Contributions

Conceptualization, B.J.L. and A.G.; methodology, B.J.L. and A.G.; software, B.J.L.; validation, B.J.L., A.G. and Z.M.; formal analysis, B.J.L.; investigation, B.J.L. and A.G.; resources, B.J.L. and Z.M.; data curation, B.J.L.; writing—original draft preparation, B.J.L.; writing—review and editing, B.J.L., A.G. and Z.M.; visualization, B.J.L.; supervision, B.J.L.; project administration, B.J.L. and Z.M.; funding acquisition, B.J.L. All authors have read and agreed to the published version of the manuscript.

Funding

This section of research received no external funding.

Institutional Review Board Statement

The study was conducted in accordance with the Declaration of Helsinki, and approved by The Alfred Human Ethics Committee (Approval Number 95/06) of the Alfred Hospital for studies involving humans.

Informed Consent Statement

Informed consent was obtained from all subjects involved in the study.

Data Availability Statement

The data presented in this study due to current commercialization plans can be made available upon reasonable request from the corresponding author.

Conflicts of Interest

BL has <1% shares in NeuralDX Pty Ltd.

References

  1. Fava, M.; Rankin, M.A.; Wright, E.C.; Alpert, J.E.; Nierenberg, A.A.; Pava, J.; Rosenbaum, J.F. Anxiety disorders in major depression. Compr. Psychiatry 2000, 41, 97–102. [Google Scholar] [CrossRef]
  2. Balaban, C.D.; Jacob, R.G.; Furman, J.M. Neurologic bases for comorbidity of balance disorders, anxiety disorders and migraine: Neurotherapeutic implications. Expert. Rev. Neurother. 2011, 11, 379–394. [Google Scholar] [CrossRef] [PubMed]
  3. Lithgow, B.J.; Moussavi, Z. Measuring anxiety disorder in bipolar disorder using EVestG: Broad impact of medication groups. Front. Neurol. 2024, 14, 1303287. [Google Scholar] [CrossRef]
  4. McNaughton, N. What do you mean ‘anxiety’? Developing the first anxiety syndrome biomarker. J. R. Soc. N. Z. 2018, 48, 177–190. [Google Scholar] [CrossRef]
  5. Bosecke, C.; Ng, M.; Dastgheib, Z.; Lithgow, B.J. Perspective: Hippocampal theta rhythm as a potential vestibuloacoustic biomarker of anxiety. Eur. J. Neurosci. 2024, 61, e16641. [Google Scholar] [CrossRef]
  6. Lithgow, B.J.; Garrett, A.L.; Moussavi, Z.M.; Gurvich, C.; Kulkarni, J.; Maller, J.J.; Fitzgerald, P.B. Major Depression and Electrovestibulography. World J. Biol. Psychiatry 2015, 16, 334–350. [Google Scholar] [CrossRef]
  7. Lithgow, B.J.; Moussavi, Z.; Fitzgerald, P.B. Quantitative separation of the depressive phase of Bipolar Disorder and Major Depressive Disorder using Electrovestibulography. World J. Biol. Psychiatry 2019, 20, 799–812. [Google Scholar] [CrossRef] [PubMed]
  8. Lithgow, B.J.; Moussavi, Z.; Gurvich, C.; Maller, J.J.; Kulkarni, J.; Fitzgerald, P.B. Bipolar Disorder in the Balance. Europ. Arch. Psychiatry Clin. Neurosci. 2018, 269, 761–775. [Google Scholar] [CrossRef] [PubMed]
  9. Lithgow, B.J. A methodology for detecting field potentials from the external ear canal: NEER and EVestG. Ann. BME 2012, 40, 1835–1850. [Google Scholar] [CrossRef]
  10. Blakley, B.; Ashiri, M.; Moussavi, Z.; Lithgow, B.J. Verification EVestG recordings are Vestibuloacoustic signals. Laryngoscope Investig. Otolaryngol. 2022, 7, 1171–1177. [Google Scholar] [CrossRef]
  11. Moses, K.; Gayed, M.; Chuah, S.; Wootton, B.M. The Use of Evidence-Based Assessment for Anxiety Disorders in an Australian Sample. J. Anxiety Disord. 2020, 75, 102279. [Google Scholar] [CrossRef]
  12. Thomas, C.L.; Cassady, J.C. Validation of the State Version of the State-Trait Anxiety Inventory in a University Sample. SAGE Open 2021, 11, 21582440211031900. [Google Scholar] [CrossRef]
  13. Spielberger, C.D.; Gorsuch, R.; Lushene, R.; Vagg, P.R.; Jacobs, G.A. Manual for the State-Trait Anxiety Inventory; Consulting Psychologists Press, Inc.: Palo Alto, CA, USA, 1983. [Google Scholar]
  14. Goldbloom, D.S.; Davine, J. Psychiatry in Primary Care: A Concise Canadian Pocket Guide, 2nd ed.; Davine, D.S.G.A.J., Ed.; CAMH: Toronto, ON, Canada, 2019; Volume 1, p. 546. [Google Scholar]
  15. World Health Organization. International Statistical Classification of Diseases and Related Health Problems, 10th ed.; World Health Organization: Geneva, Switzerland, 2019. [Google Scholar]
  16. Sheehan, D.V.; Lecrubier, Y.; Sheehan, K.H.; Amorim, P.; Janavs, J.; Weiller, E.; Hergueta, T.; Baker, R.; Dunbar, G.C. The Mini-International Neuropsychiatric Interview (M.I.N.I.): The development and validation of a structured diagnostic psychiatric interview for DSM-IV and ICD-10. J. Clin. Psychiatry 1998, 59, 20–57. [Google Scholar]
  17. Folstein, M.F.; Folstein, S.E.; McHugh, P.R. Mini-mental state: A practical method for grading the cognitive state of patients for the clinician. J. Psych. Res. 1975, 12, 189–198. [Google Scholar] [CrossRef] [PubMed]
  18. Montgomery, S.A.; Asberg, M. A new depression scale designed to be sensitive to change. Br. J. Psychiatry J. Ment. Sci. 1979, 134, 382–389. [Google Scholar] [CrossRef]
  19. Austin, M.P.; Mitchell, P. Melancholia as a Neurological Disorder. In Melancholia: A Disorder of Movement and Mood; Parker, G., Hadzi-Pavloic, D., Eds.; Cambridge University Press: New York, NY, USA, 1996; pp. 223–236. [Google Scholar]
  20. Nuss, P. Anxiety disorders and GABA neurotransmission: A disturbance of modulation. Neuropsychiatr. Dis. Treat. 2015, 11, 165–175. [Google Scholar] [CrossRef] [PubMed]
  21. Heibert, D. Computer Models of the Vestibular Head Tilt Response, and Their Relationship to EVestG and Meniere’s Disease. Ph.D. Thesis, Monash University, Melbourne, Australia, 2010. [Google Scholar]
  22. Austin, P.C. An Introduction to Propensity Score Methods for Reducing the Effects of Confounding in Observational Studies. Multivar. Behav. Res. 2011, 46, 399–424. [Google Scholar] [CrossRef]
  23. Gangemi, A.; Suriano, R.; Fabio, R.A. Longitudinal Exploration of Cortical Brain Activity in Cognitive Fog: An EEG Study in Patients with and without Anosmia. J. Integr. Neurosci. 2024, 23, 105. [Google Scholar] [CrossRef]
  24. Koller-Schlaud, K.; Ströhle, A.; Bärwolf, E.; Behr, J.; Rentzsch, J. EEG Frontal Asymmetry and Theta Power in Unipolar and Bipolar Depression. J. Affect. Disord. 2020, 276, 501–510. [Google Scholar] [CrossRef]
  25. Soza, A.; Barroilhet, S.; Vohringer, P. A vestibular biomarker of manic and depressive phase in bipolar disorder. Asia Pac. J. Clin. Trials Nerv. Syst. Dis. 2017, 2, 140. Available online: https://www.researchgate.net/publication/320731620 (accessed on 31 July 2025). [CrossRef]
  26. Soza Ried, A.M.; Aviles, M. Asymmetries of vestibular dysfunction in major depression. Neuroscience 2007, 144, 128–134. [Google Scholar] [CrossRef]
  27. Sachs, G.; Anderer, P.; Dantendorfer, K.; Saletu, B. EEG mapping in patients with social phobia. Psychiatry Res. 2004, 131, 237–247. [Google Scholar] [CrossRef]
  28. Mohammadi, Y.; Hassan, M. Prediction of Depression Severity Scores Based on Functional Connectivity and Complexity of the EEG Signal. Clin. EEG Neurosci. 2021, 52, 52–60. [Google Scholar] [CrossRef]
  29. DeBattista, C.; Palmer, D.M.; Fitzgerald, P.B.; Harris, A.; deBeuss, R.; Gordon, E. Frontal and rostral anterior cingulate (rACC) theta EEG in depression: Implications for treatment outcome? Eur. Neuropsychopharmacol. J. Eur. Coll. Neuropsychopharmacol. 2015, 25, 1190–1200. [Google Scholar] [CrossRef]
  30. Shao, F.; Fang, J.; Wang, S.; Qiu, M.; Xi, D.; Jin, X.; Liu, J.; Shao, X.; Shen, Z.; Liang, Y.; et al. Anxiolytic effect of GABAergic neurons in the anterior cingulate cortex in a rat model of chronic inflammatory pain. Mol. Brain 2021, 14, 139. [Google Scholar] [CrossRef] [PubMed]
  31. Luscher, B.E.; Shen, Q.; Sahir, N. The GABAergic Deficit Hypothesis of Major Depressive Disorder. Mol. Psychiatry 2011, 16, 383–406. [Google Scholar] [CrossRef] [PubMed]
  32. Tiihonen, J.; Kuikka, J.; Rasanen, P.; Lepola, U.; Koponen, H.; Liuska, A.; Lehmusvaara, A.; Vainio, P.; Könönen, M.; Bergström, K.; et al. Cerebral benzodiazepine receptor binding and distribution in generalized anxiety disorder: A fractal analysis. Mol. Psychiatry 1997, 2, 463–471. [Google Scholar] [CrossRef]
  33. Bremner, J.D.; Innis, R.B.; Southwick, S.M.; Staib, L.; Zoghbi, S.; Charney, D.S. Decreased benzodiazepine receptor binding in prefrontal cortex in combat-related posttraumatic stress disorder. Am. J. Psychiatry 2000, 157, 1120–1126. [Google Scholar] [CrossRef] [PubMed]
  34. Ramakrishna, Y.; Sadeghi, S.G. Activation of GABA B receptors results in excitatory modulation of calyx terminals in rat semicircular canal cristae. J. Neurophysiol. 2020, 124, 962–972. [Google Scholar] [CrossRef]
  35. Jin, G.S.; Li, X.L.; Jin, Y.Z.; Kim, M.S.; Park, B.R. Role of peripheral vestibular receptors in the control of blood pressure following hypotension. Korean J. Physiol. Pharmacol. 2018, 22, 363–368. [Google Scholar] [CrossRef]
  36. Fergus, A.; Lee, K.S. GABAergic Regulation of Cerebral Microvascular Tone in the Rat. J. Cereb. Blood Flow. Metab. 1997, 17, 992–1003. [Google Scholar] [CrossRef] [PubMed]
  37. Bernard, R.; Kerman, I.A.; Thompson, R.C.; Jones, E.G.; Bunney, W.E.; Barchas, J.D.; Schatzberg, A.F.; Myers, R.M.; Akil, H.; Watson, S.J. Altered expression of glutamate signaling, growth factor, and glia genes in the locus coeruleus of patients with major depression. Mol. Psychiatry 2011, 16, 634–646. [Google Scholar] [CrossRef]
  38. Choudary, P.V.; Molnar, M.; Evans, S.J.; Tomita, H.; Li, J.Z.; Vawter, M.P.; Myers, R.M.; Bunney, W.E., Jr.; Akil, H.; Watson, S.J.; et al. Altered cortical glutamatergic and GABA ergic signal transmission with glial involvement in depression. Proc. Natl. Acad. Sci. USA 2005, 102, 15653–15658. [Google Scholar] [CrossRef]
  39. Kocsis, B.; Vertes, R.P. Dorsal raphe neurons: Synchronous discharge with the theta rhythm of the hippocampus in the freely behaving rat. J. Neurophysiol. 1992, 68, 1463–1467. [Google Scholar] [CrossRef] [PubMed]
  40. Halberstadt, A.L.; Balaban, C.D. Serotonergic and nonserotonergic neurons in the dorsal raphe nucleus send collateralized projections to both the vestibular nuclei and the central amygdaloid nucleus. Neuroscience 2006, 140, 1067–1077. [Google Scholar] [CrossRef] [PubMed]
  41. Cuccurazzu, B.; Halberstadt, A.L. Projections from the vestibular nuclei and nucleus prepositus hypoglossi to dorsal raphe nucleus in rats. Neurosci. Lett. 2008, 439, 70–74. [Google Scholar] [CrossRef]
  42. Plotnik, M.; Marlinski, V.; Goldberg, J.M. Efferent-mediated fluctuations in vestibular nerve discharge: A novel, positive-feedback mechanism of efferent control. J. Assoc. Res. Otolaryngol. 2005, 6, 311–323. [Google Scholar] [CrossRef]
  43. Tai, S.K.; Ma, J.; Ossenkopp, K.; Leung, L.S. Activation of immobility-related hippocampal theta by cholinergic septohippocampal neurons during vestibular stimulation. Hippocampus 2012, 22, 914–925. [Google Scholar] [CrossRef]
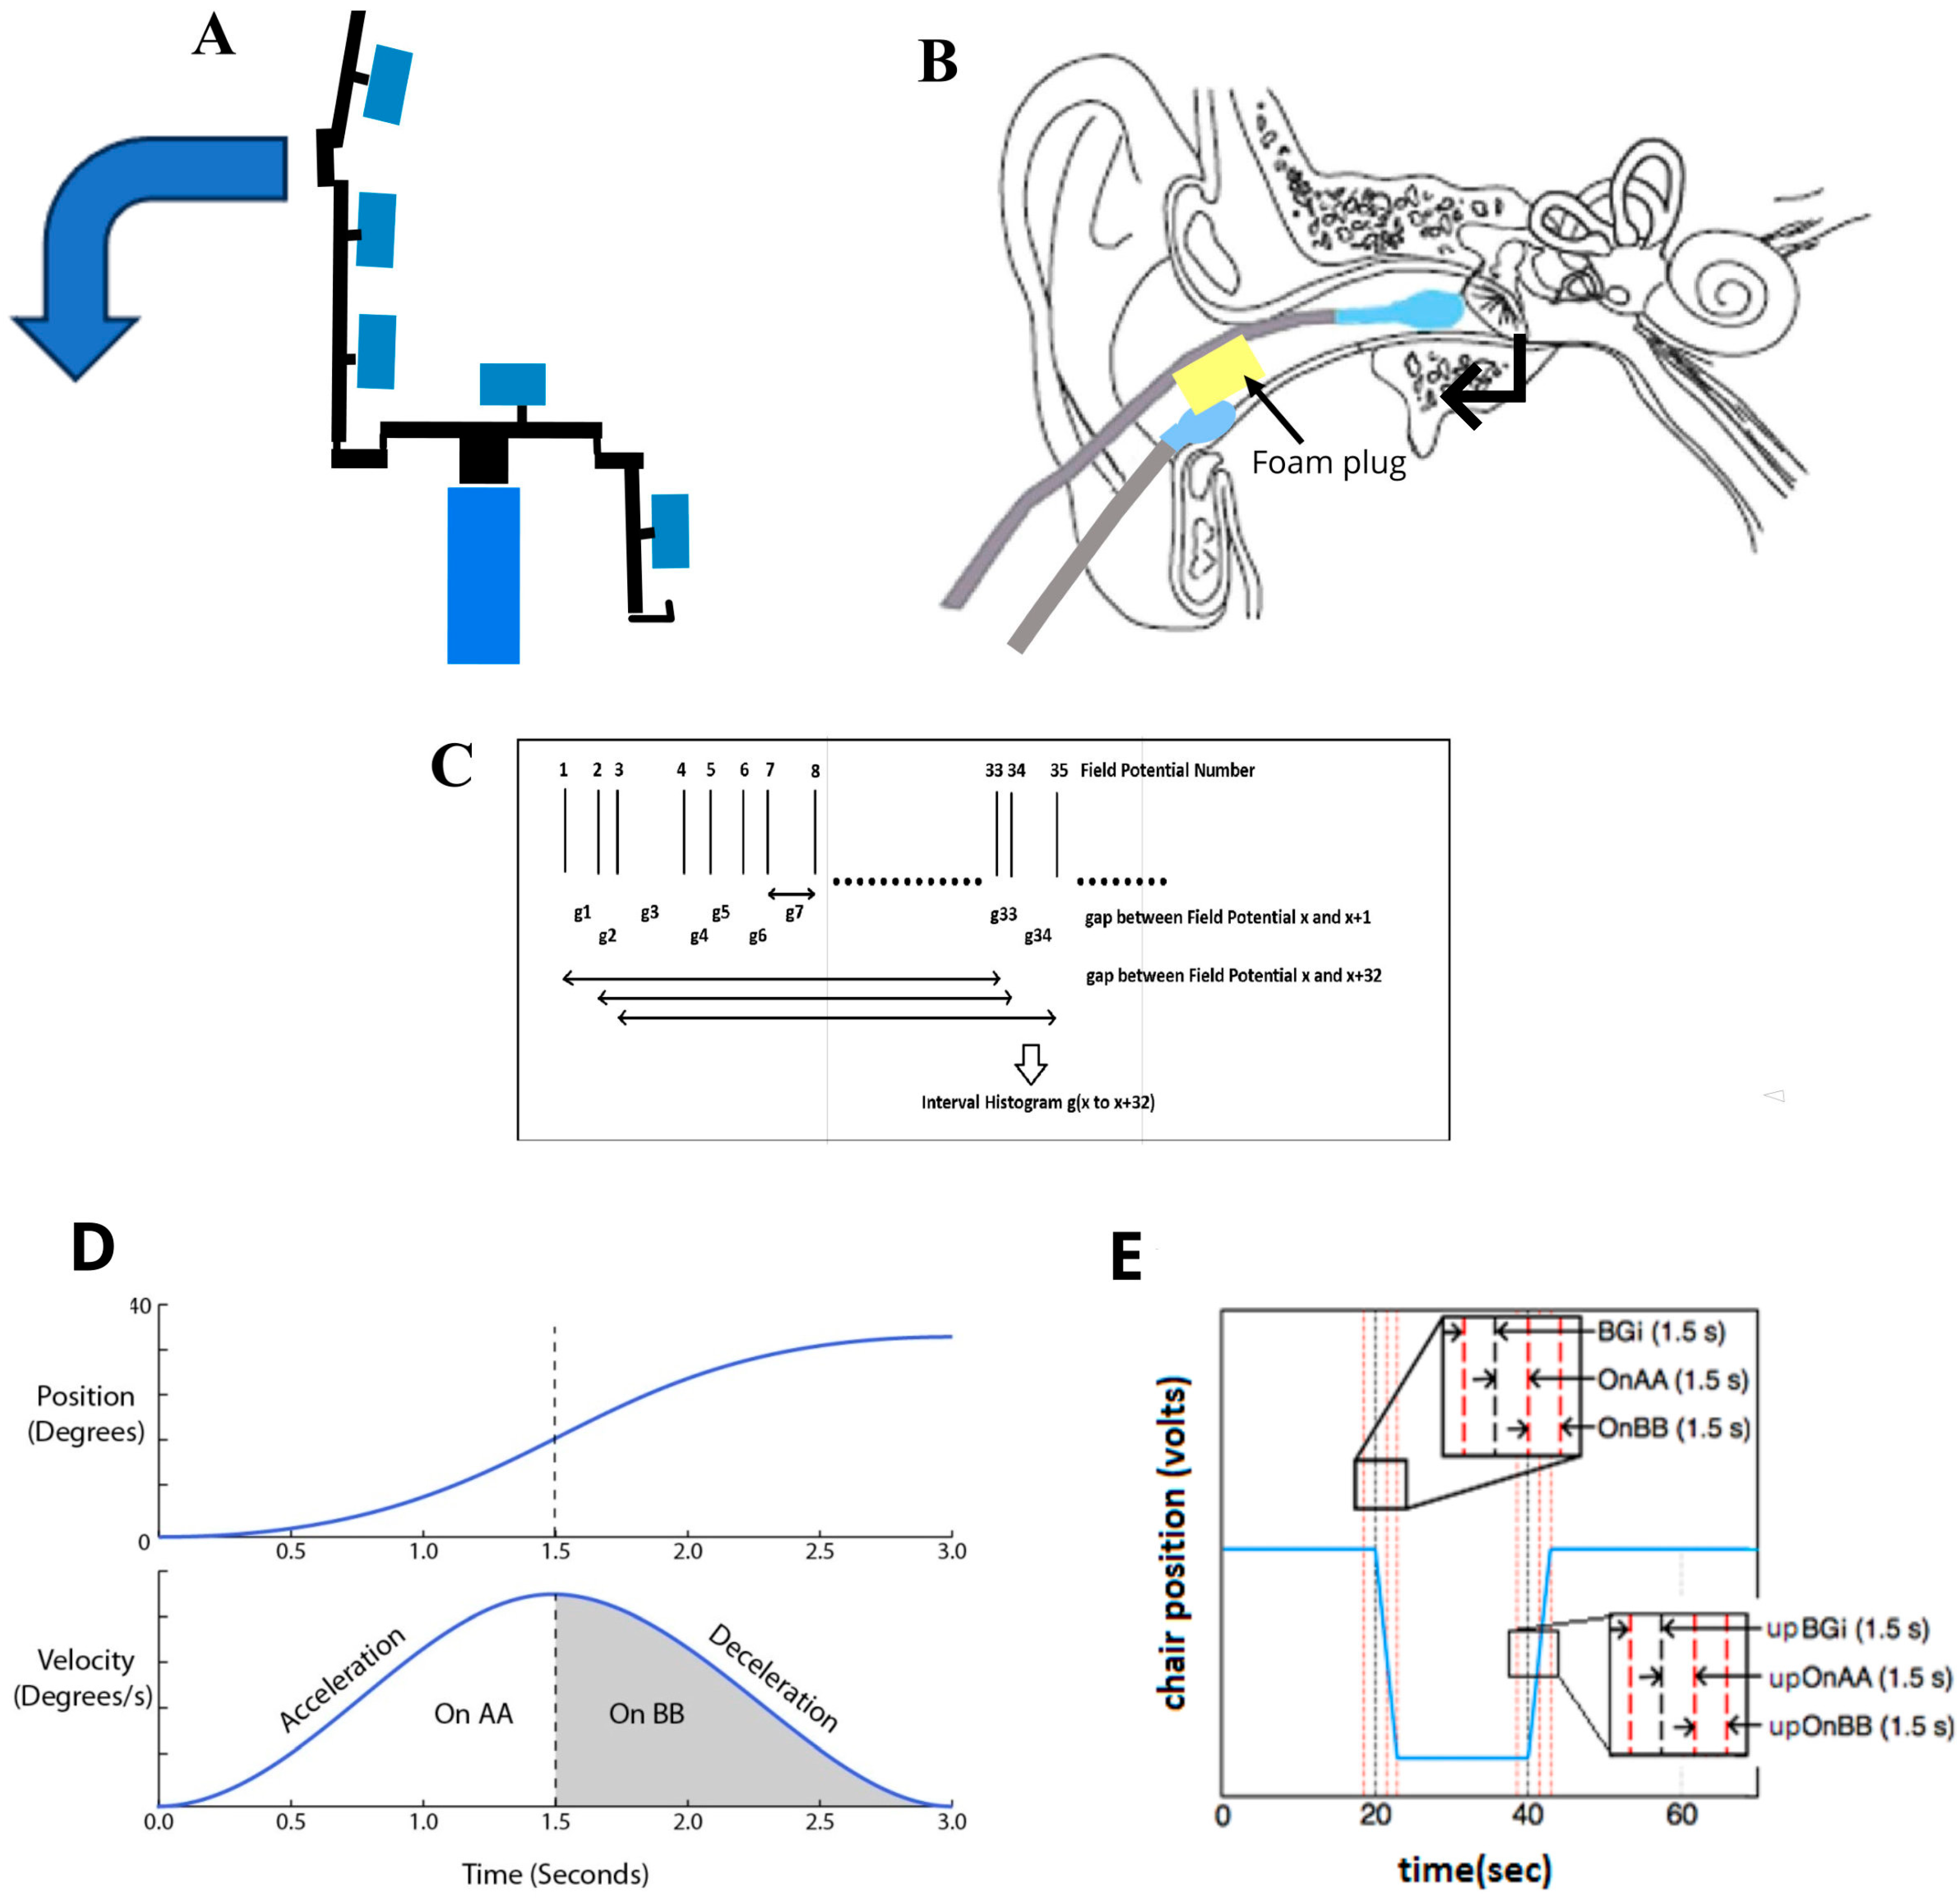
Figure 1. EVestG Recording. (A) The patient sits in a chair in an upright position for static (no movement) and backwards (pitch) tilt recordings. Large arrow indicated chair movement direction. Chair has pads on sides to support patient during motion. (B) Electrode connections. (C) IH33 timing information. (D) velocity profile for backwards tilt (BT). (E) Acceleration (on AA) and deceleration (on BB) phase definitions for backward tilt and subsequent return to centre.
Psychiatryint 06 00094 g001
Figure 2. Plot (A) shows an example set of IH33 left-side plots derived from the BT dynamic responses for the MDD population broken into its analysis subgroups (S = symptomatic, R = reduced symptomatic, anx = with anxiety disorder, no anx = without anxiety disorder). Plot (B) shows the same plot(s) derived from a matched (MADRS, age, gender) subpopulation. Plots (C,D) show the Diffanx (anxiety disorder group response minus no anxiety disorder group response) IH33 responses for the deceleration phase of a backward tilt when considered as S&R, R and S populations for the entire population and a matched subpopulation, respectively.
Psychiatryint 06 00094 g002
Figure 3. Plots (A,B) show the combined S&R anxiety disorder and no anxiety disorder (A), N = 42, a = 26, na = 16; (B), N = 28, a = 14, na = 14) IH33 left and right-side population responses. Plots (C,D) show right and left side anxious minus non-anxious (Diffanx) response curves for the entire population and a matched subset, respectively. Overlaid in red and dotted red are the right minus left (RmL) response curves for the respective populations and their unmedicated subpopulations. the set of static S (sub)population Diffanx plots (right column data). Plots (E,F) show the Diffanx response for the All and matched S (Symptomatic) left-side medicated and no-medication subpopulations. Error bars are 95% confidence intervals except in plots (E,F), which are SE.
Psychiatryint 06 00094 g003
Figure 4. Plot (A) shows a 2D plot of matched anxious (N = 14) versus non-anxious (N = 14) subjects using features F2 and F3 for classification. Plot (B) shows the remaining population (an additional 14 subjects) presented on top of the same plot and axes. The R and S subpopulations are shown as circles and squares, respectively. Line separators (same in plots (A,B)) are shown as an aid for visual grouping.
Psychiatryint 06 00094 g004
Table 1. MDD study participant demographics and assessments (Mean ± Standard Deviation). R = reduced symptomatic, S = symptomatic.
DiagnosisAgeYears Since DiagnosisMMSE TotalMADRSCORE
MDD-R Asymptomatic or Mild
n = 22 (10 males), 10 with anxiety disorder, MADRS ≤ 19
50.6 ± 13.315.8 ± 11.128.8 ± 1.312.3 ± 4.45.3 ± 4.3
MDD-S, Moderate–Severe
n = 20 (8 males), 16 with anxiety disorder, MADRS ≥ 20
44.1 ± 11.116.2 ± 6.729.1 ± 1.327.7 ± 6.39.4 ± 7.0
MDD (MDD-R and MDD-S)
n = 42 (18 males), 26 with anxiety disorder
47.2 ± 12.716.0 ± 9.229.0 ± 1.320.4 ± 9.47.4 ± 6.4
Table 2. Feature definitions from matched populations.
Definition
F1 = BT left decelerationValue of the 10.8 Hz bin during the deceleration phase of the backwards (BT, pitch) tilt (see Figure 2D).
F2 = RmL S non-medicated population static.A total of 12.1 Hz minus 9.8 Hz bins (see Figure 3F).
This feature emphasizes the large changes between the matched non-medicated and medicated S matched populations.
F3 = BT left deceleration S population.A total of 10.8 Hz minus 13.1 Hz bin plus/minus the 8.9 Hz bin (S/R).
Selected based on the main peaks/troughs in Figure 2D.
Table 3. Statistical analysis of features. S = symptomatic, R = reduced symptomatic, a = anxious, na = non-anxious. Matched represents matched for age, gender and MADRS.
A. ROC
(a = anxious, na = non-anxious)F1F2F3
S&R All (26,16), matched (14,14)0.74, 0.790.69, 0.790.73, 0.77
R All (10,10), matched (6,8)0.77, 0.920.80, 0.920.81, 0.90
S All (16,6), matched (8,6)0.59, 0.630.69, 0.710.64, 0.75
B. Feature Significance (Matched populations)
FeatureQuade ANCOVA
F1: S&R matched (14,14)F(1,26) = 6.52p = 0.017η2 = −0.20power = 0.691
R matched (6,8)F(1,12) = 5.770.0330.330.60
S matched (8,6)F(1,12) = 0.760.3990.060.13
F2: S&R matched (14,14)F(1,26) = 6.720.0080.240.78
R matched (6,8)F(1,12) = 5.710.0340.330.59
S matched (8,6)F(1,12) = 3.650.0800.230.42
F3: S&R matched (14,14)F(1,26) = 10.150.0040.280.87
R matched (6,8)F(1,12) = 5.500.0370.310.58
S matched (8,6)F(1,12) = 1.7100.2150.130.23
Covariates: Age, Gender, MADRS
C. Kernal Density Estimate of Distribution and Naïve Bayes Classifier
All, Accuracy (%)Matched, Accuracy (%)
S&R (42)R (20)S (22)S&R (28)R (14)S (14)
F171.460.036.475.085.750.0
F266.775.068.275.078.571.4
F376.275.072.778.685.771.4
F1, F269.080.059.178.685.764.3
F2, F373.880.077.378.685.778.5
F1, F369.075.072.778.692.964.3
F1, F2, F371.475.072.778.685.771.4
Accuracy = 1 − cross-validated error. Leave-one-out cross-validation was applied.
Table 4. Correlations (Spearman’s Rho); ** significant at 0.01 level.
F1F2F3MADRS
F110.350.76 **0.17
F2 10.32−0.07
F3 10.50 **
Disclaimer/Publisher’s Note: The statements, opinions and data contained in all publications are solely those of the individual author(s) and contributor(s) and not of MDPI and/or the editor(s). MDPI and/or the editor(s) disclaim responsibility for any injury to people or property resulting from any ideas, methods, instructions or products referred to in the content.