Article

NTRK Gene Expression in Non-Small-Cell Lung Cancer

by
Jair Gutierrez-Herrera
1,
M. Angeles Montero-Fernandez
2,
Georgia Kokaraki
3,
Luigi De Petris
3,4,
Raul Maia Falcão
5,
Manuel Molina-Centelles
1,
Ricardo Guijarro
3,6,
Simon Ekman
3,4 and
Cristian Ortiz-Villalón
3,7,*
1
Department of Clinical Pathology and Cancer Diagnostics, Karolinska University Hospital, 182 88 Stockholm, Sweden
2
Department of Cellular Pathology, Liverpool University NHS Foundation Trust, Liverpool L7 8XP, UK
3
Department of Oncology-Pathology (Onkpat), Karolinska Institute, 171 64 Stockholm, Sweden
4
Theme Cancer, Thoracic Oncology Center, Karolinska University Hospital, 171 76 Stockholm, Sweden
5
Metrópole Digital Institute, Federal University of Rio Grande do Norte, Natal 59066-800, Brazil
6
Department of Surgery, Valencia University, 46010 Valencia, Spain
7
Department of Clinical Genetics, Pathology and Molecular Diagnostics, Malmö University Hospital, 205 02 Malmö, Sweden
*
Author to whom correspondence should be addressed.
J. Respir. 2025, 5(1), 2; https://doi.org/10.3390/jor5010002
Submission received: 3 December 2024 / Revised: 24 January 2025 / Accepted: 4 February 2025 / Published: 27 February 2025
(This article belongs to the Collection Feature Papers in Journal of Respiration)

Abstract

:
Background/Objectives: Since the discovery of oncogenic neurotrophic receptor tyrosine kinase (NTRK) gene fusions in colorectal cancer in 1986, their understanding has evolved, particularly in non-small-cell lung cancer (NSCLC) over the past five years. NTRK rearrangements, involving NTRK1, NTRK2, and NTRK3, drive tumorigenesis and have been identified in various adult and pediatric cancers, with over 80 different fusion variants in several type of cancers. Detecting these rearrangements is crucial for targeted therapy strategies. The aim of this study is detect, compare and analyse these mutations in NSCLC patients of a cohort of 482 cases from Karolinska University Hospital. Methods: We conducted an initial screening using pan-TRK immunohistochemistry (IHC) to analyze the material. Positive cases were further examined through whole-exome sequencing (WES) with next-generation sequencing (NGS) to confirm the presence of fusions. Additionally, to deepen our understanding, we utilized Ingenuity Pathway Analysis (IPA) software, an artificial intelligence-driven technology, to explore the molecular pathways involved in lung cancer. Results: TRK overexpression was detected in 4.56% of cases via IHC. Among 15 pan-TRK-positive cases, WES confirmed fusions in 3, revealing a higher prevalence of NTRK1 (6.6%) and NTRK2 (13.3%) fusions, while no NTRK3 fusions were observed. Conclusions: Our findings confirm the low prevalence of these neoplasms as well as the need for a molecular test to confirm rearrangements or other potentially treatable mutations and raise other questions regarding their clinical use. However, there is an acceptable correlation between pan-TRK IHC and NTRK mutations, but not enough to determine NTRK fusions.

1. Introduction

Lung cancer is the leading cause of cancer-related death and the second most common cancer worldwide [1]. In the last 15 years, new actionable molecular alterations associated with lung cancer have been discovered, and promising therapies are changing the clinical outcome across all stages. Among these new therapeutic alternatives, new drugs targeting NTRK are emerging as new treatment options for advanced non-small-cell lung cancer (NSCLC) [2].
The neurotrophic tropomyosin receptor kinases TRKA, TRKB and TRKC are a family of transmembrane tyrosine kinases that are essential players in neural development [3,4]. Encoded by NTRK1, NTRK2, and NTRK3 genes, these receptors can undergo oncogenic rearrangements with several partner genes, leading to somatic fusions in several types of tumors including lung cancer [5,6,7,8]. Fusion events lead to receptor activation or overexpression, driving oncogenesis [1,9]. Neurotrophin binding to the TRK receptor’s extracellular region typically triggers receptor dimerization, transphosphorylation, and downstream signaling [10,11] (Figure 1). Additionally, neurotrophins can bind to the p75NTR receptor, which modestly interacts with NGF [12,13].
NTRK rearrangements are uncommon in solid tumors with a wide range of frequency from less than 5% in NSCLC to more than 90% in secretory breast carcinoma, among others [14,15,16,17,18].
Although fusion can occur in any NTRK gene, most of those identified occurred in NTRK1 and NTRK3 [8]; NTRK1 and NTRK2 predominate in lung cancer [2]. TRK fusion proteins are frequently mutually exclusive with other known kinase fusion proteins. While rearrangements involving the NTRK1, NTRK2, and NTRK3 genes are the most common mechanisms of TRK protein activation and aberrant expression, other molecular pathways that can affect their function have been reported [19].
Receptor tyrosine kinase inhibitors (RTKIs) for lung cancer patients with activating mutations in cancer driver genes, such as EGFR, ALK, and ROS1, have already been approved. EGFR followed by KRAS mutations are the most common [20,21,22,23,24,25,26], and currently, one-third of patients with NSCLC have a therapeutically targetable driver oncogene [18]. NTRK fusions have recently been considered as a therapeutic option for patients with metastatic cancers, resulting in response rates from 50 to 80%, along with significant improvements in progression-free and overall survival [7,11,14]. Larotrectinib [27,28] is an example of a highly selective RTKI that blocks TRKA/B/C, demonstrating over 75% response rates across different tumor types and age groups. Similarly, Entrectinib targets multiple kinases and has reported a 59.3% response rate along with a 7.4% rate of complete remission [7,21,29].
Immunohistochemistry (IHC) detects TRK overexpression as a surrogate marker for NTRK fusion, showing 97% sensitivity and 98% specificity. It offers a spatial assessment of fusions, has a short turnaround time, and requires less tissue material [9,30,31]. FISH and RT-PCR are effective alternatives to NGS in detecting NTRK rearrangements. RT-PCR is specific, faster, and less expensive than NGS, with high sensitivity and multiplexing capabilities, but requires experienced trained pathologists in fusion pairs [9,15,32].
Clinical detection of NTRK fusions relies on NGS, but not all platforms can detect all fusions (including DNA-based), particularly those involving NTRK2 and NTRK3, due to vast intronic regions. In lung adenocarcinoma (ADC), RNA-based NGS identifies gene fusions, including NTRK [18,31,33]. Other technologies, such as RNA nanostrings and hybrid DNA/RNA panels, use hybridization capture to enrich gene libraries before sequencing, but they may miss novel or unreported fusions [34]. Up-to-date RNA-based NGS methods are the reference standard for NTRK screening [35].
The purpose of our study was to compare a recently validated pan-TRK clone, EPR17341, from a prior study in a cohort of NSCLC with WES analysis. Ingenuity Pathway Analysis (IPA) was also tested as an innovative tool for molecular diagnosis.

2. Materials and Methods

Tumors from 482 patients who underwent curative-intent surgery between 1987 and 2005 were selected for clinicopathological analysis. In retrospect, formalin-fixed paraffin-embedded (FFPE) archival surgical tumor samples were obtained from Karolinska University Hospital (Stockholm, Sweden), Sweden. The specimens represented only material resected from lobectomies and were processed following the pathology department’s routine procedures. Clinicopathological information on the patient cohort was obtained from medical records and pathology reports. Tumors were re-staged according to the 8th edition of the UICC/AJCC staging system.
Karolinska University Hospital granted ethical approval in accordance with the Declaration of Helsinki (No. 2005/588-31/4 + Amendment 2008/136-32). Since this was a retrospective study, the ethics committee waived the requirement for informed consent. Cases were identified from the Swedish National Lung Cancer Registry. The data cutoff for outcome analysis was 31 May 2010. Surgical tumor samples, information regarding clinical tumor characteristics, and survival outcomes were manually retrieved from electronic medical records.
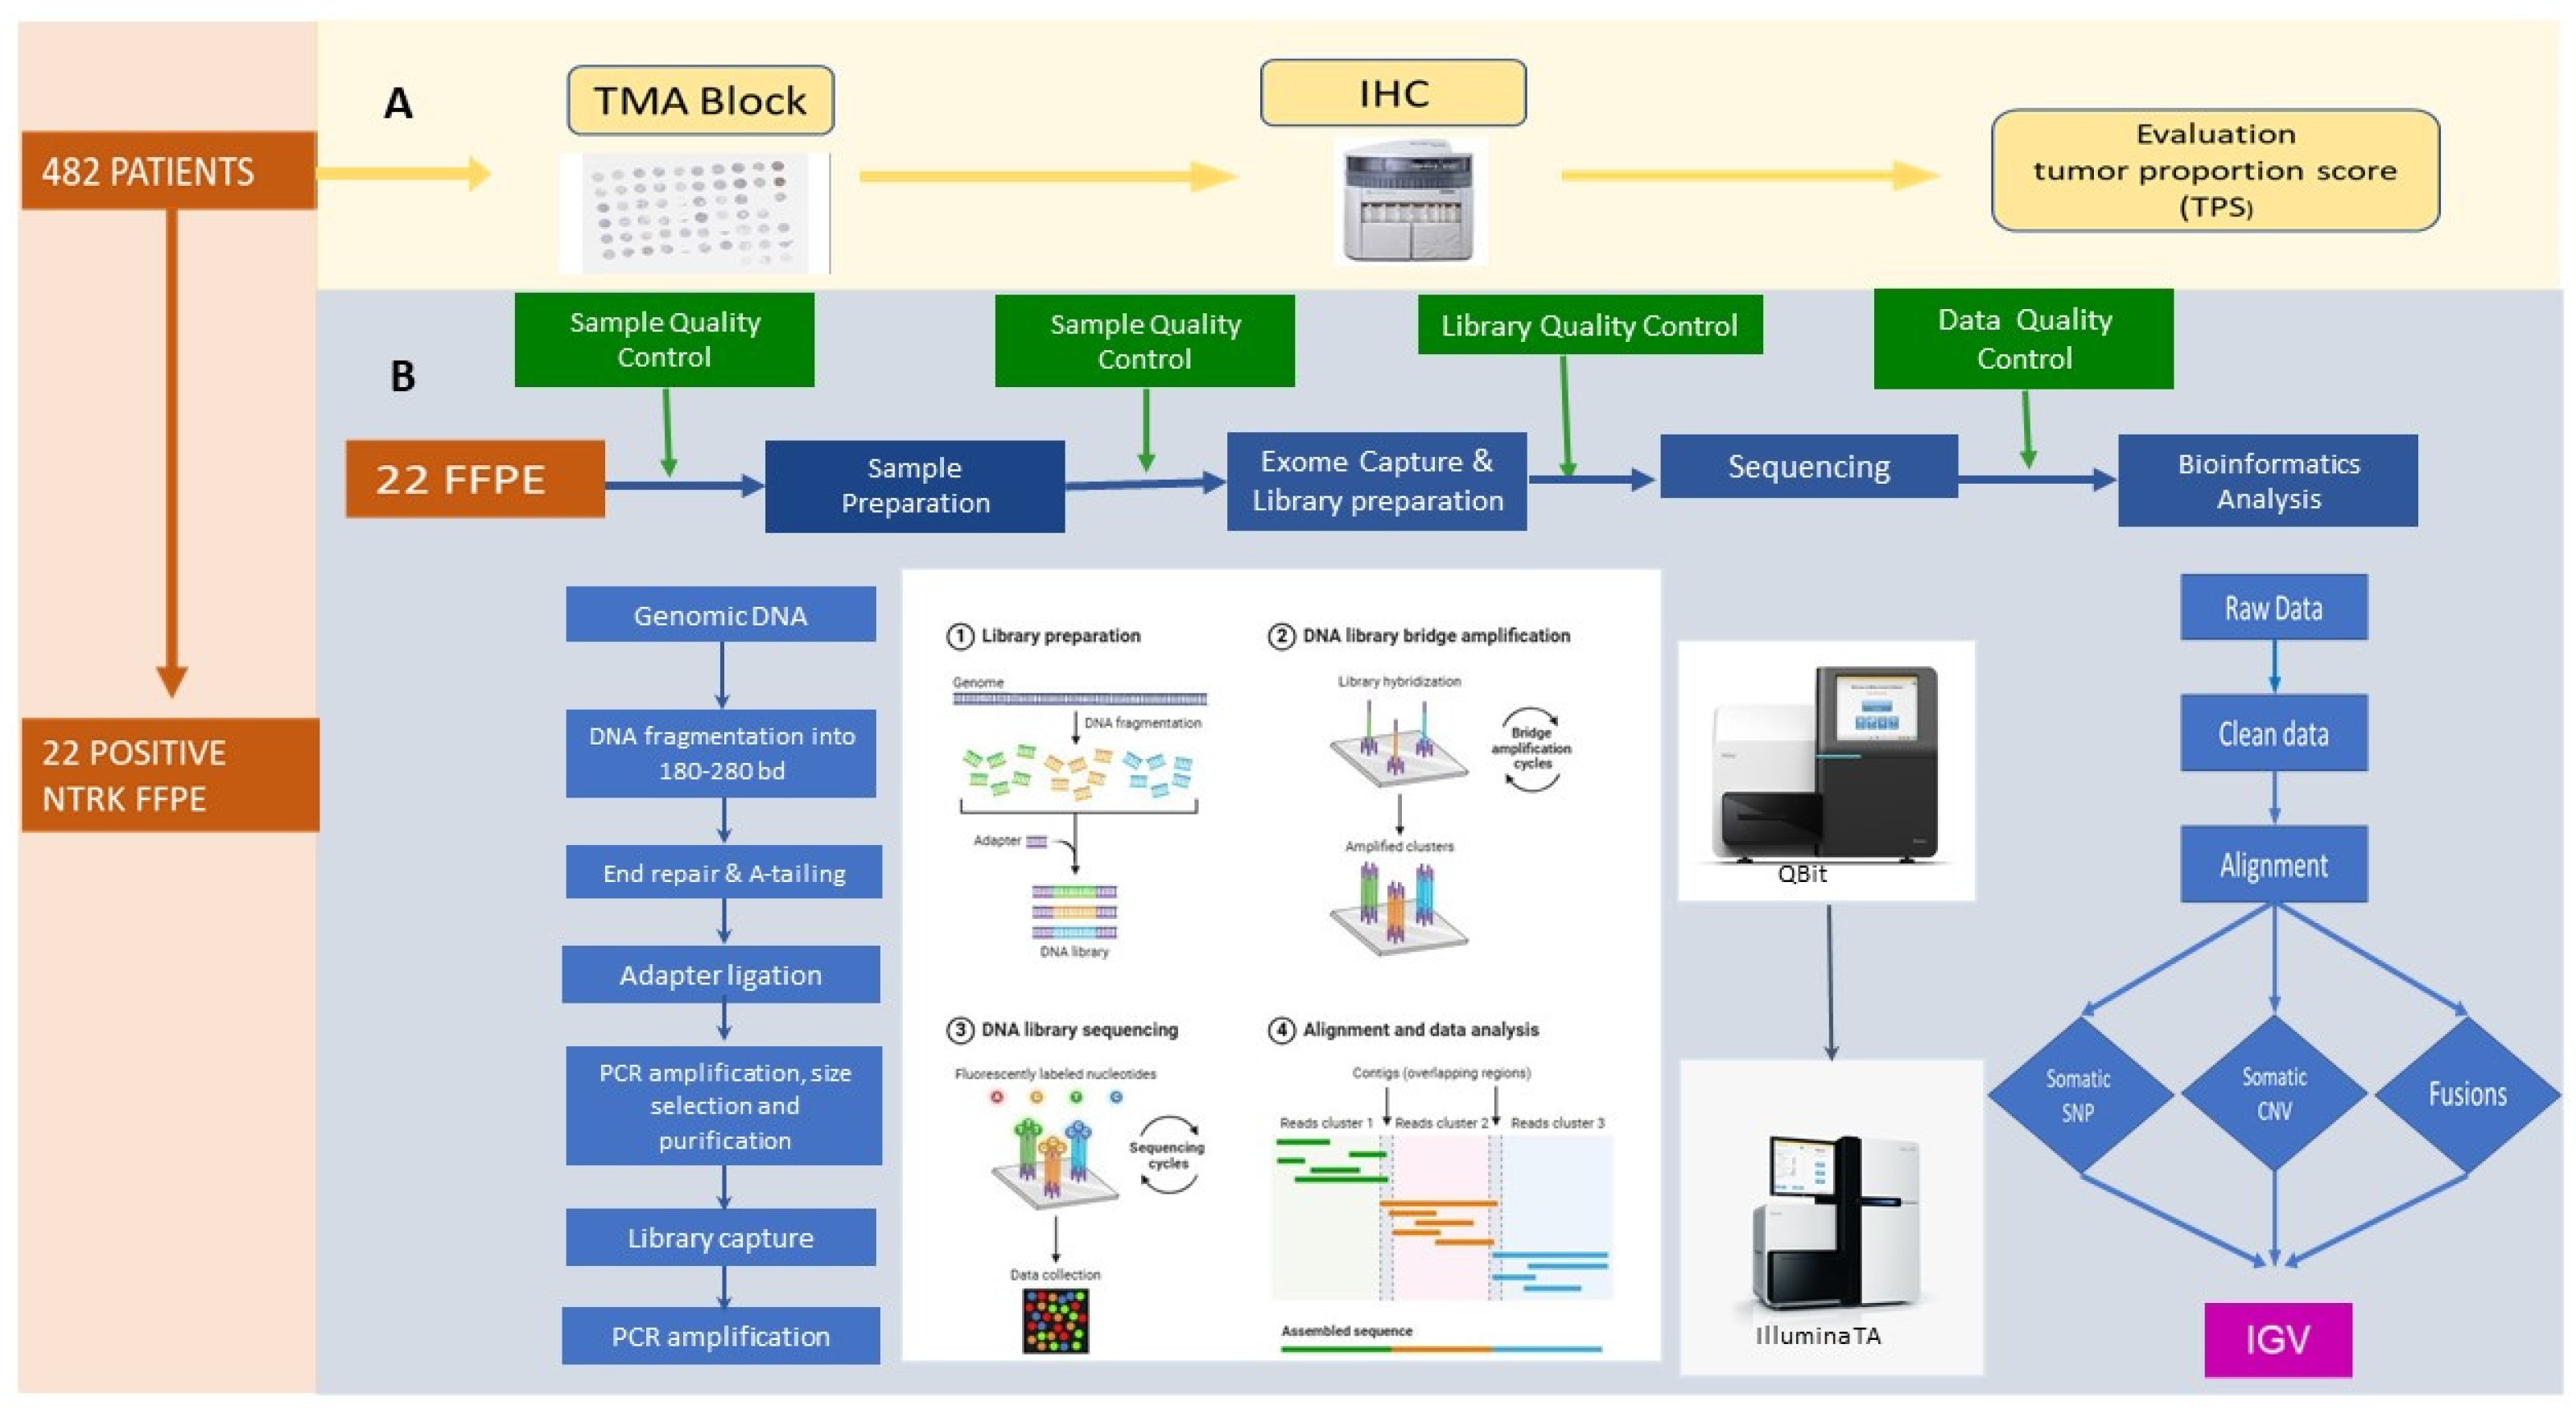
The pipeline started with the construction of tissue microarrays (TMAs). After pathological evaluation, cases with positivity for TRK by immunohistochemistry were selected, and whole-exome sequencing (WES-NGS) was undergone once quality control was carried out.

2.1. Construction and Immunohistochemistry of TMA

FFPE archival surgical tumor samples were retrieved and placed in TMAs with duplicate 1 mm cores. The cores were taken from the center and the periphery of the tumor due to the heterogeneity of the malignancies. The total number of blocks obtained was 20. Each block was stained with the rabbit monoclonal TRK antibody (anti-Pan Trk antibody clone EPR17341 Abcam). Tissue sections (4 µm) and external controls were processed identically using the staining protocols. For immunostaining, the Ventana Benchmark Ultra platform (Ventana Medical Systems, Tucson, AZ, USA) was used with protease 3 (0.24 casein U/mL) as proteolytic pretreatment, incubation of the antibody for 56 min at 36 °C, and use of the OptiView DAB (amplification) kit (Tucson, AZ, USA), after cell conditioning for 72 min (CC1, pH 8) at 100 °C according to the standard manufacturing protocol, and was used at 30 µg/mL (dilution factor 1:50). Muscle and nerve tissue was used as positive internal control. Negative controls included kidney, liver, pancreas, or colon tissue.

2.2. Evaluation of TRK Expression by IHC

Pan-TRK staining was assessed by evaluating the expression of the antibody in the nucleus and membrane following the recommendations of ASCO/ESMO and previous publications [5,36]. The percentage of tumor cells stained was evaluated based on a tumor proportion score (TPS), with a minimum of 100 tumor cells to evaluate. The TPS was scored as 0 when the staining was negative; 1 when >1–10% of tumor cells were positive and had lower stain intensity; 2 when medium positivity occurred (10–50% of cells); and 3 when the staining had strong positivity (>50% of cells). Blind observations were performed by two independent pathologists (CO and JG), and a harmonization score was obtained for the discordant results. Tumors with positive staining, regardless of intensity and TPS, were selected for NGS analysis. The slides were scanned with a Hamamatsu scanner (Hamamatsu Photonics K.K., Shizuoka, Japan) and re-evaluated, reviewing the digitized images of the TMAs using NDP.viewer (v2.7.25). The highest score of the two cores was considered representative of the case. If one of the cores was missing, the remainder was used for scoring.

2.3. Sample Preparation for Whole-Exome Sequencing and Bioinformatics Analysis

High-molecular-weight DNA was extracted from formalin-fixed, paraffin-embedded (FFPE) tumor tissues from 22 NSCLC patients using the AllPrep DNA/RNA FFPE kit (Qiagen, Hilden, Germany) according to the manufacturer’s instructions [37]. The genomic DNA was randomly sheared into short fragments with the size of 180–280 bp. It was end-repaired, A-tailed, and further ligated with Illumina adapters (DNA-Seq Adapter, Oligonucleotide sequences for DNA Sample Preparation Kits). The fragments with adapters were amplified by PCR, size-selected, and purified. The captured libraries were enriched by PCR amplification, and quantified libraries were pooled and sequenced on the Illumina Novaseq 6000 platform (Illumina, San Diego, CA, USA) with the PE150 strategy. In all steps, for quantity and quality control, we used Qubit and real-time PCR for quantification and a bioanalyzer (Thermo Fisher Scientific, Willow Creek Road, San Diego, CA, USA) for size distribution detection.
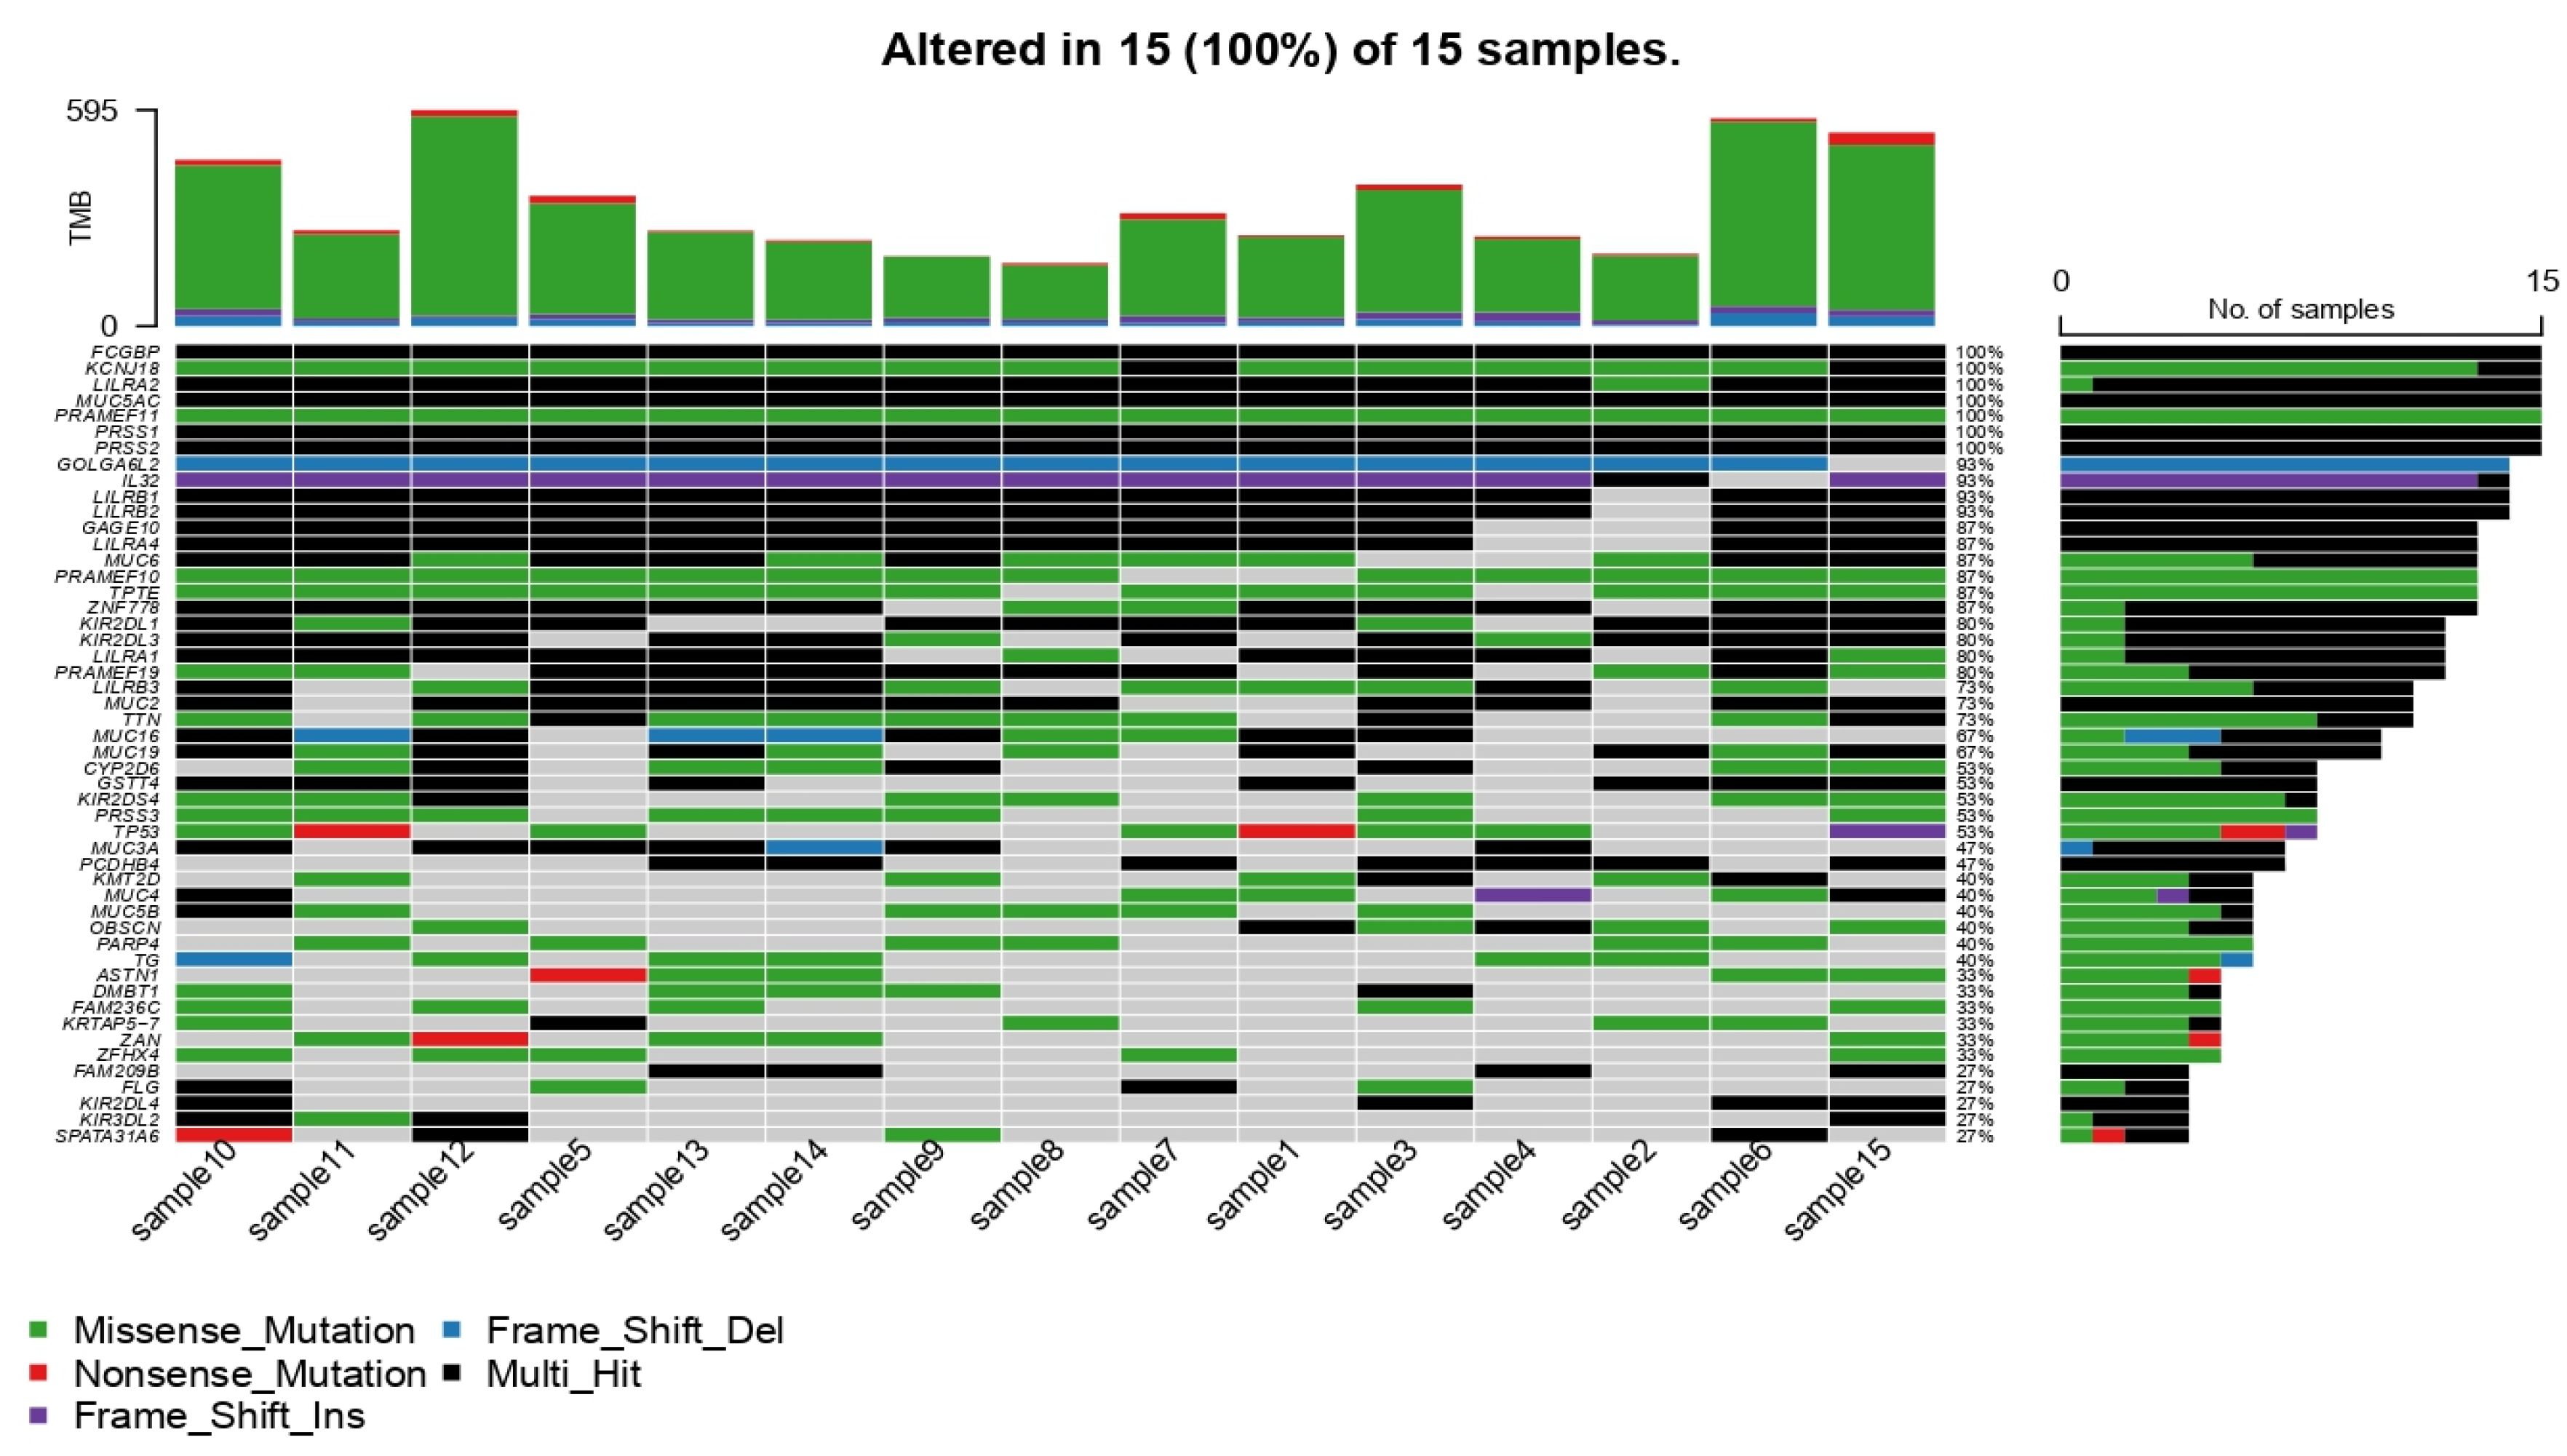
The analysis pipeline was based on Genome Analysis Toolkit best-practice guidelines (GATK). Fastq files were assessed with FastQC (v 0.11.9), and adapter removal as well as trimming bad-quality base calls were performed by Trim-galore (v 0.6.6). All clean paired-end reads were aligned to the GRCh38.p13 human genome reference using the Burrows–Wheeler Aligner (BWA) alignment algorithm [38]. SAMtools (v.1.9) was used for filtering the binary alignment map (BAM files), and Picard was utilized to mark duplicate reads [39]. Variant calling was performed by Deepvariant using whole-exome sequencing mode [40]. Vcftools (v 0.1.16) was used to keep variants. To keep only variants occurring in exons, we used the intersectBed (v 2.30.0) tool. The SnpEff (v 4.3) tool was used to annotate the resulting variants [41]. Mutation annotation format (maf) files were used in the maftools R package (v.2.22.0) to summarize, analyze, and visualize the mutation set [42] (Figure 2).
The circular binary segmentation (CBS) algorithm from CNV kit (v 0.9.9) was used to create segmentation files to detect copy number alterations (CNAs) by GISTIC (v 2.0.23) and then its results were used in maftools for visualization. To detect and visualize NTRK rearrangements, we used the FuSeq WES (v1.0.0) tool. Only gene fusions with read support greater than or equal to 5 were considered. All gene fusions were inspected, visualized, and identified in the Integrative Genomics Viewer (IGV) web app [43].
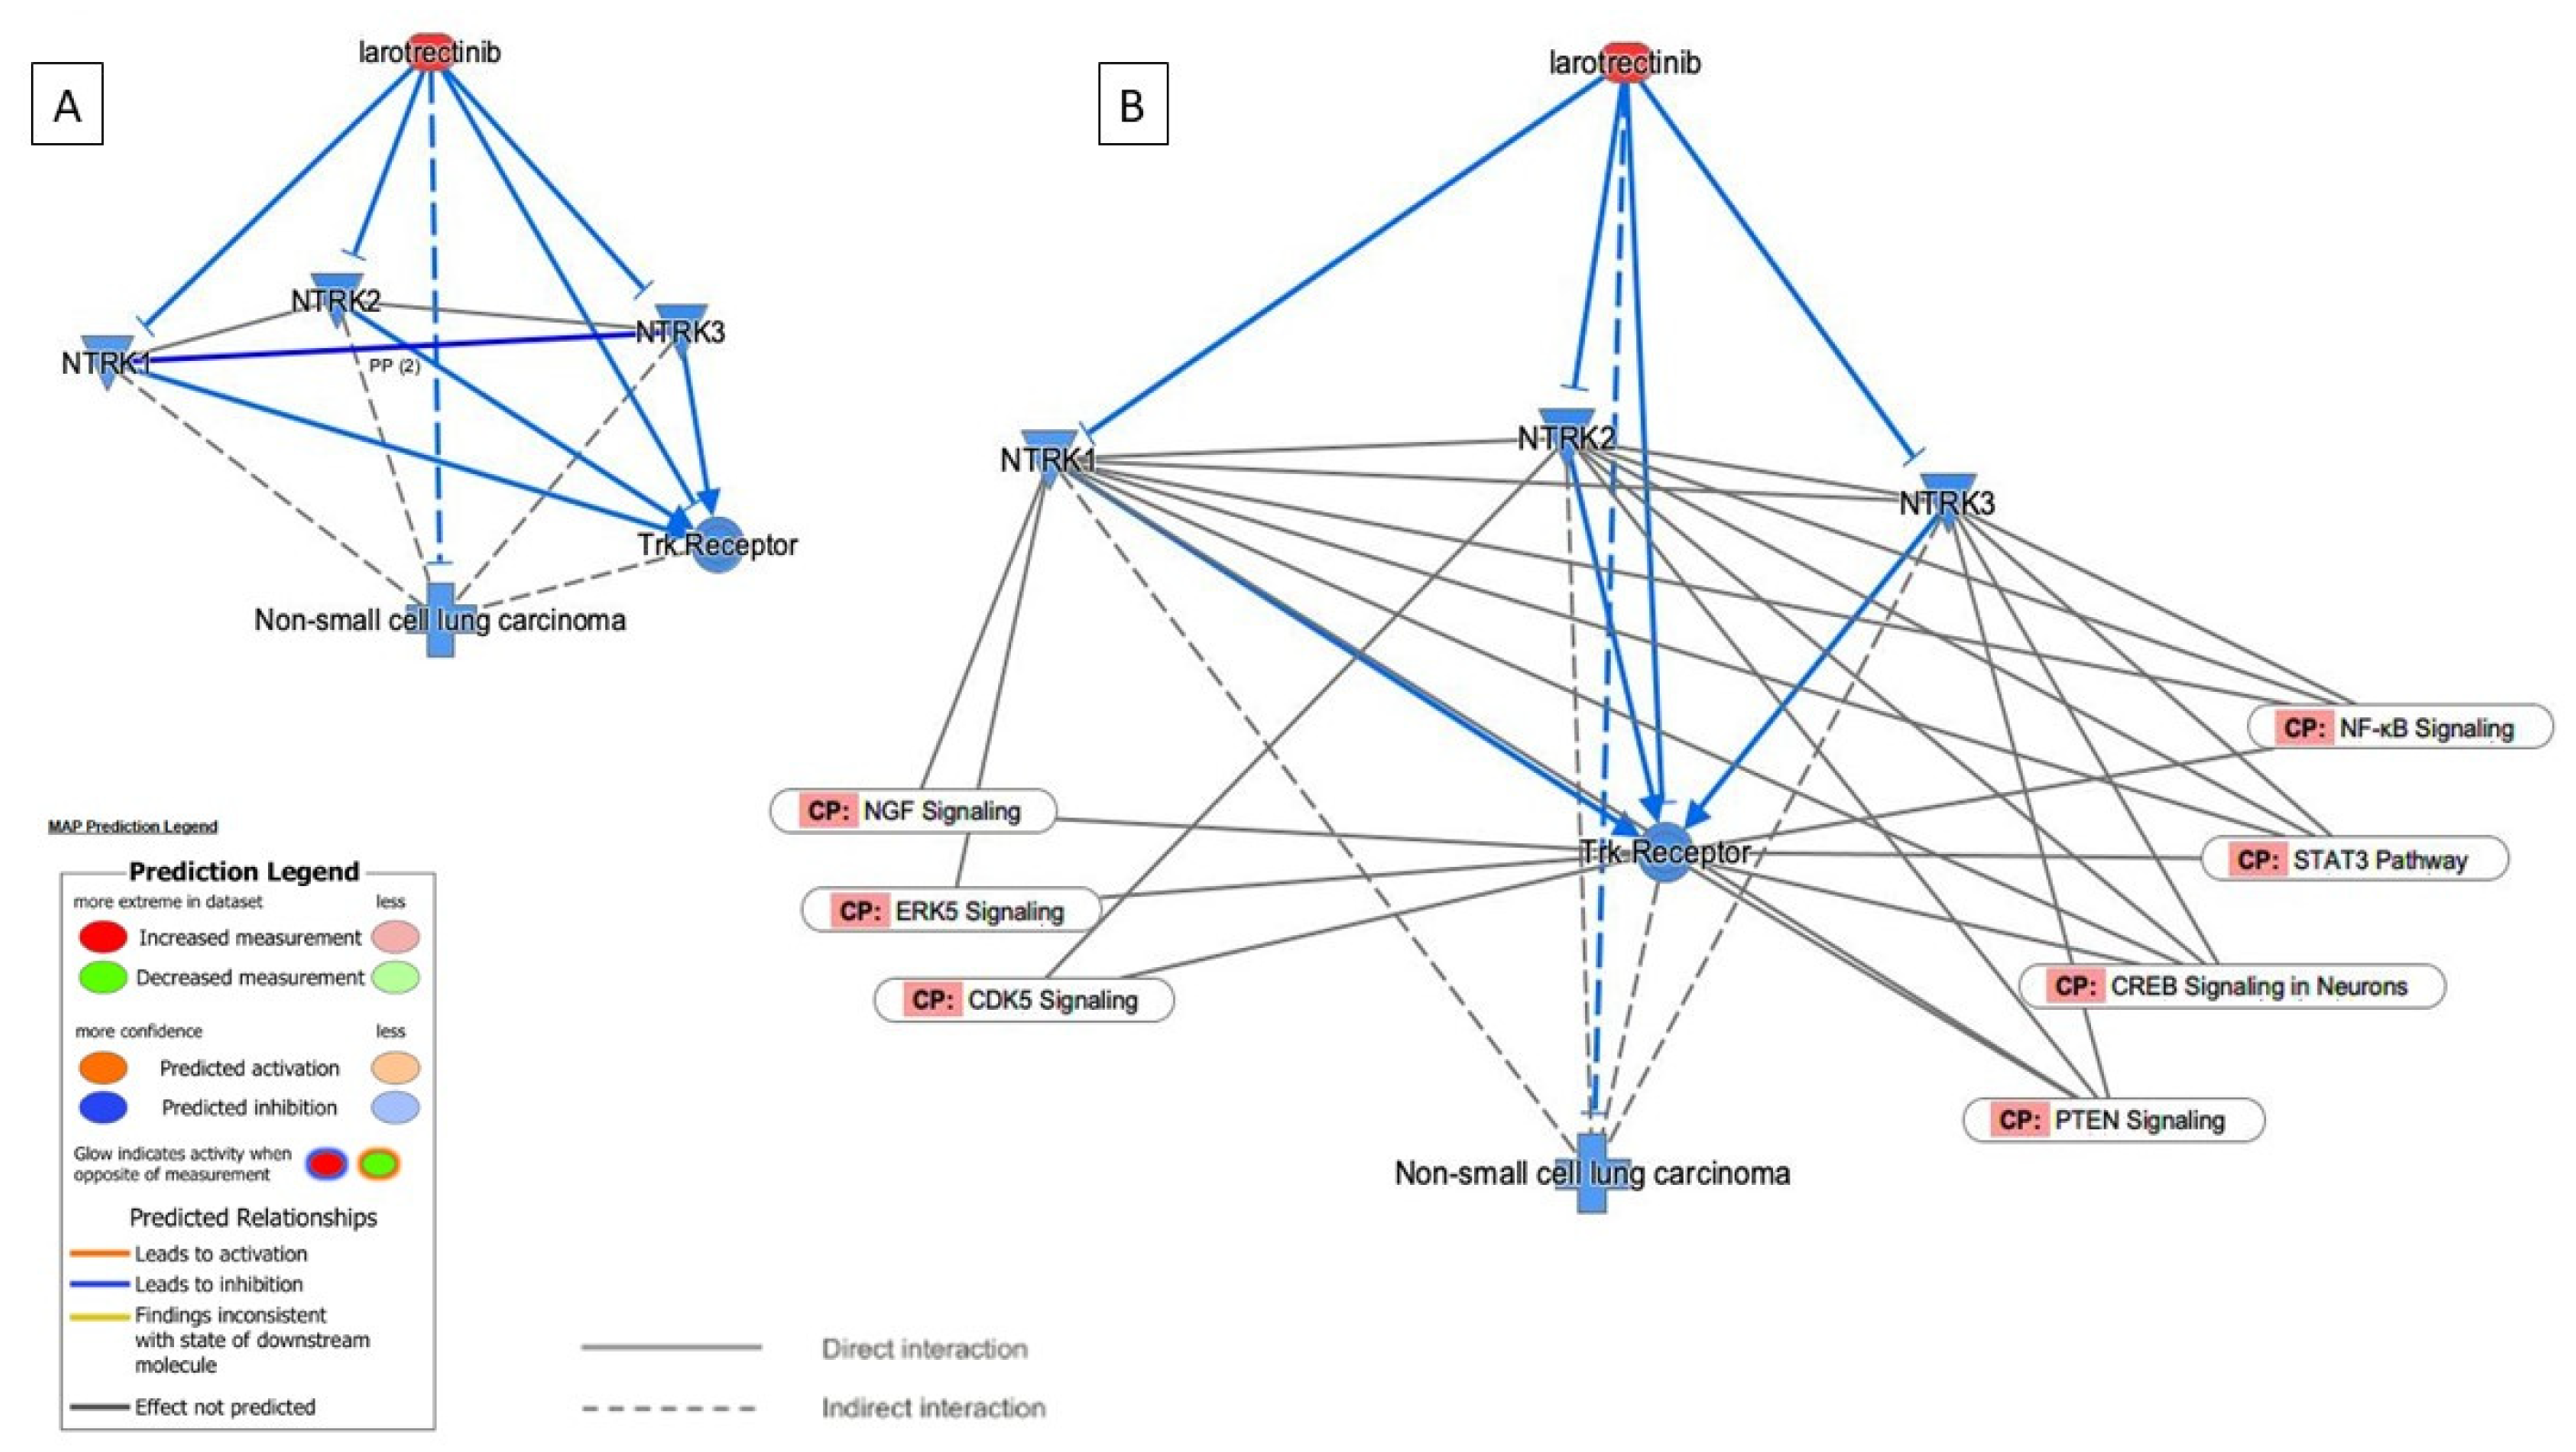
Finally, our dataset was analyzed using Ingenuity Pathway Analysis v.22.0.2 (IPA, Qiagen), a cutting-edge software that utilizes artificial intelligence algorithms to infer and score regulatory networks upstream of gene expression. IPA incorporates a vast collection of nearly 5 million references from external databases and the biomedical literature. The network comprises 40,000 nodes representing mammalian genes, chemical substances, microRNA molecules, and biological processes. With over 1,480,000 connections, the software provides empirically verified cause-and-effect relationships, encompassing molecular modification, transport, activation, expression, transcription, and binding events. This approach leverages existing knowledge to predict downstream effects on biological functions and diseases [44,45,46].

2.4. Statistical Methods

Statistical analyses were performed using IBM SPSS Statistics v.29 software. A significance level of p < 0.05 was considered as significant.
Overall survival analysis involved Kaplan–Meier graphs (log-rank test), Cox regression, and cross-tabulation for subgroup models based on antibody-positive ranges. Age and sex were included for adjustment in the multivariate Cox regression analysis. Associations between two discrete variables were evaluated using the X2 statistic. Variables from the univariate and multivariate survival analysis with a p-value < 0.05 were entered to investigate their independent contribution as prognostic factors.

3. Results

3.1. Patient and Tumor Characteristics

The patient cohort used for the clinicopathological study consisted of 482 patients with a median age of 68 years (39–86). The male/female sex ratio was 1.2:1. The histological subtypes included adenocarcinoma (AdCa) (60.6%), squamous cell carcinoma (SqCC) (33%), and large cell carcinoma (LCC) (6%). The pT (extent of the tumor) category was as follows: T1 (36%) and T2–T4 (64%). The p-stage was as follows: IA (37.2%), IB (39.6%), IIA (10%), IIB (11.4%), IIIA (1,2%), and IIIB–IV (0.4%); grade 3 tumors were the most predominant (43.2%) (Supplementary Table S1).

3.2. TRK Immunohistochemical Staining

Tumors exhibiting positive TRK expression were identified when there was staining of TRK in the membrane, cytoplasm, perinuclear region, or nucleus of at least 1% of tumor cells [16]. The majority of tumor tissues tested negative with the EPR17341 clone. Positive staining for TRK was detected in 22 of 482 cases (4.56%). There were thus only 15 samples yielding results from WES analysis due to degraded DNA in 7 cases (Supplementary Table S2). No TRK expression was observed in non-tumor lung tissue, though weak staining was occasionally seen in macrophages and lymphocytes. In our study, TRK expression was more common in SqCC (72.7%) compared to AdCa (13.6%), with positive staining also observed in LCC (13.6%). Membranous and cytoplasmic staining predominated, while nuclear or perinuclear staining was absent in all cases (Figure 3).

3.3. Associations Between TRK Immunohistochemical Expression in Tumor Cells and Clinicopathological Findings and Patient Prognosis

Positive TRK expression in NSCLC was associated with histologic subtypes (AdCa, SqCC, and LCC; p < 0.001) and grade of differentiation (p = 0.038). However, no statistical correlation was found with age, sex, tumor size, staging, or overall survival. Survival rates were higher in women (p = 0.044) and in lower TNM stages (p < 0.0001). Additionally, there was no statistically significant association between TRK immunohistochemical staining and overall survival (OS) using the Kaplan–Meier method (log-rank p = 0.821) (Table 1 and Supplementary Figure S1).

3.4. NTRK Somatic Mutations, CNV, and Fusions Detected by NGS Analysis

After DNA extraction from FFPE samples, 15 out of 22 NTRK-positive cases passed the quality control and were subjected to whole-exome sequencing that enabled the identification of cancer-related somatic DNA mutations, CNV, and NTRK rearrangements. Seven samples with TRK-positive IHC were excluded from WES due to insufficient extracted DNA and high fragmentation levels. This was caused by a non-proper formalin fixation process, which precluded the quality threshold for WES. For the identification of the somatic variants, the following criteria to exclude potential germline mutations were used: (1) variant allele frequency (VAF) higher than 5%; (2) site depth greater than or equal to 20; (3) alternative allele count greater or equal to 5%; (4) exclusion of all mutations found in any population from ExAC or gnomAD database. Variant call format (VCF) files containing the annotated somatic variants were converted to mutation annotation format (maf) files and used as input for the maftools R package. A comprehensive list of detected mutations with information including the type of mutation, VAF, and corresponding annotations for each sample is provided in Supplementary Table S3.
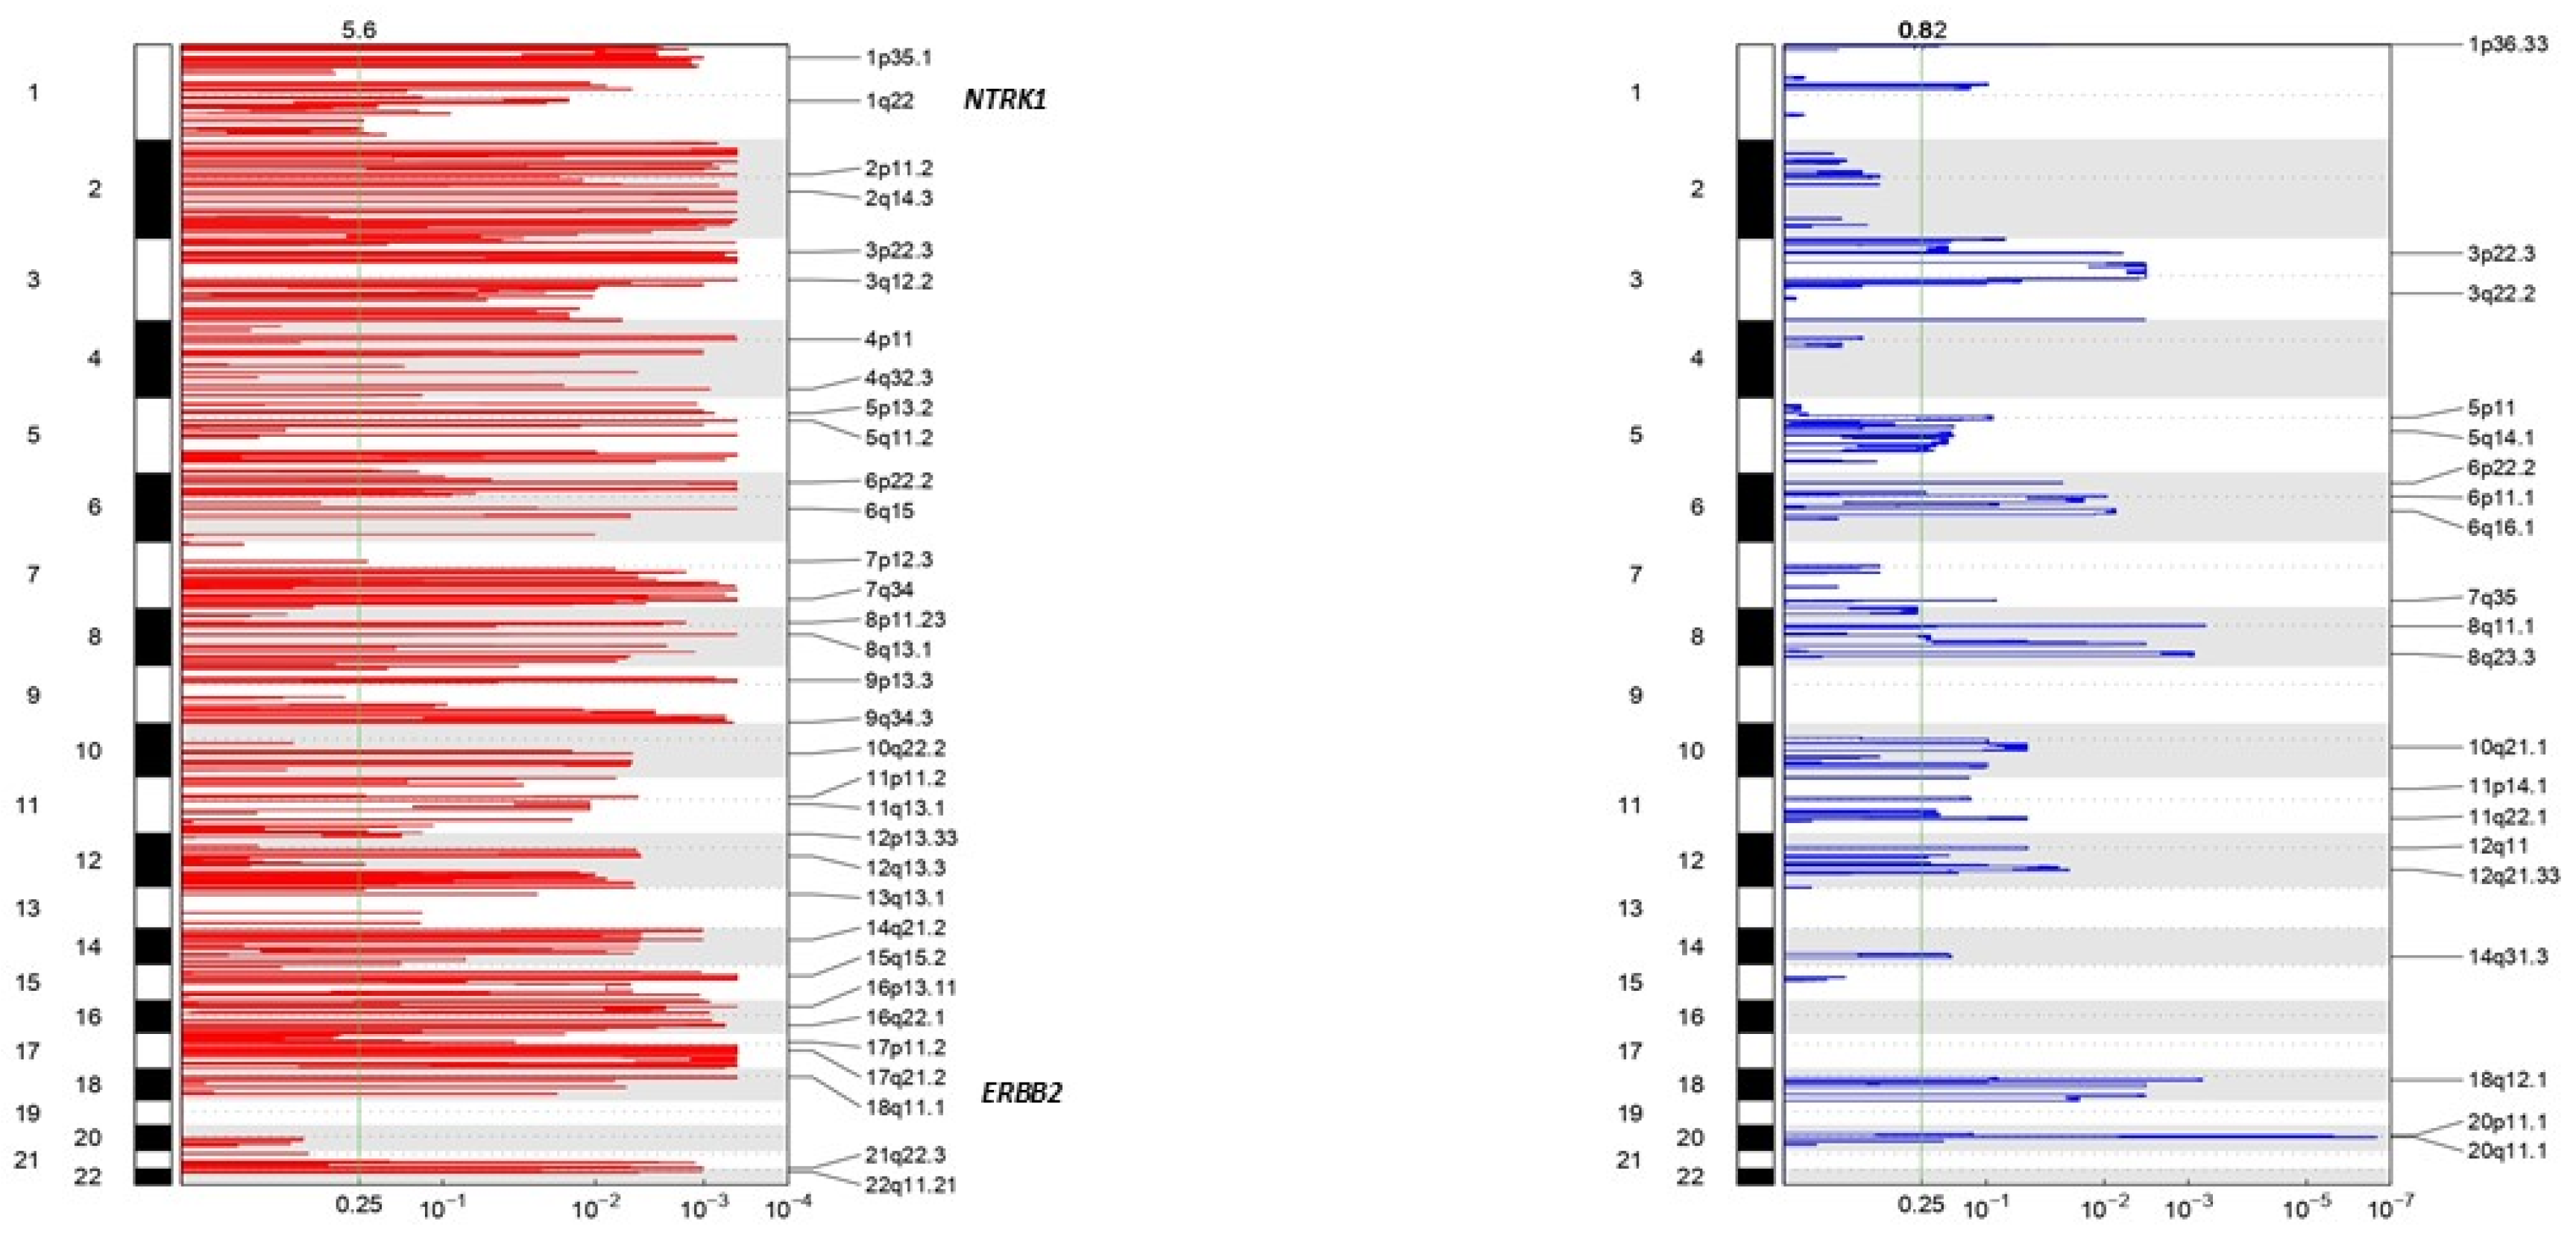
In total, 117 mutations across 15 samples of NSCLC were identified; 115 mutations were missense and 2 were nonsense (TP53 gene mutations). The distribution of somatic mutations found in our patient cohort is detailed in the Oncoplot (Figure 4). High mutation frequencies were identified in MUC5AC, PRSS1, and PRSS2 genes, with 100% (15/15) of the samples showing multihit mutations. At the same time, NTRK1 was present only in one case, as well as other somatic mutations of other essential genes associated with cancer such as PIK3CA, RET, KRAS, BRAF, APC, or PTEN (Table 2, Supplementary Tables S3 and S4). The analysis of copy number variation (CNV) by GISTIC (v 2.0.23) showed amplification in the NTRK1 and ERBB2 genes from our selected genes of interest and no deletions (Figure 5).
Gene fusions represent promising targets for cancer therapy, especially in NSCLC. In our study, we used the FuSeq WES (v1.0.0) tool to identify gene fusions and IGV to confirm those. For our purpose, while multiple rearrangements met our analysis criteria, we focused on those related to NTRK1, 2, and 3 genes. Out of 15 samples, we detected fusions in 11 and found 3 unique NTRK rearrangements with AFAP1, TPM3, and RASEF. Fusions with NTRK1 appeared once and those with NTRK2 appeared twice. No NTRK3 fusions were found. Other fusions with other lung drivers were found, the most relevant being those of ALK (6/15), ROS1 (2/15), MET (2/15), RET (1/15), and NRG1 (1/15) [47]. The presence of double fusions in the same sample on five occasions was highlighted, one of them being TPM3–NTRK1 and ALK–VCL (Table 2, Supplementary Table S2 and Figure S2).
Table 2 summarizes each NTRK fusion present in the samples and its grade of immunohistochemical staining, implicated chromosome partners, histological type, and other somatic mutations.

4. Discussion

According to previous studies, pan-TRK immunohistochemical analysis is less effective at detecting fusions involving NTRK3 than NTRK1/2. Positive cases should be consistently confirmed with a more specific test [31]. In our study, the incidence of TRK expression was low through IHC screening (4.56%), and the NTRK fusions were lower (3/15) with WES NGS, that is, only 0.91% if the prevalence is adjusted. In addition, it confirms the low prevalence of NTRK rearrangements, aligning with previous findings [5,14], and that the pan-TRK monoclonal antibody demonstrates moderated sensitivity and its detection is reasonably dependable. While these oncogenic fusions occur rarely in various malignancies, its significance is emphasized in early detection for patients in advanced stages. Over 80 distinct 5′-NTRK gene fusion partners have been identified across tumor types, making gene fusions promising targets for cancer therapy, particularly in NSCLC [16]. The development of a novel RTKI has led to regulatory approval for inhibitors targeting rearranged fusions for ALK, ROS1, and NTRK1-3 in the United States and Europe [48].
Previous studies using immunohistochemistry reported sensitivities between 75 and 97% and specificities between 81 and 100% with variable scores depending on what type of NTRK fusion was present, but independent of the clone used [10,17,49]. Notwithstanding, global WES is decisive in demonstrating the immunohistochemical analysis’s sensitivity, specificity, or positive predictive value. Furthermore, it is difficult to know the actual utility of TPS when comparing the intensity and percentage of cells that expressed antibody positivity and the presence of fusions after performing WES. Although an isolated somatic NTRK mutation was present and the membrane and cytoplasmic staining was moderate to strong in most cases (22.7% showed weak staining), NTRK fusions were only found in 20% of the positive cases. It was not possible to confirm them in a third of the cases due to the inadequate conditions of the material.
Despite NGS technology being essential in the NSCLC reflexive approach, different biomarker testing strategies are in use depending on the local resources and reimbursements, leading to remarkable heterogeneity in the impact on patient care [50]. RNA-based NGS, in combination with DNA sequencing, is optimal for detecting NTRK gene fusions, especially in FFPE samples. DNA-based NGS exhibits high sensitivity, depending on coverage, depth, and tumor purity. Although not universally applicable for therapy, WES has advantages in identifying new fusions and conducting basic research due to DNA stability. However, its extensive bioinformatics requirements are a limitation for use in therapeutic situations, making it more suitable for fusion discovery and basic biology research [34]. Conversely, the advantage of RNA-based NGS over DNA-based NGS lies in its focus on mature mRNA, unaffected by intron size. Certain DNA-based platforms struggle to detect NTRK gene fusions involving NTRK2 and NTRK3 due to their large introns [5,15,31]. RNA quality is crucial for RNA-based sequencing, but degradation is common in FFPE tissues due to the presence of hydroxyl groups and subsequent hydrolysis as well as increased storage duration and tissue age [34]. Adding assays to an RNA-based NGS panel increases the likelihood of false positives. Assuming 99.5% specificity for each test in a 50-gene panel, we can expect 1 false positive in every 200 assays, resulting in 1 false positive for every 4 patients screened for wild-type tumors [32]. Hence, we opted for DNA-WES in this study. WES NGS showed a somatic mutation of NTRK1 (missense mutation) in sample 12, corresponding to SqCC.
NTRK gene amplification (defined as ≥4.0 copies) has been described in around 2–5% of cases according to two large pan-cancer studies [14,51]. Nonetheless, in our subset of patients, we confirm NTRK1 and ERBB2 gene amplification, indicating that this kind of change, although rare in NSCLC, could be present. The amplifications occurred in all samples (Figure 5), with compromised RAS pathways in 1/15 cases (6.6%), alongside mutations in other pathway-related receptors (Table 2). Additionally, we found the presence of somatic mutations of the RET, PIK3CA, APC, PTEN, and TP53 genes in some cases, with the presence of rearrangements in the same sample for RET gene [52,53]. Emerging evidence suggests that NTRK gene rearrangements are more common in tumors with microsatellite instability (MSI) such as colon cancer [54], and they are enriched in tumors lacking RAS mutations and other MAPK pathway abnormalities [6], aligning our results with previous investigations. The Oncoplot also showed the presence of multiple mutations in several genes in the majority of samples that underwent WES study, such as MUC5AC, PRSS1/2, LILRB1/2, GAGE10, or MUC6, whose relevance in our study is undetermined since they are genes that are not linked to lung cancer, with the exception of MUC5AC and GAGE, which apparently may play a role in migration and metastasis as well as in the possible response to immunotherapy in the early stage of lung cancer [55,56].
In our samples, the tumor mutation burden was high, and NTRK fusions were observed in various histological types, particularly SqCC. This concurred with previous studies [14]. However, other research indicated that NTRK fusion-positive samples exhibit lower mutational burden than fusion-negative tumors [1].
We describe here the NTRK2 fusion with RASEF, partners never exhibited before in the literature, but the latter has high relevance as a possible lung cancer biomarker [57]. The RASEF gene acts as a tumor-suppressor gene, and its mutations are frequently found in other cancer types like melanoma [58]. Interestingly, we have identified two distinct NTRK fusions with other fusion drivers in the same samples involving NTRK1 with ALK and NTRK2 with MET in the same patients. Similarly, double fusions of ALK and ROS1 and ROS1 with MET were also found in the same patients (Table 2). This finding diverges from previous investigations, which emphasized the mutual exclusivity of NTRK fusions, making them unexpectedly more likely in the presence of primary treatable alterations such as ALK and ROS1 fusions [19]. Noteworthy is the presence of ALK fusions in a significant proportion of SqCC (at a 5:1 ratio compared to the AdCa case), and ROS1 and RET fusions are observed in both LCC and SqCC. Although these alterations are singular in the literature, they are often neither investigated nor analyzed due to their limited or undetermined clinical relevance for these histological types [59,60,61]. These findings highlight the heterogeneity of lung cancer.
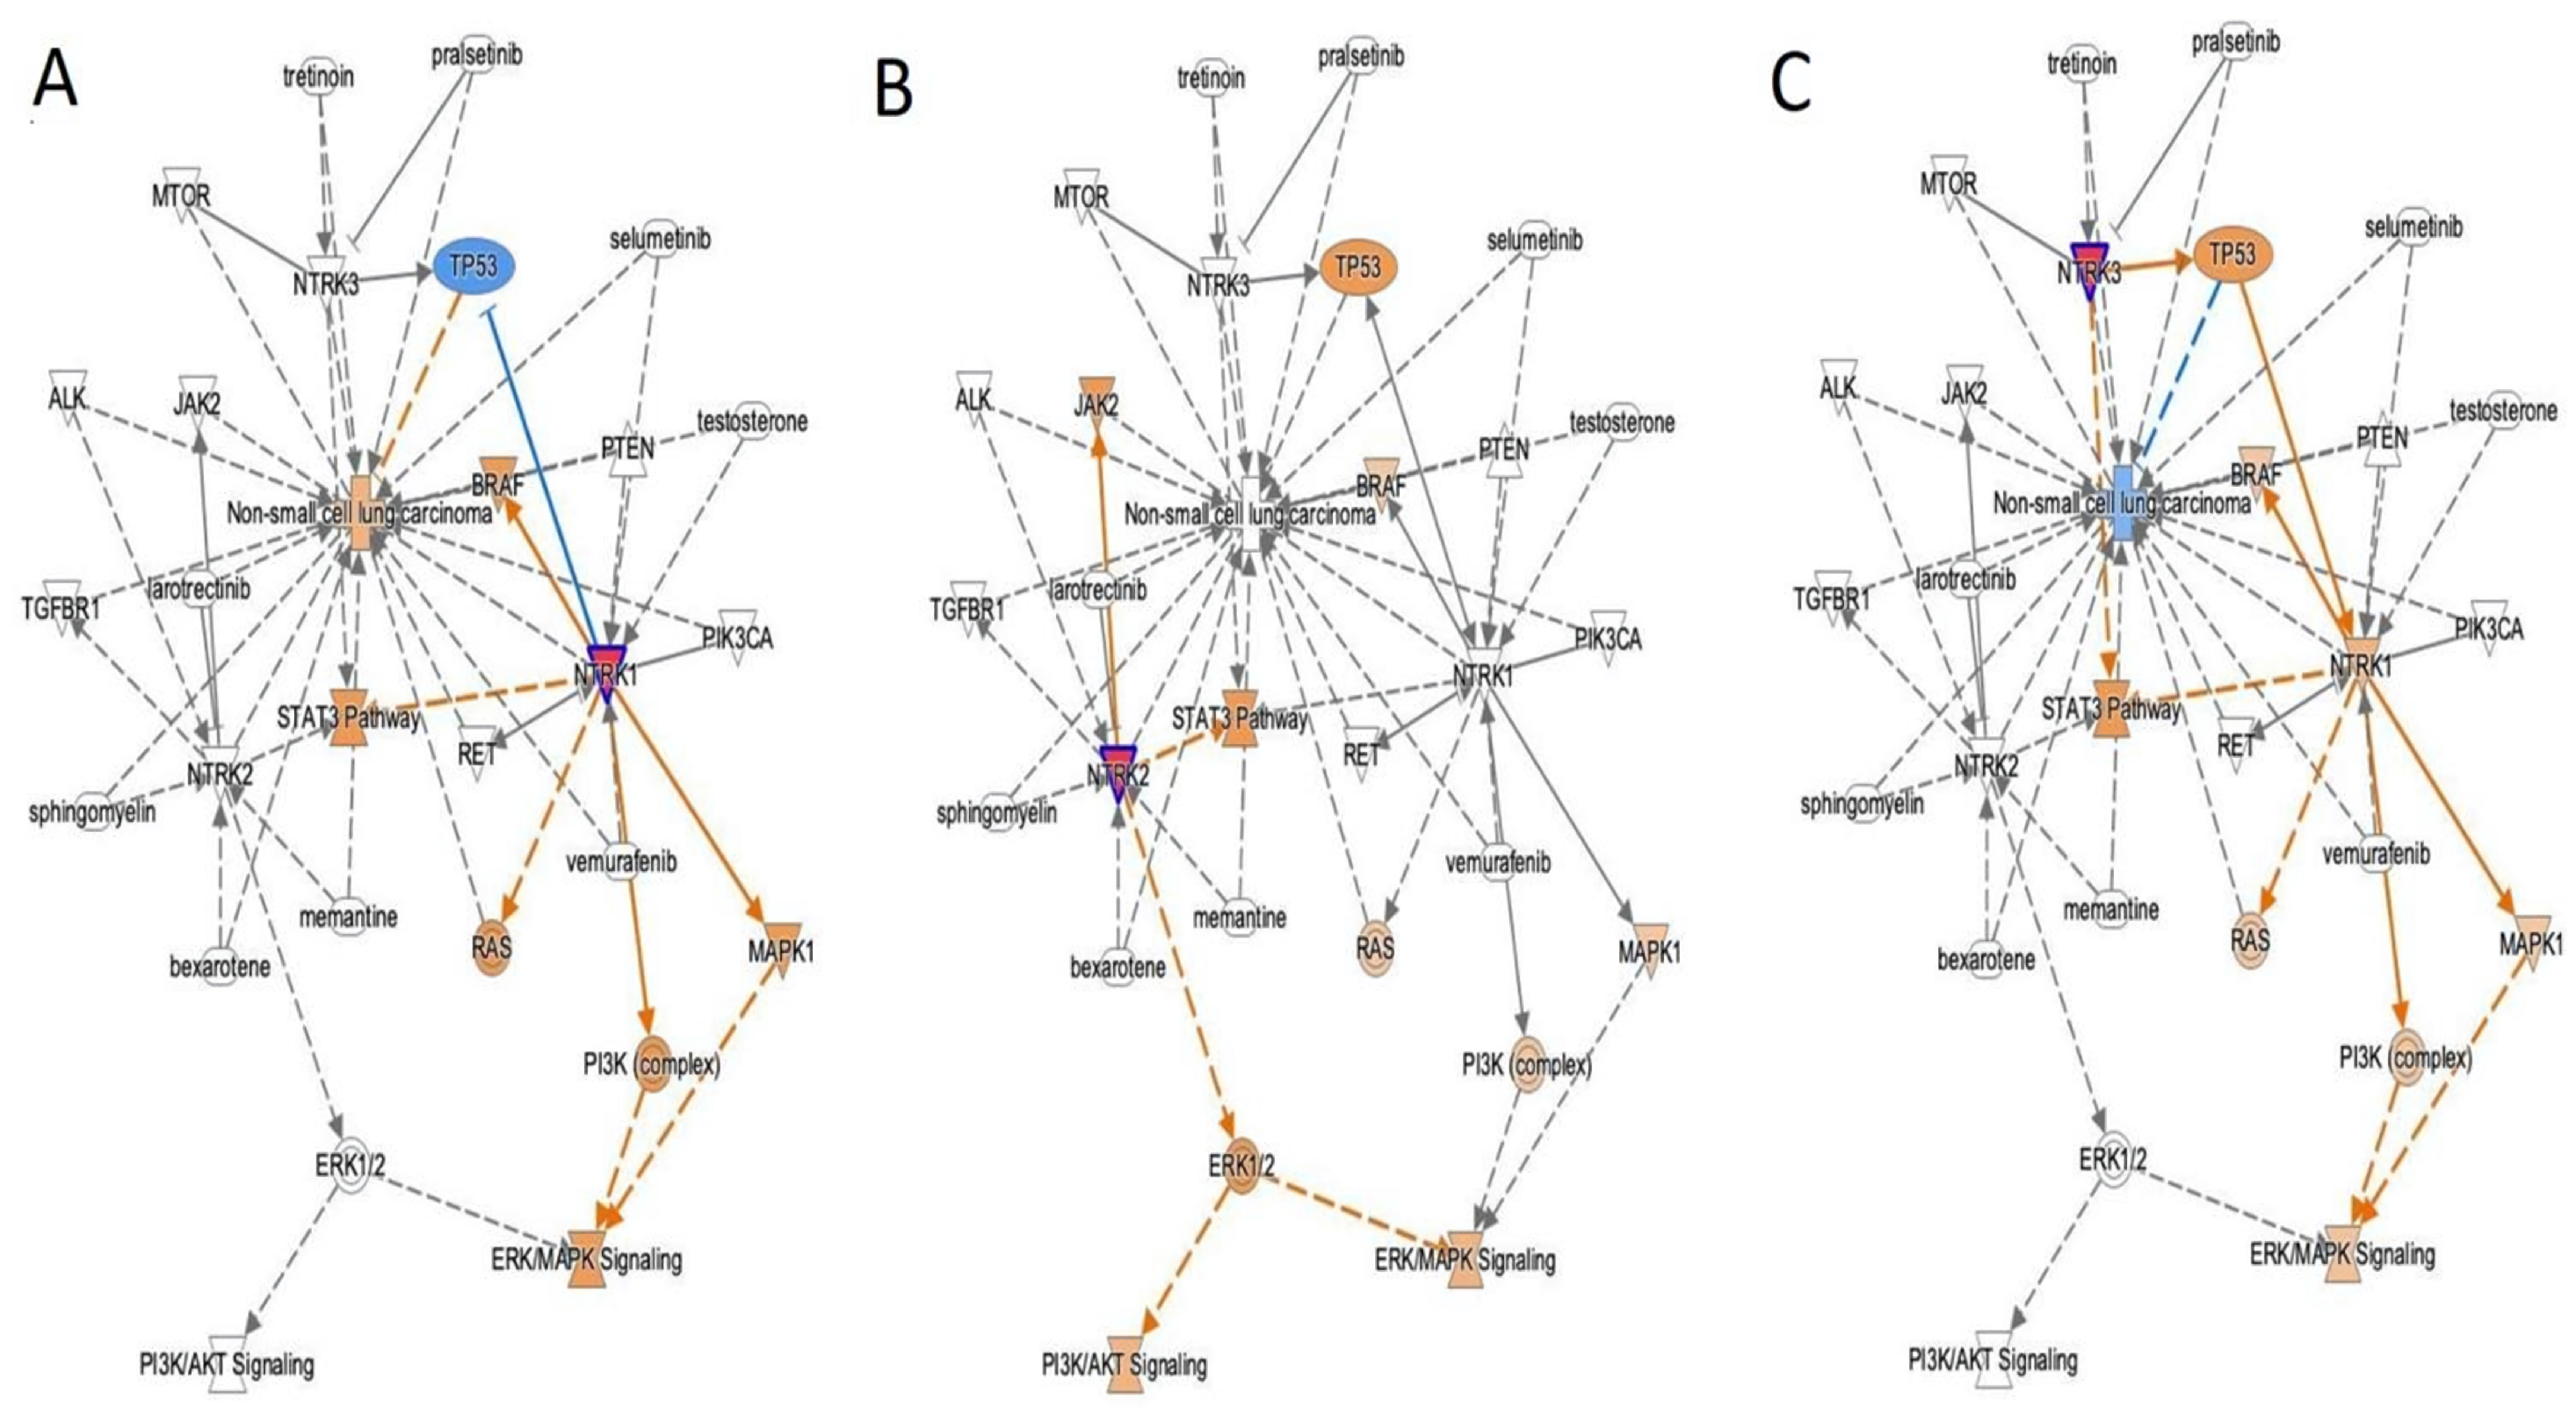
Additionally, by using IPA (Ingenuity Pathway Analysis), we were able to gain a better understanding of how TRK receptors are associated with the development of lung cancer as cellular pathways such as MAPK, PI3K, RAS, STAT3, JAK, ERK1/2 or TP53 are altered. IPA software predicts the relationships between TRK inhibitors and other proteins in the signaling pathways and finally predicts the activation or the inhibition of the tumoral growth. The analysis shows the direct relationship between NTRK1 and NSCLC and the opposite between NTRK3 and lung cancer. NTRK2 might be interpreted as totally indifferent. Furthermore, all three seem to activate STAT3, a protein related to tumor survival but at the same time compensated by other cellular signals (Figure 6, Figure 7 and Figure 8).
Finally, our study has several limitations. First, one of the disadvantages of the study was the size of our cohort, which restricted the number of cases we could analyze using IHC without performing a global WES-NGS, as guidelines recommend [35,50]; therefore, not all the tumors included in this study were analyzed by DNA sequencing, and it was not possible to assess the false-negative rate of IHC. Therefore, we cannot ascertain if any NTRK fusion-positive cases in our population were undetectable by IHC. Second, the TRK immunohistochemical assay was performed on tissue microarrays, and it is well known that intratumoral clonal populations can present different degrees of mutations and, therefore, of IHC staining, so the heterogeneity of tumor staining cannot be compensated, and focal expression of TRK may be missed in some cases. However, TRK stains in confirmed cases of NTRK fusion in other cancer types demonstrated diffuse and homogeneous staining with limited heterogeneity [14]. On scarce occasions, the TMA microsections were not optimal due to partial loss of material, fragmentation of the section, or incomplete diffusion of the antibody. However, there was an extra core to compensate for this. Third, WES has three-fold fewer split reads than RNA-seq, partially explaining the small number of validated samples using exome-seq data. In the same way, the short insertions typically seen in accurate fusions are absent from the fusion junctions identified by Fuseq-WES. High-confidence detection of fusion genes mainly depends on split reads, and its higher validation is related to its read coverage, which, in lung cancer, should be at least 98× In addition, statistical tests and filters complicate the assessment [62]; nevertheless, both tests are complementary. RNA-based NGS, besides informing the presence of fusions, could also highlight genetic overexpression. Fourth, the volume of cases is another relevant variable to determine or validate which is the most optimal algorithm to evaluate the NTRK gene fusions; our investigation was at the threshold of comparing other studies. However, at the moment, it is not possible to predict which technique would be the most optimal for the diagnostic confirmation of fusions after having screened with IHC. The most appropriate may be a mixture of both RNA- and DNA-based platforms. However, this would increase the costs, and in the end, it could be impractical in the clinical routine setting.
This leads us to state that it is essential to consider IHC as a screening method for NTRK rearrangements in clinical settings with limited resources and/or access to NGS, preferably with confirmation using nucleic acid-based testing for those with positive IHC, when this is practicable [14,30,63].

5. Conclusions

In our study, we confirm that TRK overexpression in NSCLC is low and its gene fusion is even rarer. However, there is an acceptable correlation between pan-TRK IHC and NTRK mutations, but not enough to determine NTRK fusions. Pan-TRK IHC is an excellent technique to be included in the predictive biomarker panel in NSCLC, and positive cases should be verified by molecular assessments.
Finally, its overexpression (with or without mutation) is important for the potential therapeutic effect, even without fusion. More studies are needed to clarify its clinicopathological role in NSCLC.

Supplementary Materials

The following supporting information can be downloaded at: https://www.mdpi.com/article/10.3390/jor5010002/s1, Figure S1: Kaplan-Meier survival curve in relationship with pan-TRK expression. Figure S2: Gene fusions. Table S1: Epidemiology Data. Table S2: Gene rearrangement. Table S3: Somatic mutations of lung drivers. Table S4: Somatic mutations in other relevant genes.

Author Contributions

R.G., C.O.-V. and S.E.: conceptualization and methodology. L.D.P.: collection of samples and clinical data. J.G.-H.: investigation, writing—original draft preparation, and formal analysis. G.K. and R.M.F.: visualization, validation, software, and data curation. C.O.-V., J.G.-H., G.K., M.M.-C., R.G., M.A.M.-F., S.E. and L.D.P.: supervision, software, and writing—reviewing and editing. All authors have read and agreed to the published version of the manuscript.

Funding

This research received no external funding.

Institutional Review Board Statement

Karolinska University Hospital granted ethical approval in accordance with the Declaration of Helsinki (No. 2005/588-31/4 + Amendment 2008/136-32, approval date: 27 March 2008).

Informed Consent Statement

Since this was a retrospective study, the ethics committee waived the requirement for informed consent.

Data Availability Statement

The original contributions presented in the study are included in the article/Supplementary Materials, further inquiries can be directed to the corresponding author.

Acknowledgments

This publication was funded partially by Bayer.

Conflicts of Interest

The authors declare no conflicts of interest. The company Bayer. had no role in the design of the study; in the collection, analyses, or interpretation of data; in the writing of the manuscript, and in the decision to publish the results.

References

  1. Amatu, A.; Sartore-Bianchi, A.; Bencardino, K.; Pizzutilo, E.G.; Tosi, F.; Siena, S. Tropomyosin receptor kinase (TRK) biology and the role of NTRK gene fusions in cancer. Ann. Oncol. 2019, 30, viii5–viii15. [Google Scholar] [CrossRef] [PubMed]
  2. Ekman, S. How selecting best therapy for metastatic NTRK fusion-positive non-small cell lung cancer? Transl. Lung Cancer Res. 2020, 9, 2535–2544. [Google Scholar] [CrossRef] [PubMed]
  3. Solomon, J.P.; Benayed, R.; Hechtman, J.F.; Ladanyi, M. Identifying patients with NTRK fusion cancer. Ann. Oncol. 2019, 30, viii16–viii22. [Google Scholar] [CrossRef] [PubMed]
  4. Okamura, R.; Boichard, A.; Kato, S.; Sicklick, J.K.; Bazhenova, L.; Kurzrock, R. Analysis of NTRK Alterations in Pan-Cancer Adult and Pediatric Malignancies: Implications for NTRK-Targeted Therapeutics. JCO Precis. Oncol. 2018, 2018, PO.18.00183. [Google Scholar] [CrossRef]
  5. Weiss, L.M.; Funari, V.A. NTRK fusions and Trk proteins: What are they and how to test for them. Hum. Pathol. 2021, 112, 59–69. [Google Scholar] [CrossRef]
  6. Chou, A.; Fraser, T.; Ahadi, M.; Fuchs, T.; Sioson, L.; Clarkson, A.; Sheen, A.; Singh, N.; Corless, C.L.; Gill, A.J. NTRK gene rearrangements are highly enriched in MLH1/PMS2 deficient, BRAF wild-type colorectal carcinomas-a study of 4569 cases. Mod. Pathol. 2020, 33, 924–932. [Google Scholar] [CrossRef] [PubMed]
  7. Lassen, U. How I treat NTRK gene fusion-positive cancers. ESMO Open 2019, 4, e000612. [Google Scholar] [CrossRef] [PubMed]
  8. Qin, H.; Patel, M.R. The Challenge and Opportunity of NTRK Inhibitors in Non-Small Cell Lung Cancer. Int. J. Mol. Sci. 2022, 23, 2916. [Google Scholar] [CrossRef]
  9. Cocco, E.; Scaltriti, M.; Drilon, A. NTRK fusion-positive cancers and TRK inhibitor therapy. Nat. Rev. Clin. Oncol. 2018, 15, 731–747. [Google Scholar] [CrossRef]
  10. Gatalica, Z.; Xiu, J.; Swensen, J.; Vranic, S. Molecular characterization of cancers with NTRK gene fusions. Mod. Pathol. 2019, 32, 147–153. [Google Scholar] [CrossRef]
  11. Solomon, J.P.; Linkov, I.; Rosado, A.; Mullaney, K.; Rosen, E.Y.; Frosina, D.; Jungbluth, A.A.; Zehir, A.; Benayed, R.; Drilon, A.; et al. NTRK fusion detection across multiple assays and 33,997 cases: Diagnostic implications and pitfalls. Mod. Pathol. 2020, 33, 38–46. [Google Scholar] [CrossRef]
  12. Gao, F.; Griffin, N.; Faulkner, S.; Rowe, C.W.; Williams, L.; Roselli, S.; Thorne, R.F.; Ferdoushi, A.; Jobling, P.; Walker, M.M.; et al. The neurotrophic tyrosine kinase receptor TrkA and its ligand NGF are increased in squamous cell carcinomas of the lung. Sci. Rep. 2018, 8, 8135. [Google Scholar] [CrossRef] [PubMed]
  13. Reichardt, L.F. Neurotrophin-regulated signalling pathways. Philos. Trans. R. Soc. Lond. B Biol. Sci. 2006, 361, 1545–1564. [Google Scholar] [CrossRef] [PubMed]
  14. Elfving, H.; Brostrom, E.; Moens, L.N.J.; Almlof, J.; Cerjan, D.; Lauter, G.; Nord, H.; Mattsson, J.S.M.; Ullenhag, G.J.; Strell, C.; et al. Evaluation of NTRK immunohistochemistry as a screening method for NTRK gene fusion detection in non-small cell lung cancer. Lung Cancer 2021, 151, 53–59. [Google Scholar] [CrossRef] [PubMed]
  15. Penault-Llorca, F.; Rudzinski, E.R.; Sepulveda, A.R. Testing algorithm for identification of patients with TRK fusion cancer. J. Clin. Pathol. 2019, 72, 460–467. [Google Scholar] [CrossRef] [PubMed]
  16. De Winne, K.; Sorber, L.; Lambin, S.; Siozopoulou, V.; Beniuga, G.; Dedeurwaerdere, F.; D’Haene, N.; Habran, L.; Libbrecht, L.; Van Huysse, J.; et al. Immunohistochemistry as a screening tool for NTRK gene fusions: Results of a first Belgian ring trial. Virchows Arch. 2021, 478, 283–291. [Google Scholar] [CrossRef]
  17. Strohmeier, S.; Brcic, I.; Popper, H.; Liegl-Atzwanger, B.; Lindenmann, J.; Brcic, L. Applicability of pan-TRK immunohistochemistry for identification of NTRK fusions in lung carcinoma. Sci. Rep. 2021, 11, 9785. [Google Scholar] [CrossRef]
  18. Haratake, N.; Seto, T. NTRK Fusion-positive Non-small-cell Lung Cancer: The Diagnosis and Targeted Therapy. Clin. Lung Cancer 2021, 22, 1–5. [Google Scholar] [CrossRef] [PubMed]
  19. Garrido, P.; Hladun, R.; de Alava, E.; Alvarez, R.; Bautista, F.; Lopez-Rios, F.; Colomer, R.; Rojo, F. Multidisciplinary consensus on optimising the detection of NTRK gene alterations in tumours. Clin. Transl. Oncol. 2021, 23, 1529–1541. [Google Scholar] [CrossRef] [PubMed]
  20. Farago, A.F.; Taylor, M.S.; Doebele, R.C.; Zhu, V.W.; Kummar, S.; Spira, A.I.; Boyle, T.A.; Haura, E.B.; Arcila, M.E.; Benayed, R.; et al. Clinicopathologic Features of Non-Small-Cell Lung Cancer Harboring an NTRK Gene Fusion. JCO Precis. Oncol. 2018, 2018, PO.18.00037. [Google Scholar] [CrossRef]
  21. Park, S.J.; More, S.; Murtuza, A.; Woodward, B.D.; Husain, H. New Targets in Non-Small Cell Lung Cancer. Hematol. Oncol. Clin. N. Am. 2017, 31, 113–129. [Google Scholar] [CrossRef] [PubMed]
  22. Remon, J.; Pignataro, D.; Novello, S.; Passiglia, F. Current treatment and future challenges in ROS1- and ALK-rearranged advanced non-small cell lung cancer. Cancer Treat. Rev. 2021, 95, 102178. [Google Scholar] [CrossRef] [PubMed]
  23. Castellanos, E.; Feld, E.; Horn, L. Driven by Mutations: The Predictive Value of Mutation Subtype in EGFR-Mutated Non-Small Cell Lung Cancer. J. Thorac. Oncol. 2017, 12, 612–623. [Google Scholar] [CrossRef] [PubMed]
  24. Castañeda-González, J.P.; Chaves, J.J.; Parra-Medina, R. Multiple mutations in the EGFR gene in lung cancer: A systematic review. Transl. Lung Cancer Res. 2022, 11, 2148–2163. [Google Scholar] [CrossRef]
  25. Chuang, J.C.; Stehr, H.; Liang, Y.; Das, M.; Huang, J.; Diehn, M.; Wakelee, H.A.; Neal, J.W. ERBB2-Mutated Metastatic Non-Small Cell Lung Cancer: Response and Resistance to Targeted Therapies. J. Thorac. Oncol. 2017, 12, 833–842. [Google Scholar] [CrossRef] [PubMed]
  26. Sentana-Lledo, D.; Academia, E.; Viray, H.; Rangachari, D.; Kobayashi, S.S.; VanderLaan, P.A.; Costa, D.B. EGFR exon 20 insertion mutations and ERBB2 mutations in lung cancer: A narrative review on approved targeted therapies from oral kinase inhibitors to antibody-drug conjugates. Transl. Lung Cancer Res. 2023, 12, 1590–1610. [Google Scholar] [CrossRef]
  27. Li, H.; Yan, S.; Liu, Y.; Ma, L.; Liu, X.; Liu, Y.; Cheng, Y. Analysis of NTRK mutation and clinicopathologic factors in lung cancer patients in northeast China. Int. J. Biol. Markers 2020, 35, 36–40. [Google Scholar] [CrossRef] [PubMed]
  28. Drilon, A.; Laetsch, T.W.; Kummar, S.; DuBois, S.G.; Lassen, U.N.; Demetri, G.D.; Nathenson, M.; Doebele, R.C.; Farago, A.F.; Pappo, A.S.; et al. Efficacy of Larotrectinib in TRK Fusion-Positive Cancers in Adults and Children. N. Engl. J. Med. 2018, 378, 731–739. [Google Scholar] [CrossRef]
  29. Ardini, E.; Menichincheri, M.; Banfi, P.; Bosotti, R.; De Ponti, C.; Pulci, R.; Ballinari, D.; Ciomei, M.; Texido, G.; Degrassi, A.; et al. Entrectinib, a Pan-TRK, ROS1, and ALK Inhibitor with Activity in Multiple Molecularly Defined Cancer Indications. Mol. Cancer Ther. 2016, 15, 628–639. [Google Scholar] [CrossRef]
  30. Hechtman, J.F.; Benayed, R.; Hyman, D.M.; Drilon, A.; Zehir, A.; Frosina, D.; Arcila, M.E.; Dogan, S.; Klimstra, D.S.; Ladanyi, M.; et al. Pan-Trk Immunohistochemistry Is an Efficient and Reliable Screen for the Detection of NTRK Fusions. Am. J. Surg. Pathol. 2017, 41, 1547–1551. [Google Scholar] [CrossRef] [PubMed]
  31. Wong, D.; Yip, S.; Sorensen, P.H. Methods for Identifying Patients with Tropomyosin Receptor Kinase (TRK) Fusion Cancer. Pathol. Oncol. Res. 2020, 26, 1385–1399. [Google Scholar] [CrossRef] [PubMed]
  32. O’Brien, C.P.; Taylor, S.E.; O’Leary, J.J.; Finn, S.P. Molecular testing in oncology: Problems, pitfalls and progress. Lung Cancer 2014, 83, 309–315. [Google Scholar] [CrossRef] [PubMed]
  33. Zito Marino, F.; Pagliuca, F.; Ronchi, A.; Cozzolino, I.; Montella, M.; Berretta, M.; Errico, M.E.; Donofrio, V.; Bianco, R.; Franco, R. NTRK Fusions, from the Diagnostic Algorithm to Innovative Treatment in the Era of Precision Medicine. Int. J. Mol. Sci. 2020, 21, 3718. [Google Scholar] [CrossRef]
  34. Solomon, J.P.; Hechtman, J.F. Detection of NTRK Fusions: Merits and Limitations of Current Diagnostic Platforms. Cancer Res. 2019, 79, 3163–3168. [Google Scholar] [CrossRef]
  35. Marchio, C.; Scaltriti, M.; Ladanyi, M.; Iafrate, A.J.; Bibeau, F.; Dietel, M.; Hechtman, J.F.; Troiani, T.; Lopez-Rios, F.; Douillard, J.Y.; et al. ESMO recommendations on the standard methods to detect NTRK fusions in daily practice and clinical research. Ann. Oncol. 2019, 30, 1417–1427. [Google Scholar] [CrossRef] [PubMed]
  36. Durzynska, M.; Michalek, I.M. Pan-TRK immunohistochemistry as a tool in the screening for NTRK gene fusions in cancer patients. Oncol. Clin. Pract. 2024, 20, 15–21. [Google Scholar] [CrossRef]
  37. Patel, P.G.; Selvarajah, S.; Guérard, K.P.; Bartlett, J.M.S.; Lapointe, J.; Berman, D.M.; Okello, J.B.A.; Park, P.C. Reliability and performance of commercial RNA and DNA extraction kits for FFPE tissue cores. PLoS ONE 2017, 12, e0179732. [Google Scholar] [CrossRef] [PubMed]
  38. McKenna, A.; Hanna, M.; Banks, E.; Sivachenko, A.; Cibulskis, K.; Kernytsky, A.; Garimella, K.; Altshuler, D.; Gabriel, S.; Daly, M.; et al. The Genome Analysis Toolkit: A MapReduce framework for analyzing next-generation DNA sequencing data. Genome Res. 2010, 20, 1297–1303. [Google Scholar] [CrossRef] [PubMed]
  39. Li, H.; Durbin, R. Fast and accurate short read alignment with Burrows-Wheeler transform. Bioinformatics 2009, 25, 1754–1760. [Google Scholar] [CrossRef]
  40. Overfield, C.J.; Edgar, M.A.; Wessell, D.E.; Wilke, B.K.; Garner, H.W. NTRK-rearranged spindle cell neoplasm of the lower extremity: Radiologic-pathologic correlation. Skelet. Radiol. 2022, 51, 1707–1713. [Google Scholar] [CrossRef] [PubMed]
  41. Cingolani, P.; Platts, A.; Wang, L.L.; Coon, M.; Nguyen, T.; Wang, L.; Land, S.J.; Lu, X.; Ruden, D.M. A program for annotating and predicting the effects of single nucleotide polymorphisms, SnpEff: SNPs in the genome of Drosophila melanogaster strain w1118; iso-2; iso-3. Fly 2012, 6, 80–92. [Google Scholar] [CrossRef] [PubMed]
  42. Mayakonda, A.; Lin, D.C.; Assenov, Y.; Plass, C.; Koeffler, H.P. Maftools: Efficient and comprehensive analysis of somatic variants in cancer. Genome Res. 2018, 28, 1747–1756. [Google Scholar] [CrossRef] [PubMed]
  43. Chen, S.; Liu, M.; Huang, T.; Liao, W.; Xu, M.; Gu, J. GeneFuse: Detection and visualization of target gene fusions from DNA sequencing data. Int. J. Biol. Sci. 2018, 14, 843–848. [Google Scholar] [CrossRef]
  44. Krämer, A.; Green, J.; Pollard, J., Jr.; Tugendreich, S. Causal analysis approaches in Ingenuity Pathway Analysis. Bioinformatics 2014, 30, 523–530. [Google Scholar] [CrossRef] [PubMed]
  45. Khan, M.I.; Dębski, K.J.; Dabrowski, M.; Czarnecka, A.M.; Szczylik, C. Gene set enrichment analysis and ingenuity pathway analysis of metastatic clear cell renal cell carcinoma cell line. Am. J. Physiol. Ren. Physiol. 2016, 311, F424–F436. [Google Scholar] [CrossRef]
  46. Giannos, P.; Kechagias, K.S.; Bowden, S.; Tabassum, N.; Paraskevaidi, M.; Kyrgiou, M. PCNA in Cervical Intraepithelial Neoplasia and Cervical Cancer: An Interaction Network Analysis of Differentially Expressed Genes. Front. Oncol. 2021, 11, 779042. [Google Scholar] [CrossRef] [PubMed]
  47. Zhao, R.; Yao, F.; Xiang, C.; Zhao, J.; Shang, Z.; Guo, L.; Ding, W.; Ma, S.; Yu, A.; Shao, J.; et al. Identification of NTRK gene fusions in lung adenocarcinomas in the Chinese population. J. Pathol. Clin. Res. 2021, 7, 375–384. [Google Scholar] [CrossRef] [PubMed]
  48. Heydt, C.; Wölwer, C.B.; Velazquez Camacho, O.; Wagener-Ryczek, S.; Pappesch, R.; Siemanowski, J.; Rehker, J.; Haller, F.; Agaimy, A.; Worm, K.; et al. Detection of gene fusions using targeted next-generation sequencing: A comparative evaluation. BMC Med. Genom. 2021, 14, 62. [Google Scholar] [CrossRef]
  49. Rudzinski, E.R.; Lockwood, C.M.; Stohr, B.A.; Vargas, S.O.; Sheridan, R.; Black, J.O.; Rajaram, V.; Laetsch, T.W.; Davis, J.L. Pan-Trk Immunohistochemistry Identifies NTRK Rearrangements in Pediatric Mesenchymal Tumors. Am. J. Surg. Pathol. 2018, 42, 927–935. [Google Scholar] [CrossRef] [PubMed]
  50. Ettinger, D.S.; Wood, D.E.; Aisner, D.L.; Akerley, W.; Bauman, J.R.; Bharat, A.; Bruno, D.S.; Chang, J.Y.; Chirieac, L.R.; D’Amico, T.A.; et al. Non-Small Cell Lung Cancer, Version 3.2022, NCCN Clinical Practice Guidelines in Oncology. J. Natl. Compr. Cancer Netw. 2022, 20, 497–530. [Google Scholar] [CrossRef]
  51. Lee, S.J.; Kim, N.K.D.; Lee, S.-H.; Kim, S.T.; Park, S.H.; Park, J.O.; Park, Y.S.; Lim, H.Y.; Kang, W.K.; Park, W.Y.; et al. NTRK gene amplification in patients with metastatic cancer. Precis. Future Med. 2017, 1, 129–137. [Google Scholar] [CrossRef]
  52. Olmedo, M.E.; Cervera, R.; Cabezon-Gutierrez, L.; Lage, Y.; Corral de la Fuente, E.; Gomez Rueda, A.; Mielgo-Rubio, X.; Trujillo, J.C.; Counago, F. New horizons for uncommon mutations in non-small cell lung cancer: BRAF, KRAS, RET, MET, NTRK, HER2. World J. Clin. Oncol. 2022, 13, 276–286. [Google Scholar] [CrossRef] [PubMed]
  53. Overbeck, T.R.; Reiffert, A.; Schmitz, K.; Rittmeyer, A.; Körber, W.; Hugo, S.; Schnalke, J.; Lukat, L.; Hugo, T.; Hinterthaner, M.; et al. NTRK Gene Fusions in Non-Small-Cell Lung Cancer: Real-World Screening Data of 1068 Unselected Patients. Cancers 2023, 15, 2966. [Google Scholar] [CrossRef] [PubMed]
  54. Kheder, E.S.; Hong, D.S. Emerging Targeted Therapy for Tumors with NTRK Fusion Proteins. Clin. Cancer Res. 2018, 24, 5807–5814. [Google Scholar] [CrossRef] [PubMed]
  55. Lakshmanan, I.; Rachagani, S.; Hauke, R.; Krishn, S.R.; Paknikar, S.; Seshacharyulu, P.; Karmakar, S.; Nimmakayala, R.K.; Kaushik, G.; Johansson, S.L.; et al. MUC5AC interactions with integrin β4 enhances the migration of lung cancer cells through FAK signaling. Oncogene 2016, 35, 4112–4121. [Google Scholar] [CrossRef] [PubMed]
  56. Gjerstorff, M.F.; Pøhl, M.; Olsen, K.E.; Ditzel, H.J. Analysis of GAGE, NY-ESO-1 and SP17 cancer/testis antigen expression in early stage non-small cell lung carcinoma. BMC Cancer 2013, 13, 466. [Google Scholar] [CrossRef] [PubMed]
  57. Oshita, H.; Nishino, R.; Takano, A.; Fujitomo, T.; Aragaki, M.; Kato, T.; Akiyama, H.; Tsuchiya, E.; Kohno, N.; Nakamura, Y.; et al. RASEF is a novel diagnostic biomarker and a therapeutic target for lung cancer. Mol. Cancer Res. 2013, 11, 937–951. [Google Scholar] [CrossRef] [PubMed]
  58. Maat, W.; Beiboer, S.H.; Jager, M.J.; Luyten, G.P.; Gruis, N.A.; van der Velden, P.A. Epigenetic regulation identifies RASEF as a tumor-suppressor gene in uveal melanoma. Invest. Ophthalmol. Vis. Sci. 2008, 49, 1291–1298. [Google Scholar] [CrossRef]
  59. Le, T.; Gerber, D.E. ALK alterations and inhibition in lung cancer. Semin. Cancer Biol. 2017, 42, 81–88. [Google Scholar] [CrossRef] [PubMed]
  60. Meng, Q.; Dong, Y.; Tao, H.; Shi, L.; Tong, L.; Tang, J.; Zhang, S.; Liu, Z. ALK-rearranged squamous cell carcinoma of the lung. Thorac. Cancer 2021, 12, 1106–1114. [Google Scholar] [CrossRef]
  61. Song, Z.; Yu, X.; Zhang, Y. Clinicopathological characteristics and survival of ALK, ROS1 and RET rearrangements in non-adenocarcinoma non-small cell lung cancer patients. Cancer Biol. Ther. 2017, 18, 883–887. [Google Scholar] [CrossRef] [PubMed]
  62. Deng, W.; Murugan, S.; Lindberg, J.; Chellappa, V.; Shen, X.; Pawitan, Y.; Vu, T.N. Fusion Gene Detection Using Whole-Exome Sequencing Data in Cancer Patients. Front. Genet. 2022, 13, 820493. [Google Scholar] [CrossRef] [PubMed]
  63. Murphy, D.A.; Ely, H.A.; Shoemaker, R.; Boomer, A.; Culver, B.P.; Hoskins, I.; Haimes, J.D.; Walters, R.D.; Fernandez, D.; Stahl, J.A.; et al. Detecting Gene Rearrangements in Patient Populations Through a 2-Step Diagnostic Test Comprised of Rapid IHC Enrichment Followed by Sensitive Next-Generation Sequencing. Appl. Immunohistochem. Mol. Morphol. 2017, 25, 513–523. [Google Scholar] [CrossRef] [PubMed]
Figure 1. NTRK pathway. Activation of NTRK signaling pathway initiates downstream cascades involving RAS, AKT/mTOR, and PLCγ, pivotal for cellular growth, survival, and proliferation in cancer and neurodevelopment, underscoring its critical role in various physiological and pathological contexts.
Jor 05 00002 g001
Figure 2. The different pipeline steps and tools utilized: (A) Immunohistochemistry pipeline. (B) Overview of the main pipeline steps and tools of data analysis from raw sequences to recurrent somatic events. All the samples underwent a common pre-processing step and quality control was performed in each step. Filtration and functional annotation were performed by identification of recurrent somatic events on both CNAs and fusions.
Jor 05 00002 g002
Figure 3. Immunohistochemistry NTRK staining (EPR17341 clone Abcam). Composition performed with Hamamatsu scanner. (A) corresponds to an AdCa score of 0 (4×); (B) is an AdCa with a score of +1 (4×); (C) is an SqCC with a score of +2 (4×) and (D) is an SqCC with a score of +3 (4×).
Jor 05 00002 g003
Figure 4. The Oncoplot provides an overview of somatic mutations in particular genes (rows) affecting 15 individual patient samples (columns). Color coding indicates the type of mutation. The top bar represents the number of mutations a patient carried; the side bar represents the number of patients who carried a certain mutation; and the bottom bars represents the SNP transitions and transversions. The bars’ colors show the overall distribution of six different conversions in each sample.
Jor 05 00002 g004
Figure 5. CNVs. Copy number alteration profile found in the NSCLC patients. GISTIC analysis of copy number changes in tumors of the genes of interest shown NTRK and ERBB2 amplification. Red color represents amplification and blue represents deletion according to the Gistic package.
Jor 05 00002 g005
Figure 6. IPA. The relationship of Larotrectinib and NTRK1,2,3 with non-small-cell lung cancer using the “Path Explorer” tool in IPA. (A) An elevated level of Larotrectinib was simulated using the “MAP” tool in IPA, showing a direct inhibition of NSCLC through a direct interaction with the Trk receptor. (B) High levels of Larotrectinib block the NTRK1,2,3 genes and inhibit NSCLC. The relationship between the pathways involved are shown as well. CP: Canonical Pathway.
Jor 05 00002 g006
Figure 7. IPA’s model prediction in NSCLC. Blue color represents inhibition in the pathways, and orange color represents activation. Pink triangle depicts NTRK1, NTRK2 and NTRK3 repectively in (AC). Gray lines depict other present signals without activation. (A) Activation of NTRK1 related to lung cancer generation; (B) NTRK2 activation expresses indifferent behavior; (C) a reverse response with the activation of NTRK3 that causes inhibition of the development of lung cancer.
Jor 05 00002 g007
Figure 8. IPA’s model prediction in NSCLC. Blue color represents inhibition in the pathways, and orange color represents activation. Pink triangle depicts NTRK1, NTRK2 and NTRK3 repectively in (AC). Gray lines depict other present signals without inhibition. (A) Inhibition of NTRK1 related with lung cancer inhibition; (B) NTRK2 blocking expresses indifferent behavior; (C) a reverse response where the inhibition of NTRK3 causes the development of lung cancer.
Jor 05 00002 g008
Table 1. Clinicopathological correlation of TRK expression.
Clinical Correlation of NTRKTRK IHC
NegativePositivep-Value
Cohort: 482 patients460/95.4%22/4.6%
Age<70258/53.5%12/2.4%0.887
≥70202/41.9%10/2.1%
SexMale251/52%12/2.5%0.999
Female209/43.4%10/2.1%
HistologyAdCa289/60%3/0.6%0.001
SqCC143/30%16/3.3%
LCC28/5.8%3/0.6%
pT (TNM8)pT1170/35.3%5/1%0.175
pT2–T4290/60.2%17/3.5%
Stage (TNM8)IA172/35.7%7/1.4%0.78
IB183/38%8/1.7%
IIA46/9.5%3/0.6%
IIB51/10.6%4/0,8%
IIIA6/1.2%0/0%
IIIB0/0%0/0%
IV2/0.4%0/0%
GradeG192/19.1%0/0%0.036
G2174/36.1%8/1.7%
G3194/40.2%14/2.9%
Overall survivalDead (10 years)338/70.1%16/3.3%0.938
Alive (10 years)122/25.3%6/1.2%
Table 2. NTRK fusion and driver fusion partners.
CasesFusion PartnerPartner 1Partner 2HistologyNTRK-IHCOther Somatic Mutations
Sample 1AFAP1–NTRK2Chr4Chr9Adca+1TP53 *, PIK3CA
Sample 3ALK–KCNQ5Chr2Chr6SqCC-
Sample 4ALK–CTLCChr2Chr17Adca-
Sample 5ALK–HIP1Chr2Chr7SqCC-PTEN
Sample 6ALK–HIP1Chr2Chr7SqCC-
Sample 6ALK–KCNQ5Chr2Chr6SqCC-
Sample 7TPM3–NTRK1Chr1Chr1SqCC+2
Sample 7ALK–VCLChr2Chr10SqCC-
Sample 8ALK–HIP1Chr2Chr7SqCC-APC
Sample 8ROS1–CEP85LChr6Chr6SqCC-
Sample 9PCM1–NRG1Chr8Chr8Adca-
Sample 10RASEF–NTRK2Chr9Chr9SqCC+3
Sample 10MET–KIF5BChr7Chr10SqCC-
Sample 12RET–SPECC1LChr10Chr22SqCC-NTRK1, RET
Sample 13ROS1–GOPCChr6Chr6LCC-BRAF
Sample 13MET–CAPZA2Chr7Chr7LCC-
* Sample 11 has a nonsense mutation of the TP53 gene. In addition, there are missense mutations of KRAS in sample 15 and APC in sample 2.
Disclaimer/Publisher’s Note: The statements, opinions and data contained in all publications are solely those of the individual author(s) and contributor(s) and not of MDPI and/or the editor(s). MDPI and/or the editor(s) disclaim responsibility for any injury to people or property resulting from any ideas, methods, instructions or products referred to in the content.