Article

A Whole-Body Physiology Model to Investigate Respiratory Function During Exercise Across Different Age Cohorts

1
Division of Healthcare Simulation Sciences, Department of Surgery, University of Washington, Seattle, WA 98195, USA
2
Division of Neonatology, University of Washington, Seattle, WA 98195, USA
3
Southeast Division, Applied Research Associates, Raleigh, NC 27615, USA
*
Author to whom correspondence should be addressed.
J. Respir. 2025, 5(1), 1; https://doi.org/10.3390/jor5010001
Submission received: 12 November 2024 / Revised: 17 January 2025 / Accepted: 25 January 2025 / Published: 31 January 2025
(This article belongs to the Collection Feature Papers in Journal of Respiration)

Abstract

:
Background: There is a limitation in understanding complete cardiopulmonary function during moments of exhaustive exercise due to invasive measurement techniques. We asked how cardiopulmonary function is perturbed during times of exercise in different age cohorts: 6–11 and 11–18. We sought to broadly analyze how age and oxidative stress during exercise differ across age cohorts. Methods: We present a whole-body physiology model that connects the nervous, cardiovascular, respiratory, and oxygen transport and binding systems. We connect these models using a lumped parameter representation of the cardiovascular and respiratory systems. Results: we observe distinct age-related difference in physiological response to exercise. These responses consist of respiratory, cardiovascular, and nervous system perturbations that are distinct across these age groups.

1. Introduction

Whole-body physiological models, specifically those that consider the interconnected cardiopulmonary function [1,2,3,4,5,6], have seen exciting developments over the past couple decades. Physiological function and interplay between organ systems introduce complex, nuanced, and co-regulatory feedback mechanisms, often depending on the state of the patient. This interplay is critical in understanding complex stimuli that impact homeostasis of the patient. For example, during hypovolemic shock, multiple neuromodulators and specific organ level responses interact to regulate blood pressure in the face of reductions in flow [7]. Computational models may help better understand the interplay between the cardiovascular, nervous, and respiratory systems in the face of homeostatic perturbations, when experimental measurements may either be inappropriate (given a trauma patient) or too invasive for humans during specific scenarios (such as arterial catheterization during exercise).
Indeed, there is a push towards understanding the whole-body physiological response to a stimulus. The human physiology is incredibly complex with multiple components and systems that all interact, operating across spatial and temporal scales to inform specific function. One advancement in the field has been network physiology [8,9] where states may emerge due to network organization and topology as well as the dynamics of interaction [8,10,11]. This emergent action has been extended from sleep modeling to exercise physiology [12]. The topology of the cardiopulmonary system presented here is similar to prior research as we present a system that self-regulates horizontally across systems, as well as vertically through circulation and oxygen diffusion. However, we do not consider real-time adaptation of the circulatory network as a response to exercise. We allow other systems to influence circulation by locally augmenting specific fluidic elements to adapt flow characteristics towards their systems specific goals, for example, localized autoregulation of the brain arteries to procure more oxygen in relation to upregulation of ATP needs.
Advances in computational frameworks have given researchers the ability to analyze system-level (and even whole-body) responses of virtual patients. Notably, these models often fail or do not consider perturbations to homeostasis due to stimulus [6,7]. Exercise is a natural perturbation to the resting homeostatic set point. Increases in metabolic activity and the associated interplay between the cardiopulmonary system generate a highly variable response between patients. Volume, flow, oxygenation, and neurological sensing are all rapidly changing in response to exercise events and are so complex that certain non-invasive measurements may be either misleading or not able to measure the entire state of the patient [13,14]. BioGears provides a foundation for understanding the complexities of homeostatic disturbances in the whole-body physiology by linking a lumped parameter circulatory system to various organs and systems in the body that all provide feedback with each other in response to these perturbations.
Although respiratory measurements during exercise physiology are stable, accurate and easily accessible to researchers, more invasive cardiovascular measurements are generally less accurate or too invasive to administer during exercise. In addition, although prominent physiological function is easy to measure in an experimental setting, more nuanced function can be elusive, but they are no more beneficial for scientific inquiry. This includes brain oxygenation, localized oxygen content of specific muscles, and autoregulatory responses of various organ systems, such as respiratory and renal systems. We proposed an initial modeling step towards exploring more nuanced regulatory mechanisms in diverse virtual patient (simulated) populations.
Respiratory function plays a pivotal role in the regulation of oxygen uptake, carbon dioxide elimination, and overall exercise performance. During physical activity, the respiratory system undergoes dynamic changes to meet the increased metabolic demands of the body. Factors influencing respiratory function during exercise include ventilation rate, tidal volume, pulmonary gas exchange, and respiratory muscle fatigue, all in response to cellular energy demand as a function of exercise intensity and duration.
Age-related differences in the physiological responses to exercise necessitate a comprehensive understanding of how respiratory function varies across various developmental stages due to acute homeostatic perturbation (such as exercise events). Furthermore, age-related variations in lung function, respiratory muscle strength, and exercise capacity can influence the interaction between cardiovascular and respiratory dynamics during exercise [15,16,17,18].
Recent advancements in computational modeling have facilitated the ability to properly model complex interrelationships between, exercise physiology, and respiratory function, but not across various age groups, as many of these models do not consider age in their construction [19]. Computational models offer a powerful tool for simulating physiological processes, integrating data from diverse sources, and predicting dynamic responses to different stimuli [20,21,22]. Additionally, mechanistic models of respiratory function during exercise have been developed to characterize the dynamics of ventilation, gas exchange, and respiratory muscle activity in response to varying levels of exertion [3,6,19,23,24,25]. These two modeling applications have yet to be combined, by using models to understand the interplay between the cardiovascular and respiratory function during exercise, stratified by age. By incorporating age-specific parameters and physiological characteristics into these computational frameworks, we aim to elucidate age-dependent differences in respiratory performance during exercise.
The present study aims to address this knowledge gap by employing a computational modeling approach to quantify the relationship between cardiovascular excitation and respiratory function during exercise across two distinct age cohorts (based on the age states defined according to the NICHD pediatric terminology [26]): 6–11 years and 12–16 years. By leveraging computational simulations based on physiological model coupling between multiple biological systems in the body (Figure 1), we seek to elucidate age-specific responses to exercise and implications for respiratory performance.
This research holds significant implications for optimizing exercise strategies in diverse populations, including children and adolescents engaged in physical activity. By elucidating the complex interplay between, exercise, and respiratory function across different age groups, our findings aim to inform evidence-based recommendations for enhancing athletic performance and promoting respiratory health in youth populations.

2. Materials and Methods

2.1. Respiratory Mechanics

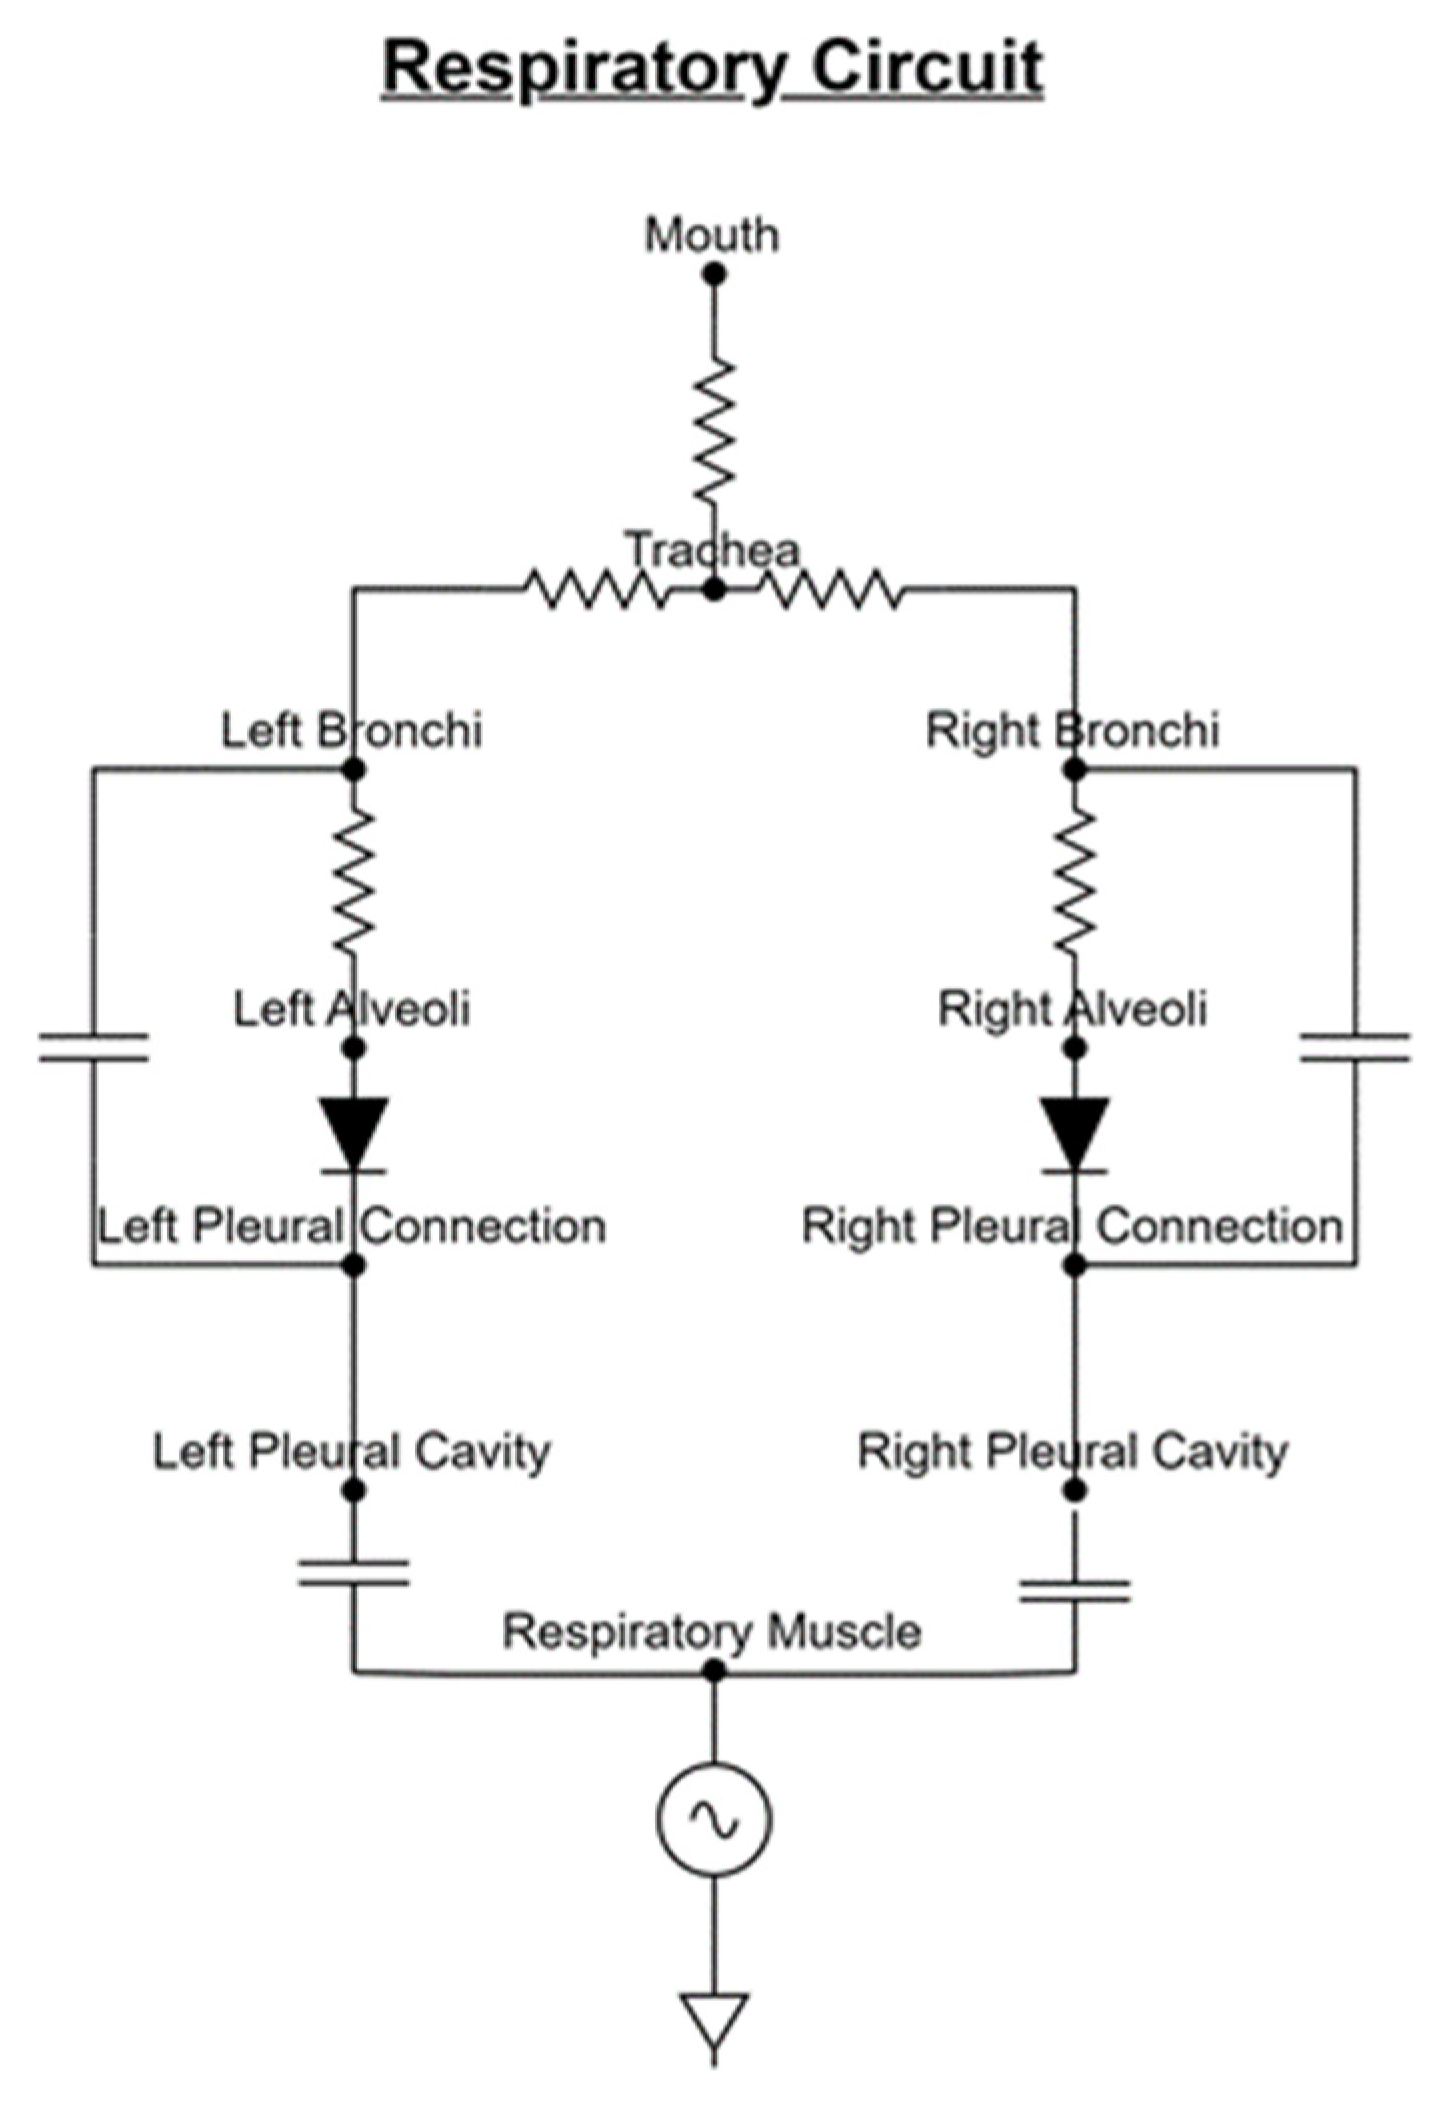
We modeled the respiratory system for this investigation using a 0D lumped circuit element model, being driven by an active muscle model (Figure 2). Similar to prior physiology modeling, we characterized the gas circulation by constructing an electrical circuit analog that characterizes the fluid dynamics [1,2,4]. Using this approximation, we computed the state of the gas inhalation and exhalation by leveraging Kirchhoff’s voltage and current laws at each node on the graph in Figure 2. We began by denoting ground as our reference node, labeling nodes in the system and initializing certain node pressures as a function of experimental data [27] or optimizing them for desired patient dynamics. Once nodes are labeled and initialized, we performed modified nodal analysis [28] to populate a matrix that contained the system dynamics. For each node, we used Kirchhoff’s current and voltage laws to solve for unknown quantities. If voltage is defined across a resistor, we use Ohm’s law to define a relationship between current and voltage. Using this, we constructed the following matrix equation:
G B C D V n I m = I s V s
Here, the G matrix is the nodal admittance matrix (conductance matrix for resistors). B is a matrix representing the connection of voltage sources to nodes. C is the transpose of B. D is a diagonal matrix representing the internal resistances of voltage sources. Vn is the unknown voltages, and Im denotes the unknown currents. Is and Vs denote the current and voltage sources in the system. For our implementation, we note that Is is zero. To handle the compliances in the system, we approximate the current for a given capacitor C using the backward Euler step:
I C t + t = C V C t + t V C t t
Thus, for each capacitor connecting nodes i and j, we write the following equation:
I i t + t = C V i t + t V j t + t t
Now, defining G C = C t , we can derive an update scheme for the G and Z matrices as follows:
G i j = G i j G C Z i = Z i + G C V j t Z j = Z j G C V i t
We note that along the diagonal, we sum the capacitance contribution in the G matrix. Once the matrix is constructed, we use LU factorization to solve the sparse system.
We drive the system using a negative pressure wave, induced by the diaphragm contractions. We base our modeling approach on prior work [19] with the following updated scheme of the respiratory muscle pressure:
P m u s = P m a x I E t 2 + P m a x T I E t ,   0 t I P m a x 1 e x p E τ e x p t I τ e x p E τ , I t T
From this pressure and lumped model of gas circulation, we can move air from the environment into the lungs and calculate oxygen diffusion using a simple first-order diffusion approximation.

2.2. Respiratory Control

For brevity, we will omit a full discussion of the pharmacology model used in the physiology platform. Prior write-ups can elucidate the details regarding administration, clearance, and the pharmacodynamics of the system for a given pharmaceutical agent [22]. Additional control of respiratory dynamics is performed through the chemoreceptors, which respond to perturbations in oxygenation of the blood. As exercise induces tissue energy requirements, oxygen is used by these compartments in response to increased metabolic demand. This oxygen use reduces the amount of dissolved oxygen in the blood, creating a chemoreceptor response. Control of respiration is modeled similarly to other computational studies [5,7]. It is assumed that the central (c) and peripheral (p) feedback define deviations from baseline patient respiration frequency (f) and peak respiratory driver pressure (Pmax) and that their contributions are independent (and thus additive):
f t a r g e t = f b a s e + f p + f c P m a x , t a r g e t = P m a x , b a s e + P m a x , p + P m a x , c
The evolution of the central chemoreceptor feedback is assumed to be a function of arterial carbon dioxide partial pressure (PCO2) deviation from its normal set point (here, we assume a set point of 40 mmHg):
d E p d t = 1 τ E , c E p + τ g E , c P C O 2 t P C O 2 , s e t
The effects (E) are frequency (f) and driver amplitude (P) with associated time constants (τc) and controller gains (τgc). The form of the peripheral feedback is similar to that of the response, but the response is dictated by the combined effects of carbon dioxide pressure and oxygen saturation. The following equation shows how the firing rate (f(t)) is calculated. As before, this equation is applied twice per effect (E = {f, P}):
d E p d t = 1 τ E , p E p + g E , p f t f s e t d f d t = 1 τ f f t + φ φ = f m a x + f m i n e x p P O 2 P O 2 , h a l f k O 2 1 + e x p P O 2 P O 2 , h a l f k O 2 K l n P C O 2 P C O 2 , s e t + γ
The final equation is a sigmoid that outputs the chemoreceptor firing rate (bounded by fmin and fmax). The variables PO2,half and kO2 are the half-max and slope parameters that define the shape of the sigmoid. We adjust the shape as the arterial carbon dioxide pressure (PCO2) deviates from normal levels (PCO2,set). K and γ are tuning parameters used to maintain a steady output when oxygen and carbon dioxide pressures are at their normal values. Parameterization of the model is performed using prior results [5,7].

2.3. Patient Variability

We allometrically scale the cardiopulmonary initial configuration based upon a set of input parameters that we denote at the “patient file”. This file is an .xml file that predetermines the patient state before runtime. For this study, the relevant scaling parameters are provided. We note that the only patient parameter we change for our simulated patients is the age parameter. All others are not adjusted to facilitate a fair analysis of the exercise response between the age cohorts. We scale height as a function of age of the patient:
H a g e = 163 1 + e 0.3 a g e 2
We base this equation on historical growth curves and assume that half of the total height is achieved at 2 years of age. We then use the computed height to determine weight based upon body mass index classifications of the World Health Organization, with the following relationship:
W k g = 21.75 H 2 [ m ]
Here, the brackets denote the units that each quantity is in. From the computed weight of the patient, we can then compute initial parameters that influence the state of the cardiopulmonary system and have direct relevance to the study presented here. First, we compute the total blood volume baseline of the patient [29], given the computed weight:
B V m L = 65.6 W 1.02 [ k g ]
Next, we scale the basal metabolic rate of the patient given their weight, height, age, and sex as, based upon the Harris−Benedict equation:
B M R k c a l d a y = 88.6 + 3.4 W k g + 4.8 H c m 5.7 A y r , M 447.6 + 9.2 W k g + 3.1 H c m 4.3 A y r ,   F
Here, we denote the difference between males (M) and females (F). We limit the maximum heart rate of the patient as a function of age and do not allow for pathologies that would increase the heart rate above the computed threshold:
H R m a x b p m = 208 0.7 A [ y r ]
Finally, we scale a set of respiratory metrics based upon the patient weight:
F R C m L = 20 W [ k g ] T L C m L = 80 W k g R V m L = 16 W k g
where FRC denotes the functional residual capacity, TLC is the total lung capacity, and RV is the residual volume of the patient. From these computed values, we begin an optimization routine prior to simulating the patient that we denote the “stabilization” period of the BioGears engine. From these configurations, we simply generate 26 patients two for each year from 6 to 18 years old (one male and one female). We leave all other possible patient configurations the same between patients besides these settings.

3. Results

We first construct a virtual patient cohort to use for this study. This cohort was developed using patient templates in the BioGears physiology engine [30]. Using this template, we defined 12 patients (6 males and 6 females) for the age cohort of 6–11 and 10 patients (5 males and 5 females) to represent the 12–18 age group. From these two groups of patients, we simulated a series of increasingly strenuous exercise outputs with increases in intensity in a stepwise function. The intensity made the patients generate lactate due anerobic activity in the tissues. The exercise intensity (specified in the simulation scenario) is a number between 0 and 1 that defines the requested fraction of the body’s maximal work rate, which if not specified in the patient file is calculated using the patient’s age and gender [31]. For instance, the average adult male has a maximal work rate of approximately 1200 Watts; therefore, a user-specified exercise intensity of 0.5 would request a work rate of 600 Watts from the body. We noted that the achieved exercise and requested exercise of the patient were not equal, as achieved exercise is the combination of respiration, cardiovascular activity, and tissue ATP needs in the human and within the physiology model implemented in BioGears [14,32,33].

3.1. Exercise and Cardiopulmonary Function

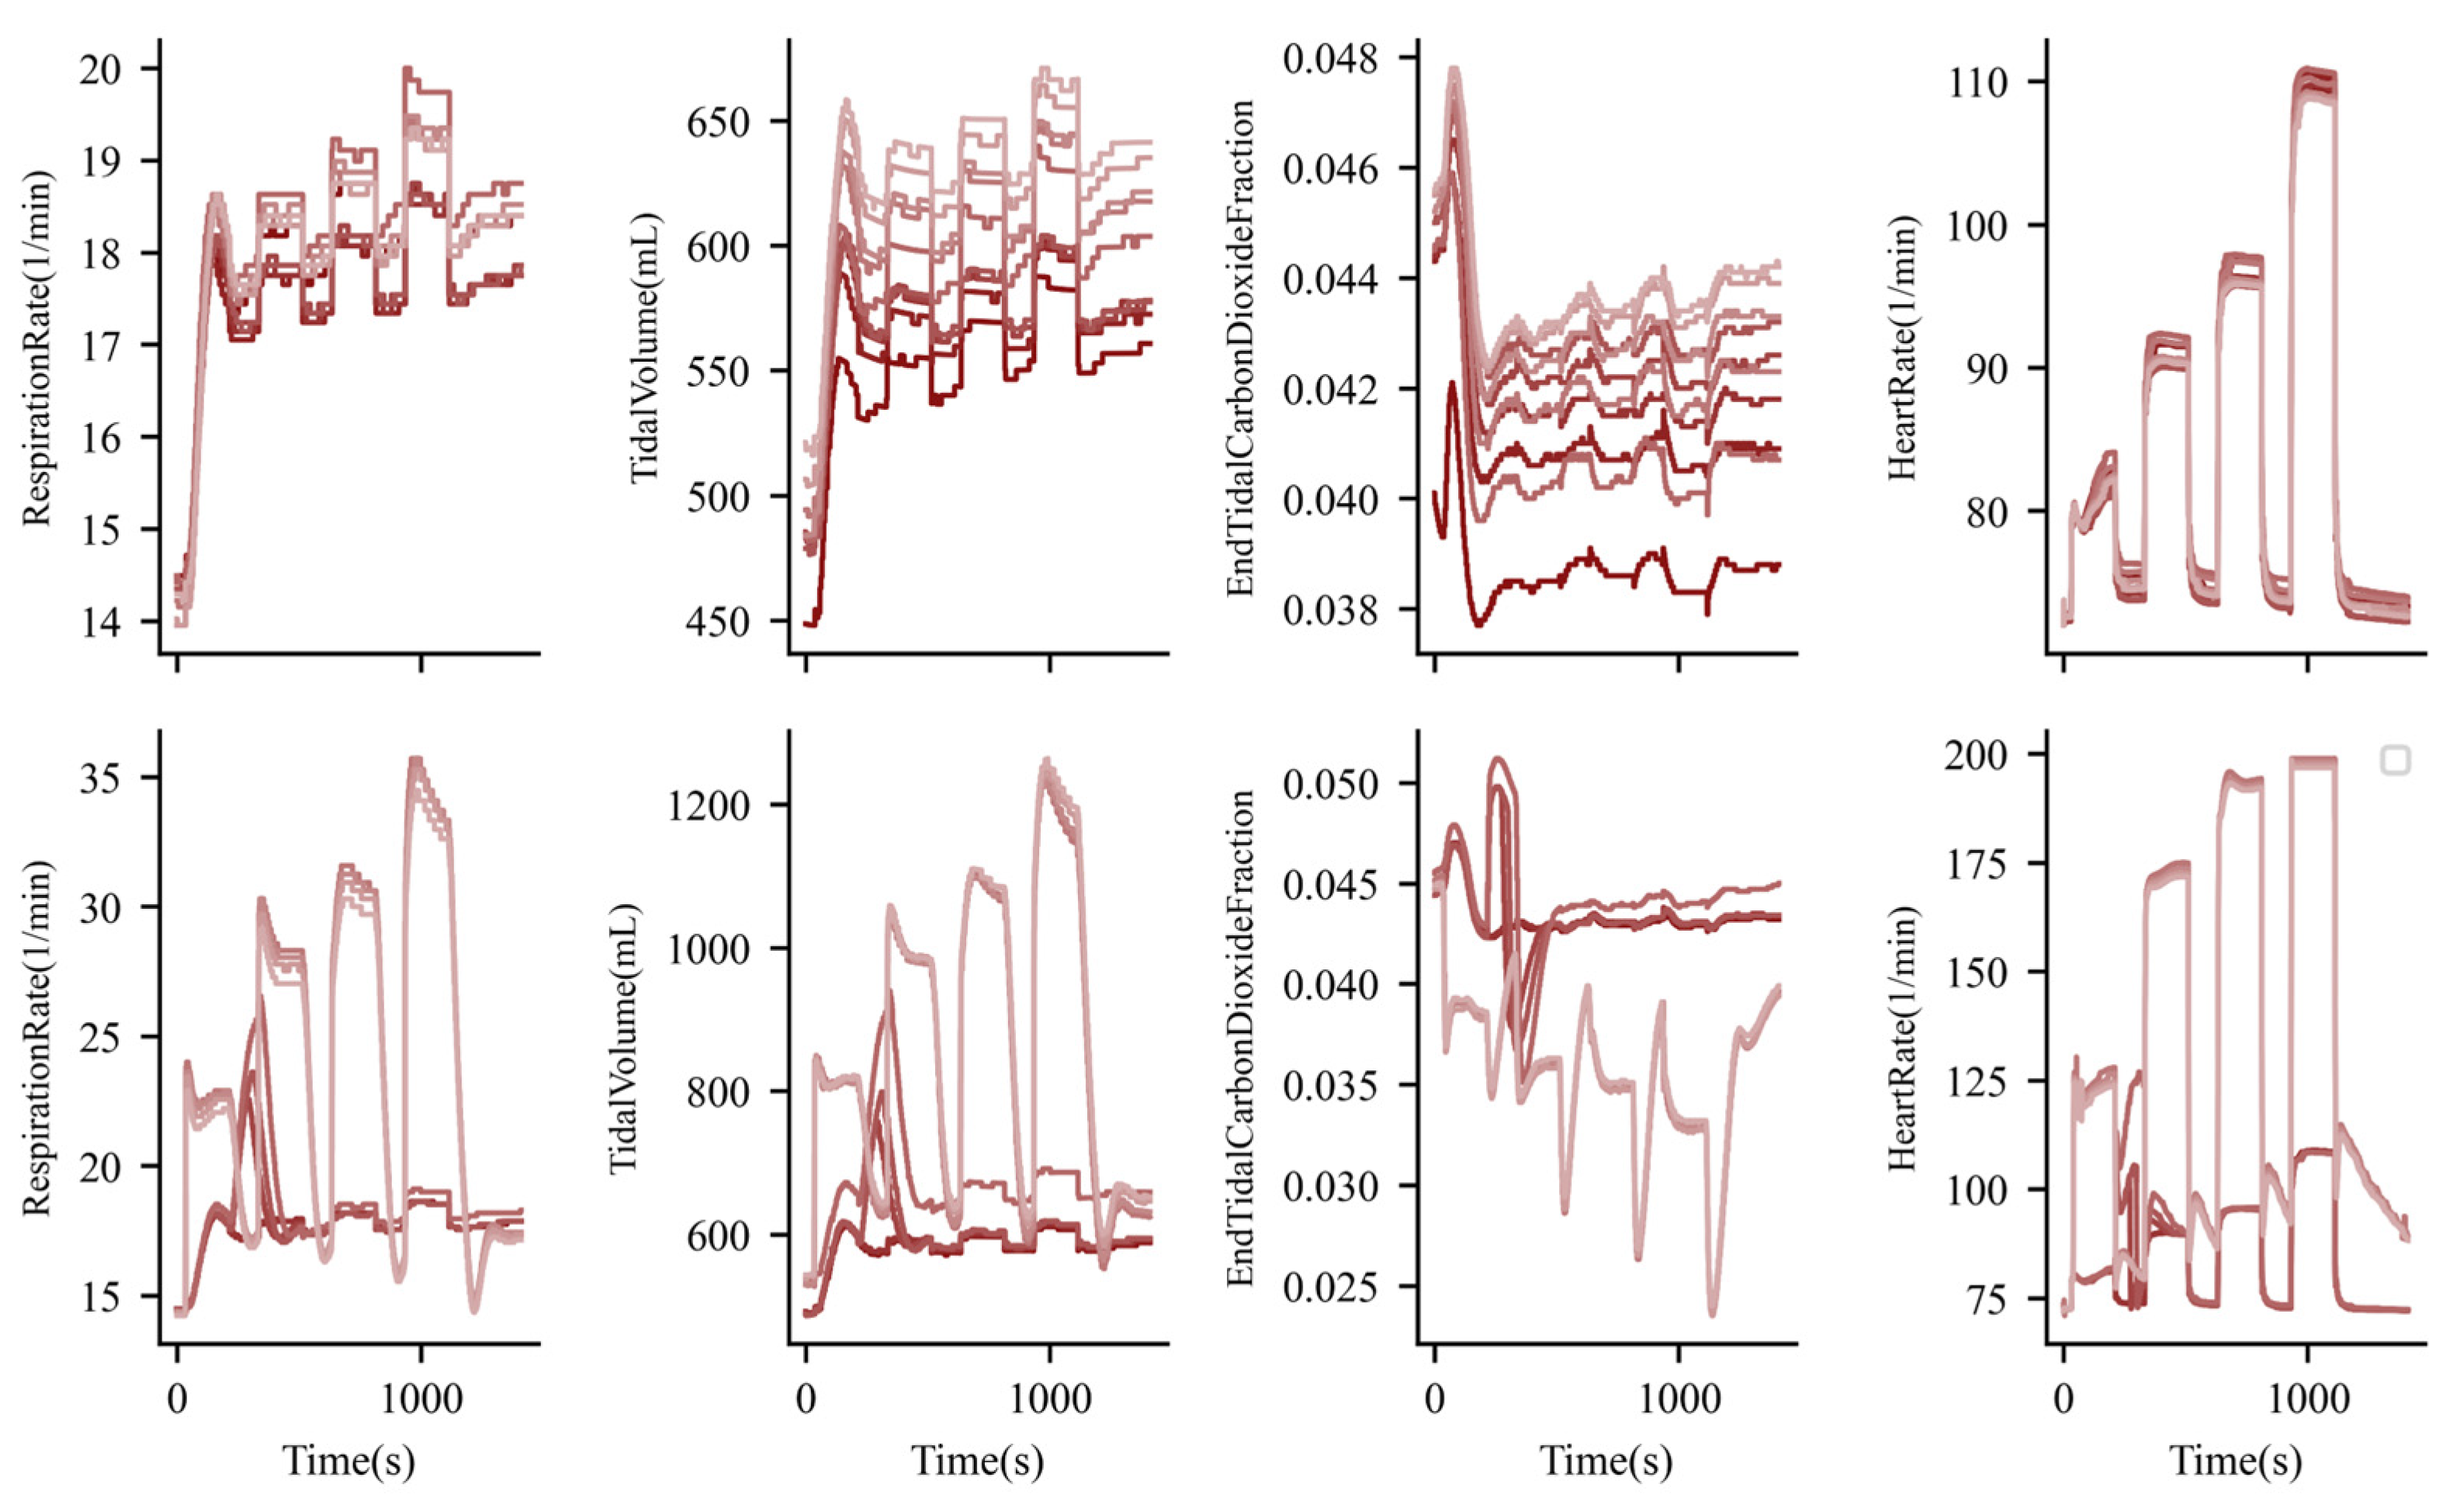
Simulating these cohorts, we present the respiratory response to stepped exercise and compare the two groups (Figure 3). The topmost figure is the younger cohort, and the bottom row plots the older. Coloring denotes distinct patients simulated for the same exercise routine. We observed perturbations to the respiratory function in both cohorts, with the responses being larger in magnitude during the ramp-up phase (increase in exercise intensity) and the ramp-down phase (reduction in intensity) for the older cohort. This showed qualitatively that the nervous system and associated respiratory responses were more mature for the older cohort, in line with the experimental results [17,34]. Rapid increases in respiration rate and tidal volume followed expected trends for both cohorts during and after exercise intensity bursts. We noticed that the end-tidal CO2 fraction was more pronounced in the younger cohort than in the older age groups, denoting the younger cohort’s inability to maintain respiratory performance for maximal exercise. Variability in the results was observed across all cohorts and simulations between patients. This is due to the initialization of the BioGears engine based upon the patient input file. Many volumes were configured as a function of age and gender, and thus, there was variability to the exercise response from individual to individual. More work is needed to extend this variability into the models of the chemoreceptor response to oxygen perturbations, although that extension is beyond the scope of this study.
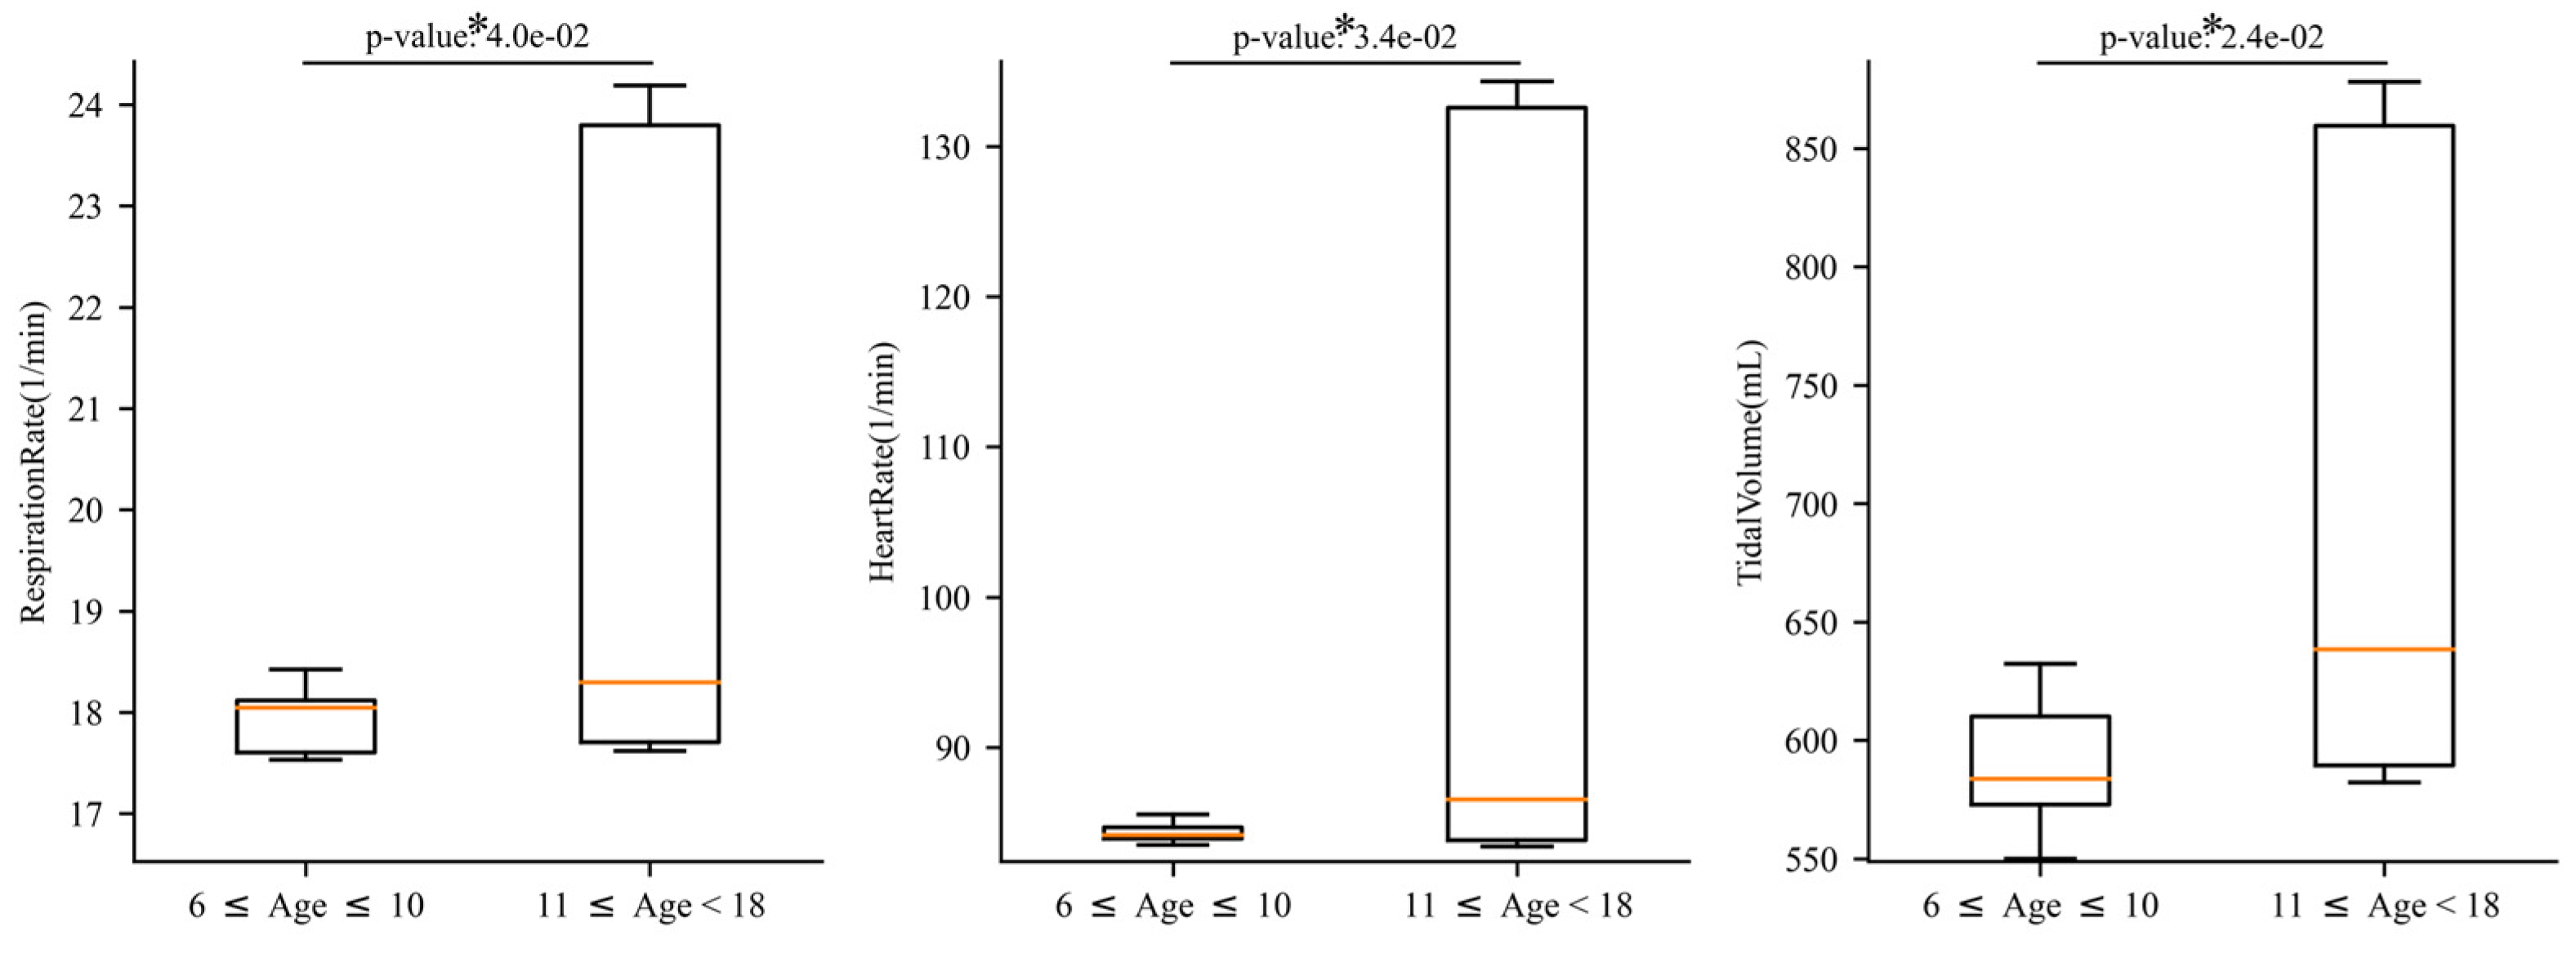
Peak respiratory rates were distinctly different between cohorts, with maximums reaching 35 for the older cohort compared to 20 for the younger cohort. This difference in magnitude was observed across physiological response, with tidal volume and heart rate also showing vastly different maximal values between cohorts (Figure 4): We noted that this difference was statistically significant when averaged over the entire simulation time window for each patient simulated in the two patient cohorts. Here, we denoted statistical significance by performing Welch’s t-test [35] between the young and old cohorts and the computed mean value over the entire simulation time. In this way, we rejected the null hypothesis, which is as follows: Are the mean values for each measurement equal between the two age cohorts? Thus, we set a threshold for this question by denoting a p-value of < 0.05 as rejecting this hypothesis. The maximal changes in tidal volume are 1200 mL for one cohort compared to 600 mL for the other, and the heart rate difference was 200 bpm for one cohort compared to 110 bpm for the other. The tidal volume response made sense within the context of age dependent development of respiratory volumes. The heart rate and the respiration rate differences would primarily be due to metabolic requirements, oxygen consumption, and nervous system response to the exercise events.
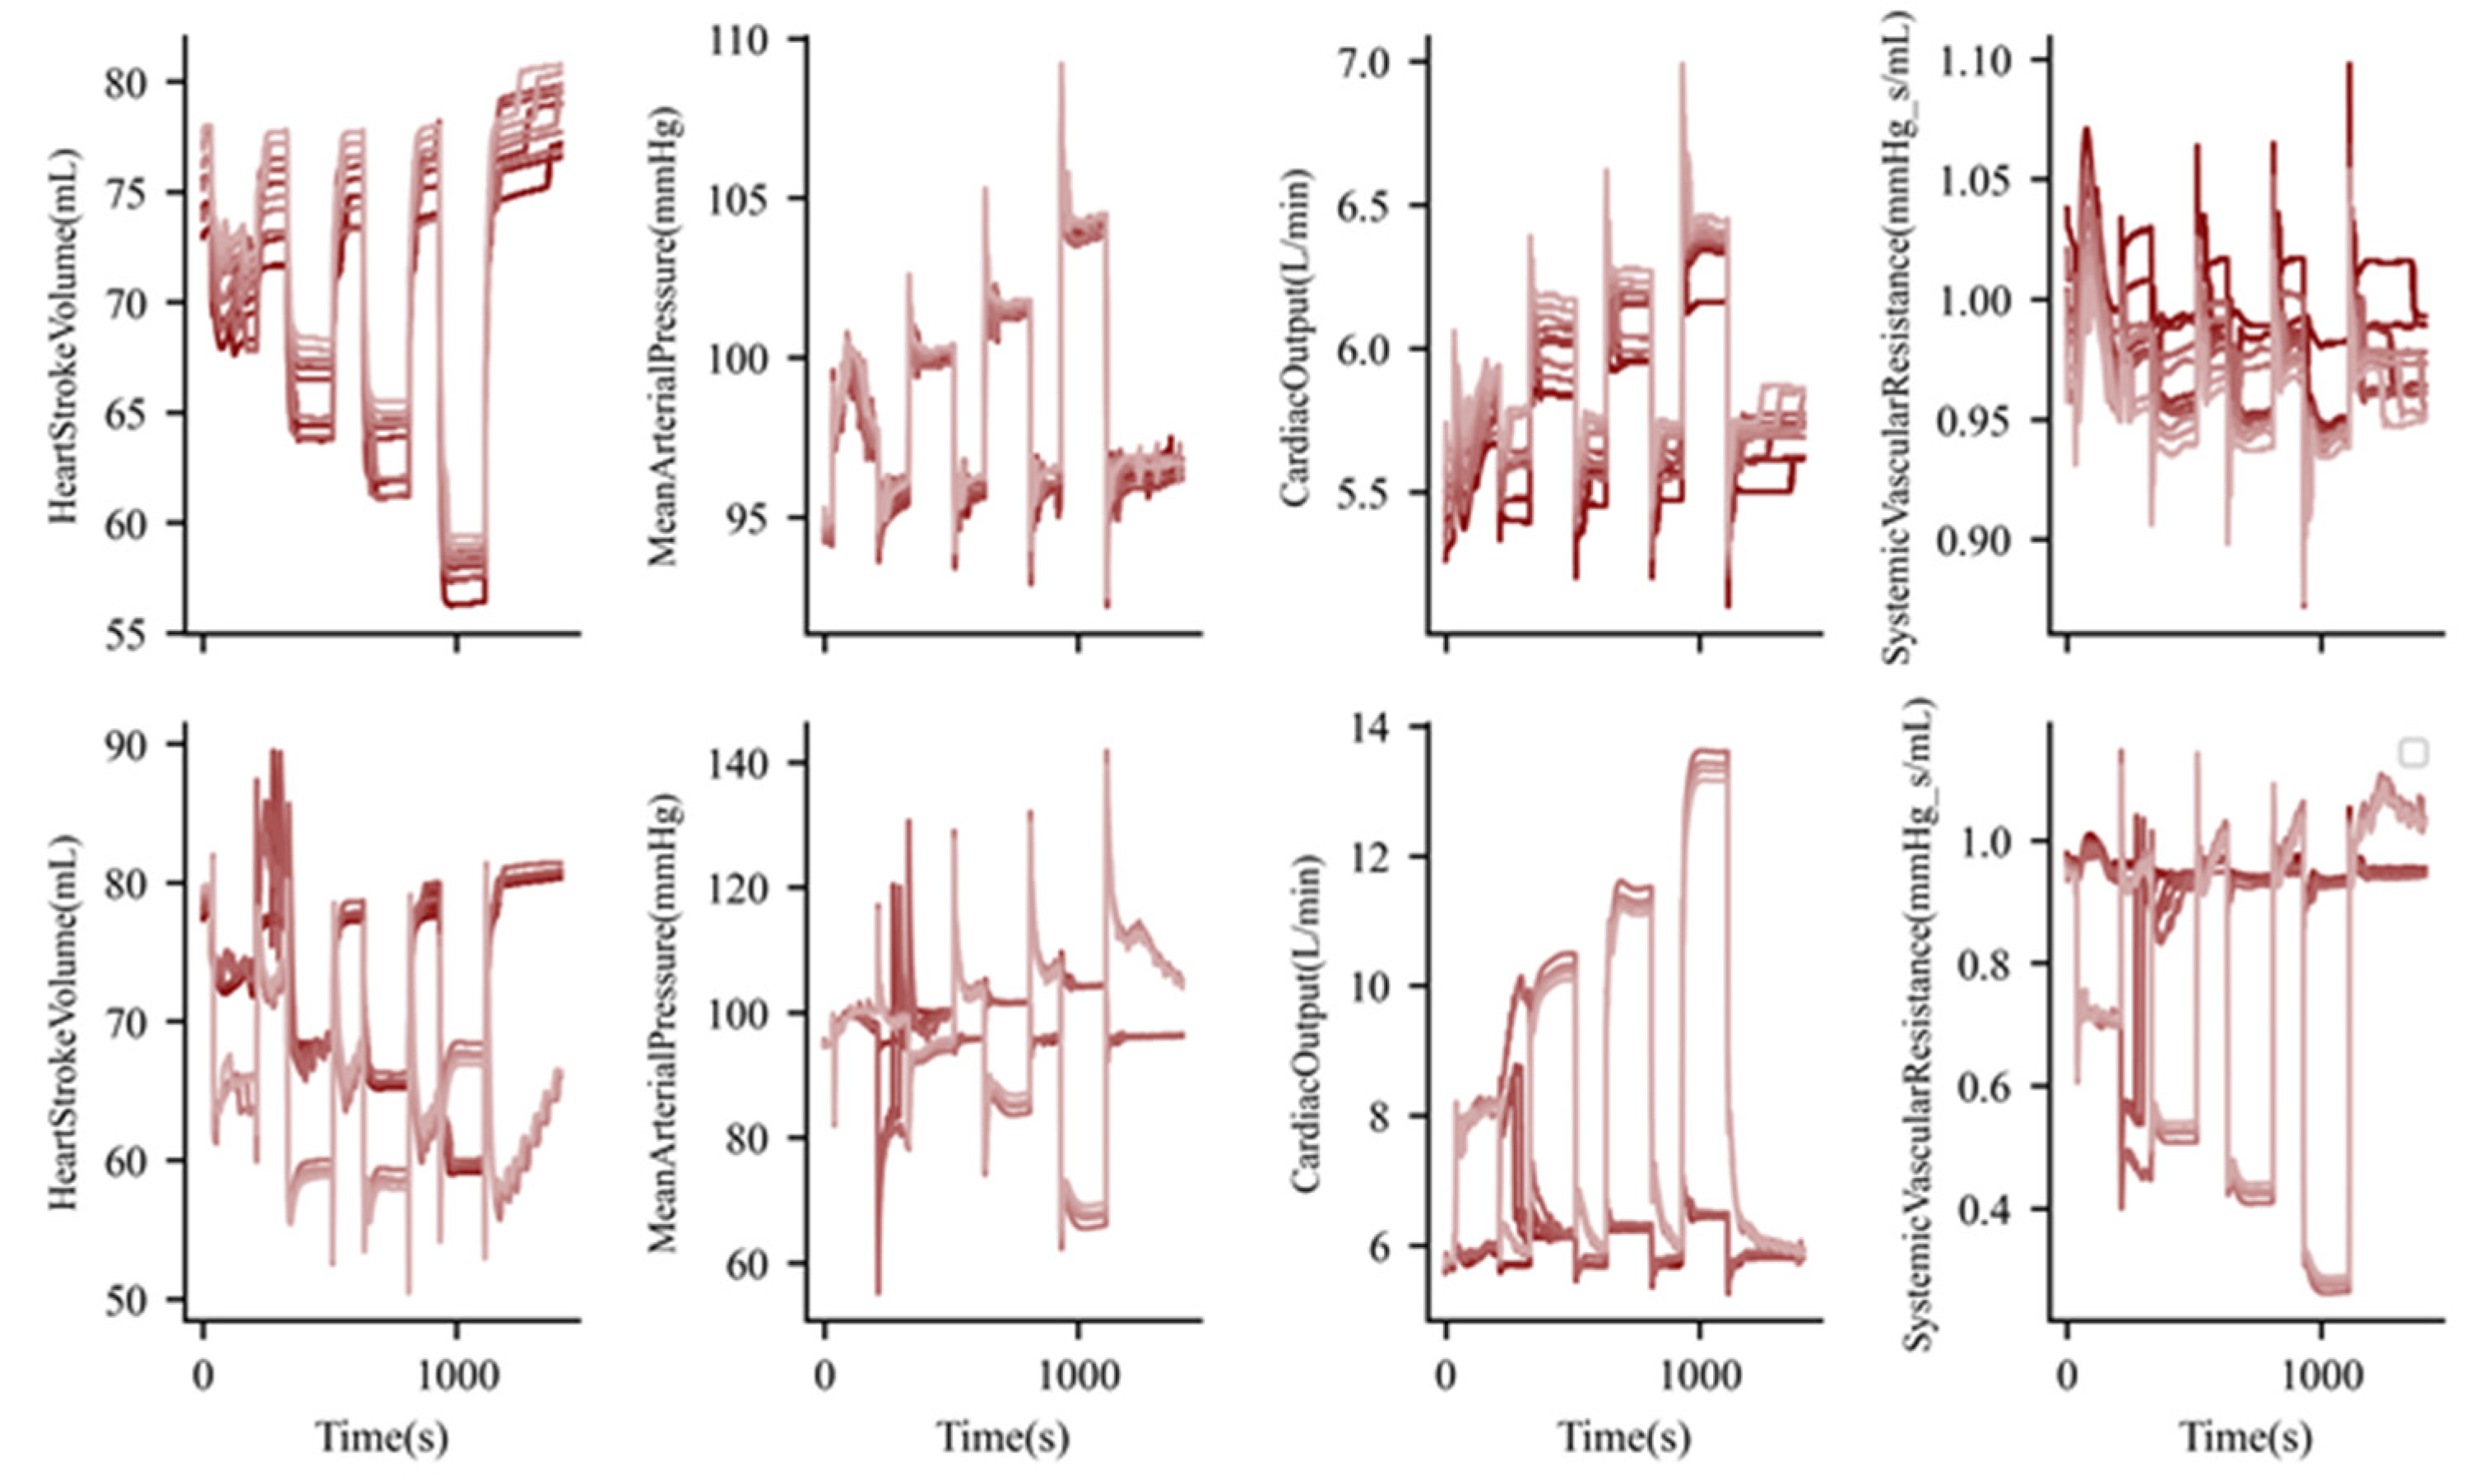
Cardiovascular physiology is also different between the two age cohorts (Figure 5). For cardiovascular function, we observed a distinct difference in variance across age groups with distinct dynamics differing in response to the same exercise regime in the older cohort. For example, for selecting patients in the older cohort, we identified moderate decreases in heart stoke volume, but in others, we detected a more severe response. This can also be seen in selected patients for mean arterial pressure, cardiac output, and vascular resistance. Ultimately, it seemed that the cumulative, patient-specific variance was greater in the older age group than that in the younger cohort. We hypothesize that this distinct change in dynamics is due to the nonlinearity of the couple systems being simulated. This nonlinearity (we proposed) has a distinct age-dependent bifurcation in the dynamics. This change may also be a transition state that was reached, pushing the dynamics into a different region of simulation. The exact explanation for this increase in variance in the older age group will be an area of future studies. Seeing distinct transition states is not necessarily unrealistic as humans experience significant physiological changes during puberty [36,37], so we may expect more variance in an age cohort consisting of twelve- to eighteen-year-olds. The fact that this variance is seen with such a simple age-related perturbation to the initial configuration of the model state is interesting and worth investigating further.
Additional cardiovascular metrics were distinct between the young and older cohorts during simulated exercise. We identified a distinct decrease in stoke volume as heart rate increases. This heart rate increase led to less refill time, with an expected decrease in stroke volume. These two metrics combined to result in cardiac output increase that was qualitatively in line with experimental studies [13]. These increases were much larger in the older age cohort due to anatomical differences in the size of the heart and the ability of the cardiovascular system to respond to oxygen perturbations owing to exercise. Reductions in systemic vascular resistance were a localized response to dilate blood vessels to compensate for an oxygen deficit. Reductions were much larger in the older age cohort due to a more mature nervous system, effectively responding to the oxygen requirements of the systemic vessels and surrounding tissues.

3.2. Exercise and Nervous System Function

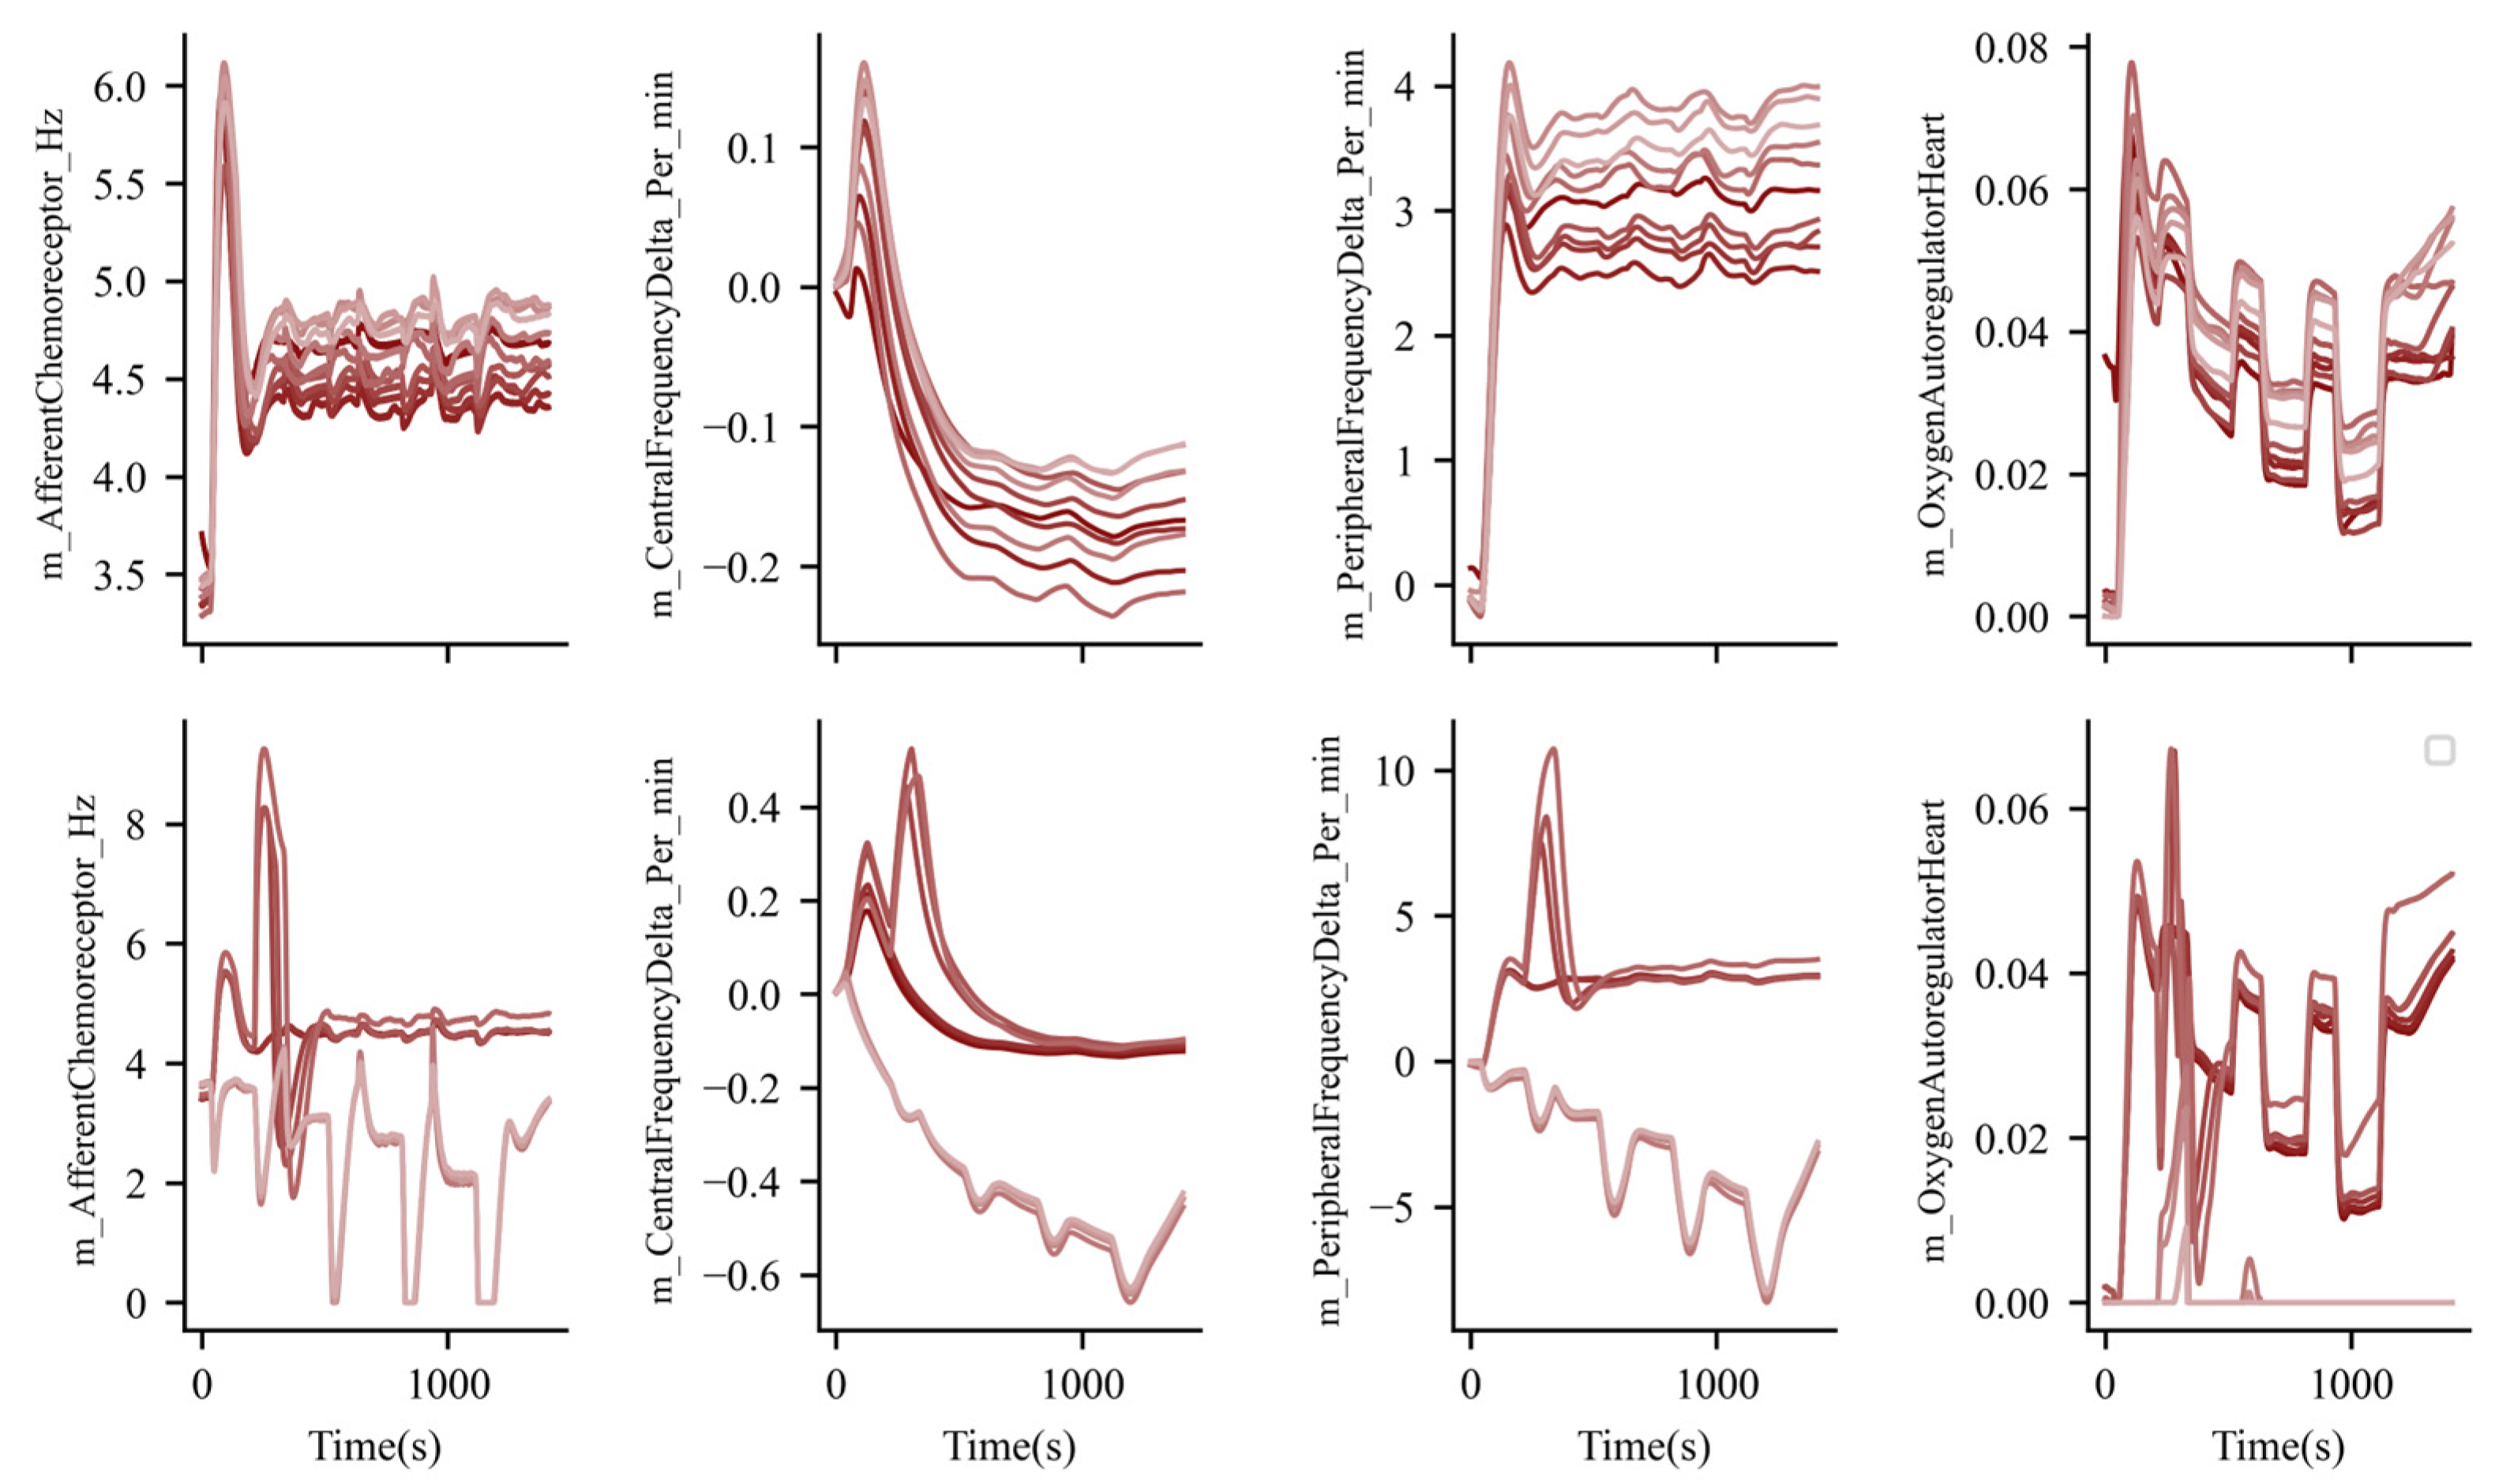
We then extracted relevant nervous system information from the BioGears engine to determine the age-dependent response of the nervous system. For mathematical details of the nervous system model, including the validation of the corresponding hypoxia, see our prior work [38]. Like our broad respiratory metrics, we observed a similar difference in the time course of nervous system parameters between age cohorts. Here, the chemoreceptor firing rate (in Hz) denotes the frequency at which the chemoreceptors send adjustments to respiratory response based on sensed changes in O2 plasma levels. O2 is broadly diminished during acute exercise due to the rapid increased metabolic demand of the tissue. The chemoreceptors sense this perturbation to determine the pacing of the body’s response to these broad changes.
The central frequency is the parasympathetic culmination of all nervous responses. All the signals were collected and then non-linearly weighted to be projected to the various organs in the body. This frequency was globally decreased due to exercise and was much lower in a selected older age group within the much older cohort (Figure 6). These differences dictate the changes in the body’s nervous system response with age, related to respiratory fluctuations. Broadly, the younger cohort had a larger central nervous response due to the lower lung volumes and inability to generate the desired energy needed for the exercise being performed. The peripheral signal was directly calculated in the peripheral nerves and was transferred to the central compartment for processing. We observed an inverse relationship in this measurement. The weighting was an inverse log function, so the central response was inversely proportional to the peripheral response.
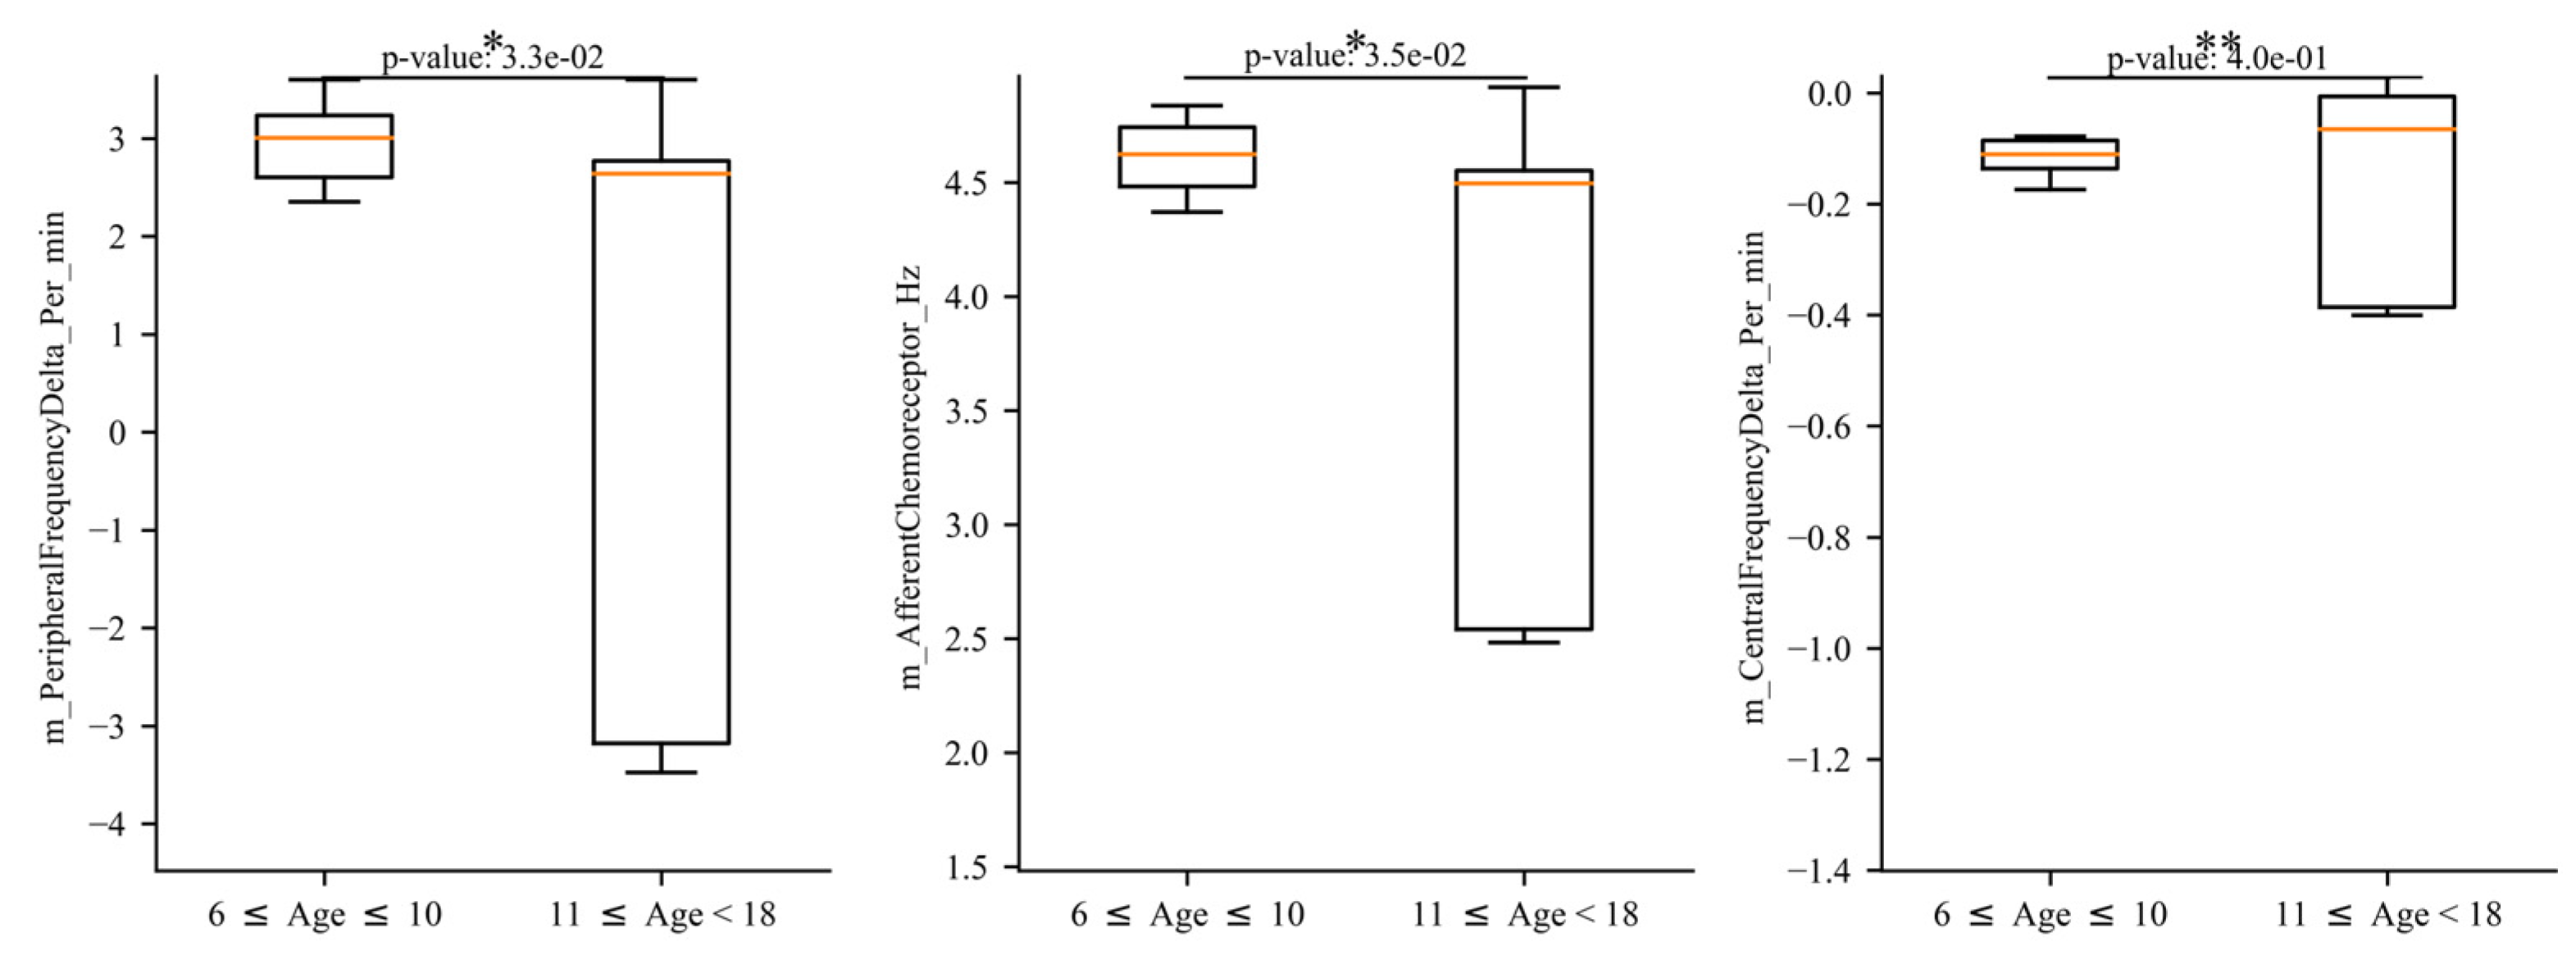
Finally, we collected the local cardiovascular response to oxygen perturbations due to exercise. Local changes impacted vascular changes to increase blood supply to the cardiac tissue. These vascular changes dilated vessels to increase oxygen delivery in times of oxygen deficit. We observed that the localized response was attenuated in the younger cohort compared to in the older cohort. This is consistent with the other nervous response changes between age cohorts, similar to the large variance seen in cardiovascular response in the older age cohort. We then tested the statistical significance between age cohorts and identified the significance in physiological response for afferent and peripheral response, but not for central response (Figure 7). This may be due to the non-linear transform of the peripheral response which smooths the input to some degree, effectively diminishing the statistical significance.

4. Discussion

This study is the first example of applying BioGears to a pediatric age group. To date, the BioGears physiology model has included the ability to adjust the patient that is used as an input parameter to the model. This patient file is used for the initial configuration of the lumped parameter model, which includes initial volumes, resistances, and pressures across the organs and tissues being modeled. What was missing from the model was the ability to configure geriatric or pediatric populations. The model was updated to allow for ages under 18 in the initial configuration file, including weight-adjusted parameterization. When allowed to construct younger patients, statistical significance was demonstrated between age groups in the model for distinct patients performing stepped exercise scenarios. The significance was seen across numerous cardiopulmonary physiological metrics which qualitatively matched the experimental behavior.
We believe that models and frameworks, such as BioGears, allow for open-source collaboration between investigators to construct a sophisticated whole-body physiology model. This model, coupled to patient variance, can serve a simulated reference for clinical trial construction, in-silico investigations into pharmaceutical interventions, and as a research platform to investigate patient variability in trauma response. Each of these needs more work to provide depth, validation, and extensibility of the platform to perform in a robust manner, but investigations like this one are good steps towards disseminating the modeling philosophy and showcasing the potential of the platform to provide sophisticated feedback and response.
It is essential that future work highlights quantitative features that are validated on real human physiological data. Although difficult, much of this validation may be performed in isolation from certain features of the presented work. For example, we may be able to validate this model using a specific exercise routine or across a distinct age group, but not for stepped exercise across two age cohorts. Given the flexibility of a simulation platform, future work may progress in this direction. Future work may also target system-level responses to age that were not considered in this manuscript. This may include nervous system response as a function of age. For example, investigations into how the baroreceptor response rate during exercise varies by age may provide critical information regarding model adjustments given the initial patient parameter.
We also note that parameterization of these models must be investigated in future efforts to identify areas of sensitivity and uncertainty in outcomes. Perturbing the nervous system parameterization and understanding how the cardiopulmonary system adjusts in response to exercise may elucidate manifolds that lead to distinct patient outcomes and physiological states. This includes trauma, exercise, and interventions such as drugs. We aim to explore these spaces in more detail in future work.
More broadly, we note that mathematical models are often developed with a specific cohort in mind, not with patient-specific configurations as an input parameter. Age must be considered for a model to be contextualized for large cohorts. BioGears is a sophisticated physics-based model of human whole-body physiology, with specific models to support acute changes in homeostasis. Distinct physiological changes due to age define the patient and must be considered in the model at the inception. Pulmonary physiology changes with age in children include increases in pulmonary compliance and function with age [39,40,41]. Similarly, changes in cardiac physiology are seen with age and maturation of the autonomic nervous system. We aim to continue to expand the flexibility of the system-level models in BioGears to consider age parameterization in a more nuanced manner, especially the pulmonary and cardiovascular systems.
Finally, we note that a platform like the BioGears physiology engine is a library with a dynamic, responsive application programming interface built into the software architecture. There are numerous applications that may be built with the BioGears libraries. One application of note is healthcare simulation education. This educational paradigm supports active learning through participation in simulated scenarios to treat patients. BioGears has been used in numerous simulation platforms including tablet training for burncare [42] and surgical instruction [43]. Other simulation platforms have been developed specifically for pediatrics [44,45] and neonatology [46,47,48,49]. Of these platforms, there is an opportunity to integrate the BioGears platform into educational tools that can train clinical providers on the nuances in pediatric and neonatal physiology.

5. Conclusion

In conclusion, we have developed a mathematical model of the whole-body physiological response to exercise that includes age-associated adjustments. Using age as an input parameter we scale the cardiopulmonary system and initialize a distinct patient state. From this initial configured patient, we investigate exercise response by having the simulated patient perform increasingly strenuous exercise events, in a stepped wise manner, with periodic breaks in between events. We find distinct age-related differences to this exercise event in the patient populations, demonstrating the model’s capacity to simulate variable patient response as a function of age. Other future work will target validation, sensitivity of the model, and future simulation platform integration.

Author Contributions

Conceptualization, A.B., R.A.U., M.G. and T.L.S.; methodology, A.B. and S.A.W.; software, A.B. and S.A.W.; validation, A.B., R.A.U. and M.G. formal analysis, A.B.; investigation, A.B., R.A.U., T.L.S. and M.G.; resources, A.B.; data curation, A.B.; writing—original draft preparation, A.B.; writing—review and editing, A.B., S.A.W., R.A.U., M.G. and T.L.S.; visualization A.B.; supervision, R.A.U., M.G. and T.L.S.; project administration, A.B. All authors have read and agreed to the published version of the manuscript.

Funding

This research received no external funding.

Institutional Review Board Statement

Not applicable.

Informed Consent Statement

Not applicable.

Data Availability Statement

The original data presented in the study are openly available at https://doi.org/10.5061/dryad.b5mkkwhpj. The BioGears physiology engine is an open-source physiology modeling platform and is available here: https://github.com/BioGearsEngine/core.

Acknowledgments

We would like to acknowledge the support and guidance of Hugh Connacher, Harvey Magee, Brett Talbot, and Geoff Miller who provided excellent leadership during the original development of the BioGears project. We would also like to acknowledge critical members of the BioGears development team over the years: Matthew McDaniel, Jenn Carter, Jeff Webb, Aaron Bray, and Rachel Clipp.

Conflicts of Interest

The authors declare no conflicts of interest.

References

  1. Visaria, R. Lumped Parameter Modeling of Human Respiratory System. In Theory and Applications of Heat Transfer in Humans; John Wiley & Sons, Ltd.: Hoboken, Nj, USA, 2018; pp. 119–131. [Google Scholar]
  2. Fukui, Y.; Smith, N.T. Interactions among ventilation, the circulation, and the uptake and distribution of halothane—Use of a hybrid computer multiple model: I. The basic model. Anesthesiology 1981, 54, 107–118. [Google Scholar] [CrossRef] [PubMed]
  3. Neelakantan, S.; Xin, Y.; Gaver, D.P.; Cereda, M.; Rizi, R.; Smith, B.J.; Avazmohammadi, R. Computational lung modelling in respiratory medicine. J. R. Soc. Interface 2022, 19, 20220062. [Google Scholar] [CrossRef] [PubMed]
  4. Tawhai, M.H.; Hunter, P.J. Characterising respiratory airway gas mixing using a lumped parameter model of the pulmonary acinus. Respir. Physiol. 2001, 127, 241–248. [Google Scholar] [CrossRef] [PubMed]
  5. Albanese, A.; Cheng, L.; Ursino, M.; Chbat, N.W. An integrated mathematical model of the human cardiopulmonary system: Model development. Am. J. Physiol. Heart Circ. Physiol. 2016, 310, H899–H921. [Google Scholar] [CrossRef]
  6. Talaminos-Barroso, A.; Reina-Tosina, J.; Roa-Romero, L.M.; Ortega-Ruiz, F.; Márquez-Martín, E. Computational modeling of the control mechanisms involved in the respiratory system. In Control Applications for Biomedical Engineering Systems; Azar, A.T., Ed.; Academic Press: Cambridge, MA, USA, 2020; pp. 325–357. [Google Scholar]
  7. Magosso, E.; Ursino, M. A mathematical model of CO2 effect on cardiovascular regulation. Am. J. Physiol. Heart Circ. Physiol. 2001, 281, H2036–H2052. [Google Scholar] [CrossRef]
  8. Balagué, N.; Hristovski, R.; Almarcha, M.; Garcia-Retortillo, S.; Ivanov, P.C. Network Physiology of Exercise: Vision and Perspectives. Front. Physiol. 2020, 11, 611550. [Google Scholar] [CrossRef]
  9. Garcia-Retortillo, S.; Abenza, Ó.; Vasileva, F.; Balagué, N.; Hristovski, R.; Wells, A.; Fanning, J.; Kattula, J.; Ivanov, P.C. Age-related breakdown in networks of inter-muscular coordination. GeroScience 2024, 1–25. [Google Scholar] [CrossRef]
  10. Ivanov, P.C.; Liu, K.K.L.; Bartsch, R.P. Focus on the emerging new fields of network physiology and network medicine. New J. Phys. 2016, 18, 100201. [Google Scholar] [CrossRef]
  11. Bartsch, R.P.; Liu, K.K.L.; Bashan, A.; Ivanov, P.C. Network Physiology: How Organ Systems Dynamically Interact. PLoS ONE 2015, 10, e0142143. [Google Scholar] [CrossRef]
  12. Bashan, A.; Bartsch, R.P.; Kantelhardt, J.W.; Havlin, S.; Ivanov, P.C. Network physiology reveals relations between network topology and physiological function. Nat. Commun. 2012, 3, 702. [Google Scholar] [CrossRef]
  13. Åstrand, P.-O.; Cuddy, T.E.; Saltin, B.; Stenberg, J. Cardiac output during submaximal and maximal work. J. Appl. Physiol. 1964, 19, 268–274. [Google Scholar] [CrossRef] [PubMed]
  14. Noakes, T.D. Fatigue is a Brain-Derived Emotion that Regulates the Exercise Behavior to Ensure the Protection of Whole Body Homeostasis. Front. Physiol. 2012, 3, 82. [Google Scholar] [CrossRef] [PubMed]
  15. Goldstein, E.R.; Ziegenfuss, T.; Kalman, D.; Kreider, R.; Campbell, B.; Wilborn, C.; Taylor, L.; Willoughby, D.; Stout, J.; Graves, B.S.; et al. International society of sports nutrition position stand: Caffeine and performance. J. Int. Soc. Sports Nutr. 2010, 7, 5. [Google Scholar] [CrossRef] [PubMed]
  16. Guest, N.S.; VanDusseldorp, T.A.; Nelson, M.T.; Grgic, J.; Schoenfeld, B.J.; Jenkins, N.D.M.; Arent, S.M.; Antonio, J.; Stout, J.R.; Trexler, E.T.; et al. International society of sports nutrition position stand: Caffeine and exercise performance. J. Int. Soc. Sports Nutr. 2021, 18, 1. [Google Scholar] [CrossRef]
  17. Chinn, S.; Rona, R.J. Height and age adjustment for cross sectional studies of lung function in children aged 6–11 years. Thorax 1992, 47, 707–714. [Google Scholar] [CrossRef]
  18. Kassim, Z.; Greenough, A.; Rafferty, G.F. Effect of caffeine on respiratory muscle strength and lung function in prematurely born, ventilated infants. Eur. J. Pediatr. 2009, 168, 1491–1495. [Google Scholar] [CrossRef]
  19. Sarmiento, C.A.; Hernández, A.M.; Serna, L.Y.; Mañanas, M.Á. An integrated mathematical model of the cardiovascular and respiratory response to exercise: Model-building and comparison with reported models. Am. J. Physiol. Heart Circ. Physiol. 2021, 320, H1235–H1260. [Google Scholar] [CrossRef]
  20. McDaniel, M.; Keller, J.M.; White, S.; Baird, A. A Whole-Body Mathematical Model of Sepsis Progression and Treatment Designed in the BioGears Physiology Engine. Front. Physiol. 2019, 10, 1321. [Google Scholar] [CrossRef]
  21. Lehmann, E.D.; Deutsch, T. A physiological model of glucose-insulin interaction in type 1 diabetes mellitus. J. Biomed. Eng. 1992, 14, 235–242. [Google Scholar] [CrossRef]
  22. McDaniel, M.; Carter, J.; Keller, J.M.; White, S.A.; Baird, A. Open Source Pharmacokinetic/Pharmacodynamic Framework: Tutorial on the BioGears Engine. CPT Pharmacomet. Syst. Pharmacol. 2019, 8, 12–25. [Google Scholar] [CrossRef]
  23. Wall, W.A.; Wiechert, L.; Comerford, A.; Rausch, S. Towards a comprehensive computational model for the respiratory system. Int. J. Numer. Methods Biomed. Eng. 2010, 26, 807–827. [Google Scholar] [CrossRef]
  24. Molkov, Y.I.; Rubin, J.E.; Rybak, I.A.; Smith, J.C. Computational models of the neural control of breathing. WIREs Syst. Biol. Med. 2017, 9, e1371. [Google Scholar] [CrossRef] [PubMed]
  25. Serna, L.Y.; Mañanas, M.A.; Hernández, A.M.; Rabinovich, R.A. An Improved Dynamic Model for the Respiratory Response to Exercise. Front. Physiol. 2018, 9, 69. [Google Scholar] [CrossRef] [PubMed]
  26. Williams, K.; Thomson, D.; Seto, I.; Contopoulos-Ioannidis, D.G.; Ioannidis, J.P.A.; Curtis, S.; Constantin, E.; Batmanabane, G.; Hartling, L.; Klassen, T.; et al. Standard 6: Age Groups for Pediatric Trials. Pediatrics 2012, 129, S153–S160. [Google Scholar] [CrossRef]
  27. Levitzky, M.G. Pulmonary Physiology; LANGE Physiology Series; McGraw-Hill Education: New York, NY, USA, 2007. [Google Scholar]
  28. Ho, C.-W.; Ruehli, A.; Brennan, P. The modified nodal approach to network analysis. IEEE Trans. Circuits Syst. 1975, 22, 504–509. [Google Scholar] [CrossRef]
  29. Morgan, G.E., Jr.; Mikail, M.S. Clinical Anesthesiology, 2nd ed.; Appleton & Lange: Norwalk, CT, USA, 1996; p. 881. [Google Scholar]
  30. Baird, A.; McDaniel, M.; White, S.A.; Tatum, N.; Marin, L. BioGears: A C++ library for whole body physiology simulations. J. Open Source Softw. 2020, 5, 2645. [Google Scholar] [CrossRef]
  31. Plowman, S.A.; Smith, D.L. Exercise Physiology for Health Fitness and Performance; Lippincott Williams & Wilkins: Philadelphia, PA, USA, 2013. [Google Scholar]
  32. Behrens, M.; Gube, M.; Chaabene, H.; Prieske, O.; Zenon, A.; Broscheid, K.-C.; Schega, L.; Husmann, F.; Weippert, M. Fatigue and Human Performance: An Updated Framework|Sports Medicine. Available online: https://link.springer.com/article/10.1007/s40279-022-01748-2 (accessed on 16 October 2024).
  33. Furrer, R.; Hawley, J.A.; Handschin, C. The molecular athlete: Exercise physiology from mechanisms to medals. Physiol. Rev. 2023, 103, 1693–1787. [Google Scholar] [CrossRef]
  34. Lum, S.; Stocks, J.; Stanojevic, S.; Wade, A.; Robinson, P.; Gustafsson, P.; Brown, M.; Aurora, P.; Subbarao, P.; Hoo, A.; et al. Age and height dependence of lung clearance index and functional residual capacity. Eur. Respir. J. 2013, 41, 1371–1377. [Google Scholar] [CrossRef]
  35. West, R.M. Best practice in statistics: Use the Welch t-test when testing the difference between two groups. Ann. Clin. Biochem. 2021, 58, 267–269. [Google Scholar] [CrossRef]
  36. Cameron, N.; Schell, L. Human Growth and Development; Academic Press: Cambridge, MA, USA, 2021. [Google Scholar]
  37. Wheeler, M.D. Physical changes of puberty. Endocrinol. Metab. Clin. 1991, 20, 1–14. [Google Scholar] [CrossRef]
  38. Baird, A.; White, S.A.; Das, R.; Tatum, N.; Bisgaard, E.K. Whole body physiology model to simulate respiratory depression of fentanyl and associated naloxone reversal. Commun. Med. 2024, 4, 114. [Google Scholar] [CrossRef] [PubMed]
  39. Gerhardt, T.; Hehre, D.; Feller, R.; Reifenberg, L.; Bancalari, E. Pulmonary mechanics in normal infants and young children during first 5 years of life. Pediatr. Pulmonol. 1987, 3, 309–316. [Google Scholar] [CrossRef] [PubMed]
  40. Eigen, H.; Bieler, H.; Grant, D.; Christoph, K.; Terrill, D.; Heilman, D.K.; Ambrosius, W.T.; Tepper, R.S. Spirometric Pulmonary Function in Healthy Preschool Children. Am. J. Respir. Crit. Care Med. 2001, 163, 619–623. [Google Scholar] [CrossRef] [PubMed]
  41. Di Filippo, P.; Giannini, C.; Attanasi, M.; Dodi, G.; Scaparrotta, A.; Petrosino, M.I.; Di Pillo, S.; Chiarelli, F. Pulmonary Outcomes in Children Born Extremely and Very Preterm at 11 Years of Age. Front. Pediatr. 2021, 9, 635503. [Google Scholar] [CrossRef] [PubMed]
  42. Baird, A.; Serio-Melvin, M.; Hackett, M.; Clover, M.; McDaniel, M.; Rowland, M.; Williams, A.; Wilson, B. BurnCare tablet trainer to enhance burn injury care and treatment. BMC Emerg. Med. 2020, 20, 84. [Google Scholar] [CrossRef]
  43. Stefanidis, D.; Aggarwal, R.; Rush, R.M.; Lee, G.; Blair, P.G.; Hananel, D.; Park, Y.S.; Sweet, R.M.; Wisbach, G.G.; Sachdeva, A.K. Advanced Modular Manikin and Surgical Team Experience During a Trauma Simulation: Results of a Single-Blinded Randomized Trial. J. Am. Coll. Surg. 2021, 233, 249–260e2. [Google Scholar] [CrossRef]
  44. Tunc, E.M.; Caglar, D.; Ackley, S.H.; Umoren, R. Virtual Reality Simulation in Pediatric Resuscitation for Pre-hospital Providers. Cureus 2024, 16, e56090. [Google Scholar] [CrossRef]
  45. Gray, M.; Baird, A.; Sawyer, T.; James, J.; DeBroux, T.; Bartlett, M.; Krick, J.; Umoren, R. Increasing Realism and Variety of Virtual Patient Dialogues for Prenatal Counseling Education Through a Novel Application of ChatGPT: Exploratory Observational Study. JMIR Med. Educ. 2024, 10, e50705. [Google Scholar] [CrossRef]
  46. Umoren, R.A.; Schmölzer, G.M. Virtual simulations for neonatal education. Semin. Perinatol. 2023, 47, 151826. [Google Scholar] [CrossRef]
  47. Umoren, R.A.; Gray, M.M.; Chitkara, R.; Josephsen, J.; Lee, H.C.; Strand, M.L.; Sawyer, T.L.; Ramachandran, S.; Weiner, G.; Zaichkin, J.G.; et al. Impact of virtual simulation vs. Video refresher training on NRP simulation performance: A randomized controlled trial. J. Perinatol. 2024, 1–7. [Google Scholar] [CrossRef]
  48. Umoren, R.; Bucher, S.; Hippe, D.S.; Ezenwa, B.N.; Fajolu, I.B.; Okwako, F.M.; Feltner, J.; Nafula, M.; Musale, A.; Olawuyi, O.A.; et al. eHBB: A randomised controlled trial of virtual reality or video for neonatal resuscitation refresher training in healthcare workers in resource-scarce settings. BMJ Open 2021, 11, e048506. [Google Scholar] [CrossRef]
  49. Ezenwa, B.N.; Umoren, R.; Fajolu, I.B.; Hippe, D.S.; Bucher, S.; Purkayastha, S.; Okwako, F.; Esamai, F.; Feltner, J.B.; Olawuyi, O.; et al. Using Mobile Virtual Reality Simulation to Prepare for In-Person Helping Babies Breathe Training: Secondary Analysis of a Randomized Controlled Trial (the eHBB/mHBS Trial). JMIR Med. Educ. 2022, 8, e37297. [Google Scholar] [CrossRef]
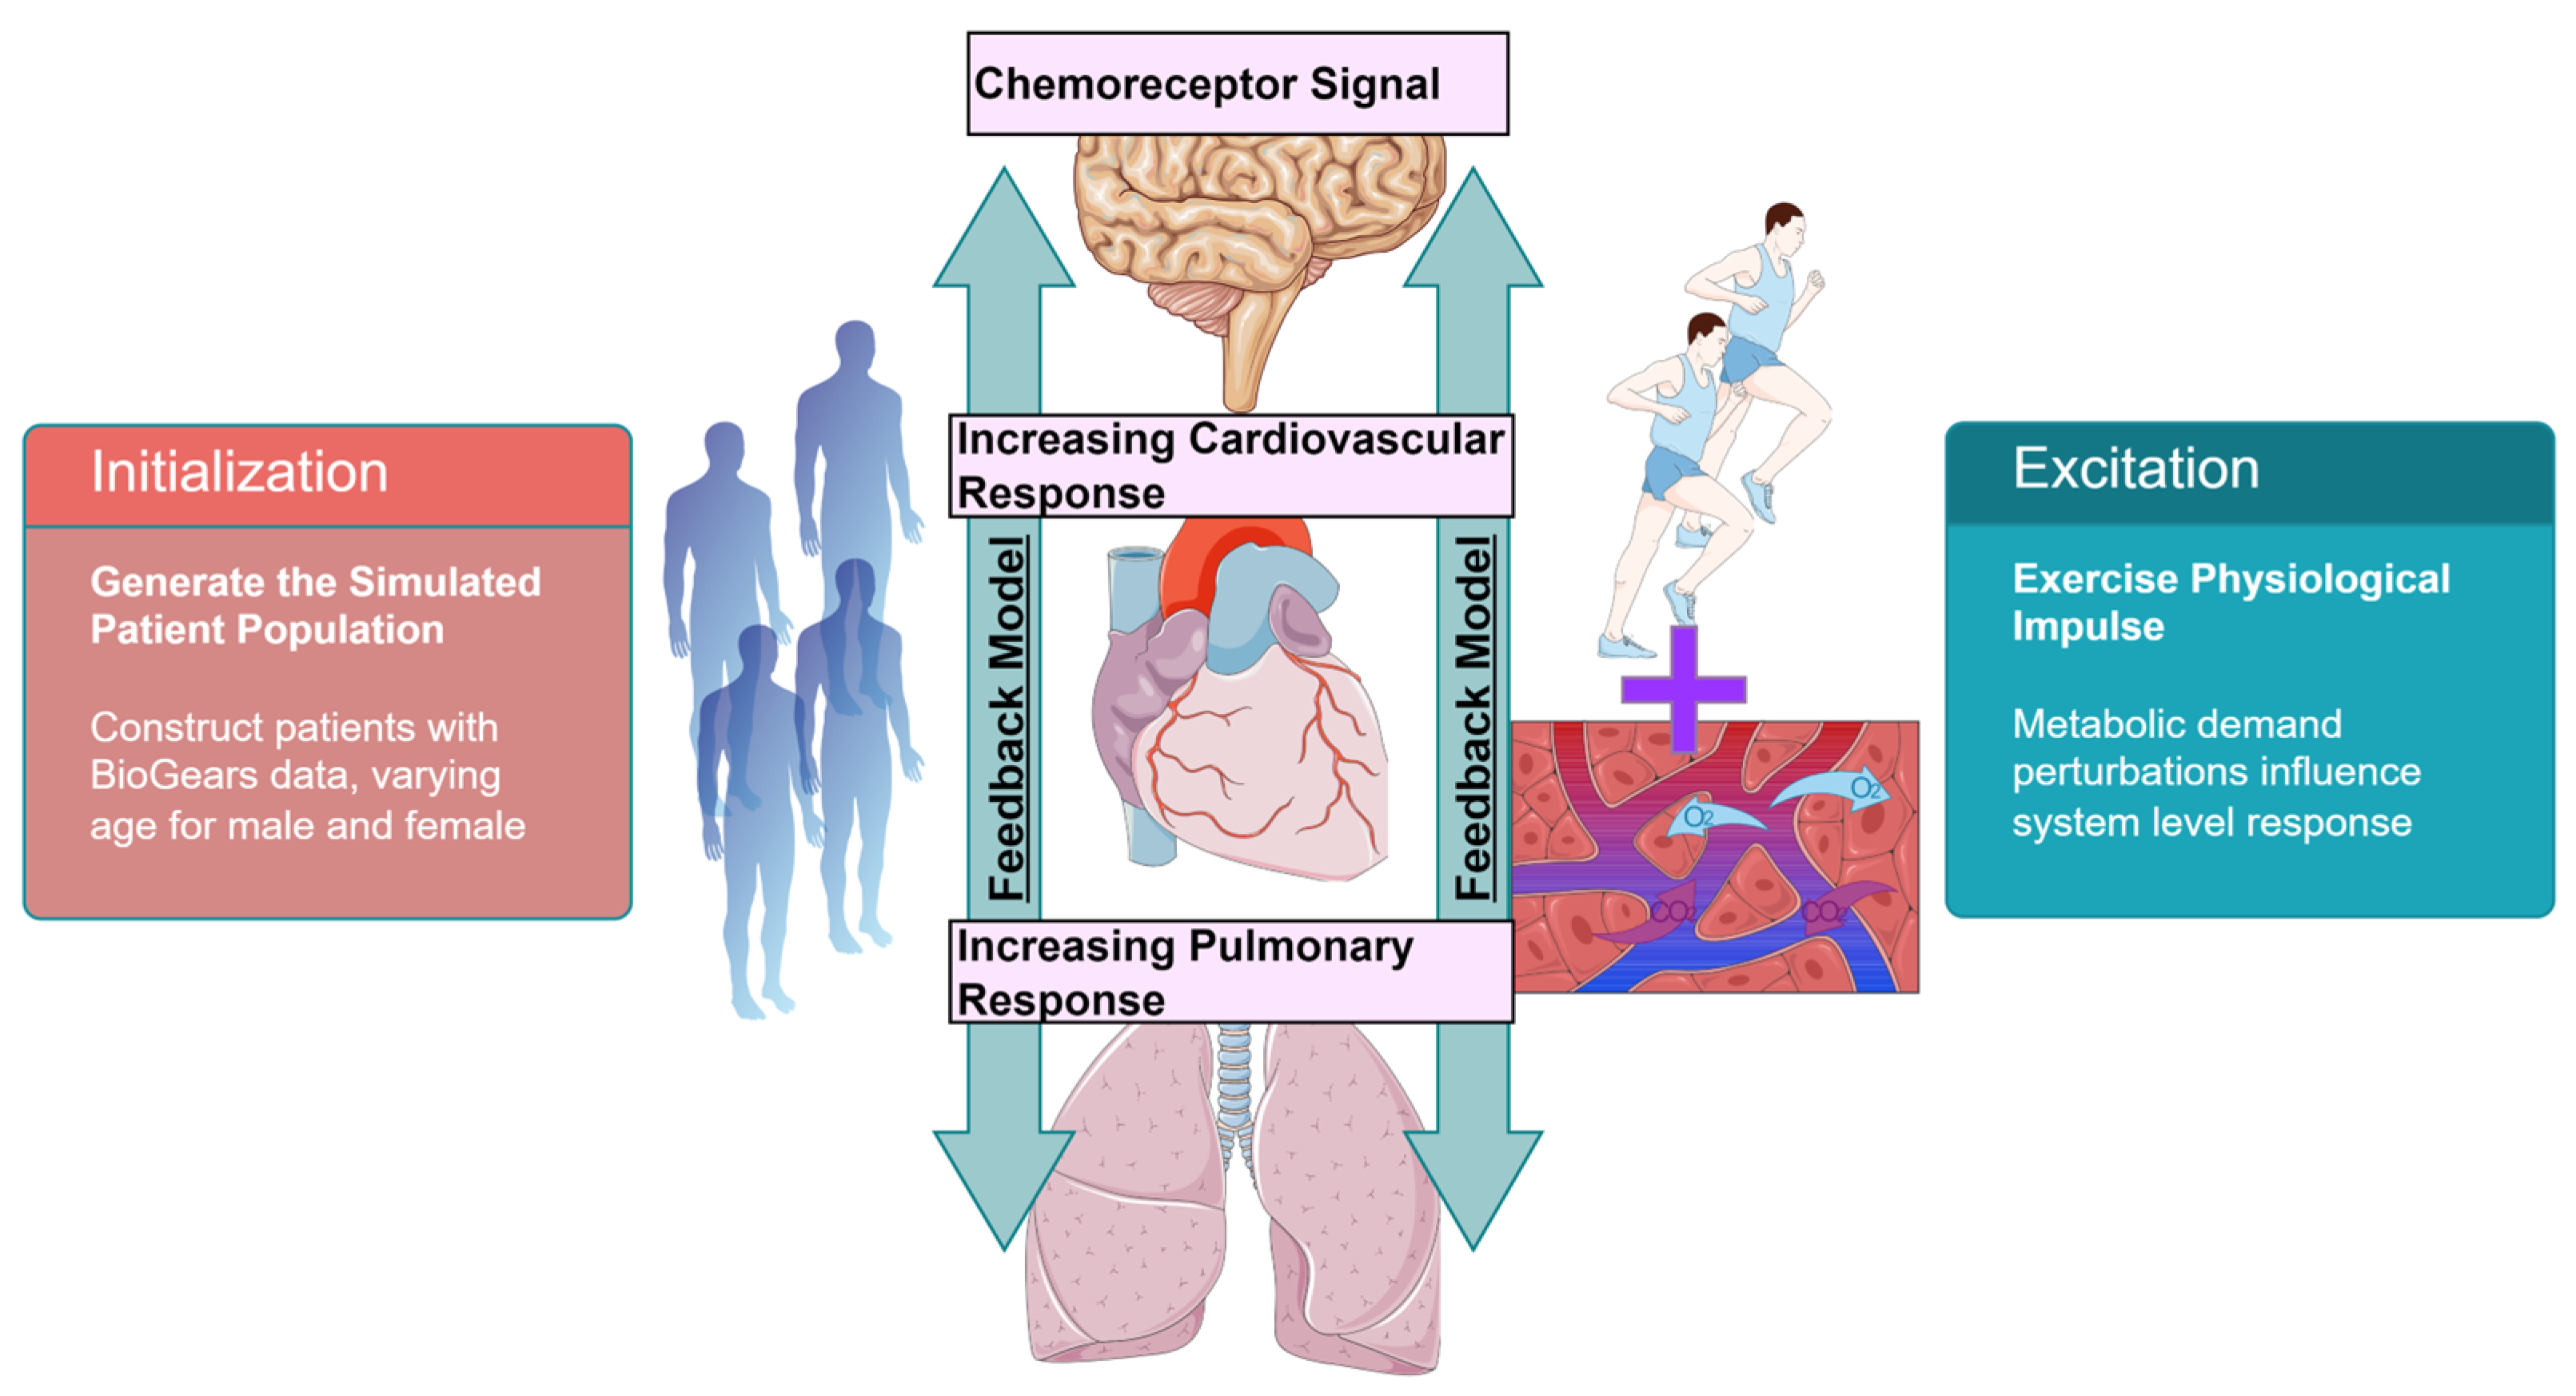
Figure 1. Overview of the various system-level feedback models needed to properly simulate exercise physiology. The chemoreceptors control feedback signaling that influences cardiopulmonary function. Excitation and initialization are configured during the scenario construction.
Jor 05 00001 g001
Figure 2. Overview of the respiratory circuit used in the physiology model to simulate dynamics of inhalation and exhalation, gas distribution and diffusion, and simulation of driver pressure changes due to chemoreceptors. The system consists of compliance, resistance, and pressure source elements and is solved using a version of modified nodal analysis.
Jor 05 00001 g002
Figure 3. Respiratory mechanics across two patient cohorts for a stepped exercise experiment. The top figures display response for the age cohort of 6–10, and the bottom figures are for 11–16 ages. Each cohort consisted of 10 male and female patients. Coloring denotes distinct patients being simulated. We noted the stepped response to be distinct across physiological metrics, although we noted that the response in the older cohort had much more variance than the younger cohort.
Jor 05 00001 g003
Figure 4. Mean value of each cardiopulmonary metric reported between age cohorts. Statistical significance is seen between each age cohort for each presented physiological metric. Here * represents statistical significance (p-value < 0.05).
Jor 05 00001 g004
Figure 5. Cardiovascular function between the older age group (bottom) and younger age cohort (upper) during simulated stagged exercise. Coloring denotes distinct simulated patients within the grouped cohort. Stroke volume decreased between cohorts as heart rate increased with an overall increase in cardiac output. Baroreceptor feedback led to a reduction in vascular resistance as vessel beds attempt to access more oxygen.
Jor 05 00001 g005
Figure 6. Nervous system response between the older age group (bottom) and younger age cohort (upper) due to staged simulated exercise. The nervous response shape varies significantly between cohorts across the time domain with distinct variability seen in the older age group (bottom figures). Coloration denotes a single distinct patient.
Jor 05 00001 g006
Figure 7. Comparison of the average nervous system response between age groups. We observed a statistically significant difference between the two cohorts overall and note the variability when looking at the variance of the older age group across the simulation. Here * represents statistical significance (p-value < 0.05) and ** denotes what we will consider to be no statistical significance (p-value > 0.05).
Jor 05 00001 g007
Disclaimer/Publisher’s Note: The statements, opinions and data contained in all publications are solely those of the individual author(s) and contributor(s) and not of MDPI and/or the editor(s). MDPI and/or the editor(s) disclaim responsibility for any injury to people or property resulting from any ideas, methods, instructions or products referred to in the content.