Article

Correlations between Volumetric Capnography and Automated Quantitative Computed Tomography Analysis in Patients with Severe COPD

by
Odair Henrique Gaverio Diniz
1,*,
Monica Corso Pereira
1,
Silvia Maria Doria da Silva
1,
Marcel Koenigkam-Santos
2,
Ilma Aparecida Paschoal
1 and
Marcos Mello Moreira
1
1
Discipline of Pneumology, Pulmonary Diseases Unit, Department of Internal Medicine, School of Medical Sciences, University of Campinas (UNICAMP), Campinas 13083-881, SP, Brazil
2
Department of Medical Images, Hematology and Clinical Oncology, Ribeirao Preto Medical School, University of Sao Paulo (FMRP-USP), Ribeirao Preto 14015-010, SP, Brazil
*
Author to whom correspondence should be addressed.
J. Respir. 2022, 2(1), 13-24; https://doi.org/10.3390/jor2010002
Submission received: 16 December 2021 / Revised: 20 January 2022 / Accepted: 31 January 2022 / Published: 7 February 2022

Abstract

:
Background: In chronic obstructive pulmonary disease (COPD), morphological analysis made by computed tomography (CT) is usually correlated with spirometry as the main functional tool. In this study, quantitative CT analysis (QCT) was compared with volumetric capnography (VCap), alongside spirometry and the 6-min walk test (6MWT). Methods: Twenty-seven patients with severe/very severe COPD were included, compared with nineteen control subjects. All participants performed spirometry and chest high resolution CT scans that were analyzed with fully-automated software. The COPD group was also submitted to VCap and 6MWT. Results: COPD patients (65.07 ± 8.25 years) showed an average FEV1 of 1.2 L (44% of the predicted) and the control group (34.36 ± 8.78 years). VCap × QCT: positive correlations were observed with bronchial wall thickening and negative correlations with diameter and area of the bronchial lumen. Spirometry × QCT: positive correlations were observed between post-BD FVC, FEV1 and FEF 25–75% and diameter and luminal area of the airways and FVC and lung and vascular volumes (emphysema). Negative correlation was observed between post-BD FVC and FEV1 when compared with Pi10 (internal perimeter of 10 mm). 6MWT vs. QCT: negative correlations were observed between the distance covered with relative wall thickness (airways) and vascular volume and peripheral vascular volume (vasculature). Conclusion: Relevant correlations between QCT and pulmonary function variables were found, including the VCap, highlighting the importance of structural analysis in conjunction with a multidimensional functional assessment. This is the first study to correlate airway and parenchyma QCT with VCap.

1. Introduction

Chronic obstructive pulmonary disease (COPD) is a progressive and heterogeneous lung disease in terms of clinical presentation, risk factors and functional evolution [1,2].
Heterogeneity in all aspects of the disease reinforces the importance of differentiated therapy for each patient in order to produce better individual results for disease control [3,4].
According to Fletcher et al. [5] there is evidence of a close relationship between chronic bronchitis symptoms and cigarette smoking. In addition, smoking causes emphysema through an obstructive process associated with an imbalance of the enzymatic systems, which ultimately leads to the loss of alveolar mass. In addition to smoking, genetic factors related to heredity account for at least 30% of the risk variation in COPD [6,7,8,9].
COPD is defined by an association of compatible clinical conditions, a risk factor for the disease and a functional disorder defined by spirometry [10].
Despite the evidence in the literature of the robustness of spirometry (especially FEV1) as a marker of COPD severity and prognosis, the disease is certainly more complex and this method does not cover all aspects.
Because COPD is defined by spirometry, different evaluation methods can help explain other aspects of the disease, such as what happens in the small airways, which structural changes happen, how and why there is so much variability and heterogeneity in the clinical presentation.
The main challenge in COPD diagnosis refers to the small thickness of the airways affected by the disease [11]. CT can then be a valuable tool for the quantification of the inflammatory outcome of the airways, allowing for an estimate of its most distal parts [11]. It then helps us understand what happens in the small airways in COPD, which are not well assessed by spirometry. In this context, we evaluated whether volumetric capnography can also provide an understanding of the pathophysiology of the ‘quiet zone’ of the lung.

2. Methods

The current study was an observational cross-sectional study with a convenience sample of patients diagnosed with COPD.
Data from the COPD patients were collected for a previous project [12] approved by the local Research Ethics Committee (CAAE: 0597.0.146.000-10). All patients signed an informed consent form before participating.
Twenty-seven (27) patients with COPD were followed at the Hospital de Clínicas da Universidade Estadual de Campinas (HC-UNICAMP). These patients included the COPD group that met the inclusion criteria such as a diagnosis of COPD by GOLD, spirometry after bronchodilators [13], all of them with FEV1/FVC < 0.7 and FEV1 < 50% of the predicted value, and who also underwent VCap and 6MWT and finally evaluation of the HRCT exams by YACTA. Both tests mentioned were performed at HC-UNICAMP, except for the analysis of CT images that were sent and analyzed by the radiological sector of the Faculdade de Medicina de Ribeirão Preto (HCFMRP-USP). A control group for respiratory diseases was included in the comparison with our patients consisting of 19 respiratory asymptomatic non-smoking patients with normal spirometry and HRCT. HRCT and spirometry tests of this control group were performed at HCFMRP-USP.

2.1. Pulmonary Function and Six-Minute Walk Test

VCap was performed with the patient seated after 5 to 10 min of rest, using CO2SMO Plus (Dixtal/Novametrix Incorporation, Wallingford, CT, USA) oxi-capnograph equipment. After 1 min of breathing in this situation (‘adaptation’), data were collected using the APlus® software with the patient breathing for 4 to 5 min. At the end of the data collection, an offline sequence of respiratory cycles of patients was selected in a variation of <15% of end-expiratory volume and <5% of ETCO2. Respiratory cycles that presented zero slope values for phase 3 were excluded; a mean value was determined for each breathing pattern. Pre- and post-bronchodilator spirometry was performed using a calibrated and validated EasyOne® portable spirometer. The control individuals were from the HCFMRP-USP database, and in these individuals spirometry was performed using a KoKo® pneumotachometer (PDS Instrumentation, Inc., Louisville, CO, USA). The 6MWT was performed on a standard 30 m course and the patient was instructed to walk round the course at their own pace for 6 min. The number of laps walked in 6 min was recorded using the finger-tip pulse oximetry (Nonin® Onyx 9500 digital) to measure baseline and lowest saturations.
All these tests were performed according to ATS guidelines [14,15,16].

2.2. High Resolution Computed Tomography

HRCT images were obtained from multi-detector scanners (Philips Big Bore or Toshiba Aquilion Prime). Volumetric scans were performed during inspiration with 1 mm thick slices without the administration of iodinated contrast medium.
Quantitative CT (QCT) analysis was performed using the YACTA scientific software, Version 7 [17]. The software works completely automatically, both for segmenting the airways and lung parenchyma and for obtaining the variables to be studied. The threshold of −950 Hounsfield units (HU) was used for detection and characterization of emphysema [18]. Emphysema volume (cm3) and proportion in relation to lung volume (emphysema index in %) were measured. YACTA measured the bronchial wall caliber, thickness and density, using different algorithms. The main measurements obtained from the airways were: number and generations of studied bronchi, total airway diameter in mm (distance between the outer edges of the studied segment), lumen area per square millimeter (area between inner edges), wall thickness in mm (distance between an inner and outer edge), relative wall thickness in percentage, peak wall attenuation in HU (points of maximum density between inner and outer edge), Pi10 (internal perimeter of 10 mm) referring to a hypothetical medium-caliber airway assessed through the square root of the wall area and mean lung density (MLD) index measuring air trapping [17,19].
YACTA®, used here for QCT, uses CT imaging segmented by HU to show the tracheobronchial tree, showing the right and left lungs in demarcated regions with the dark areas marked in axial sections. Lung separation and the morphological demarcation are performed with spherical structural elements. The better delimited airway tracings are then divided, with division of the integrated pulmonary lobe, to improve the recognition of smaller structures [19,20]. The density mask applied to lung parenchyma used in CT is the percentage of voxels below −950 HU (%LAA < −950) [16].

2.3. Statistical Analysis

The chi-square test was applied to compare sex between the groups and the Mann–Whitney test was applied to compare the numerical variables between the two groups.
Spearman’s linear correlation coefficient was used to assess the relationship between the numerical variables. The significance level adopted in this study was 5%.

3. Results

Our study has 27 patients with severe and very severe COPD (GOLD III-IV without statistical difference), a mean age of 65.07 years and 55% male. CT scans and spirometry of 19 healthy individuals were also analyzed; with a mean age of 34.36 years and 42% male individuals.
Table 1 shows the demographic and functional characteristics of patients with COPD.
Table 2 shows the data from patients with COPD and the controls for lung diseases from CT scans and spirometry (pre-bronchodilator values). The CT data of airways and emphysema are significantly different between the COPD patients and the controls.
Table 3 shows the results with statistical significance in the correlation analysis of the clinical data versus the CT scan variables after applying Spearman’s statistical test.
A moderate negative correlation was observed between age and variable VV (which means the younger the age the larger the vascular volume), in addition to negative correlations between the number of cigarettes smoked per day and smoking years with variables related to the airways: WGB, W3G, EP5G and AL3G. These data suggest that the higher the relative thickening index of the bronchial wall (WGB, W3G, EP5G) and the lumen area of the small bronchi (AL3G) the lower the smoking load. The BMI showed a moderate negative correlation with the emphysema indexes (VE and IE), indicating that the lower the BMI the larger the emphysema.
Table 4 shows significant findings from the correlation analysis between the 6MWT and the CT data in the COPD group using Spearman’s statistical test.
Moderate negative correlations were observed between the distance covered and the bronchial wall thickness (W5G), indicating that shorter distances walked in the 6MWT were associated with higher rates of bronchial wall thickening in the small airways (bronchi from the 5th generation onwards).
Negative correlations were also observed between the distance covered (% of predicted distance) and the vascular volumes (VV and VVP).
Figure 1 shows the significant results from Spearman’s test in the correlation analysis between spirometry (test values after using bronchodilators) versus CT.
Moderate positive correlations were reported between all parameters evaluated in spirometry (FVC post-BD, FEV1 post-BD and FEF 25–75%) when compared to diameter (DGB and D5G) and the lumen area of the airways (ALGB, AL5G). Notably, a moderate negative correlation was also observed between FVC post-BD and FEV1 post-BD when compared to Pi10. This variable is used to calculate airway wall thickening, and our results indicated that the lower the FEV1 and FVC values the greater the degree of bronchial wall thickening and the smaller the airway diameters.
Another important finding was the presence of a strong positive correlation between FVC post-BD and lung and vascular volumes, both related to impairment caused by emphysema. A negative correlation was observed between small airway flows (FEF 25–75%) and IE and VE. No significant correlation was found between FEV1 and emphysema parameters on CT.
Figure 2 shows statistically significant results obtained from Spearman’s correlation analysis between the volumetric capnography data and the CT data in the COPD group.
No significant correlation was found between the VCap values and any of the CT variables that indicate impairment caused by emphysema such as VE, IE, VV, VVP, VP and MLD. In contrast, a significant correlation was reported with several variables related to airways such as P3Slp, P3Slp/ETCO2 and P3Slp/Ve, with a moderate negative correlation with bronchial lumen diameter and area (ALGB, DGB) and moderate positive correlations with bronchial wall thickening (WGB). ETCO2 had a moderate positive correlation with wall thickness (EPGB). Finally, a moderate negative correlation was reported with PeCO2 with small airway variables beyond the 5th bronchial generation. In addition, the Pi10 parameter in varied aspects contributed to providing a broad view of the airways. Pi10 generalized the bronchial tracheal tree as a whole, which helped to locate critical areas. Besides the correlations with diameter and wall thickness, a correlation was obtained with mean peak attenuation data of the 5th bronchial generation.

4. Discussion

Our results are important in settings where there is no easy access to a detailed exam such as a CT, or where patients cannot afford the exam.
When comparing these two groups, there were differences between all the variables analyzed, especially considering that the group of control subjects was significantly younger (34 years versus 65 years, p < 0.001) and the control subjects did not have respiratory diseases. However, this does not influence the VCap.
Our patients (GOLD III-IV) presented an IE of 21.9%, consistent with the findings obtained by Ostridge et al., and Schroeder et al. [21,22]. Associations between QCT and spirometry were also analyzed in order to assess severity in COPD [22].
Likewise, Ostridge et al. [21] studied patients with COPD of different severity degrees, seeking correlations between CT findings and pulmonary function variables by automated analysis. The authors described GOLD III and GOLD IV patients with an IE of 15.8% and 24.8%, respectively [21].
In patients with COPD, DMP was −841.3 HU. In another analysis, Schroeder et al. [22] found DMP between −865 and −882 HU in GOLD III and GOLD IV patients, respectively.
FVC post-BD showed strong and moderate correlations with CT variables for VP, VV and VVP. This means the smaller the FVC the smaller the VP, VV and VVP. In emphysema VV is reduced as emphysema affects the pulmonary capillaries. We found negative correlations between the FEV1/FVC ratio and the small airway flows and the emphysema indexes, while no correlation was observed between these indexes and FEV1. The reasons for not finding a correlation between FEV1 and IE in this study are probably due to the small number of patients and the homogeneity of the analyzed group, as FEV1 below 50% of the predicted value was an inclusion criterion of the study by da Silva et al. [11] from which the patients were selected. The study by Schroeder et al. [22] identified a strong correlation between emphysema and FEV1.
A moderate negative correlation was observed among FVC post-BD, FEV1 post-BD and Pi10, a variable that indicates larger airway wall thickening, i.e., the lower the FEV1 and FVC values the greater the degree of bronchial wall thickening and the smaller the airway diameters. Ostridge et al. [21] described strong and moderate negative correlations of Pi10 with FEV1/FVC and FEV1 (% predicted), respectively [21]; however, these authors found only a weak negative correlation with FVC [21].
In the correlation analysis of the 6MWT and CT, the distance covered was the most important variable, unlike the finding obtained by Ostridge et al. [21]. Our analysis showed negative correlations with airway parameters that reflect bronchial wall thickening; shorter distances presented a correlation with greater airway thickening. Ostridge et al. [21] found no correlation with the distance covered on the 6MWT; however, they described the stronger the reduction in SpO2 on the 6MWT the larger the emphysema and the air trapping. In our analysis, no correlation was found between the CT variables and the final SpO2, which in our patients was 87% on average.
A moderate negative correlation was observed between the distance covered (% predicted), VV and VVP. We would expect a correlation between the distance covered and emphysema markers such as VE and IE; however, this was not found.
The negative correlations found in this study between the number of cigarettes smoked per day, smoking time and the variables related to airways highlight the impact of the smoking load upon the degree of airway damage; the higher the relative thickening index of the bronchial wall and the lumen area of the small bronchi the lower the smoking load.
In a study by da Silva et al. [11] the smoking load was positively correlated with the CT emphysema phenotype as opposed to the bronchitis phenotype. In our sample, all patients were smokers, with a very high average smoking load (60 packs/year), and functionally severe (mean FEV1 of 1.2L). These characteristics, combined with the small size of our sample, may explain the few correlations that were found with emphysema indexes.
The correlations of the spirometry variables found with IE and VE support the findings commonly found in patients with an emphysema phenotype, where a reduction in vital capacity is always significant probably due to air trapping. BMI is considered an independent prognostic factor for COPD [23].
The findings from ETCO2 showed a moderate positive correlation with EPGB (p = 0.0287), i.e., the greater the bronchial wall thickness the higher the ETCO2. In a study that evaluated the CT phenotypes of severe COPD and their correlations with functional variables da Silva et al. [11] found higher ETCO2 in patients with airway disease versus patients with emphysema.
P3Slp showed negative correlations with the lumen area by ALGB (p = 0.0202) and DGB (p = 0.0344) and positive correlation with WGB (p = 0.0225); the greater the P3Slp the smaller the airways (dilated and existing) and the greater their thickening. Normalized P3Slp (P3Slp/ETCO2 and P3Slp/Ve) showed similar correlations—moderate negative correlations with ALGB and DGB. In addition, P3Slp/Ve showed a positive correlation with WGB (p = 0.0324).
The P3Slp slope is a feature of gas clearance curves in a single respiratory cycle and provides important data about gas transport from the distal airways and the lung parenchyma. Due to the convective velocities of gases, the small airways in the pulmonary periphery, combined with the acinar airspaces, the predominant gas transport mechanism is diffusion [24,25,26]. Increases in P3Slp may cause an increase in diffusion resistance in the distal regions of the lung. It leads to increased resistance to gas diffusion, which may indicate large damage to the distal airways and/or the lung parenchyma [23,27,28]. Some studies conducted by our group evaluated the behavior of VCap in bronchiectasis associated or not associated with cystic fibrosis in patients with COPD [11,23,27,28]. Two of these studies, where patients with bronchiectasis were compared with healthy individuals, demonstrated that P3Slp increased when compared to normal values [23,27]. Veronez et al. [23] showed that COPD patients and individuals with bronchiectasis have similar P3Slp, and da Silva et al. [11] showed that patients with COPD and phenotypes of airway disease have higher P3Slp than those with the emphysema phenotype. In addition, da Silva et al. [11] showed that P3Slp was positively correlated with peribronchial thickening, bronchial dilation and air trapping. In da Silva et al. [11] the CT analysis was visual, although scores were used to quantify it more objectively, except for the air trapping signal.
Ribeiro et al. [29] whose main goal was to compare spirometry and VCap to determine whether the capnography values added more information about early lung disease in cystic fibrosis patients, revealed that the phase 3 slope/Ve was significantly higher in the 24 patients with normal spirometry (p = 0.018).
De Jong and Tiddens [30] evaluated the progression of pulmonary structural lesions on high resolution CT in children and adults with cystic fibrosis and found a significant increase in signs of peripheral airway disease leading to bronchiectasis; synchronous to these findings was the worsening of central airway thickening and also the thickening of the walls of more distal airways, images of which were visible on CT scans. It seems reasonable to assume that the thickening of the walls of the more central airways is associated with small airway compromise, shown in our study by the increases of P3Slp.
Another variable analyzed—heart rate—was linked with practically all levels of morphological changes in patients with COPD. Significant correlations were observed with Pi10, W3G-W5G, AP5G, ALGB-AL3G, NB, EP5G, DGB and D5G showing high sensitivity of VCap in terms of clinical findings, possibly showing significant changes even before HR alterations [31,32].
Our study had some limitations, such as the small number of patients analyzed, its retrospective nature and the fact that the exams were originally performed for another study, leading to a significant loss of exams due to the unavailability of the data format supported by YACTA®. CT non-standardization caused a considerable number of patients without an expiration test, which did not allow for the air trapping assessment in the sample. This fact may have affected the results, since the small caliber airways, which are the main factor for airflow limitation, could not be properly analyzed. Small caliber airways are below the resolution of quantitative CT, [22,31] except for the air trapping signal, which could not be properly assessed. The fact that the exams (CT and spirometry) were performed in different locations may have impacted the results, although both locations are high-quality services and such exams were performed according to the recommendations of the ATS and the ERS.

5. Conclusions

Significant correlations were found between QCT and VCap, especially the CT variables related to the airway measurements. Correlations of P3Slp with the QCT variables were among the relevant findings, reinforcing the importance of this capnography variable and representing the heterogeneous distribution of ventilation in airspaces. These findings emphasize the importance of a multidimensional assessment of patients with COPD, which can contribute to a better understanding of the clinical and functional heterogeneity of these patients.

Author Contributions

O.H.G.D.: conceptualization, data curation, formal analysis, investigation, methodology, project administration, writing-original draft, writing-review & editing; M.C.P.: conceptualization, data curation, formal analysis, investigation, methodology, project administration, supervision, writing-original draft, writing-review & editing; S.M.D.d.S.: data curation, formal analysis, investigation, methodology, writing-original draft; M.K.-S.: data curation, formal analysis, investigation, methodology, writing-review & editing; I.A.P.: data curation, formal analysis, investigation, writing-review & editing; M.M.M.: conceptualization, data curation, formal analysis, investigation, methodology, project administration, writing-original draft, writing-review & editing. All authors have read and agreed to the published version of the manuscript.

Funding

This research received no external funding.

Institutional Review Board Statement

The study was conducted according to the guidelines of the Declaration of Helsinki, and approved by the Institutional Ethics Committee of University of Campinas (UNICAMP) protocol code 0597.0.146.000-10; date of approval 2010.

Informed Consent Statement

Informed consent was obtained from all subjects involved in the study.

Conflicts of Interest

The authors declare no conflict of interest.

References

  1. Brown, R.H.; Brooker, A.; Wise, R.A.; Reynolds, C.; Loccioni, C.; Russo, A.; Risby, T.H. Forced Expiratory Capnography and Chronic Obstructive Pulmonary Disease (COPD). J. Breath Res. 2013, 7, 017108. [Google Scholar] [CrossRef] [Green Version]
  2. Wedzicha, J.Á.; Miravitlles, M.; Hurst, J.R.; Calverley, P.M.A.; Albert, R.K.; Anzueto, A.; Crimer, G.J.; Papi, A.; Rabe, K.F.; Rigau, D.; et al. Management of COPD exacerbations: A European Respiratory Society/American Thoracic Society guideline. Eur. Respir. J. 2017, 49, 1600791. [Google Scholar] [CrossRef] [Green Version]
  3. Woodruff, P.G.; August, A.; Roche, N.; Singh, D.; Martinez, F.J. Current concepts in targeting chronic obstructive pulmonary disease pharmacotherapy: Making progress towards personalized management. Lancet 2015, 385, 1789–1798. [Google Scholar] [CrossRef] [Green Version]
  4. Chu, J.H.; Hersh, C.P.; Castaldi, P.J.; Cho, M.H.; Raby, B.A.; Laird, N. Analyzing networks of phenotypes in complex diseases: Methodology and applications in COPD. BMC Syst. Biol. 2014, 8, 78. [Google Scholar] [CrossRef] [Green Version]
  5. Fletcher, C.M. Some recent advances in the prevention and treatment of chronic bronchitis and related disorders with special reference to the effects of cigarette smoking. Proc. R. Soc. Med. 1965, 58, 918–928. [Google Scholar]
  6. Ingebrigtsen, T.; Thomsen, S.F.; Vestbo, J.; van der Sluis, S.; Kyvik, K.O.; Silverman, E.K.; Svartengren, M.; Backer, V. Genetic influences on chronic obstructive pulmonary disease—A twin study. Respir Med. 2010, 104, 1890–1895. [Google Scholar] [CrossRef]
  7. McCloskey, S.C.; Patel, B.D.; Hinchliffe, S.J.; Reid, E.D.; Wareham, N.J.; Lomas, D.A. Siblings of patients with severe chronic obstructive pulmonary disease have a significant risk of airflow obstruction. Am. J. Respir. Crit. 2001, 164, 1419–1424. [Google Scholar] [CrossRef]
  8. Silverman, E.K.; Chapman, H.A.; Drazen, J.M.; Weiss, S.T.; Rosner, B.; Campbell, E.J.; O’Donnel, W.J.; Reilly, J.J.; Ginns, L.; Mentzer, S.; et al. Genetic epidemiology of severe, early-onset chronic obstructive pulmonary disease. Risk to relatives for airflow obstruction and chronic bronchitis. Am. J. Respir. Crit. Care Med. 1998, 157, 1770–1778. [Google Scholar] [CrossRef]
  9. Zhou, J.J.; Cho, M.H.; Castaldi, P.J.; Hersh, C.P.; Silverman, E.K.; Laird, N.M. Heritability of chronic obstructive pulmonary disease and related phenotypes in smokers. Am. J. Respir. Crit. Care Med. 2013, 188, 941–947. [Google Scholar] [CrossRef] [Green Version]
  10. Menezes, A.M.B.; Victora, C.G.; Perez-Padilla, R.; PLATINO Team. The Platino project: Methodology of a multicenter prevalence survey of chronic obstructive pulmonary disease in major Latin America cities. BMC Med. Res. Methodol. 2004, 4, 15. [Google Scholar] [CrossRef] [Green Version]
  11. Da Silva, S.M.; Paschoal, I.A.; De Capitani, E.M.; Moreira, M.M.; Palhares, L.C.; Pereira, M.C. COPD phenotypes on computed tomography and its correlation with selected lung function variables in severe patients. Int. J. COPD 2016, 11, 503–513. [Google Scholar] [CrossRef] [PubMed] [Green Version]
  12. Da Silva, S.M.D. Bronquiectasias Associadas a DPOC Grave: Características Clínicas, Funcionais e Estruturais (Bronchiectasis Associated with Severe COPD: Clinical, Functional and Structural Features). Ph.D. Thesis, Universidade Estadual de Campinas, Faculdade de Ciências Médicas, Campinas, São Paulo, 2020; 101p. [Google Scholar]
  13. Vogelmeier, C.; Augusti, A.; Anzueto, A.; Barnes, P.; Bourbeau, J.; Criner, G.; Frith, P.; Halpin, D.M.G.; Han, M.; Varela, M.V.L.; et al. Global Strategy for the Diagnosis, Management and Prevention of Chronic Obstructive Pulmonary Disease (Updated 2021). Available online: https://goldcopd.org/wp-content/uploads/2020/11/GOLD-REPORT-2021-v1.1-25Nov20_WMV.pdf (accessed on 6 March 2021).
  14. Pellegrino, R.; Viegi, G.; Brusasco, V.; Crapo, R.O.; Burgos, F.; Casaburi, R.; Coates, A.; Van Der Grinten, C.P.M.; Gustafsson, P.; Hankinson, J.; et al. Interpretative strategies for lung function tests. Eur. Respir. J. 2005, 26, 948–968. [Google Scholar] [CrossRef] [PubMed]
  15. ATS Committee on Proficiency Standards for Clinical Pulmonary Function Laboratories. ATS statement: Guidelines for the six-minute walk test. Am. J. Respir. Crit. Care Med. 2002, 166, 111–117, Erratum in Am. J. Respir. Crit. Care Med. 2016, 193, 1185. [Google Scholar] [CrossRef] [PubMed]
  16. Enright, P.L.; Sherrill, D.L. Reference equations for the six-minute walk in healthy adults. Am. J. Respir. Crit. Care Med. 1998, 158, 1384–1387. [Google Scholar] [CrossRef] [PubMed] [Green Version]
  17. Achenbach, T.; Weinheimer, O.; Buschsieweke, C.; Heussel, C.P.; Thelen, M.; Kauczor, H.U. Fully automatic detection and quantification of emphysema on thin section md-ct of the chest by a new and dedicated software. RoFo 2004, 176, 1409–141516. [Google Scholar] [CrossRef]
  18. Heussel, C.P.; Herth, F.J.F.; Kappes, J.; Hantusch, R.; Hartlieb, S.; Weinheimer, O.; Kauczor, H.U.; Eberhardt, R. Fully-automatic quantitative assessment of emphysema in computed tomography—comparison with pulmonary function testing and normal values. Eur. Radiol. 2009, 19, 2391–2402. [Google Scholar] [CrossRef]
  19. Celli, B.R.; Cote, C.; Marin, J.M.; Casanova, C.; Oca, M.M.; Mendez, R.A.; Plata, V.P.; Cabral, H.J. The Body Mass Index, Airflow Obstruction, Dyspnea, Exercise Performance (BODE) index in chronic obstructive pulmonary disease. N. Engl. J. Med. 2004, 350, 1005–1012. [Google Scholar] [CrossRef] [Green Version]
  20. Wielpütz, M.O.; Eichinger, M.; Weinheimer, O.; Ley, S.; Mall, M.A.; Wiebel, M.; Arved, B.; Hans-Ulrich, K.; Heussel, C.P.; Puderbach, M. Automatic airway analysis on multidetector computed tomography in cystic fibrosis. J. Thorac. Imaging. 2013, 38, 104–113. [Google Scholar] [CrossRef] [Green Version]
  21. Ostridge, K.; AERIS Study Group; Williams, N.P.; Kim, V.; Harden, S.; Bourne, S.; Clarke, S.C.; Aris, E.; Mesia-Vela, S.; Devaster, J.-M.; et al. Relationship of CT-quantified emphysema, small airways disease and bronchial wall dimensions with physiological, inflammatory and infective measures in COPD. Respir Res. 2018, 19, 31. [Google Scholar] [CrossRef] [Green Version]
  22. Schroeder, J.D.; McKenzie, A.S.; Zach, J.A.; Wilson, C.G.; Curran-Everett, D.; Stinson, D.S.; Newell, J.D., Jr.; Lynch, D.A. Relationships between airflow obstruction and quantitative CT measurements of emphysema, air trapping, and airways in subjects with and without chronic obstructive pulmonary disease. Am. J. Roentgenol. 2013, 201, W460–W470. [Google Scholar] [CrossRef] [Green Version]
  23. Veronez, L.; Moreira, M.M.; Soares, S.T.P.; Pereira, M.C.; Ribeiro, M.A.G.O.; Ribeiro, J.D.; Terzi, R.G.G.; Martins, L.C.; Paschoal, I.A. Volumetric capnography for the evaluation of pulmonary disease in adult patients with cystic fibrosis and noncystic fibrosis bronchiectasis. Lung 2010, 188, 263–268. [Google Scholar] [CrossRef] [PubMed]
  24. Verscheure, S.; Massion, P.B.; Verschuren, F.; Damas, P.; Magder, S. Volumetric capnography: Lessons from the past and current clinical applications. Crit. Care 2016, 20, 184. [Google Scholar] [CrossRef] [PubMed] [Green Version]
  25. Blanch, L.; Romero, P.V.; Lucangelo, U. Volumetric capnography in the machanically ventilated patient. Minerva Anestesiol. 2006, 72, 577–585. [Google Scholar] [PubMed]
  26. Suarez-Sipmann, F.; Bohm, S.H.; Tusman, G. Volumetric capnography: The time has come. Curr. Opin. Crit. Care 2014, 20, 333–339. [Google Scholar] [CrossRef]
  27. Moreira, M.; Veronez, L.; Pereira, M.C.; Silva, S.; De Capitani, E.M.; Paschoal, I.; Barcaui, L. Volumetric capnography for the evaluation of chronic airways diseases. Int. J. Chron. Obstruct. Pulmon. Dis. 2014, 9, 983–989. [Google Scholar] [CrossRef] [Green Version]
  28. Schwardt, J.D.; Neufeld, G.R.; Baumgardner, J.E.; Scherer, P.W. Noninvasive recovery of acinar anatomic information from CO2 expirograms. Ann. Biomed. Eng 1994, 22, 293–306. [Google Scholar] [CrossRef]
  29. Ribeiro, M.G.O.; Silva, M.T.N.; Ribeiro, J.D.; Moreira, M.M.; Almeida, C.C.B.; Almeida-Junior, A.A.; Ribeiro, A.F.; Pereira, M.C.; Hessel, G.; Paschoal, I.A. Volumetric capnography as a tool to detect early peripheric lung obstruction in cystic fibrosis patients. J. Pediatr. 2012, 88, 509–517. [Google Scholar] [CrossRef]
  30. De Jong, P.A.; Lindblad, A.; Rubin, L.; Hop, W.C.; de Jongste, J.C.; Brink, M.; Tiddens, H.A. Progression of lung disease on computed tomography and pulmonary function tests in children and adults with cystic fibrosis. Thorax 2006, 61, 80–85. [Google Scholar] [CrossRef] [Green Version]
  31. Coxson, H.O. Quantitative computed tomography assessment of airway wall dimensions: Current status and potential applications for phenotyping chronic obstructive pulmonary disease. Proc. Am. Thorac Soc. 2008, 5, 940–945. [Google Scholar] [CrossRef] [Green Version]
  32. Kim, S.S.; Jin, G.Y.; Li, Y.Z.; Lee, J.E.; Shin, H.S. CT Quantification of Lungs and Airways in Normal Korean Subjects. Korean J. Radiol. 2017, 18, 739–748. [Google Scholar] [CrossRef]
Figure 1. Linear correlation analysis between spirometry and CT data in the COPD group. α N—21; ¥ N—26; # N—27; BD—bronchodilator; FVC—forced vital capacity; FEV1—forced expiratory volume in one second; FEV1/FVC—ratio of forced expiratory volume in one second to forced vital capacity; FEF 25–75%—forced expiratory flow between 25% and 75% of forced vital capacity; ALGB—lumen area by bronchial generation; AL5G—lumen area (5th generation); DGB—diameter by bronchial generation; D5G—diameter (5th generation); Pi10—internal perimeter of 10 mm; VP—lung volume; VE—emphysema volume; IE—emphysema index; DMP—mean lung density; VV—vascular volume; VVP—peripheral vascular volume.
Jor 02 00002 g001
Figure 2. Results of the correlation analysis between volumetric capnography data and CT data in the COPD group. Ξ N—20; Ω N—25; Jor 02 00002 i001
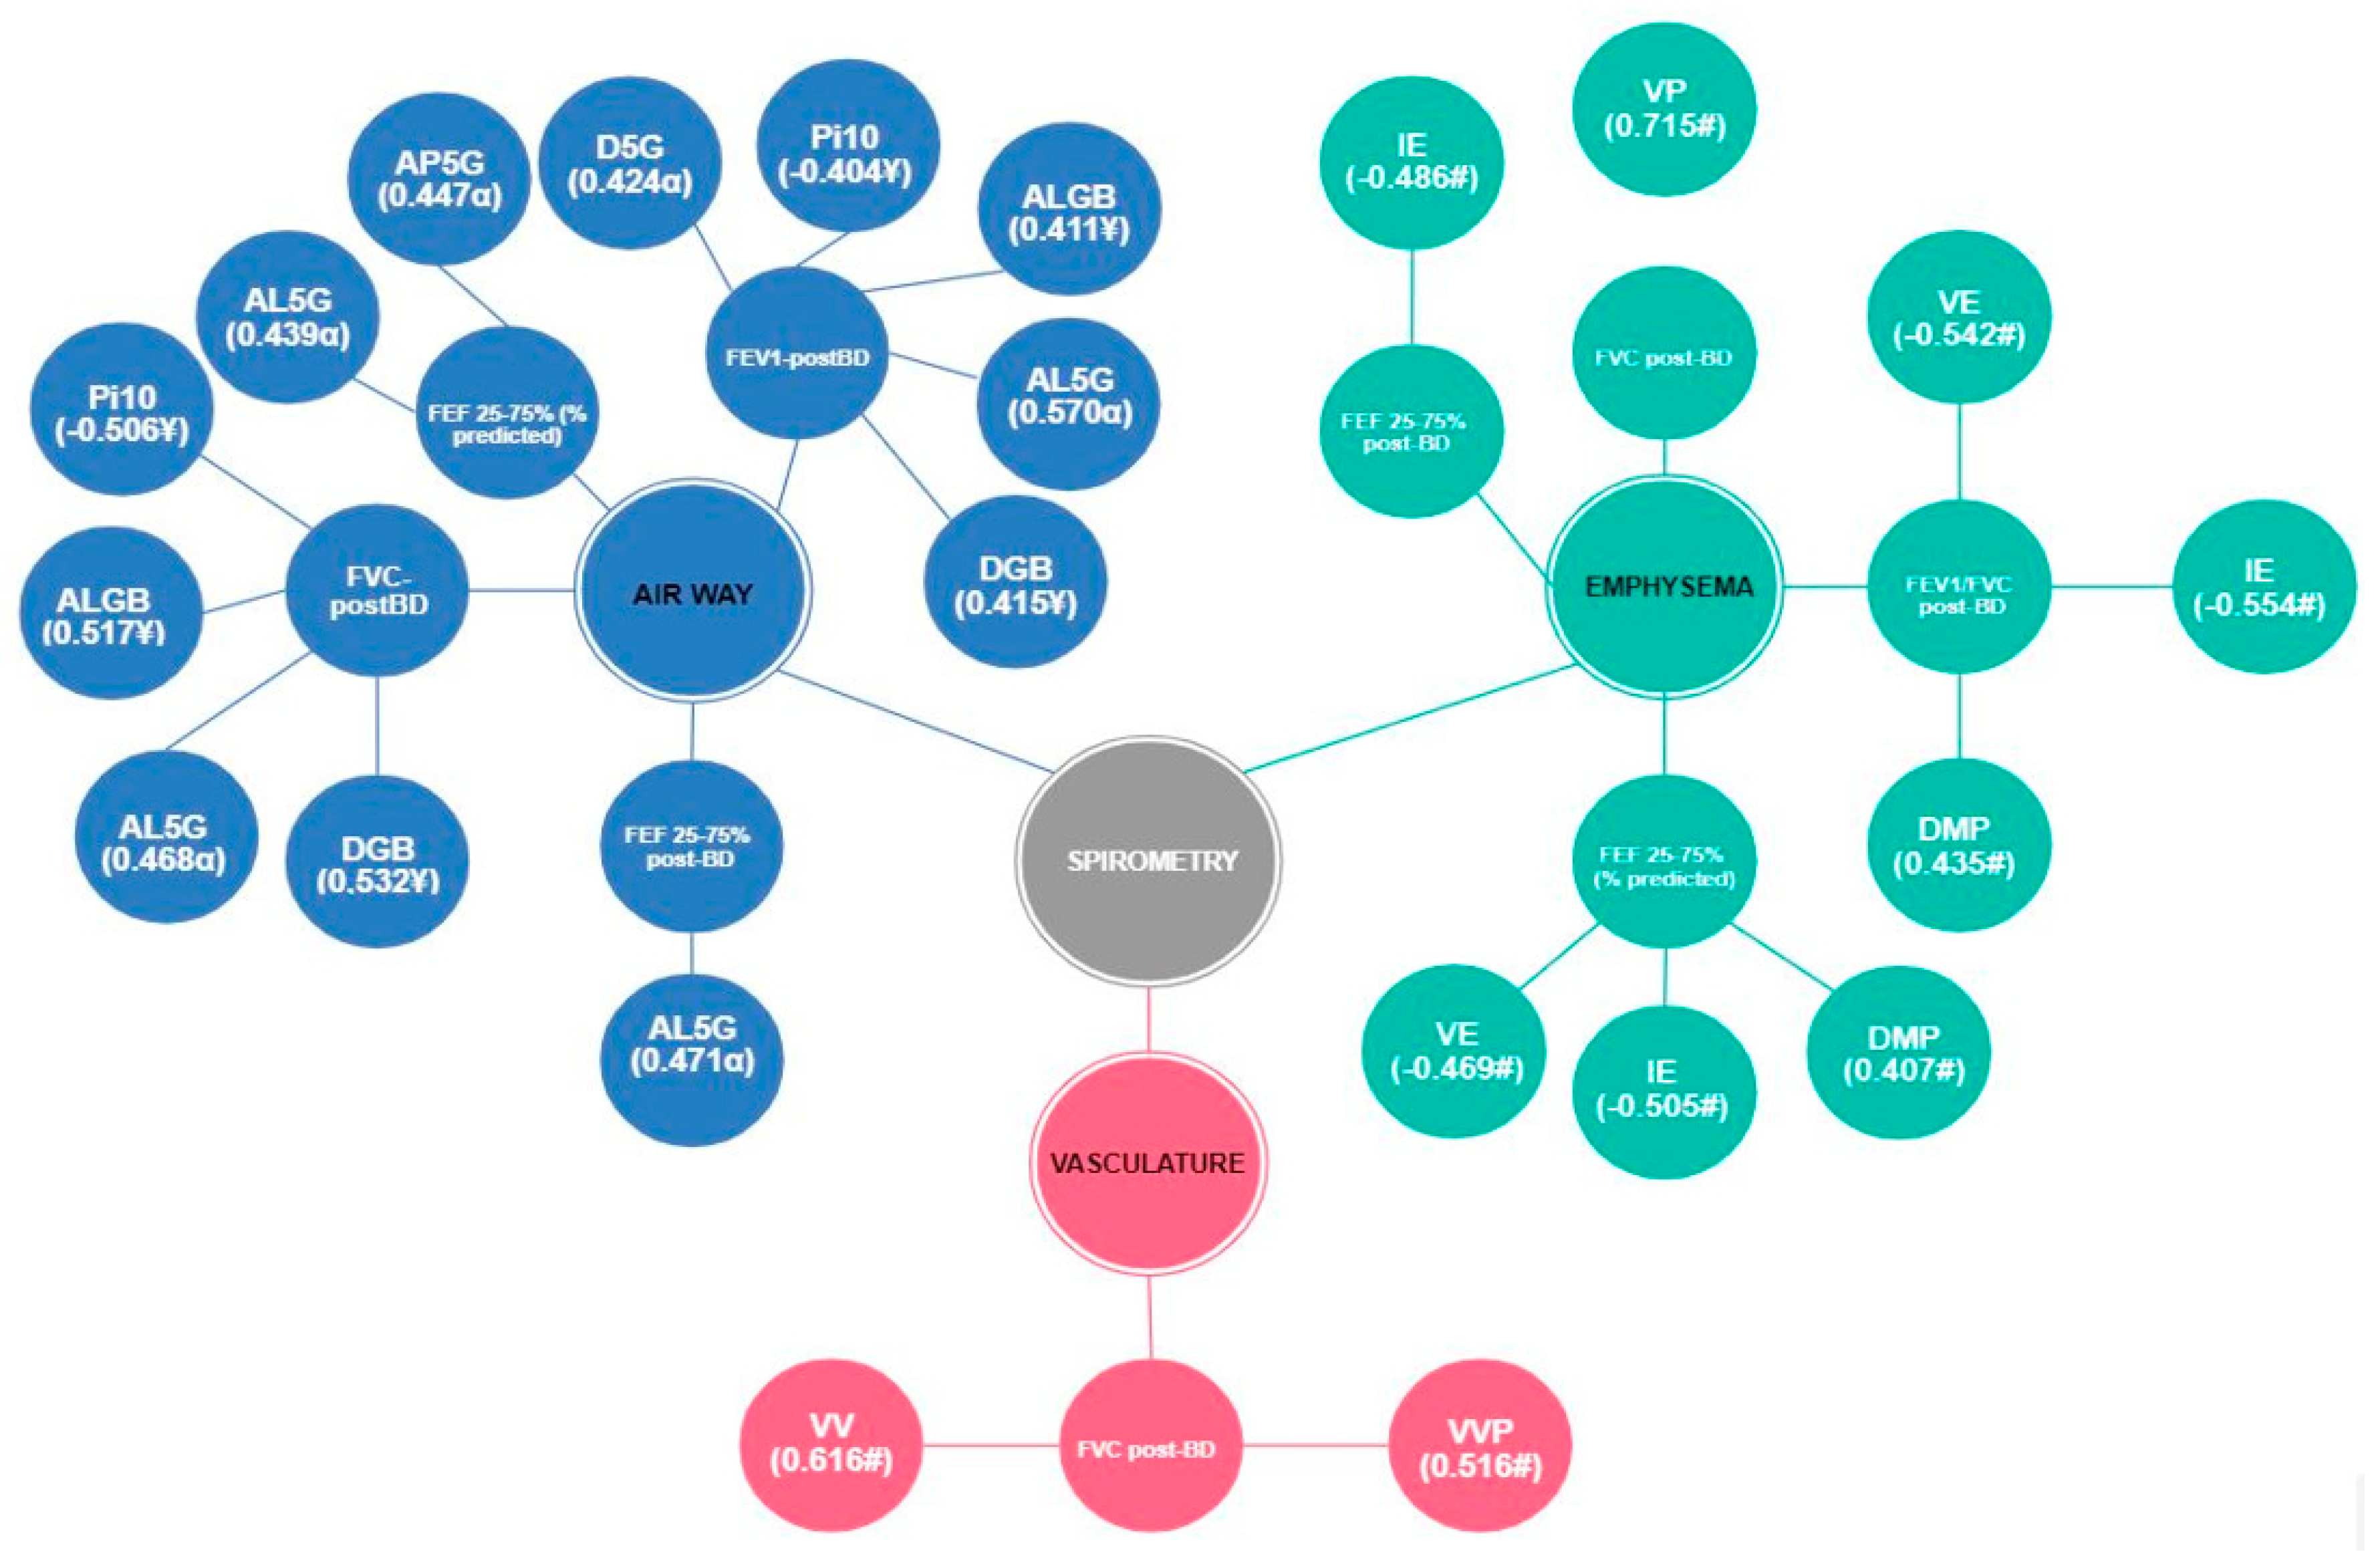
—Moderate correlation; Jor 02 00002 i002—Strong correlation; Total MV—alveolar minute volume; VD/VT aw—ratio of airway dead space to expired volume; PeCO2—mean partial pressure of mean carbon dioxide; VT alv—alveolar tidal volume; ETCO2—partial pressure of carbon dioxide at end-tidal; Vi—volume inspired; Ve—volume expired; PSlp3—phase 3 slope; P3Slp/ETCO2—phase 3 slope normalized by ETCO2; P3Slp/Ve—phase 3 slope normalized by Ve; HR—heart rate; Ti—inspiratory time; Te—expiratory time; ALGB—lumen area by bronchial generation; AL3G—lumen area (3rd generation); AL5G—lumen area (5th generation); Pi10—internal perimeter of 10 mm; WGB—relative wall thickness by bronchial generation; W3G—relative wall thickness (3rd generation); W4G—relative wall thickness (4th generation); W5G—relative wall thickness (5th generation); AP5G—Mean peak attenuation (5th generation); EP5G—wall thickness (5th generation); DGB—diameter by bronchial generation; D5G—diameter (5th generation).
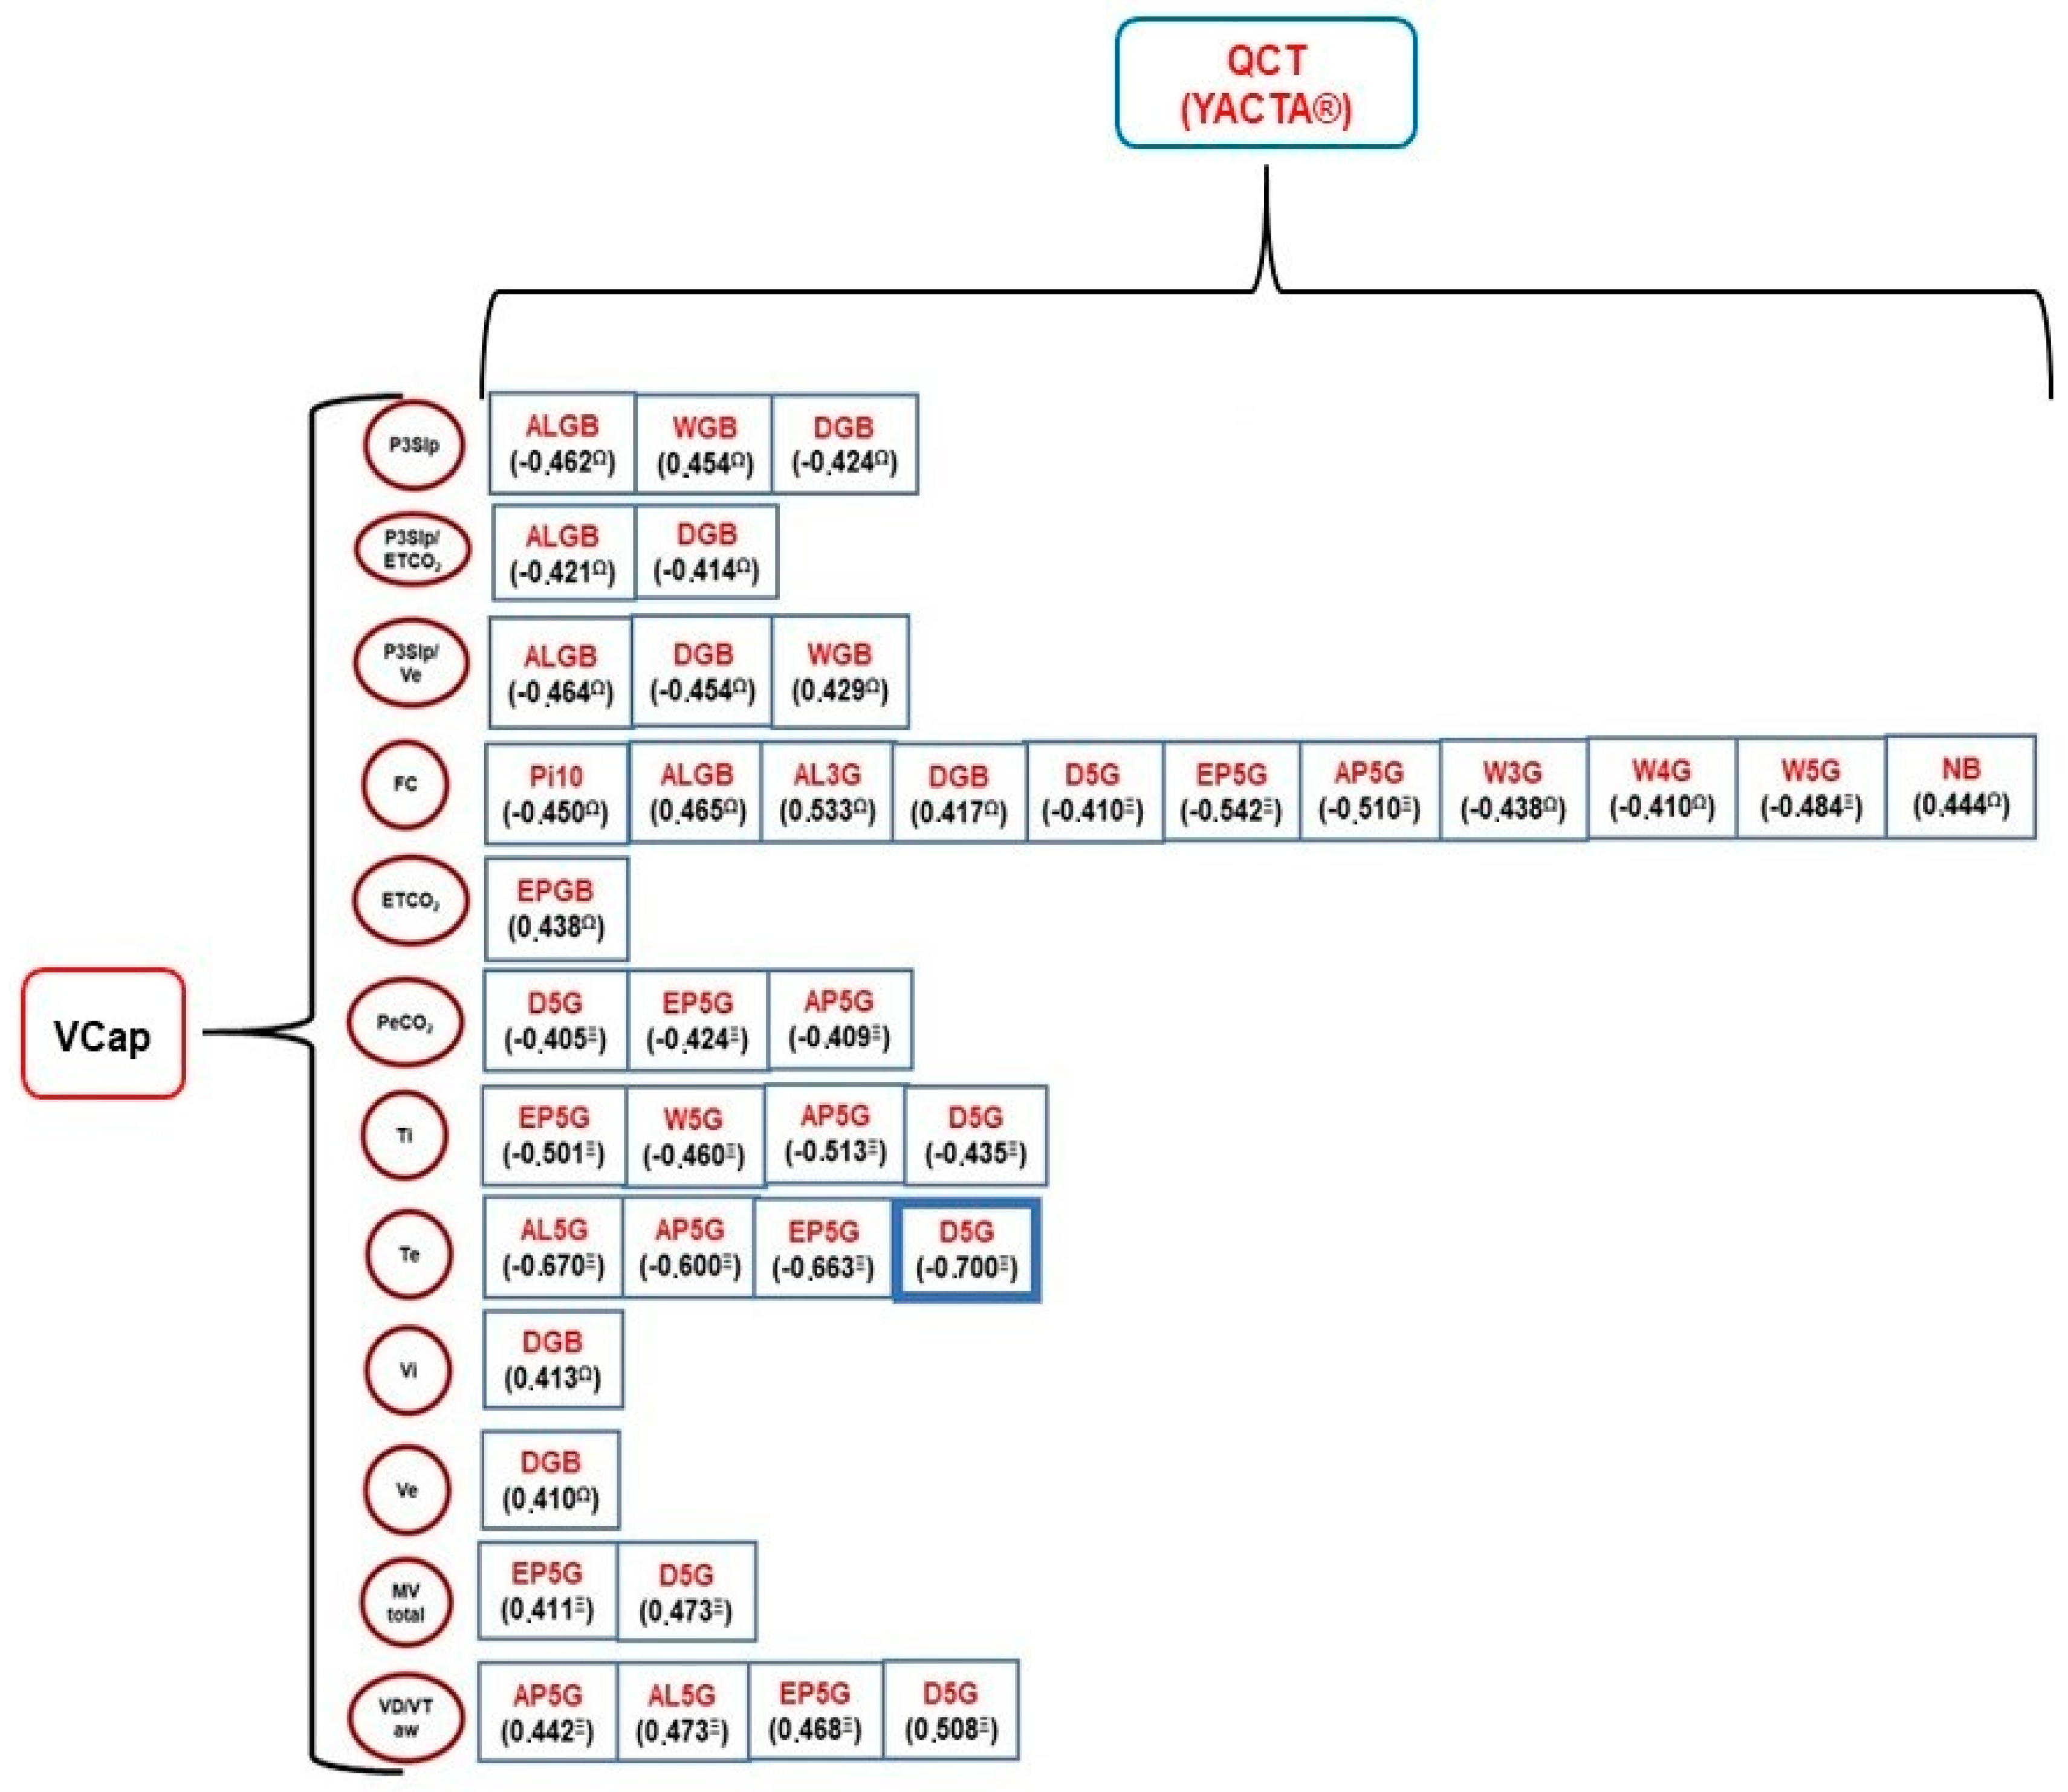
Jor 02 00002 g002
Table 1. Distribution of mean values for demographic and functional variables in patients with severe and very severe COPD.
N = 27Mean/SD
Clinical dataAge (years)65.07 ± 8.25
Cigarettes/day30.03 ± 17.05
Smoking time (years)40.37 ± 11.56
Years/pack58.57 ± 34.21
BMI (kg/m2)28.13 ± 5.94
SpirometryFVC pre-BD (L)1.31 ± 0.61
FVC % predicted pre-BD55.59 ± 11.73
FEV1 pre-BD (L)1.18 ± 0.5
FEV1 % predicted pre-BD42.22 ± 12.73
FEF 25–75% pre-BD0.69 ± 0.48
FVC post-BD (L)1.99 ± 0.6
FVC % post-BD57.54 ± 11.64
FEV1 post-BD (L)1.22 ± 0.45
FEV1 % predicted post-BD44.81 ± 12.34
FEV1/FVC post-BD16.36 ± 27.5
FEF 25–75% post-BD0.75 ± 0.49
6MWTDistance covered (m)345.3 ± 85.7
Distance covered (% of predicted value)71 ± 0.14
Distance covered predicted471.31 ± 80.11
SpO2 baseline (%)94.96 ± 2.75
SpO2 6 min (%)87.77 ± 7.27
Desaturation (final SpO2—initial SpO2)7.03 ± 6.35
Volumetric capnographyTotal MV (mL)7.9 ± 2.94
Total alveolar MV (mL)5.7 ± 2.05
Total RR (cpm)17 ± 5.64
Vd aw (mL)131.5 ± 24.58
VD/VT aw0.29 ± 0.04
VCO2 (mL)172.1 ± 57.73
PeCO2 (mmHg)19.6 ± 4.13
ETCO2 (mmHg)34.2 ± 5.15
Vi (mL)466.9 ± 129.36
Ve (mL)482.2 ± 134.61
VCO2/br (mL/breathing)10.7 ± 4.9
P2Slp (mmHg)280.32 ± 89.30
P3Slp (mmHg)38.67 ± 19.66
P3Slp/ETCO21.11 ± 0.51
P3Slp/Ve0.11 ± 0.08
VT alv (mL)358.9 ± 138.8
HR baseline (bpm)83.22 ± 11.04
Ti (sec)1.47 ± 0.62
Te (sec)2.46 ± 1.35
BD—bronchodilator; BMI—body mass index; FVC—forced vital capacity; FEV1—forced expiratory volume in one second; FEV1/FVC—ratio of forced expiratory volume in one second to forced vital capacity; FEF 25–75%—forced expiratory flow between 25% and 75% of forced vital capacity; SpO2—oxygen pulse saturation; MV—minute volume; alveolar MV—alveolar volume per minute; RR—respiratory rate; Vd aw—anatomic dead space volume; VD/VT aw—ratio of anatomic dead space to tidal volume; VCO2—carbon dioxide excretion per minute; PeCO2—mean pressure of expired carbon dioxide; ETCO2—partial pressure of carbon dioxide at end-tidal; Vi—volume inspired; Ve—volume expired; VCO2/br—volume of carbon dioxide excreted per respiratory cycle; PSlp2—phase 2 slope; PSlp3—phase 3 slope; P3Slp/ETCO2—phase 3 slope divided by ETCO2; P3Slp/Ve—phase 3 slope divided by expired tidal volume; VT alv—alveolar tidal volume; HR baseline—heart rate (beats per minute); Ti—inspiratory time; Te—expiratory time.
Table 2. Data from CT scans and spirometry of COPD patients and controls.
VariablesCOPD
(N Variable, See Legend)
Control
(N = 19)
p
Computed Tomography
AirwaysERPB3_8 (%)54.85 ± 7.71 ¥46.19 ± 7.690.0012 1
ERPB (%)53.06 ± 4.88 ¥46.37 ± 4.680.0001 1
Pi100.30 ± 0.14 ¥0.19 ± 0.110.0079 1
W3G (%)57.85 ± 7.88 ¥51.84 ± 5.210.0013 1
W4G (%)60.43 ± 6.89 ¥53.91 ± 6.120.0029 1
W5G (%)60.94 ± 7.24 α51.03 ± 7.800.0002 1
AP4G (UH)−255.67 ± 100.73 ¥−335.86 ± 77.460.0069 1
AP5G (UH)−317.24 ± 132.05 α−450.93 ± 91.690.0006 1
EP3G (mm2)2.22 ± 0.45 ¥2.00 ± 0.240.0428 1
EP4G (mm2)1.82 ± 0.34 ¥1.58 ± 0.290.0263 1
EP5G (mm2)1.66 ± 0.53 α1.21 ± 0.310.0014 1
EmphysemaVE (cm3)1195.59 ± 1067.32 #11.00 ± 17.65<0.0001 1
IE (%)21.93 ± 17.99 #0.11 ± 0.32<0.0001 1
DMP (UH)−841.33 ± 40.43 #−797.16 ± 27.870.0002 1
Spirometry
FVC pre-BD (L)1.91 ± 0.63 #4.45 ± 0.87<0.0001 1
FEV1 pre-BD (L)1.19 ± 0.51 #3.70 ± 0.73<0.0001 1
FEV1/FVC pre-BD0.60 ± 0.12 #0.91 ± 0.20<0.0001 1
FEF 25–75% pre-BD0.69 ± 0.49 #4.31 ± 1.49<0.0001 1
α N—21; ¥ N—26; # N—27; ERPB3_8—relative wall thickness of 3rd to 8th bronchial generation; ERPB—relative wall thickness; Pi10—internal perimeter of 10 mm; W3G—relative wall thickness (3rd generation); W4G—Relative wall thickness (4th generation); W5G—relative wall thickness (5th generation); AP4G—mean peak attenuation (4th generation); AP5G—mean peak attenuation (5th generation); EP3G—wall thickness (3rd generation); EP4G—wall thickness (4th generation); EP5G—wall thickness (5th generation); VE—emphysema volume; IE—emphysema index; DMP—mean lung density; BD—bronchodilator; FVC—forced vital capacity; FEV1—forced expiratory volume in one second; FEV1/FVC—ratio of forced expiratory volume in one second to forced vital capacity; FEF 25–75%—forced expiratory flow between 25% and 75% of forced vital capacity.
Table 3. Correlation analysis of clinical data versus CT scan variables.
Clinical Variables CT Scan DataCorrelation
(N Variable, See Legend)
p
Airways
Cigarette/dayversusWGB (%)−0.41196 ¥0.0365
W3G (%)−0.43891 ¥0.0249
EP5G (mm2)−0.41731 α0.0598
Smoking time (years)versusAL3G (mm2)−0.47476 ¥0.0143
Emphysema
BMI (kg/m2)versusVE (cm3)−0.51960 #0.0055
IE (%)−0.54213 #0.0035
Vasculature
Age (years)versusVV (cm3)−0.52400 ¤0.0086
α N—21; ¤ N—24; ¥ N—26; # N—27; BMI—body mass index; BD—bronchodilator; WGB—relative wall thickness by bronchial generation; W3G—relative wall thickness (3rd generation); EP5G—wall thickness (5th generation); AL3G—lumen area (3rd generation); EV—emphysema volume; IE—emphysema index; VV—vascular volume.
Table 4. Correlation analysis of six-minute walk test data versus CT variables in the COPD group.
6MWT CT Scan DataCorrelation
(N Variable, See Legend)
p
Airways
Distance covered (meters)versusW5G (%)−0.50829 α0.0186
Vasculature
Distance covered (% of predicted distance)versusVV (cm3)−0.49130 ¤0.0148
VVP (cm3)−0.44967 ¤0.0275
α N—21; ¤ N—24; 6MWT—6-min walk test; W5G—relative wall thickness (5th generation); AP5G—mean peak attenuation (5th generation); P90—90th percentile of density; VP—lung volume; VV—vascular volume; VVP—peripheral vascular volume.
Publisher’s Note: MDPI stays neutral with regard to jurisdictional claims in published maps and institutional affiliations.

