Proceeding Paper

Quantifying Tree Cover Loss in Urban Forests within Nairobi City Metropolitan Area from Earth Observation Data †

1
School of Surveying and Geospatial Sciences, Department of Geo-Information and Earth Observation, Technical University of Kenya, P.O. Box 52428-00200, Nairobi, Kenya
2
Centre for Integrated Water Resource Management, Hydrology and Earth Information Lab, Technical University of Kenya, P.O. Box 52428-00200, Nairobi, Kenya
3
GeoPsy Multidisciplinary Research, P.O. Box 101011-00101, Nairobi, Kenya
*
Author to whom correspondence should be addressed.
Presented at the 1st International Electronic Conference on Forests, 15–30 November 2020; Available online: https://sciforum.net/conference/IECF2020.
Environ. Sci. Proc. 2021, 3(1), 78; https://doi.org/10.3390/IECF2020-07952
Published: 12 November 2020

Abstract

:
Urban forests contribute significantly to the ecological integrity of urban areas and the quality of life of urban dwellers through air quality control, energy conservation, improving urban hydrology, and regulation of land surface temperatures (LST). However, urban forests are under threat due to human activities, natural calamities, and bioinvasion continually decimating forest cover. Few studies have used fine-scaled Earth observation data to understand the dynamics of tree cover loss in urban forests and the sustainability of such forests in the face of increasing urban population. The aim of this work was to quantify the spatial and temporal changes in urban forest characteristics and to assess the potential drivers of such changes. We used data on tree cover, normalized difference vegetation index (NDVI), and land cover change to quantify tree cover loss and changes in vegetation health in urban forests within the Nairobi metropolitan area in Kenya. We also used land cover data to visualize the potential link between tree cover loss and changes in land use characteristics. From approximately 6600 hectares (ha) of forest land, 720 ha have been lost between 2000 and 2019, representing about 11% loss in 20 years. In six of the urban forests, the trend of loss was positive, indicating a continuing disturbance of urban forests around Nairobi. Conversely, there was a negative trend in the annual mean NDVI values for each of the forests, indicating a potential deterioration of the vegetation health in the forests. A preliminary, visual inspection of high-resolution imagery in sample areas of tree cover loss showed that the main drivers of loss are the conversion of forest lands to residential areas and farmlands, implementation of big infrastructure projects that pass through the forests, and extraction of timber and other resources to support urban developments. The outcome of this study reveals the value of Earth observation data in monitoring urban forest resources.

1. Introduction

Urban forests are recognized for both their environmental and socioeconomic benefits to cities and urban areas across the globe. From an environmental point of view, trees and forests in urban areas contribute to carbon dioxide sequestration, air quality control, noise reduction, urban hydrology, and regulation of both land surface and air temperatures [1]. Similarly, urban forests and other green spaces within urban areas have been linked to the general quality of life of urban populations. Furthermore, urban forests are habitats to a rich biodiversity of plants and animals, allowing the organisms to coexist close to urban dwellers, providing a platform for learning, exploration, and research [2]. Apart from their environmental benefits, urban forests are a source livelihood for communities that practice urban agriculture and horticulture. Urban forests have also been used to promote tourism and leisure investments near cities, thus providing a source of income to people in the tourism and entertainment industries. In Sustainable Development Goals 11 (SDG 11), the important role of urban forests in achieving integrated urban environments is recognized [3].
Despite the benefits that abound from urban forests, they face considerable pressure due to their locations in urban or periurban areas. The more than fivefold growth of urban population from 746 million people in 1950 to about 4 billion people in 2020 [4] has come with additional pressure on urban and periurban resources as more land, food, and natural resources are sought to meet the urban demands. Human activities, particularly, the construction of residential areas, development of infrastructure, increased use of urban forests for sports and leisure activities, urban farming, and pollution are some of the main drivers of urban forest change [5]. These are even more prevalent in urban areas and cities where regulations and policies on forest conservation are not strictly implemented.
In Kenya, forests are estimated to cover approximately 4,200,000 hectares (ha), which is about 7.4% of the total land area of the country. It was estimated that, on average, the country loses approximately 5000 hectares [6] of forest cover per year, with the main drivers of the forest decline being deforestation to create space for alternative human activities [7]. While various studies have been carried out to understand the national picture of forest cover change in Kenya, rarely are any studies carried out to understand the dynamics of urban forests in the county, yet these are some of the most vulnerable landscapes.
Remote sensing has been used to study urban forests as it provides long-term, high-resolution, and uniformly captured and preprocessed satellite imagery that can allow for studying and documentation of spatial and temporal dynamics of forest cover change [8]. Moreover, the emergence of global-scale big Earth observation data, which are archived in cloud-based platforms like Google Earth Engine provides an enviable opportunity for understanding the changes in urban environments, with a particular focus on the dynamics and sustainability of forests in urban and periurban areas [9].
This study aimed to use available satellite-derived data to quantify the long-term changes in urban forests within the Nairobi metropolitan region. Specifically, we aimed to: (1) assess forest cover change and changes in vegetation health from 2000 to 2019 using satellite-derived tree cover data and NDVI imagery for the same period, (2) to understand the link between forest cover changes and land use characteristics, and (3) visualize the potential drivers of urban forest loss in the study area.

2. Methods

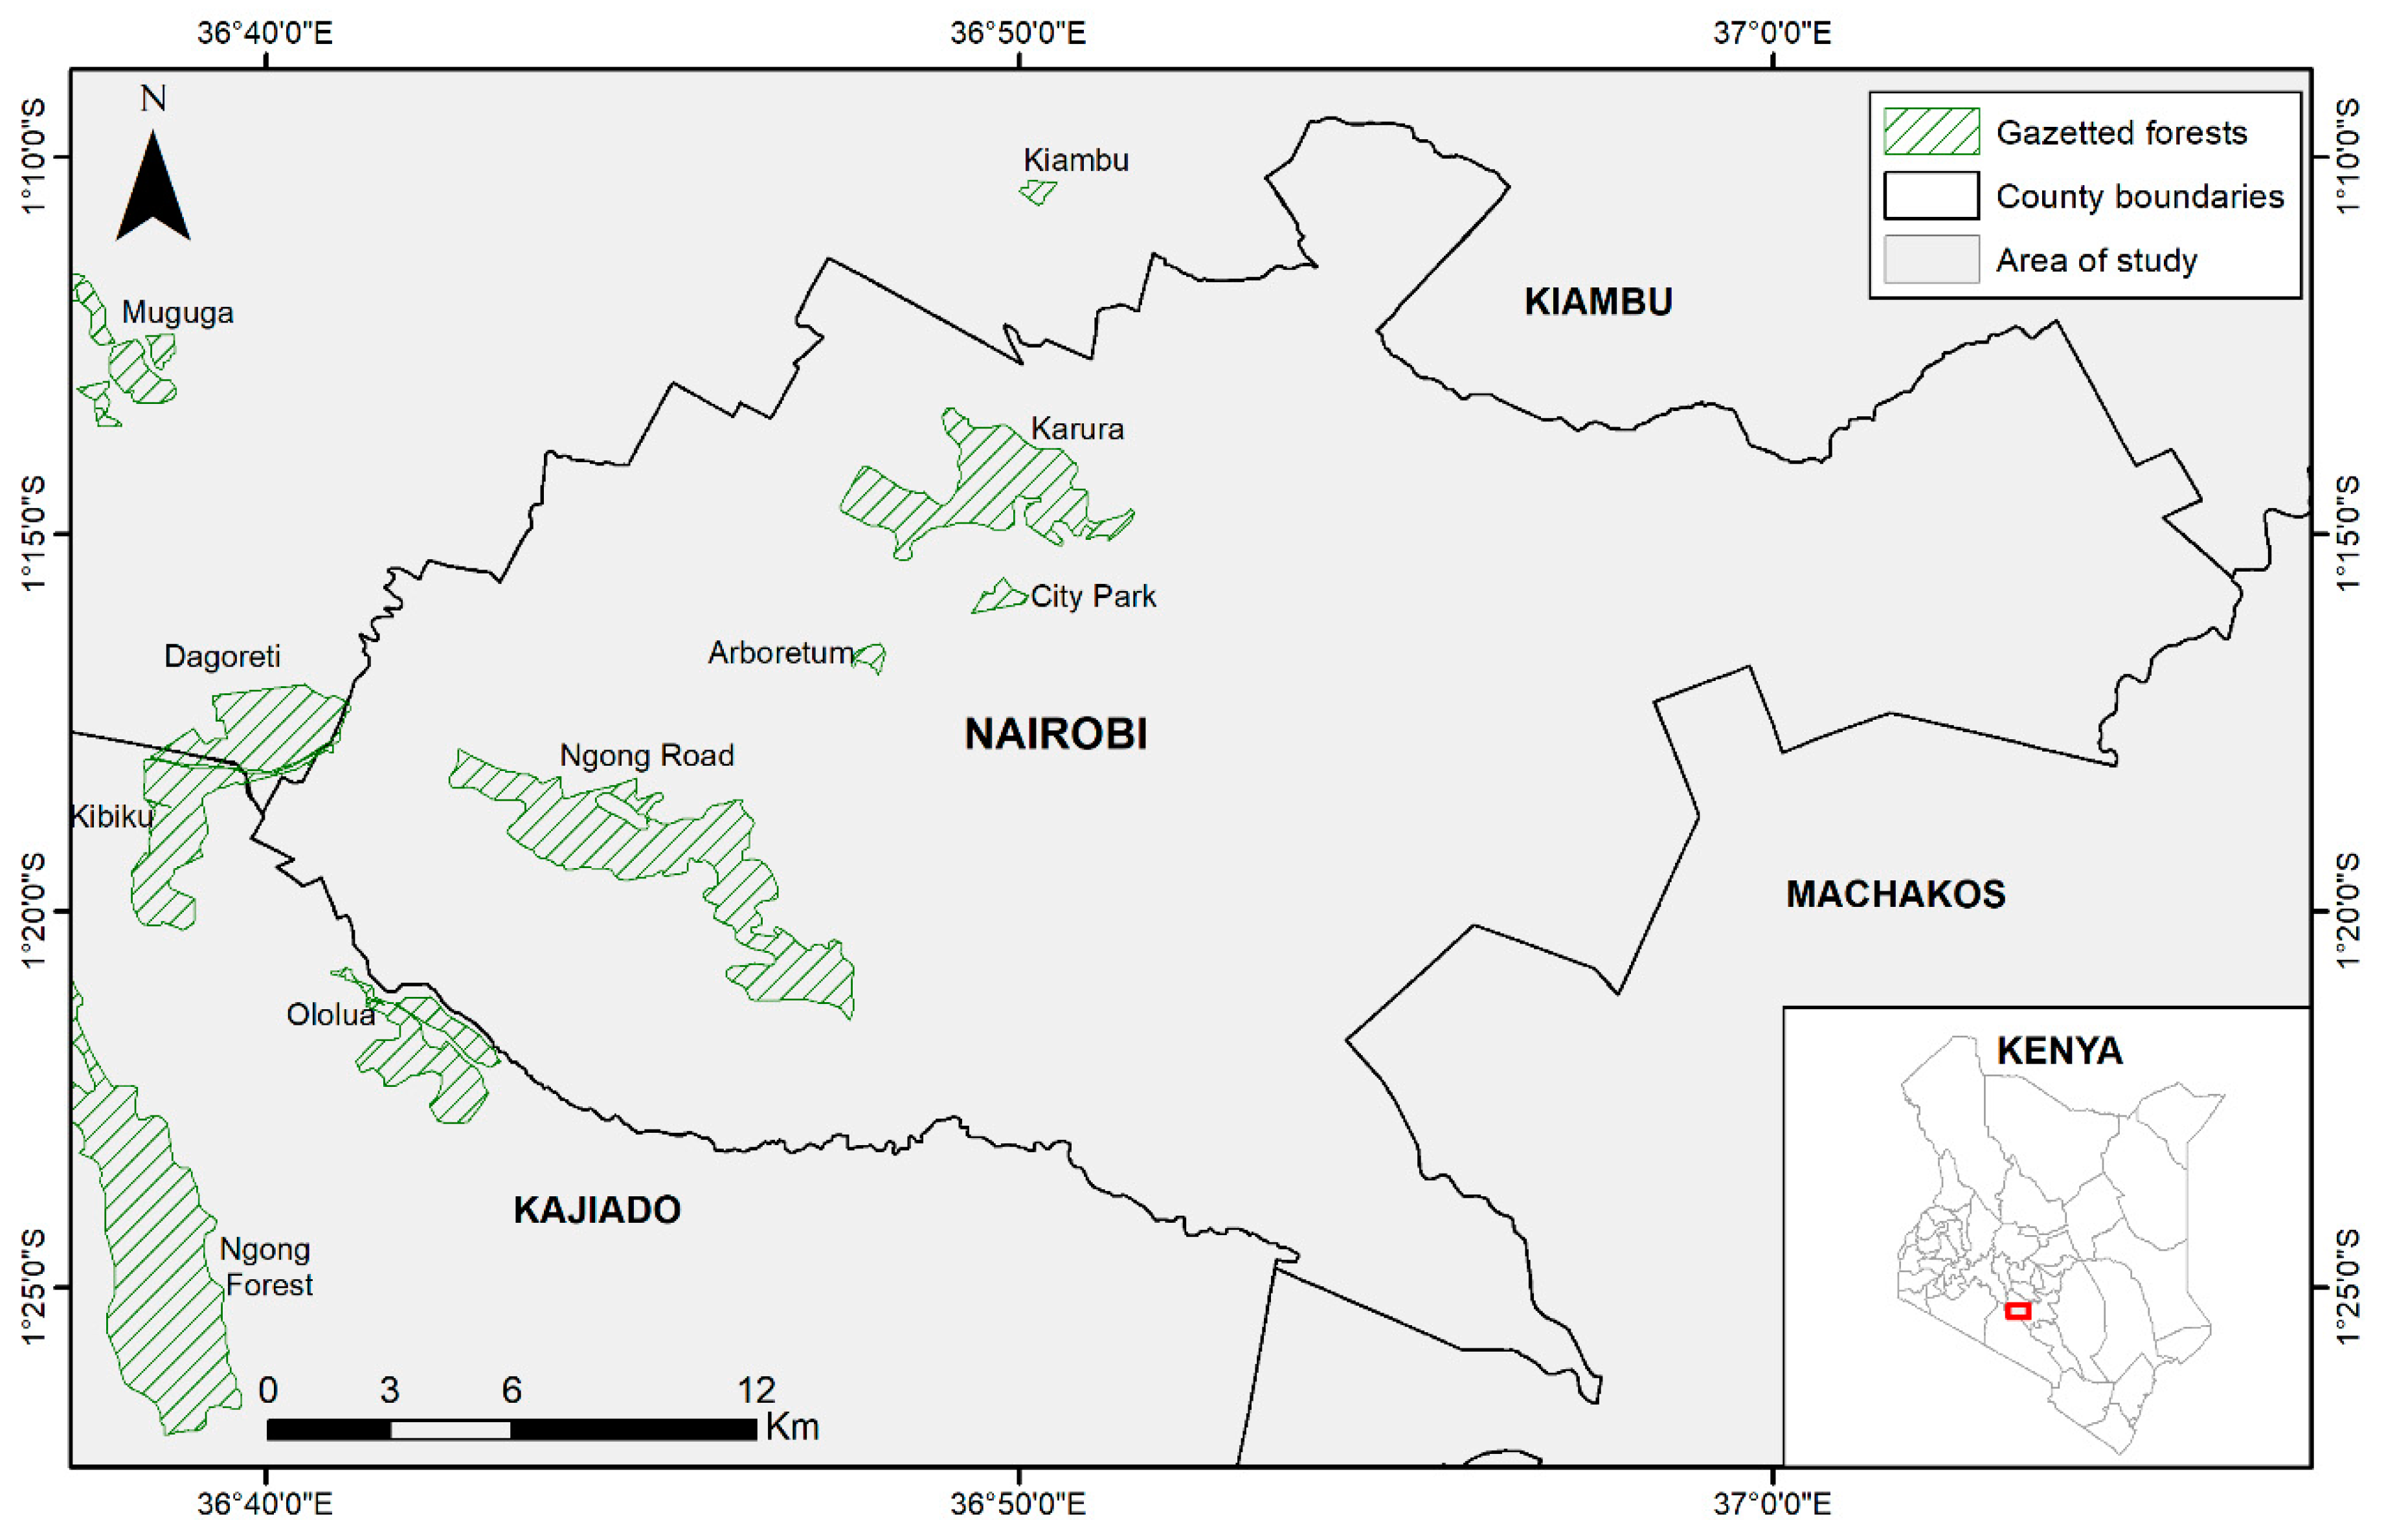
2.1. Description of the Study Area

This study was implemented within the Nairobi city metropolitan region (Figure 1), an area whose geographic extent ranges from longitudes 36.624° E to 37.121° E and latitudes −1.456° S to −1.148° S. The Nairobi metropolitan area covers an area of five different counties in Kenya, including Nairobi city, Machakos, Kajiado, Kiambu, and Muranga. The total area of the study area is about 32,700 km2 with a total population of about 10.4 million people. For the section selected for this study, there were 10 gazetted forests. Out of the 10, the Arboretum, City Park, Karura, and Ngong road forests are located within Nairobi County. The Ngong, Kibiku, and Ololua forests are within Kajiado County. The Dagoreti, Muguga, and Kiambu forests are within Kiambu County. The total gazetted area of these forests was approximately 6700 hectares. Because of their location within or in proximity to the city center, Karura, City Park, Arboretum, Ngong road, and Ngong forests are commonly used by the residents of the city for hiking picnics and sports.

2.2. Data

Table 1 provides an outline of the data, data sources, spatial, and temporal characteristics of the data sets that were used in this study.

2.3. Assessing Forest Cover Change

In assessing forest cover change, we used two data sets. Specifically, we used Hansen Global Forest Change (GFC) at a 30 m resolution [10] and Global Forest Cover Change (GFCC) at a 30 m resolution [11]. Global Forest Cover Change provided the percentage of tree cover for each pixel at 5-year epochs. We used these to create maps of tree cover situation in the entire area of study in 2000, 2005, 2010, and 2015. Then, we used Hansen Global Forest Change to estimate tree cover loss for each forest for the period between 2000 and 2019. These data contained four different raster files, including tree cover in 2000, tree loss and tree gain for the 20 years, and loss year data, which estimate the principal tree loss for each year. From the loss year data, we extracted each cumulative tree loss per year in the period between 2001 for the gazetted forests in the study area. Outputs were then used to plot charts and maps of annual tree loss trends in the targeted forests.

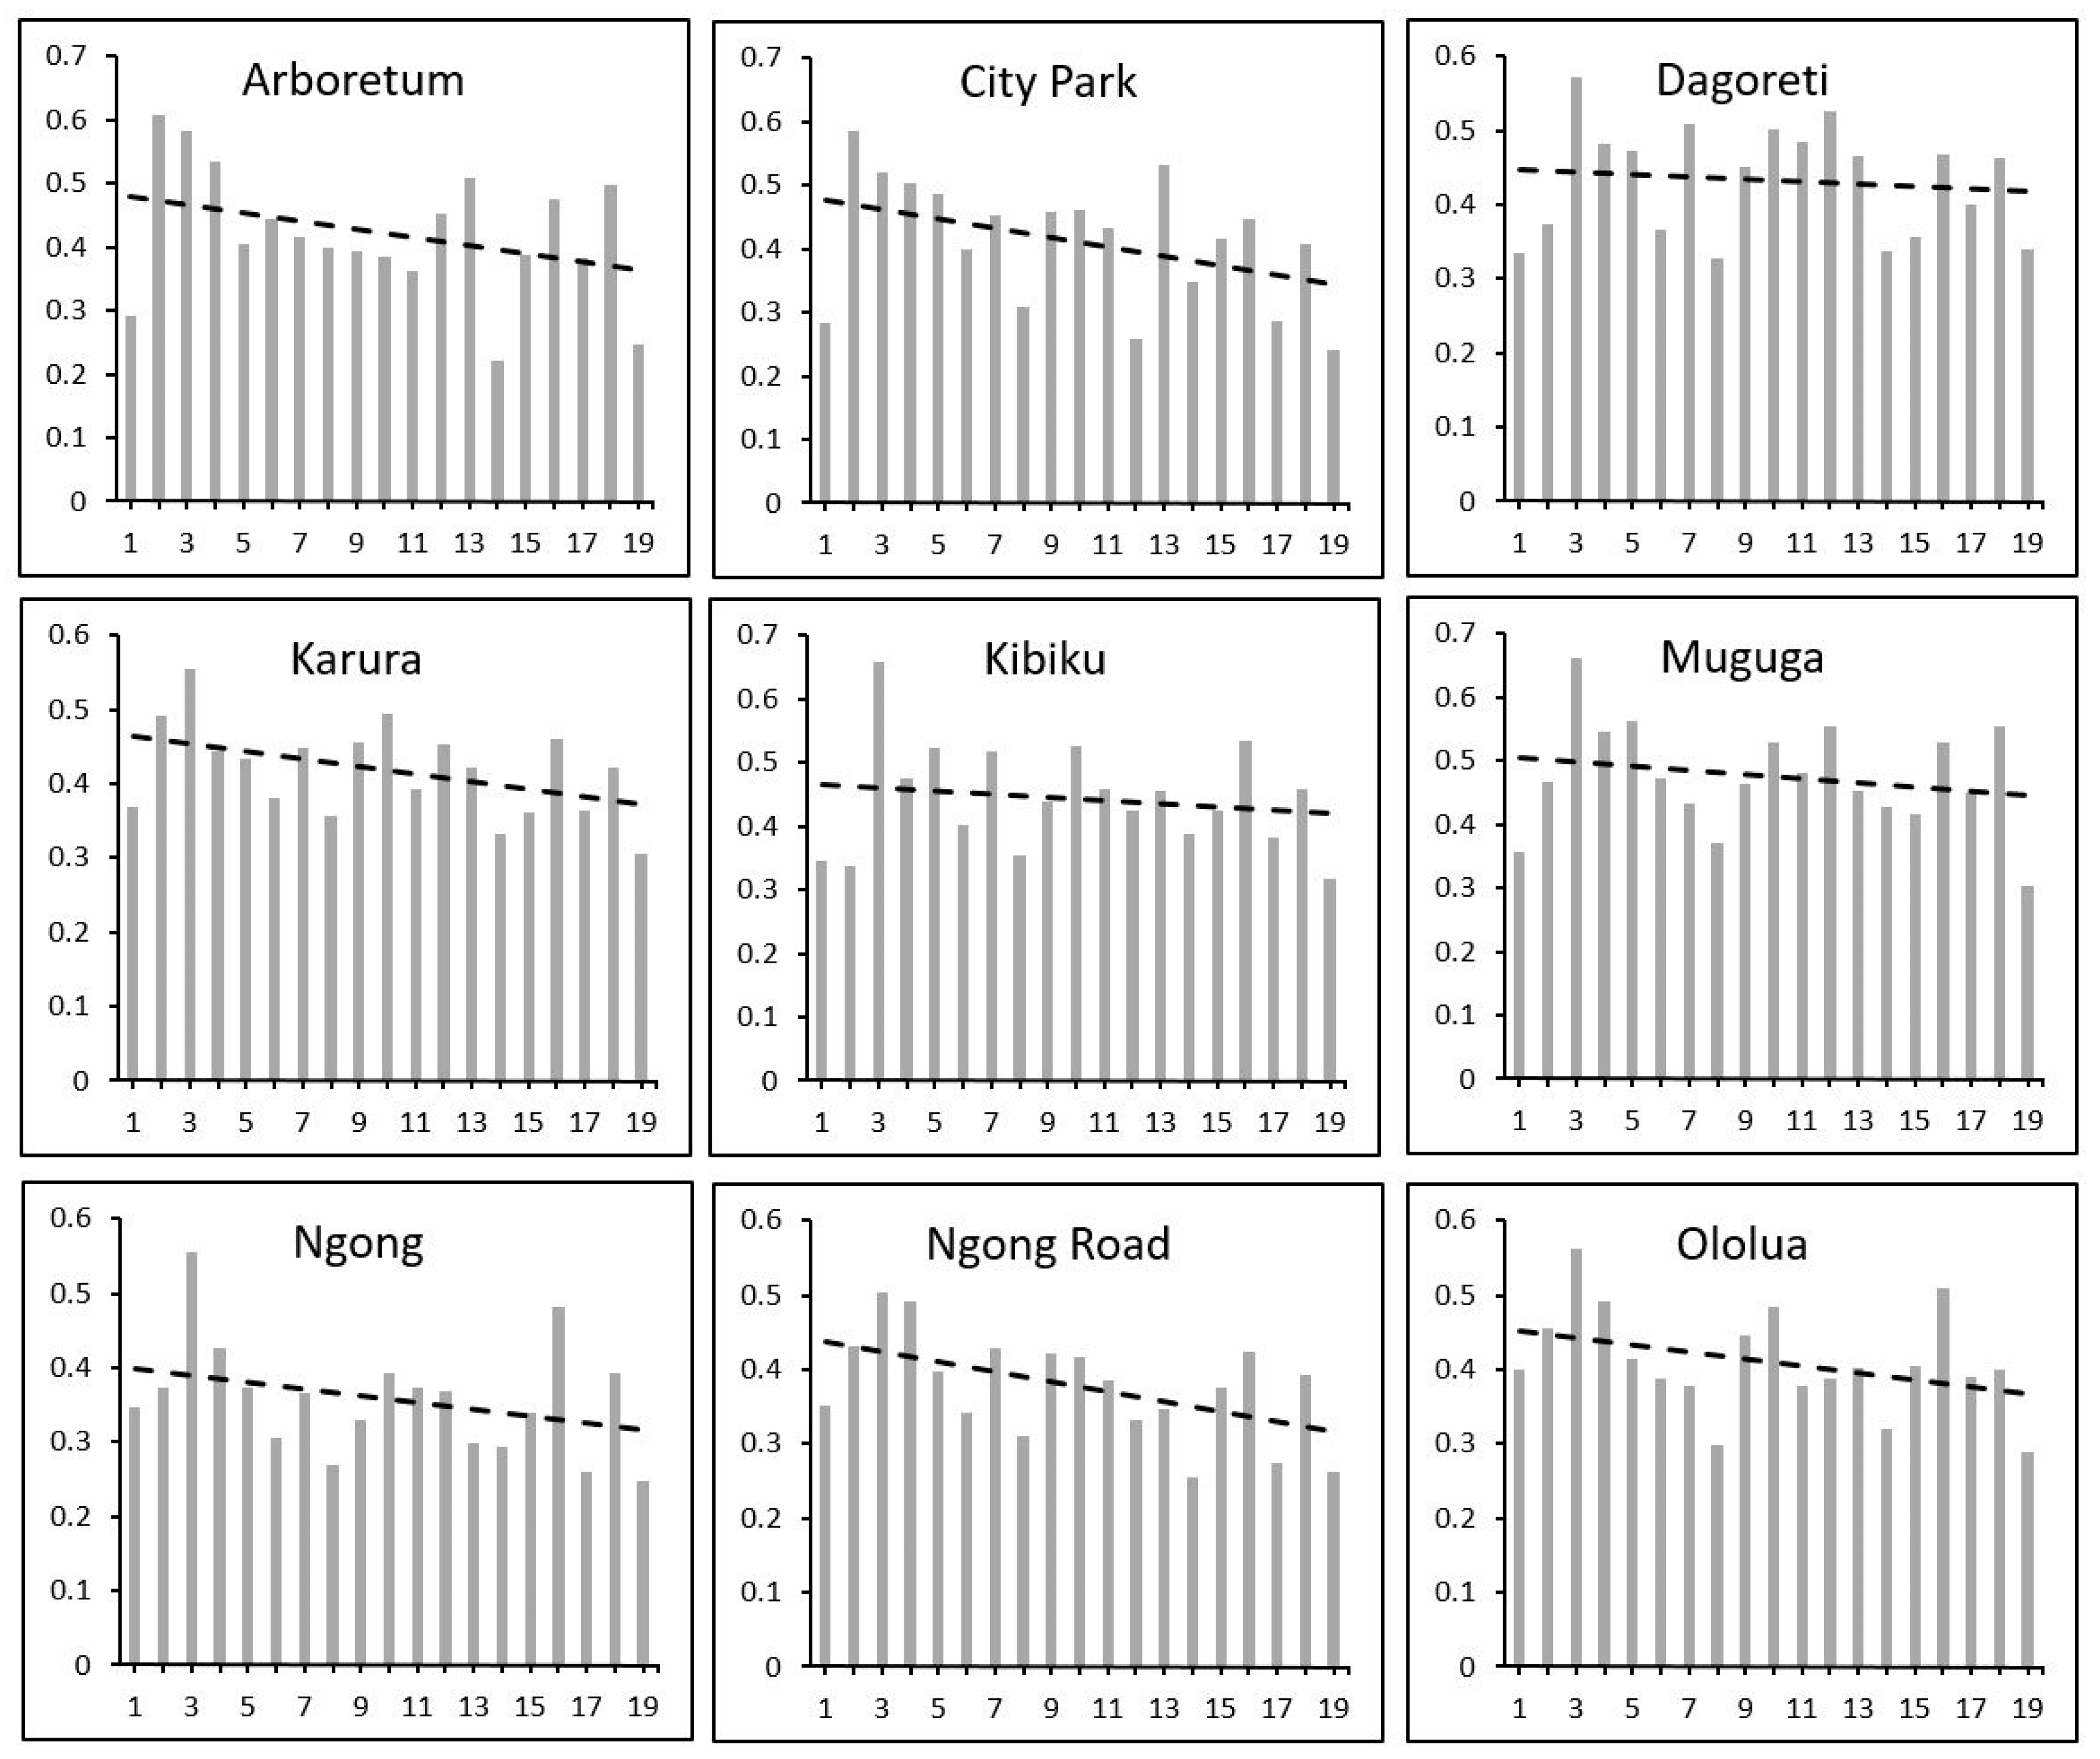
2.4. Trends of Change in NDVI

To access trends of change in NDVI, we used Landsat 7 8-day NDVI composites for the period between 2000 and 2019. Within the Google Earth Engine, we computed the annual mean NDVI data, ending up with yearly NDVI values from 2000 to 2019. For change detection, we used an image differencing approach by subtracting the base raster (NDVI 2000) from the raster of the subsequent epoch. In this study, we calculated NDVI changes at a time step of five years, that is, with the base year of 2001, the subsequent epochs were NDVI 2005, NDVI 2010, NDVI 2015, and NDVI 2019. Image differencing was previously implemented to study vegetation change in Kenya [12]. The resulting NDVI difference layers were reclassified to have uniform NDVI ranges from which NDVI decrease and increase zones were identified and evaluated. For uniformity, the resulting NDVI difference layers were reclassified into 5 classes: <−0.2 (major decrease), −0.2 to −0.05 (mild decrease), −0.05 to 0.05 (little change), 0.05–0.2 (mild increase), and >0.2 (Major increase). We adopted the categories from previous studies on NDVI change detection [13]. Furthermore, mean annual NDVI values for specific forests were extracted and used to plot charts showing the trend of change of NDVI from 2001 to 2019.

2.5. Land Cover Change Dynamics

Land cover change has been commonly cited as the main driver of urban forest loss [14]. Here, we visualized land use and land cover change annual global Moderate Resolution Imaging Spectroradiometer (MODIS) Land Cover Type data. This data was available at 500 m spatial resolution for the period between 2001 and 2019. We mapped the data at the 5-year interval, resulting in 5 different epochs in 2001, 2005, 2010, 2015, and 2019. From the original 19 classes in the data, we reclassified the raster files to produce only seven distinct land cover classes, namely forests, scrublands, woody savannah, grassland, cropland, urban areas, and wetlands. We thereafter created the modified land cover maps for each of the five epochs and tabulated the coverage of land cover types for each epoch.

2.6. The Link between Land Cover Change and Forest Cover Change Dynamics

To understand the relationship between land cover change and forest change dynamics, we created a tree cover map for the year 2000 and overlaid with cumulative tree loss for the years 2001 to 2019. High-resolution satellite imagery for forest sections showing more tree loss areas were acquired to access current land cover and land use characteristics. This was only done as a preliminary visual inspection of the potential drivers of urban forest change in the study area.

3. Results

From the different methods in this study, four main aspects of the results are presented in this section. These include forest cover changes, trends of changes in NDVI, land cover change dynamics, and preliminary visual assessment of the potential drivers of urban forest changes in the Nairobi metropolitan region.

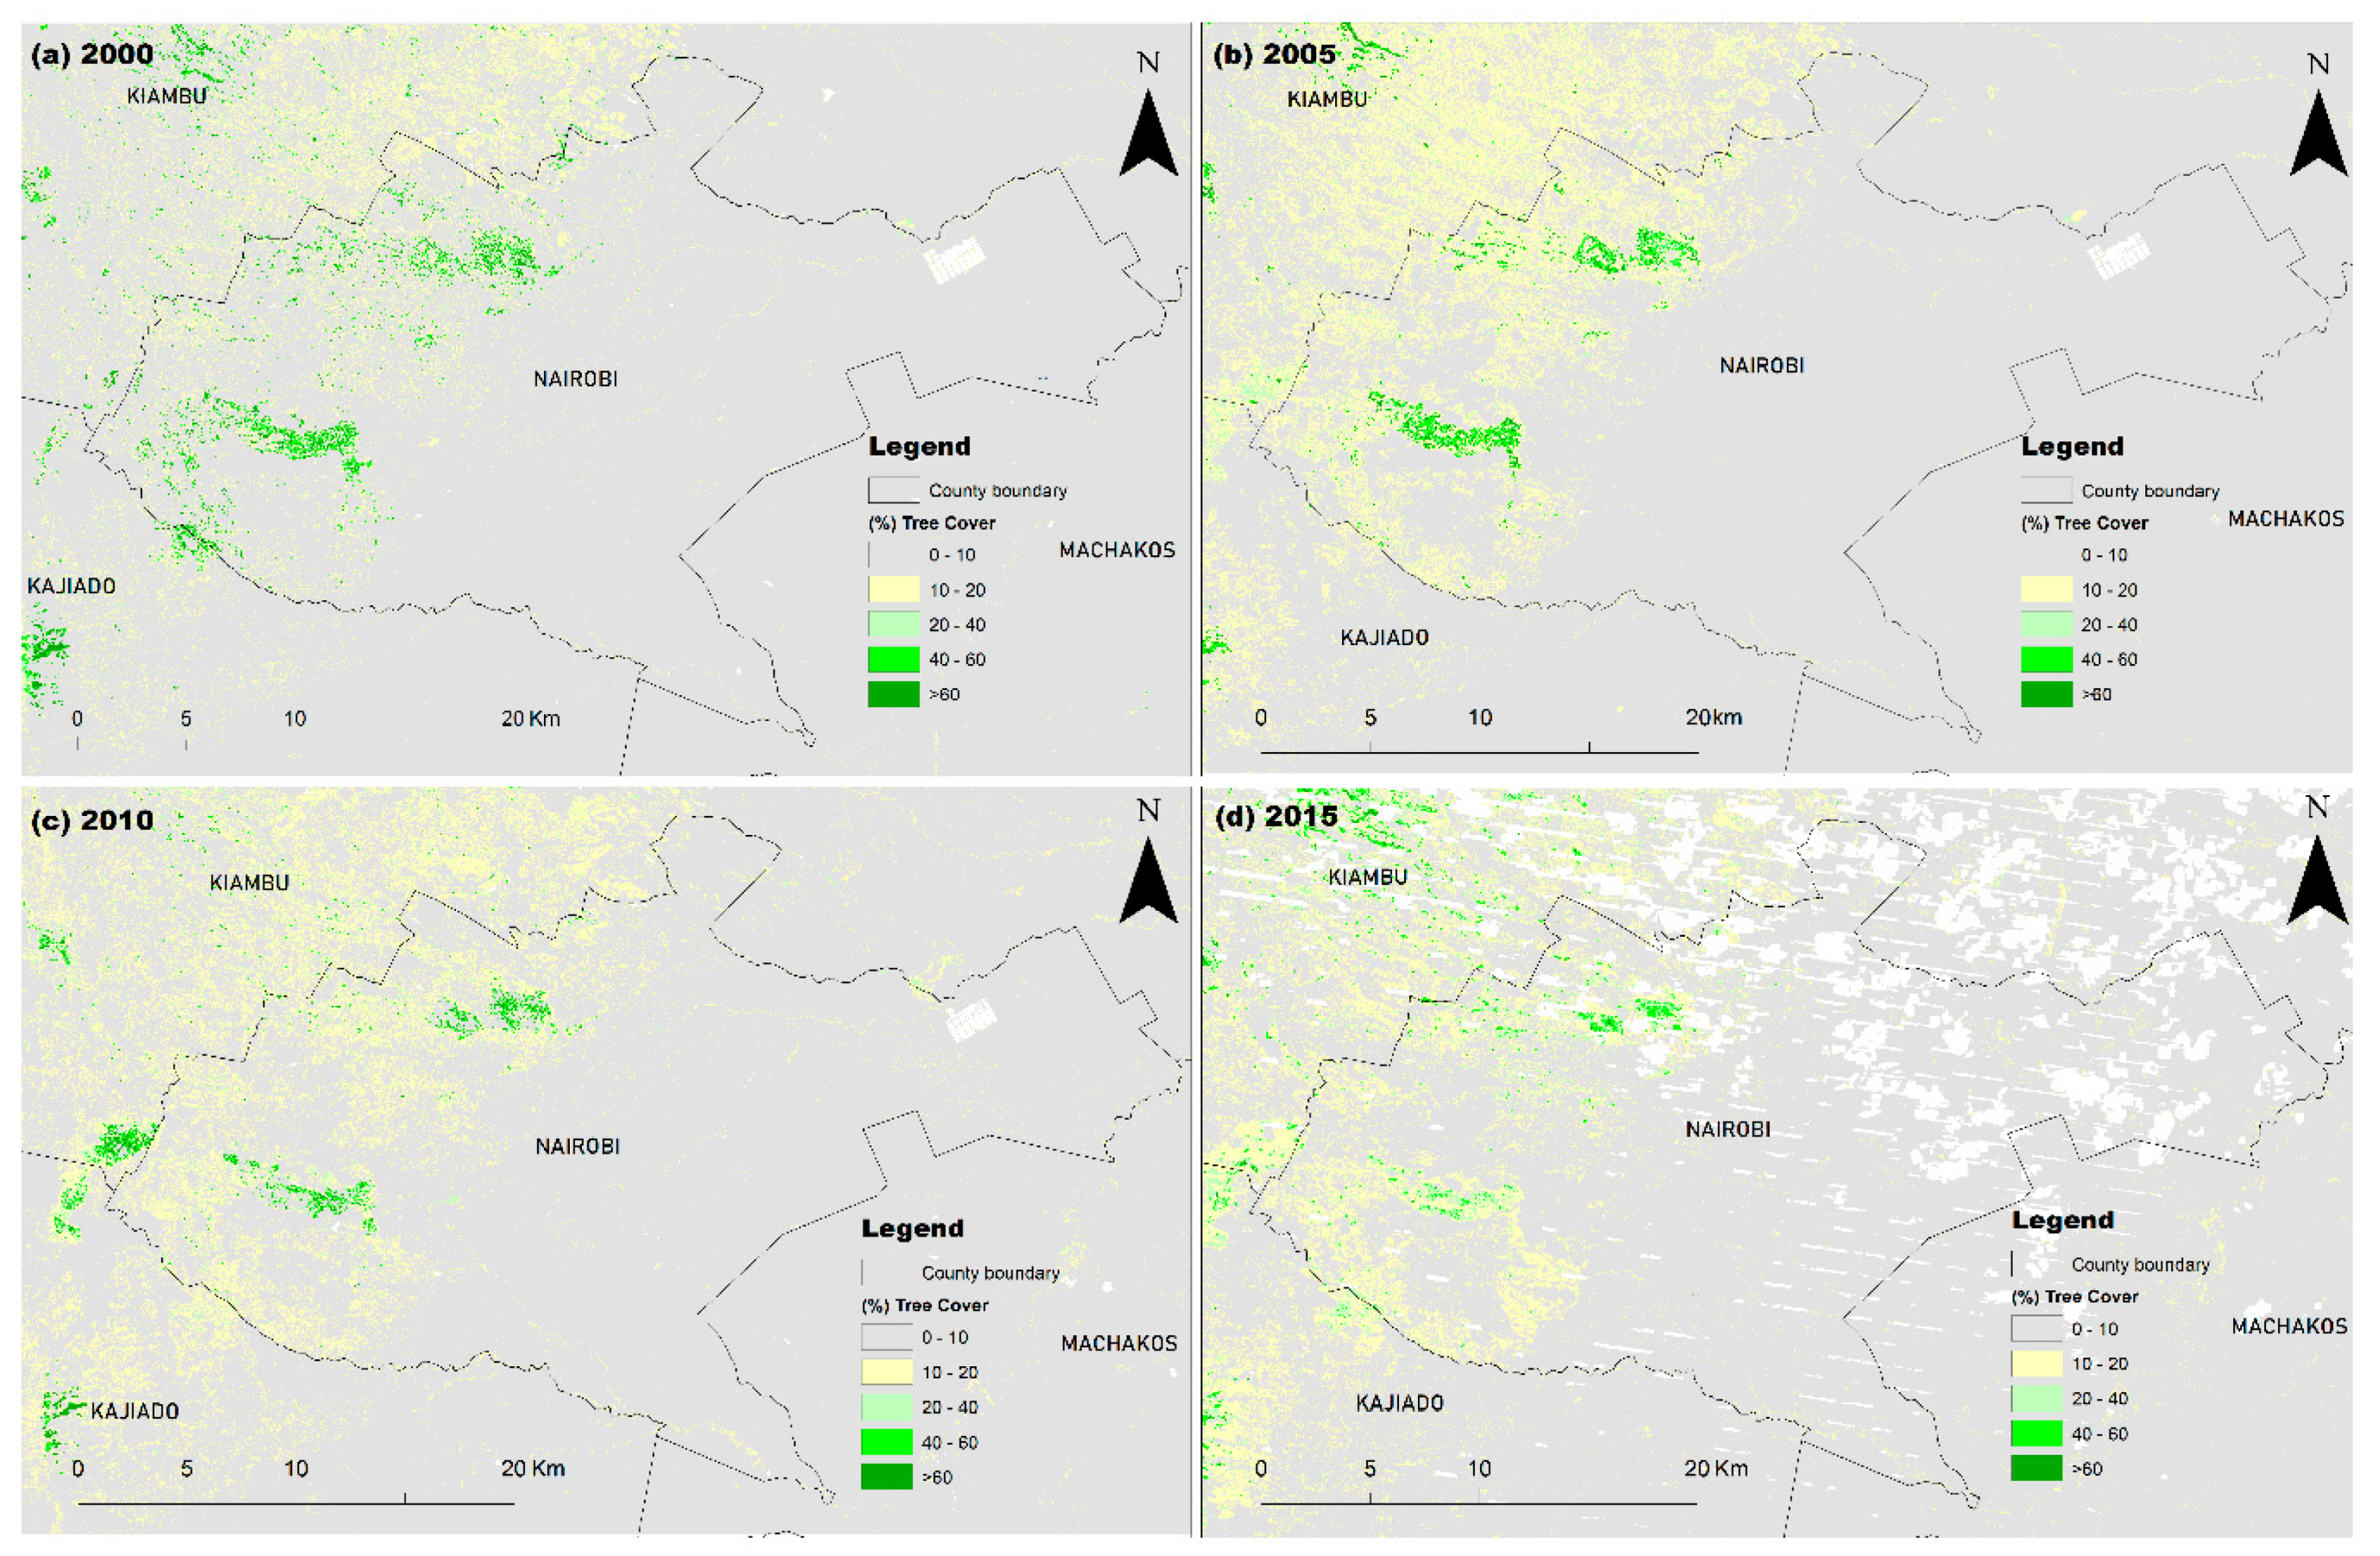
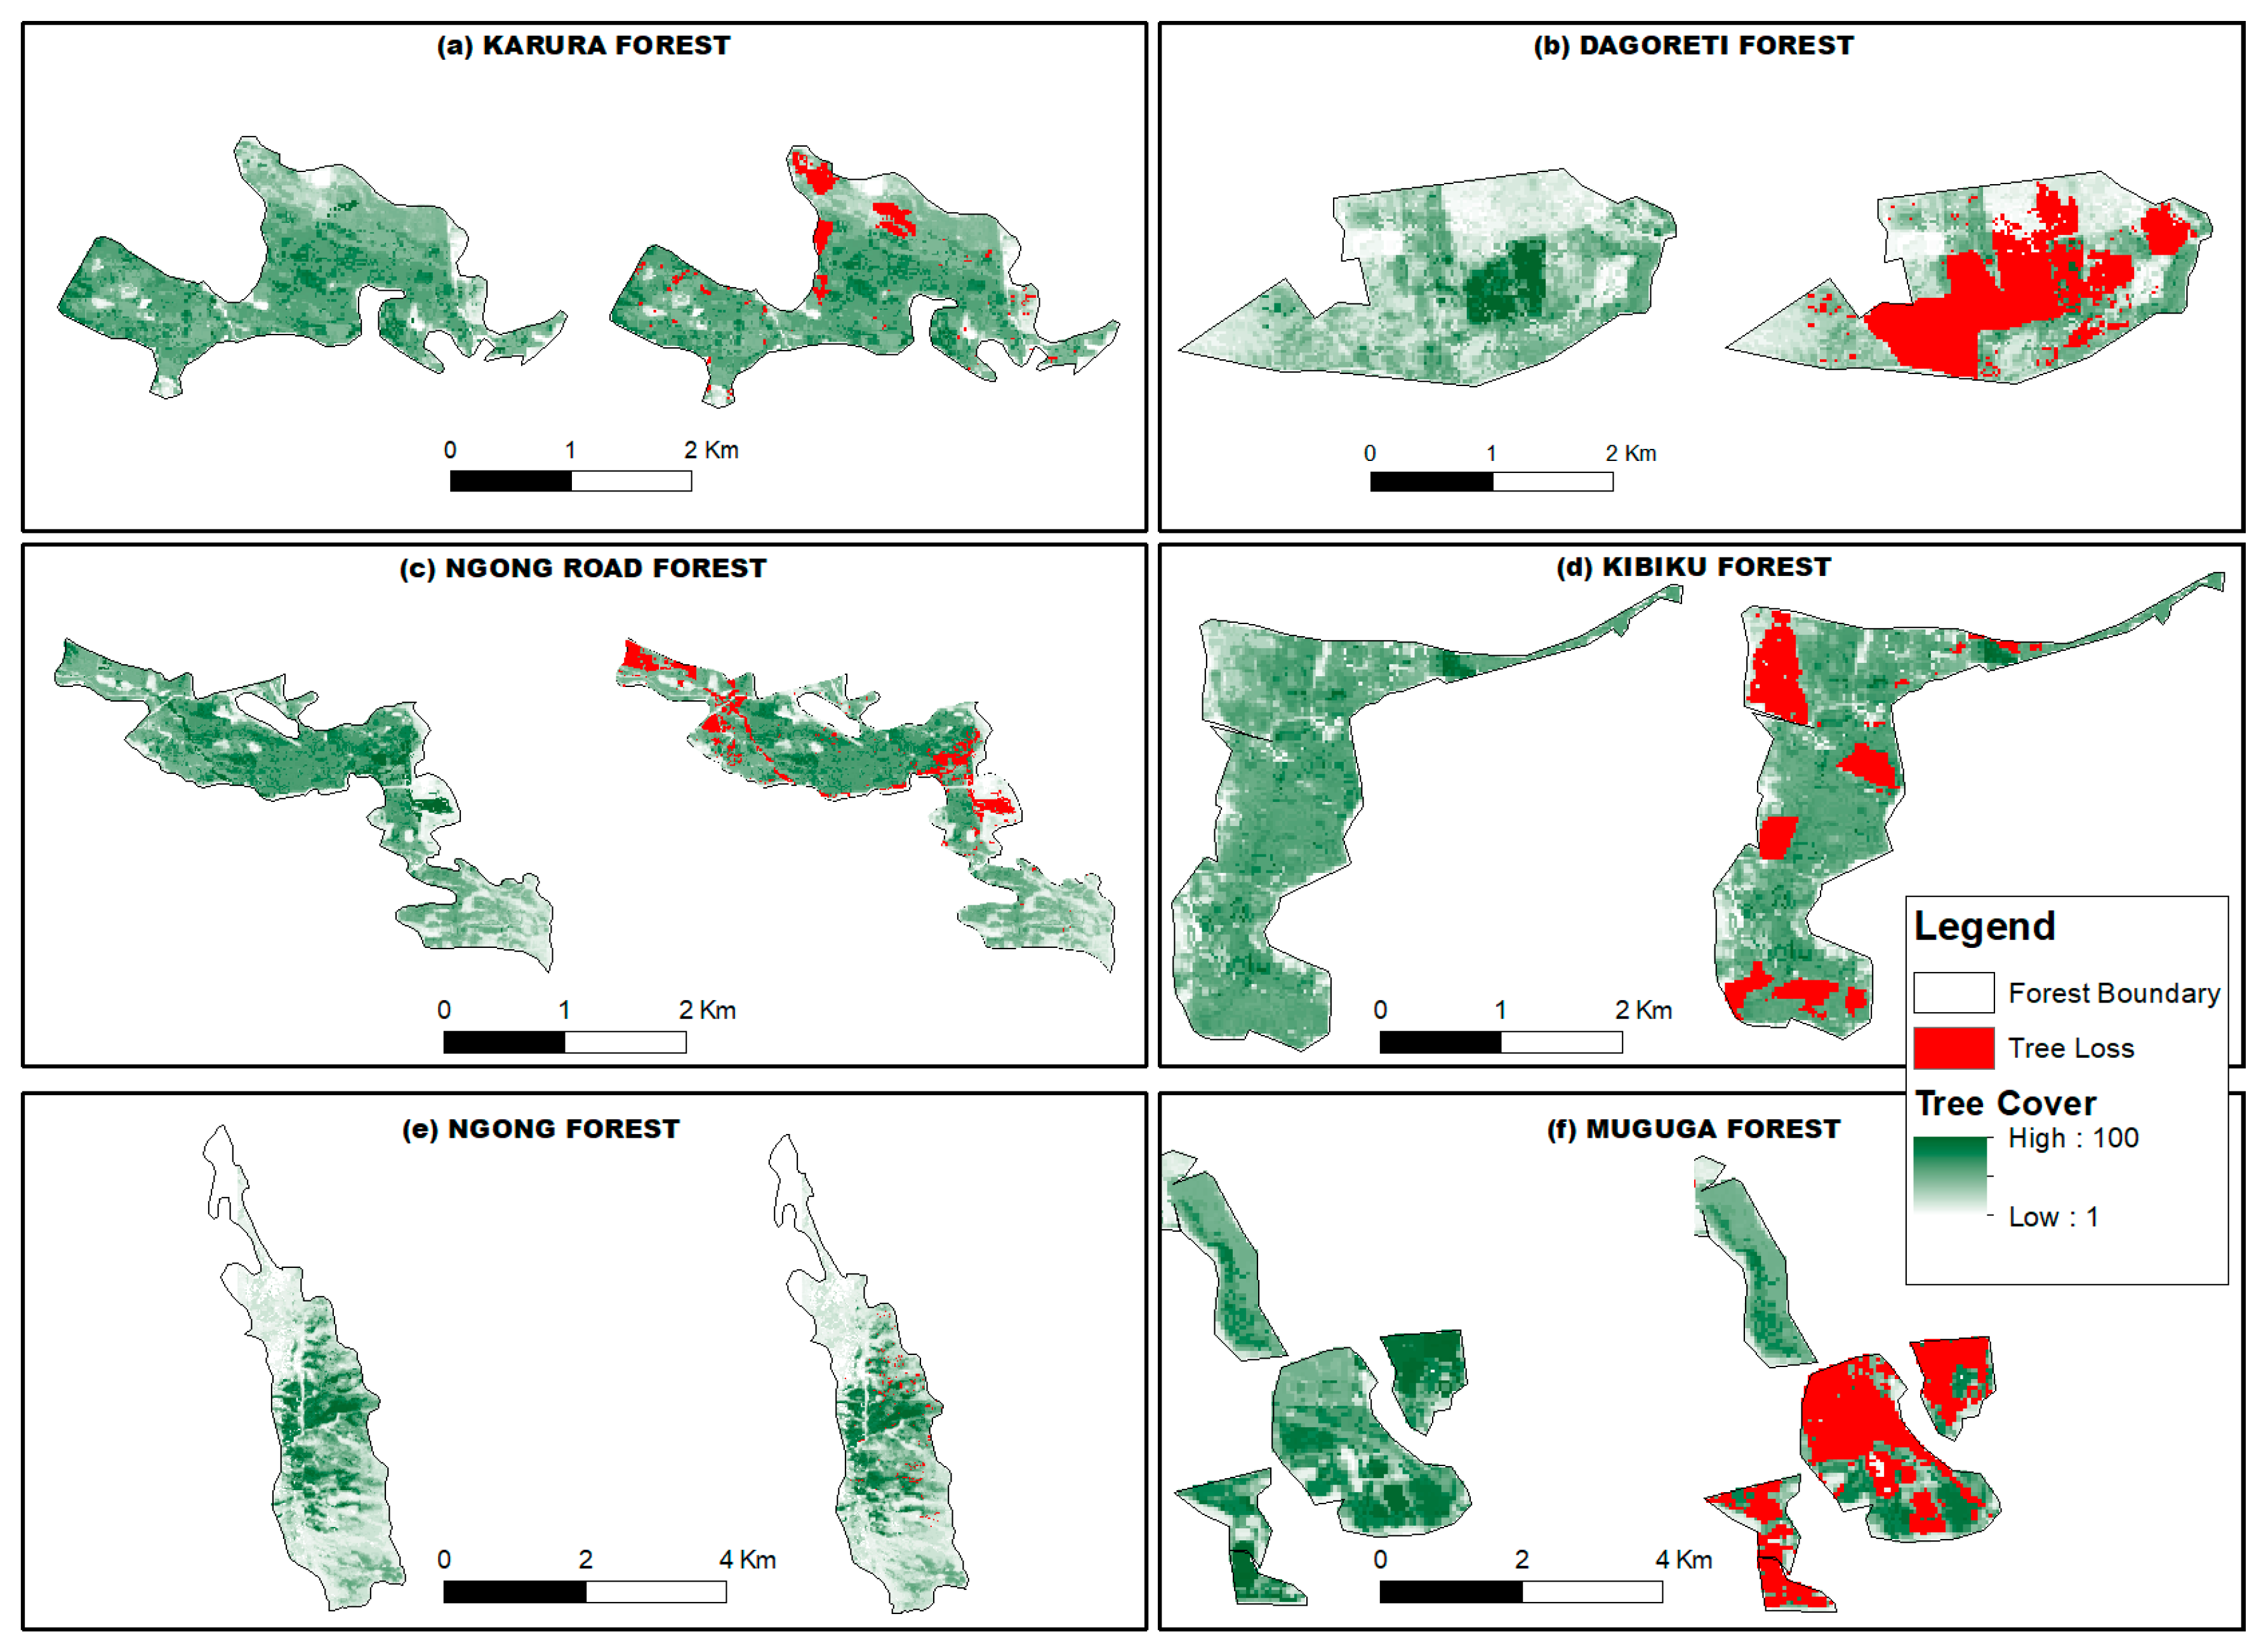
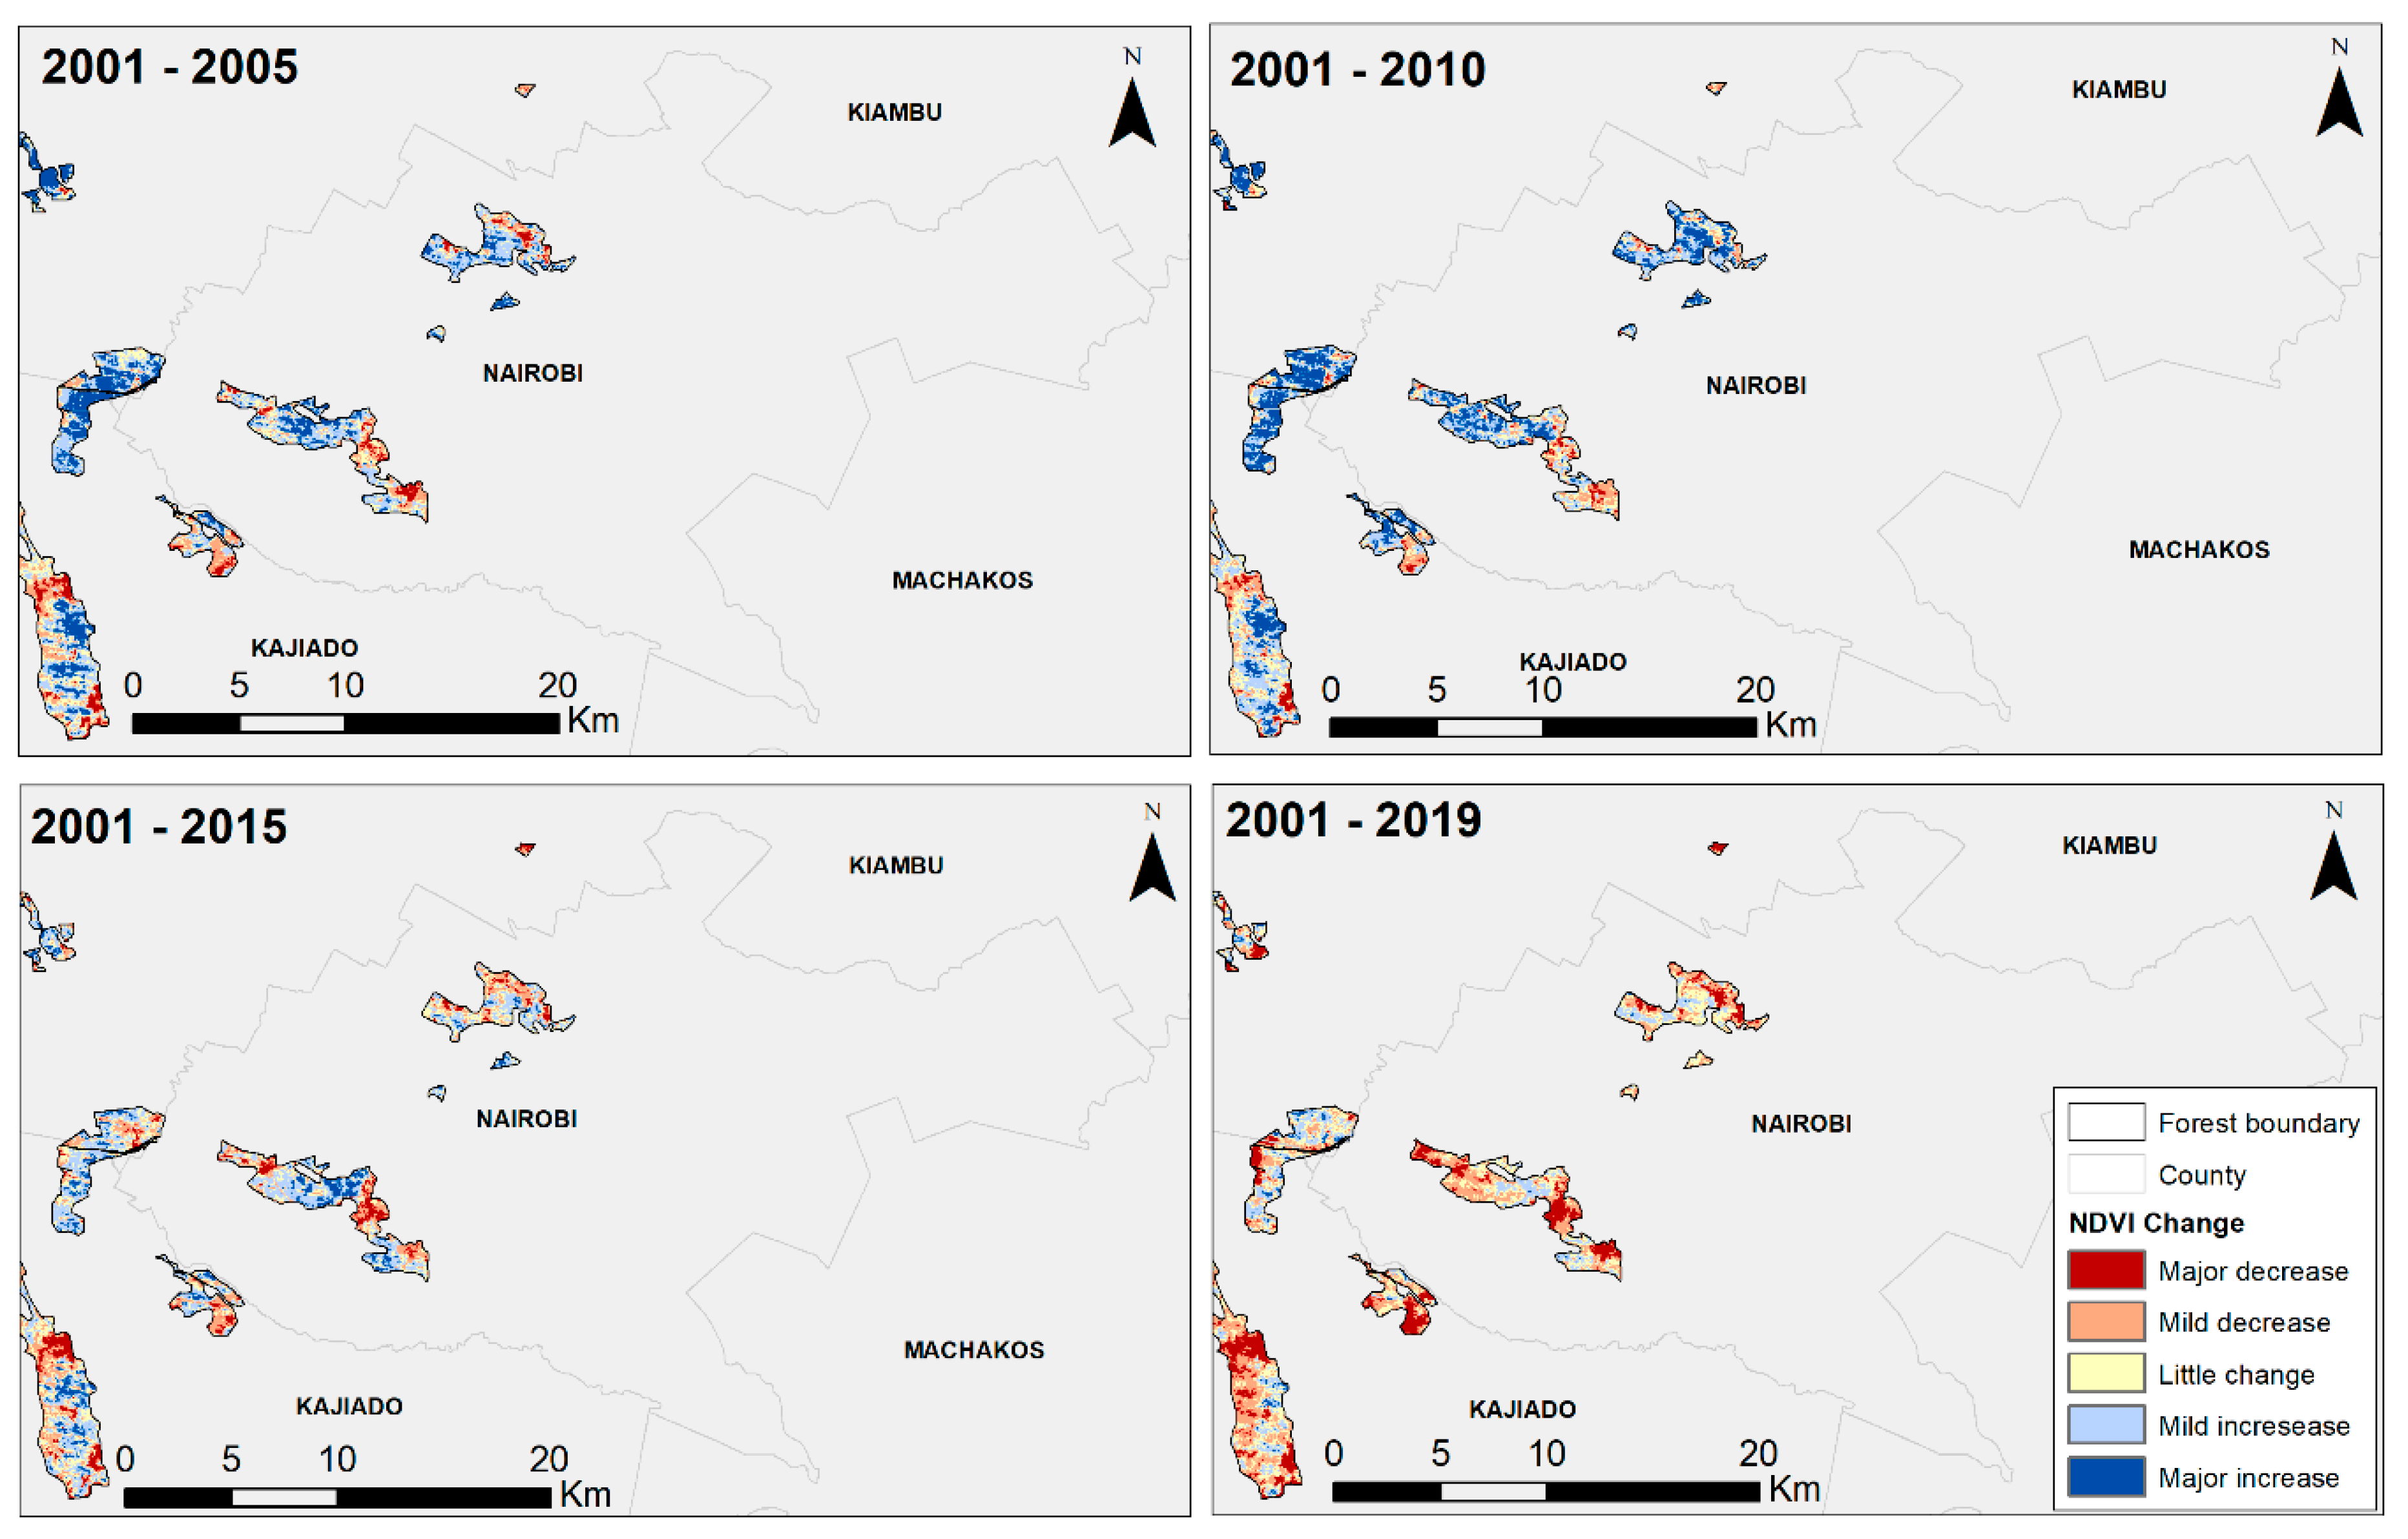
3.1. Urban Forest Cover Changes in Nairobi

Data from Global Forest Cover Change were used to map changes in tree cover in four epochs (in 2000, 2005, 2010, and 2015). The results showed a general reduction in tree cover in the study area (Figure 2). Even though areas with tree cover above 10% were predominantly in the western part of the study area in the four epochs, the intensity of tree cover areas appeared to be reducing from 2000 to 2015.
From the analysis of forest cover change, tree cover data between 2001 and 2019 indicated that there was a significant tree cover loss of about 130 ha in 2001 (Figure 3). In that year, major losses were recorded in the Ngong road forest with an approximate tree cover loss of 56.9 ha, the Dagoreti forest with a loss of 34.8 ha, and the Muguga forest at 27.7 ha. Other forests that also had significant losses in the same year were the Karura forest with a loss of about 7 ha and the Ngong forest with a loss of about 6.2 ha. After 2001, there were marginal losses between 2002 and 2010. Another significant period of loss was recorded between 2011 and 2019 with a peak in 2016 where an estimated 170 ha of tree cover was lost. In that year, major losses were recorded in Dagoreti, Ngong road, and Kibiku, respectively. Cumulatively, approximately 720.5 hectares of tree cover were lost in the urban forests around Nairobi between 2001 and 2019, approximately 11% of the baseline coverage of about 6620 ha in the year 2000.
In terms of the spatial distribution of tree cover loss, major losses were recorded in the Dagoreti, Kibiku, Muguga, Ngong road, and Ngong forests. Figure 4 represents maps of tree cover in 2000 overlaid with cumulative loss areas between 2000 and 2019. From the results, we observed that in locations where there were tree cover losses, the losses were not sporadic/random but were in contiguous patches, indicating a pattern of expansion of original loss areas.
Furthermore, we looked at the trend of changes in tree loss in the study area. Specifically, we plotted the annual tree loss areas for each forest and plotted a trend line to show the direction of the change in tree loss in each forest (Figure 5). In six sample forests, there was a positive trend of loss in the Dagoreti, Karura, Kibiku, Muguga, and Ngong road forests. In each of these forests, there were significantly higher losses after the year 2012. The positive trend of tree loss in these forests may be an indication of the ongoing degradation of the forests. In the Ngong forest, though losses were recorded in a majority of the years from 2001, the trend of tree loss in the forest was negative, which could either point to the reducing volumes of mature trees that can be harvested from the forest, or to the effectiveness of the forest management strategies that have been implemented to conserve the forest.

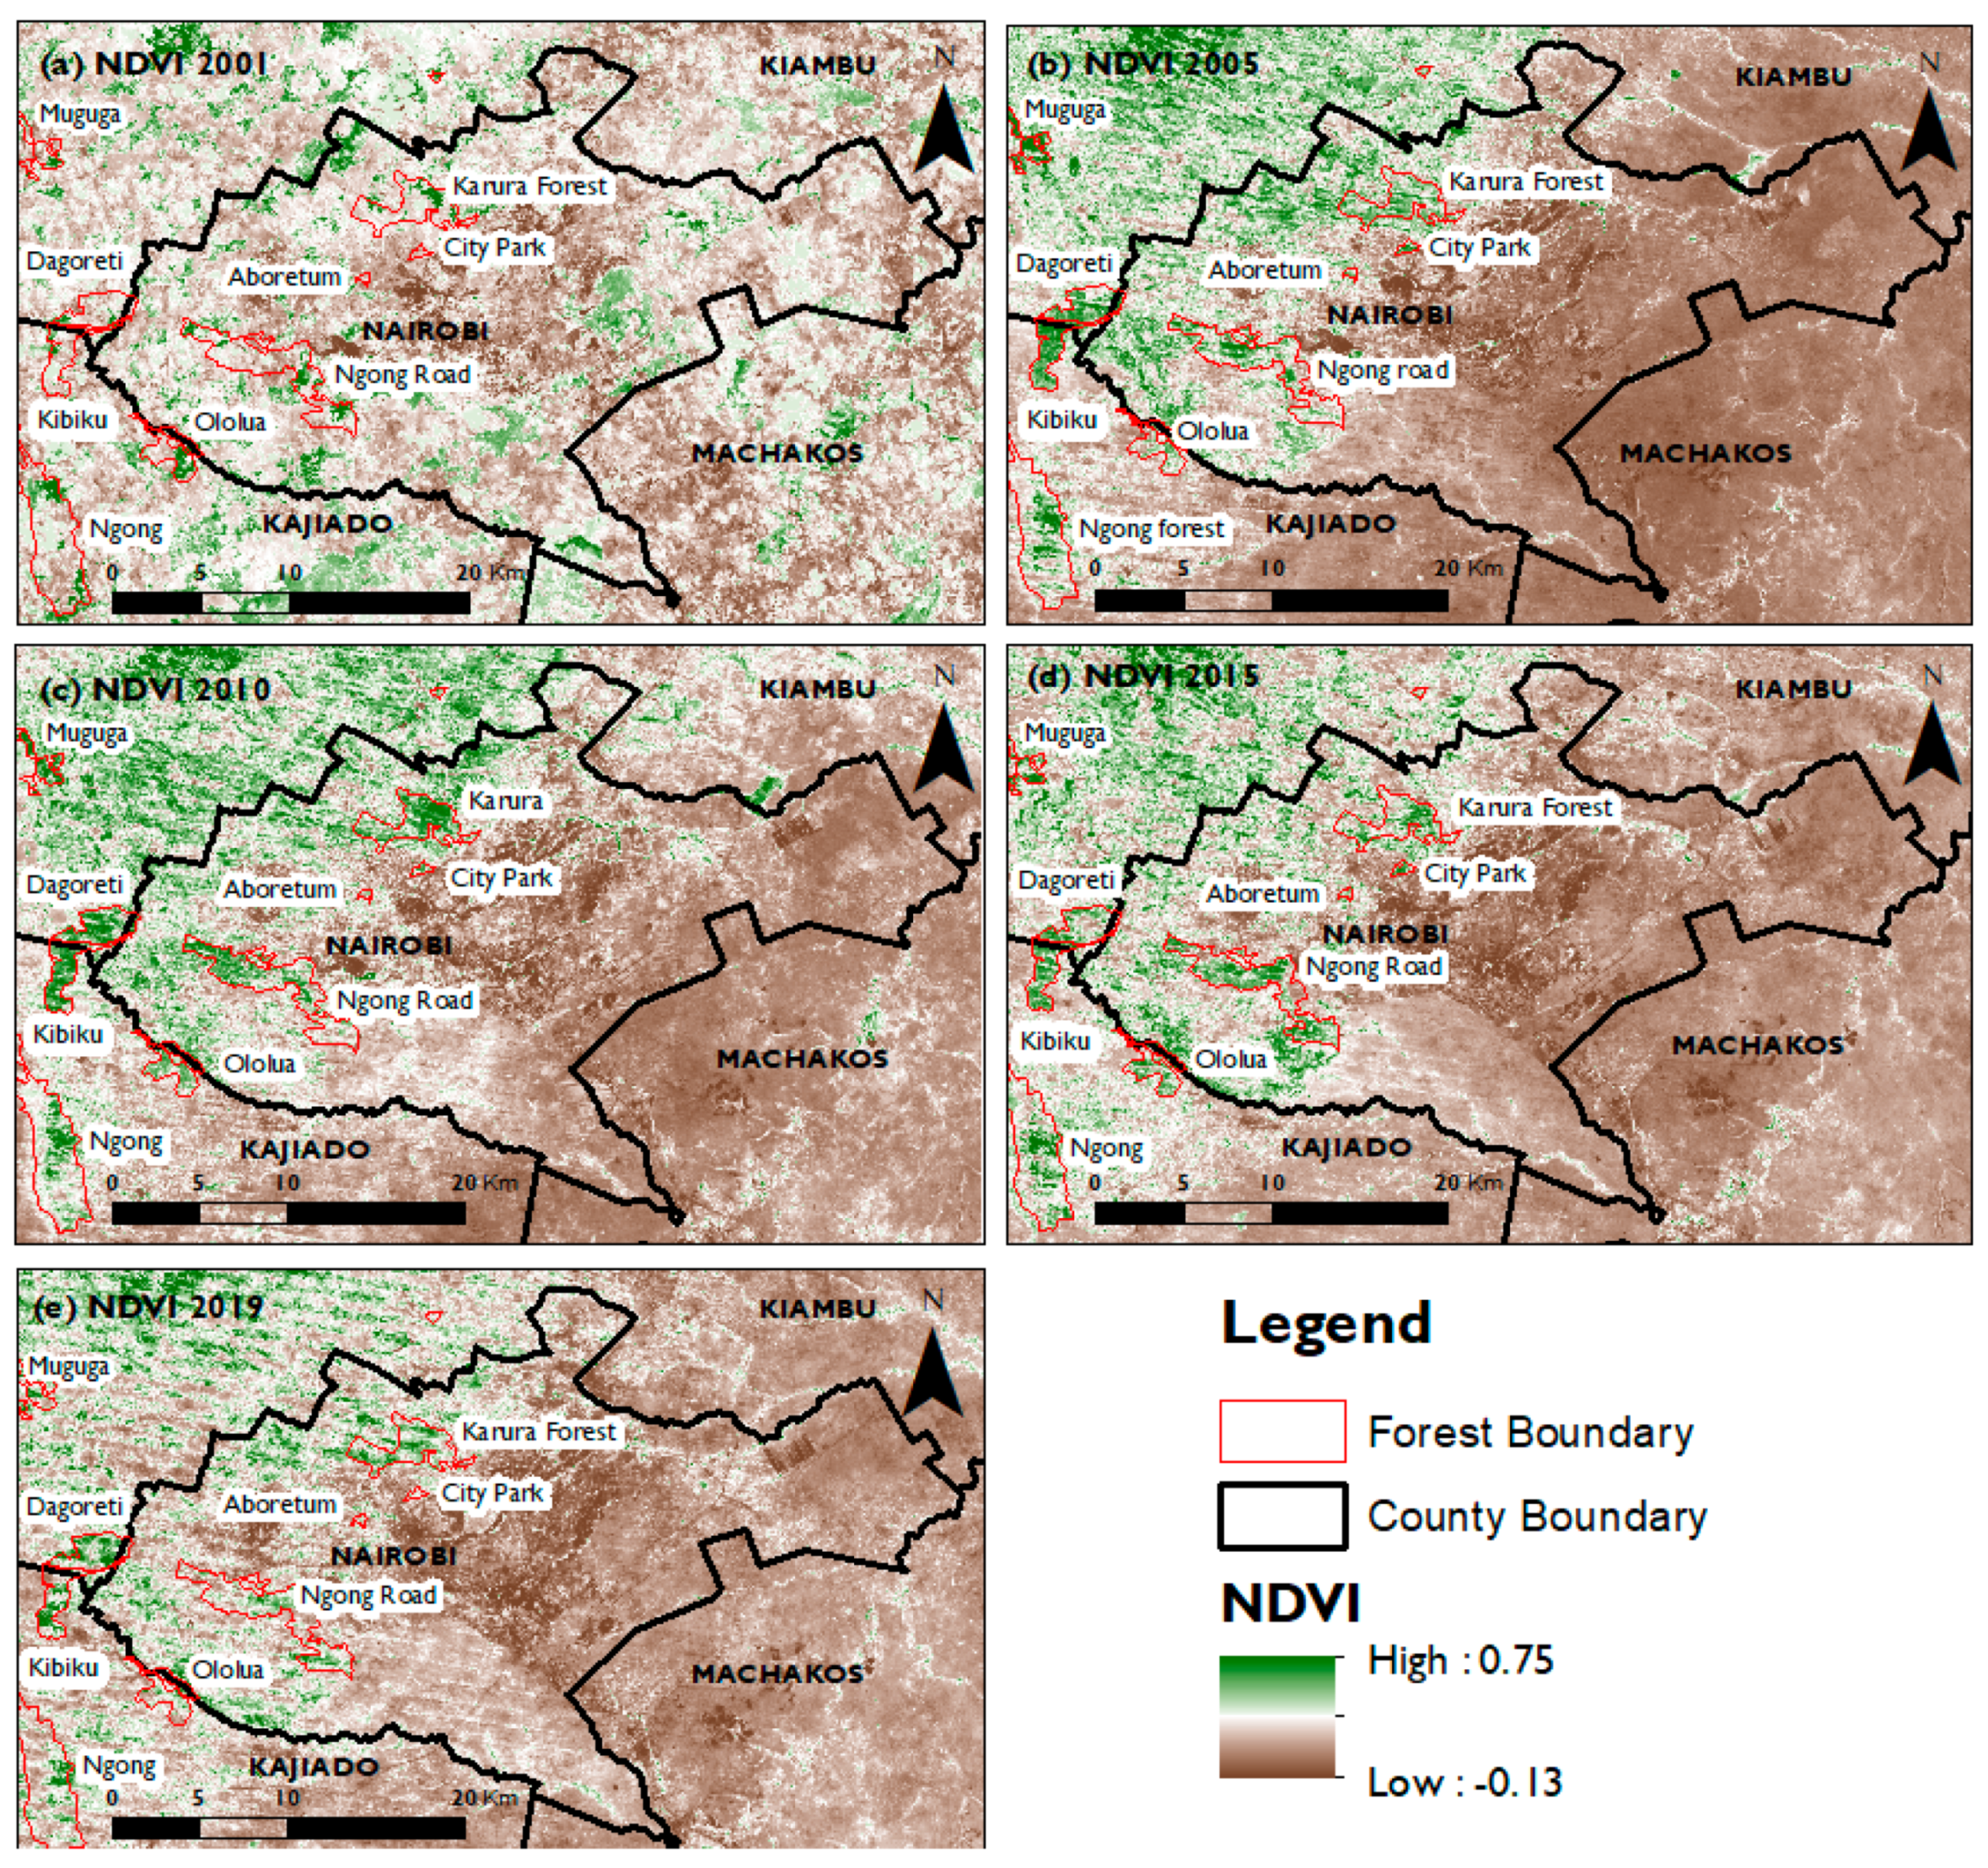
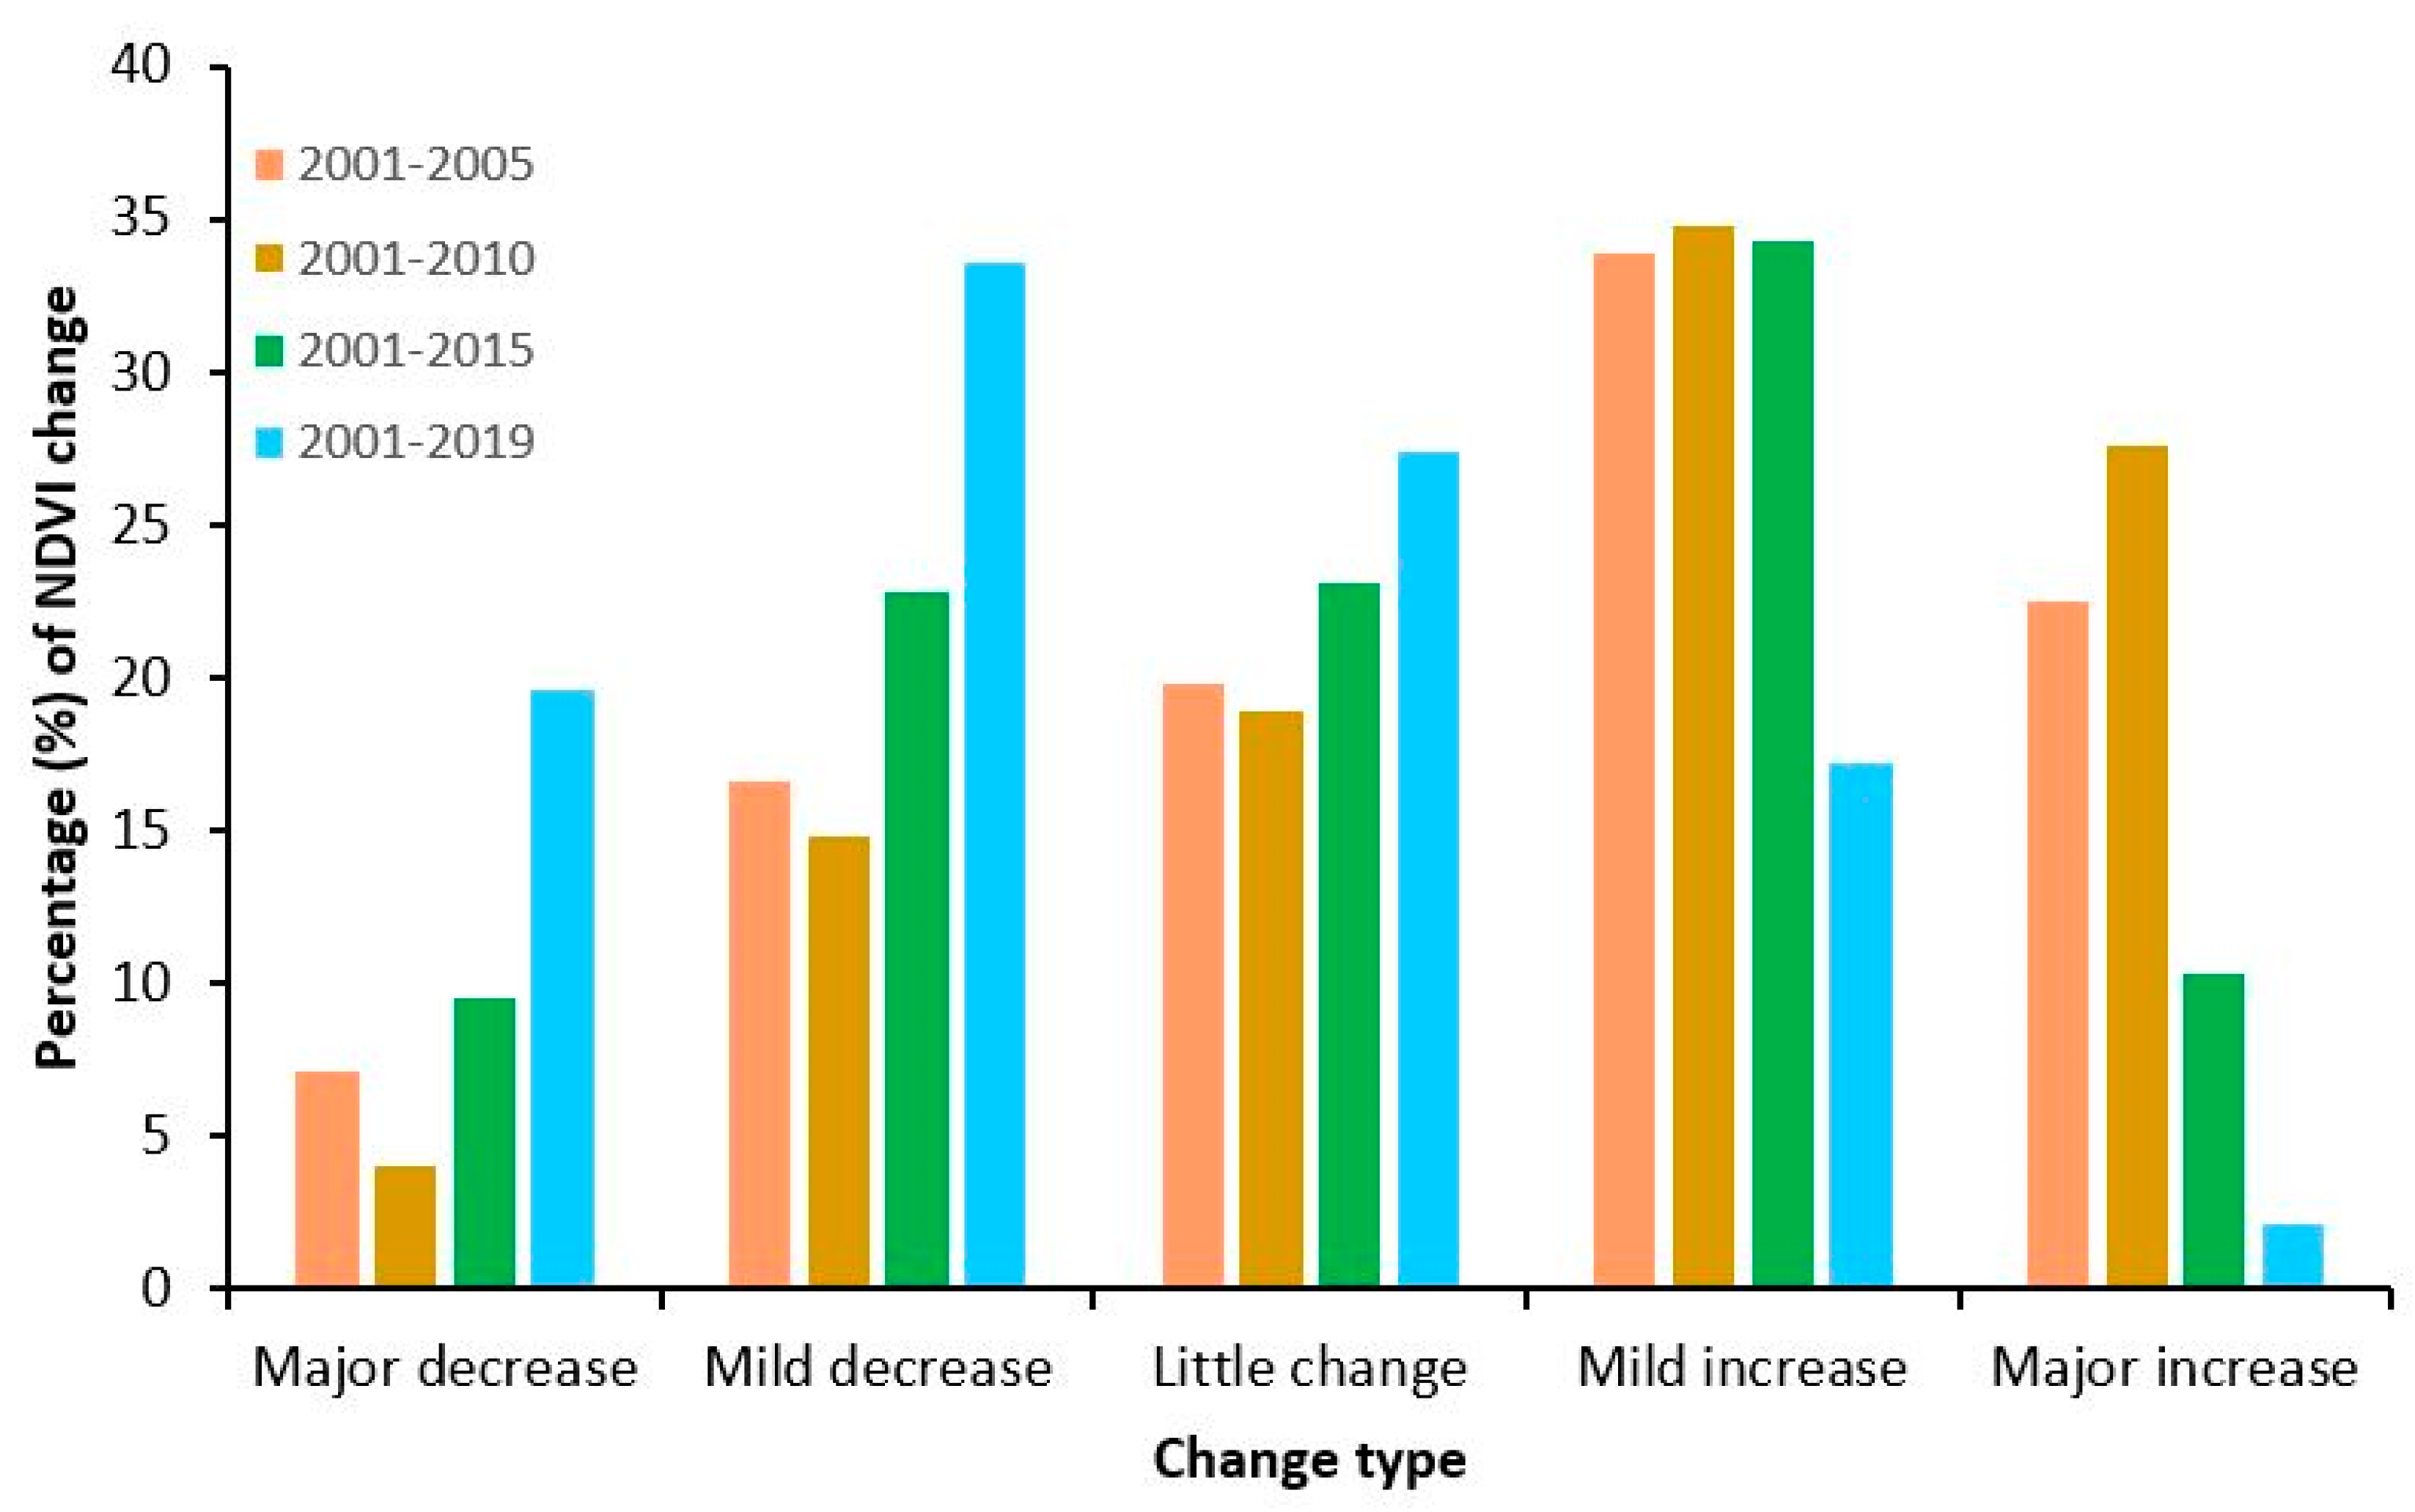
3.2. Changes in NDVI

Apart from assessing the patterns of tree loss, we used NDVI image data as a proxy for the deteriorating vegetation health in the forests. The maps in Figure 6 represent the spatial variation of mean NDVI in the study area in 2001, 2005, 2010, 2015, and 2019. We observed that in 2001, green patches which represented areas of higher NDVI values were well spread across the study area. This situation changed in 2005, with the areas characterized as having high NDVI values being mainly in the western parts of the country. We also noted relatively higher values of NDVI in the forested areas. The same trend appeared to be maintained in 2010. Thereafter, a decline seemed to appear in the values of NDVI, particularly in the 2019 map.
Furthermore, we looked at the trend of annual NDVI values for each forest from 2001 to 2019. In Figure 7, we observed that in each of the nine forests, there was a negative trend in the annual NDVI values. This could be indicative of the ongoing degradation or stress on the vegetation of the urban forest.
In order to identify the spatial and temporal patterns of changes of NDVI in the sample forests, we mapped various classes of NDVI change (Figure 8). Specifically, the maps were derived from NDVI differences between 2005 and 2001, 2010 and 2001, 2015 and 2001, and finally between 2019 and 2001. We observed that the areas of major and minor NDVI decrease progressively became dominant as shown in the 2001–2019 map. In particular, we observed that changes in NDVI were not just random within the forest but showed spatial patterns with the areas of major and minor decrease commonly being on the edges of the forest. This is an indication that the stressors of the forests emanate from external boundaries of the forests.
By tabulating NDVI change areas (Table 2), we observed that forest areas that exhibited major decrease in NDVI values increased from 7.1% of the forest areas in the 2001–2005 period to 19.6% of the forest areas in the period between 2001 and 2019. Similarly, areas of mild NDVI decrease grew from 16.6% of the forests areas in the period 2001–2005 to 33.6% of the forest areas in 2001 to 2019, representing a twofold increase in the mild NDVI increase areas. Forest areas exhibiting a mild increase in NDVI values in the period between 2001 and 2005 shrank to 17.2% of the forest areas in the period between 2001 and 2019. Similarly, the forest areas exhibiting a major increase in NDVI values between 2001 and 2005 shrank tenfold to only 2.1% of the forest areas in the 2001–2019 comparison.
Using the values from Table 2, we plotted the areas of changes from NDVI classes for the different epochal differences. Figure 9 shows the forest areas exhibiting major NDVI decrease growing rapidly from the 2001–2005 period to the 2001–2019 period. A similar pattern can be observed in the mild NDVI change areas. Conversely, the mild NDVI increase remained stable in the first three epochs and plummeted in the last comparison period of 2001–2009. For the major NDVI increase areas, the forest areas in this category firstly increased in the first two epochs before reducing significantly in the years 2001 to 2015 and 2001 to 2019 comparison periods.

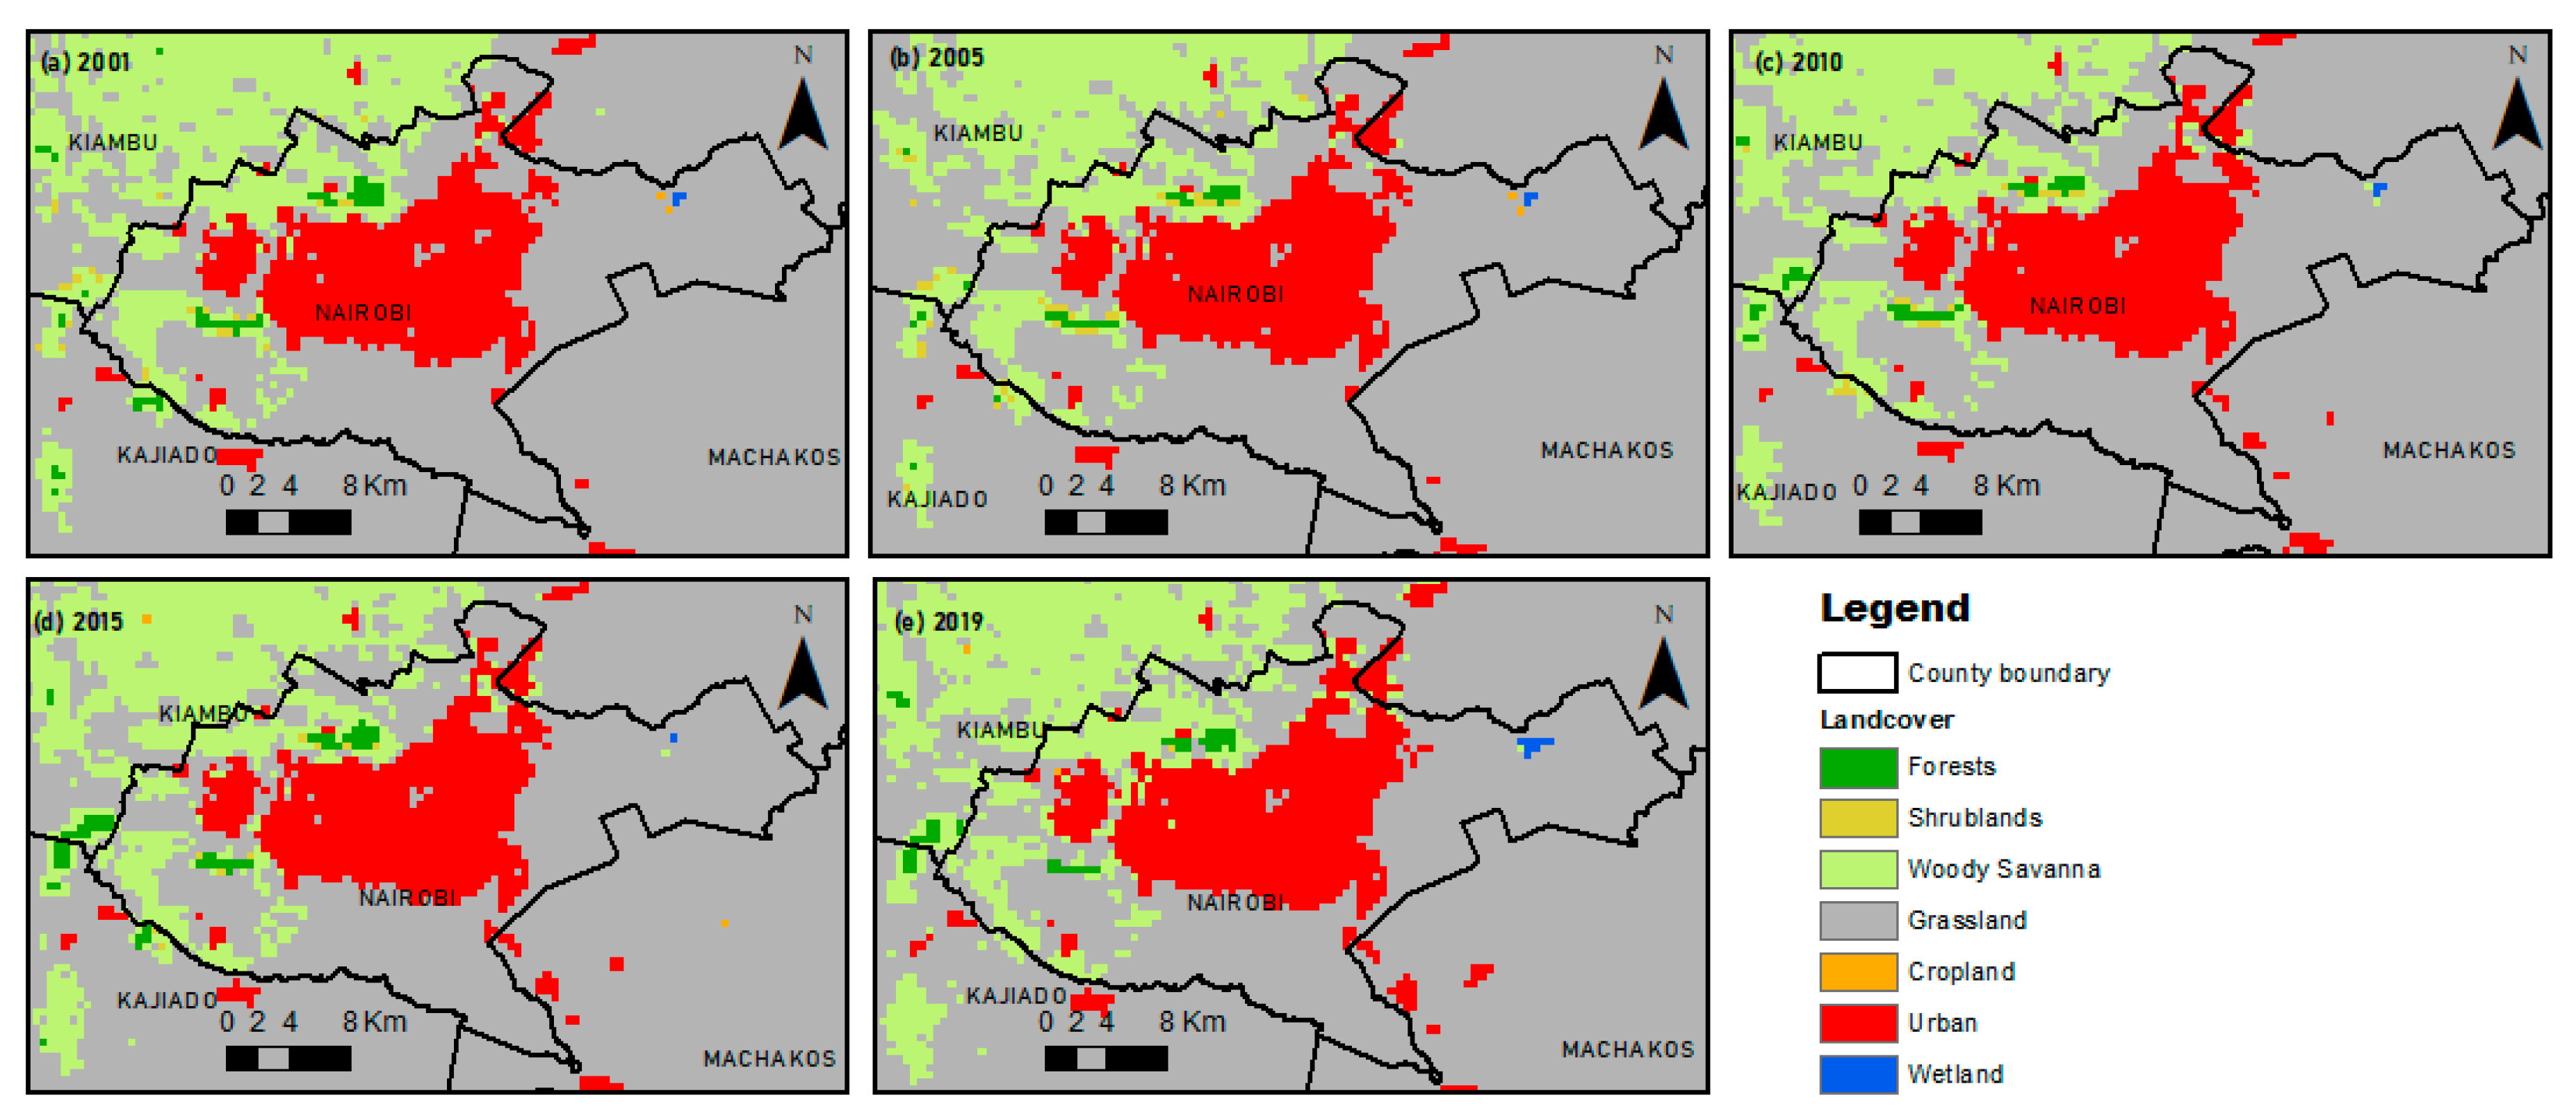
3.3. Land Cover Changes

In this study, we considered forests, shrub lands, woody savannah, grasslands, cropland, urban, and wetlands as the main categories of evaluation. We chose MODIS Land Cover data as it provided annual classifications from a uniform classification scheme. The results in Figure 9 show the variation in land cover classes in five epochs (in 2001, 2005, 2010, 2015, and 2019). Because of the course resolution of the data, we were only able to observe marginal expansion of the urban areas into the grassland, woody savannah, and forest areas between 2001 and 2019 (Figure 10).

3.4. Preliminary Assessment of the Potential Link between Tree Cover Loss and Human Activities

As a preliminary assessment of the potential drivers of the changes in urban forests, we used high-resolution satellite imagery to visually check the current land use practices and human activities in forest patches that had been recorded as the loss areas. Figure 11 is a map showing the tree loss areas and the snippets from satellite imagery on the potential activity. Figure 11a,b,d show sample areas of forests which appeared to have been cleared and are lately being used for cultivation. Figure 11c,e,f show areas of forests or near the forest where residential areas have been built in locations that were initially classified as forests. Satellite images of the sample points, though not conclusive, indicated that human activities, including farming and construction of residential areas and other supportive infrastructure, may have been the main drivers of the forest loss.

4. Discussion

This study aimed to assess the trend of changes in urban forests within the Nairobi metropolitan area in Kenya. Specifically, we aimed to use satellite-derived data sets including tree cover, tree loss, and land cover to quantify the forest dynamics and to highlight the major drivers that may be contributing to the changes in urban forests in the study area.

4.1. The Trend of Tree Cover Loss within Urban Forests in Nairobi Metropolitan Areas

From the analysis of the tree cover data, the total area of tree cover within the gazette forests as of the year 2000, was approximately 6621 ha. In the period between 2000 and 2019, the cumulative tree cover loss in the gazette forests within the study area was approximately 720 ha or about 11% of the baseline forest areas. This represents an annual loss of about 0.58% of the urban forest, a rate that is marginally higher than the reported overall forest cover loss in Kenya at 0.32%. This may be indicative of the heightened pressure on urban forests. Of the four forests within Nairobi city boundaries, that is, the Arboretum, City Park, Karura, and Ngong road forests, the cumulative loss area was approximately 216.4 ha, out of the total cover of approximately 2972 ha as at the year 2000. This is about 8% of forest cover in Nairobi city between 2000 and 2019. This reported figure is in agreement with a loss of about 7% that was reported for the loss in Nairobi forests between 2000 and 2018 [15].
In terms of the annual losses, the highest loss of about 170 ha, or 23.6% of the cumulative loss was recorded in the year 2016, with the main losses emanating from the Dagoreti (79.7 ha), Ngong road (38.5 ha), and Kibiku (37.8 ha) forests, respectively. The overall rise in forest loss between 2011 to a peak in 2016 may be explained by the heightened urbanization and large infrastructure projects that were under implementation in the same period [16]. In terms of the forests, the Dagoreti forest was the worst affected forest, losing approximately 233 ha in the period between 2000 to 2019, followed by the Ngong road forest at 155 ha, the Muguga forest losing approximately 126 ha, the Kibiku forest losing 99 ha, and the Karura forest losing about 60 ha over the same period. On the lower end, the Ngong forest lost about 24 ha, the Ololua forest lost about 21 ha, and the Arboretum and City Park forests lost less than 1 ha each in the period between 2000 and 2019. The differences in the severity of tree cover loss could also be explained by the different management regimes for each forest.
Apart from the tree cover loss, we also assessed the potential changes in annual NDVI values for each forest. The focus on NDVI changes was to highlight the potential changes in the photosynthetic health of the forests. The results of NDVI change detection between different epochs in 2001, 2005, 2010, 2015, and 2019 showed that the areas of a major decrease in NDVI, that is, areas that showed a decrease of more than 0.2 NDVI units between epochs, increased from 7.1% in for the difference between 2001 and 2005 epochs to 19.6% in the 2001 to 2019 epochs. Similarly, the areas with mild NDVI decrease (between 0.05 to 0.2 NDVI units decrease) increased from 16.6% for the year 2001 to 2015 of the total forest area to about 33.6% for the 2001 to 2019 epochs. Similarly, there was a negative trend in the annual mean NDVI for each of the sample forests, indicating a potential reduction in the photosynthetic vitality of urban forests in the study area. Other studies have reported similar trends in reducing NDVI in urban forests [17].

4.2. Potential Drivers of Forest Cover Change

To understand the potential drivers to forest cover change, we used both the land cover data and visual interpretation of high-resolution satellite imagery. The land cover data, though at a coarse resolution, showed an increase in the urban areas and a marginal decrease in the forested areas. From a preliminary visual inspection of the sample loss areas, we observed that the areas recording dominant tree cover losses had in many cases been converted from forests to residential areas, farmlands, roads, or were being used for extracting raw materials to support ongoing infrastructural projects, thus confirming that human activities were indeed the main drivers of the forest cover loss.

4.3. Management of Urban Forests

Satellite-derived data allowed us to assess the spatial and temporal changes in the urban forests from 2000 to 2018. High-resolution data (30 m spatial resolution and annual time scales) made it possible to both have a global picture of the tree cover loss at the area of study level and also an appreciation of the local differences in each forest. Our results showed that it is possible to use tree cover data and NDVI to assess and understand the changing dynamics in forests. In terms of the management of urban forests in Kenya, we observed that it is not enough to merely gazette the forests; it is more important to monitor the status of the forests using existing satellite-derived data. Incorporating local community associations in the management of urban forests may contribute to their sustainable conservation.

4.4. Limitations of the Study and Potential Future Research Directions

Though the results of this analysis are promising, we noted two major limitations in this work. First, although we had access to high-resolution tree cover and NDVI data, the land cover data was not of comparable spatial resolution, thus limiting a comprehensive analysis of the link between tree cover change and land cover change dynamics. Future studies could potentially benefit from high-resolution data, particularly those that could be captured by unmanned aerial vehicles (UAVs). Second, this study entirely relied on the available satellite-derived data, where, alternatively, an understanding of the processes that drive or mitigate tree cover loss would require an appreciation of the views of local communities that exploit conservation of these forests. Similarly, a deeper analysis of the management options for the various forests would have shed light on the influence of urban forest management on their sustainability.

5. Conclusions

This study aimed to use satellite-derived data to assess the changes in the urban forests in the Nairobi metropolitan area. From this analysis, the urban forests in the area are shrinking at an alarming rate. The negative trend of change in NDVI suggests that the health of the vegetation in the forests is deteriorating. This, if unchecked, will have dire effects on the urban biodiversity and on the quality of life and livelihoods of urban residents who enjoy ecosystem services from the forests. Future studies could focus on understanding the specific influence of anthropogenic activities on the sustainability of urban forests in Nairobi. Similarly, further research should be carried out to determine appropriate sustainable management strategies and policies for urban forests in Kenya in the face of ongoing urbanization and the rapid rise of urban populations.

Author Contributions

Conceptualization, F.O.; methodology, F.O. and G.M.; data analysis and visualization, F.O. and G.M.; writing—original draft preparation, F.O. and G.M.; writing—review and editing, C.J. All authors have read and agreed to the published version of the manuscript.

Institutional Review Board Statement

No humans were interviewed or tested in this study. Institutional Review Board Statement on the same was therefore not required.

Informed Consent Statement

No humans were interviewed or tested in this study. Institutional Review Board Statement on the same was therefore not required.

Data Availability Statement

All data in this study were from open and free sources as outlined in Table 1.

Conflicts of Interest

The authors declare no conflict of interest.

References

  1. Tyrväinen, L.; Pauleit, S.; Seeland, K.; de Vries, S. Benefits and uses of urban forests and trees. Urban For. Trees A Ref. B 2005, 81–114. [Google Scholar] [CrossRef]
  2. Livesley, S.J.; Escobedo, F.J.; Morgenroth, J. The biodiversity of urban and peri-urban forests and the diverse ecosystem services they provide as socio-ecological systems. Forests 2016, 7, 291. [Google Scholar] [CrossRef]
  3. Borelli, S.; Conigliaro, M.; Pineda, F. Urban forests in the global context. Unasylva 2018, 69, 3–10. [Google Scholar]
  4. Michel, J.P. Urbanization and Ageing Health Outcomes. J. Nutr. Health Aging 2020, 24, 463–465. [Google Scholar] [CrossRef] [PubMed]
  5. German, L.; Jaeger, D.; Mcclain, K.M.; Nascimento, J.R.; Schoneveld, G.; Stadt, J.J. 13 Extra-Sectoral Drivers of Forest Change. Development 2005, 1, 235–246. [Google Scholar]
  6. Ministry of Environment and Forestry. REPUBLIC OF KENYA MINISTRY OF ENVIRONMENT AND FORESTRY Taskforce Report on Forest Resources Management and Logging Activities in Kenya. April 2018. Available online: http://www.environment.go.ke/wp-content/uploads/2018/08/Forest-Report.pdf (accessed on 21 August 2020).
  7. Kimutai, D.K.; Watanabe, T. Forest-cover change and participatory forest management of the lembus forest, Kenya. Environments 2016, 3, 20. [Google Scholar] [CrossRef]
  8. Li, X.; Chen, W.Y.; Sanesi, G.; Lafortezza, R. Remote sensing in urban forestry: Recent applications and future directions. Remote Sens. 2019, 11, 1144. [Google Scholar] [CrossRef]
  9. Sidhu, N.; Pebesma, E.; Câmara, G. Using Google Earth Engine to detect land cover change: Singapore as a use case. Eur. J. Remote Sens. 2018, 51, 486–500. [Google Scholar] [CrossRef]
  10. Hansen, M.C. High-Resolution Global Maps of 21st Century Global Forest Cover Maps. Science 2013, 342, 850–854. [Google Scholar] [CrossRef] [PubMed]
  11. Sexton, J.O.; Song, X.P.; Feng, M.; Noojipady, P.; Anand, A.; Huang, C.; Kim, D.H.; Collins, K.M.; Channan, S.; DiMiceli, C.; et al. Global, 30-m resolution continuous fields of tree cover: Landsat-based rescaling of MODIS vegetation continuous fields with lidar-based estimates of error. Int. J. Digit. Earth 2013, 6, 427–448. [Google Scholar] [CrossRef]
  12. De Schutter, A.; Kervyn, M.; Canters, F.; Bosshard-Stadlin, S.A.; Songo, M.A.M.; Mattsson, H.B. Ash fall impact on vegetation: A remote sensing approach of the Oldoinyo Lengai 2007-08 eruption. J. Appl. Volcanol. 2015, 4. [Google Scholar] [CrossRef]
  13. Jeyaseelan, A.T.; Roy, P.S.; Young, S.S. Persistent changes in NDVI between 1982 and 2003 over India using AVHRR GIMMS (Global Inventory Modeling and Mapping Studies) data. Int. J. Remote Sens. 2007, 28, 4927–4946. [Google Scholar] [CrossRef]
  14. Solomon, N.; Hishe, H.; Annang, T.; Pabi, O.; Asante, I.K.; Birhane, E. Forest cover change, key drivers and community perception in Wujig Mahgo Waren forest of northern Ethiopia. Land 2018, 7, 32. [Google Scholar] [CrossRef]
  15. Mongabay. Deforestation Statistics for Kenya. Deforestation Statistics of Kenya. Available online: http://rainforests.mongabay.com (accessed on 21 August 2020).
  16. Kenya Atlas. Nairobi and Its Environment. In A Burgeoning City; United Nations Environment Programme (UNEP): Nairobi, Kenya, 2007; Chapter 5; pp. 145–160. [Google Scholar]
  17. Ren, Z.; Pu, R.; Zheng, H.; Zhang, D.; He, X. Spatiotemporal analyses of urban vegetation structural attributes using multitemporal Landsat TM data and field measurements. Ann. For. Sci. 2017, 74. [Google Scholar] [CrossRef]
Figure 1. Map of the area of study showing Nairobi and the neighboring counties of Kiambu, Kajiado, and Machakos.
Environsciproc 03 00078 g001
Figure 2. Tree cover scenarios in (a) 2000, (b) 2005, (c) 2010 and (d) 2015.
Environsciproc 03 00078 g002
Figure 3. Annual tree cover loss (in hectares) by forest.
Environsciproc 03 00078 g003
Figure 4. Tree cover in 2000 and cumulative tree cover loss between 2000 and 2019 in selected forests.
Environsciproc 03 00078 g004
Figure 5. Trends of tree cover loss for selected forests.
Environsciproc 03 00078 g005
Figure 6. Maps of mean normalized difference vegetation index (NDVI) in (a) 2001, (b) 2005, (c) 2010, (d) 2015, and (e) 2019.
Environsciproc 03 00078 g006
Figure 7. Trends of changes in NDVI for each sample forest from 2001 to 2019.
Environsciproc 03 00078 g007
Figure 8. Changes in NDVI for each forest for the 2001–2005, 2001–2010, 2001–2015, and 2001–2019 epochs.
Environsciproc 03 00078 g008
Figure 9. Changes of forest areas by NDVI change dynamics for the four different comparison periods of 2001–2005, 2001–2010, 2001–2015, and 2001–2019.
Environsciproc 03 00078 g009
Figure 10. Changes in land cover between 2001 and 2019.
Environsciproc 03 00078 g010
Figure 11. Tree cover loss and satellite imagery for tree cover loss areas (snapshots a-f are the aerial photographs showing human activities at locations which were experiencing tree cover loss).
Environsciproc 03 00078 g011
Table 1. Data, data sources, period, and spatial resolution.
ThemeData TypeResolutionTimeSource
Landsat 7 Collection 1 Tier 1 8-Day NDVI CompositeRaster/Imagery30 m2000–2019United States Geological Survey hosted in Google Earth Engine
Hansen Global Forest Change v1.7 (2000–2019)Raster/Imagery30 m2001–2019Hansen hosted on Google Earth Engine
Global Forest Cover Change (GFCC) Tree Cover Multi-Year Global 30 mRaster/Imagery30 m2000–2019NASA Land Processes Distributed Active Archive Center (LP DAAC) at USGS EROS Center
MODIS Land Cover Type Yearly Global 500 mRaster/Imagery500 m2001–2019NASA Land Processes Distributed Active Archive Center (LP DAAC) at USGS EROS Center
Kenya Counties ShapefileShapefiles 2015Open Africa https://africaopendata.org/dataset/kenya-counties-shapefile
Protected Areas in KenyaShapefile 2007Adapted from World Resource Institute https://datasets.wri.org/dataset/protected-areas-in-kenya
World Imagery (Clarity)Imagery 2017Adopted from ArcMap 10.3 Desktop version
Table 2. Changes in NDVI between 2001–2005, 2001–2010, 2001–2015, and 2001–2019 periods.
NDVI Change2001–20052001–20102001–20152001–2019
Pixels% PercentagePixels% PercentagePixels% PercentagePixels% Percentage
Major decrease54117.13075472039.514,88619.6
Mild decrease12,64316.611,22914.817,36322.825,57633.6
Little change15,05719.814,35918.917,55723.120,85627.4
Mild increase25,81233.926,44234.826,09534.313,12017.2
Major increase17,14322.520,96127.6784810.316282.1
Total76,06610076,06610076,06610076,066100
Publisher’s Note: MDPI stays neutral with regard to jurisdictional claims in published maps and institutional affiliations.

