
Estimating the Air Pollution Intake Dose in Three Port Cities in Europe with the Use of Ambient Fine Particulate Matter Measurements from Low-Cost Sensors †

 ,
,  ,
,  and
and
Abstract
:1. Introduction
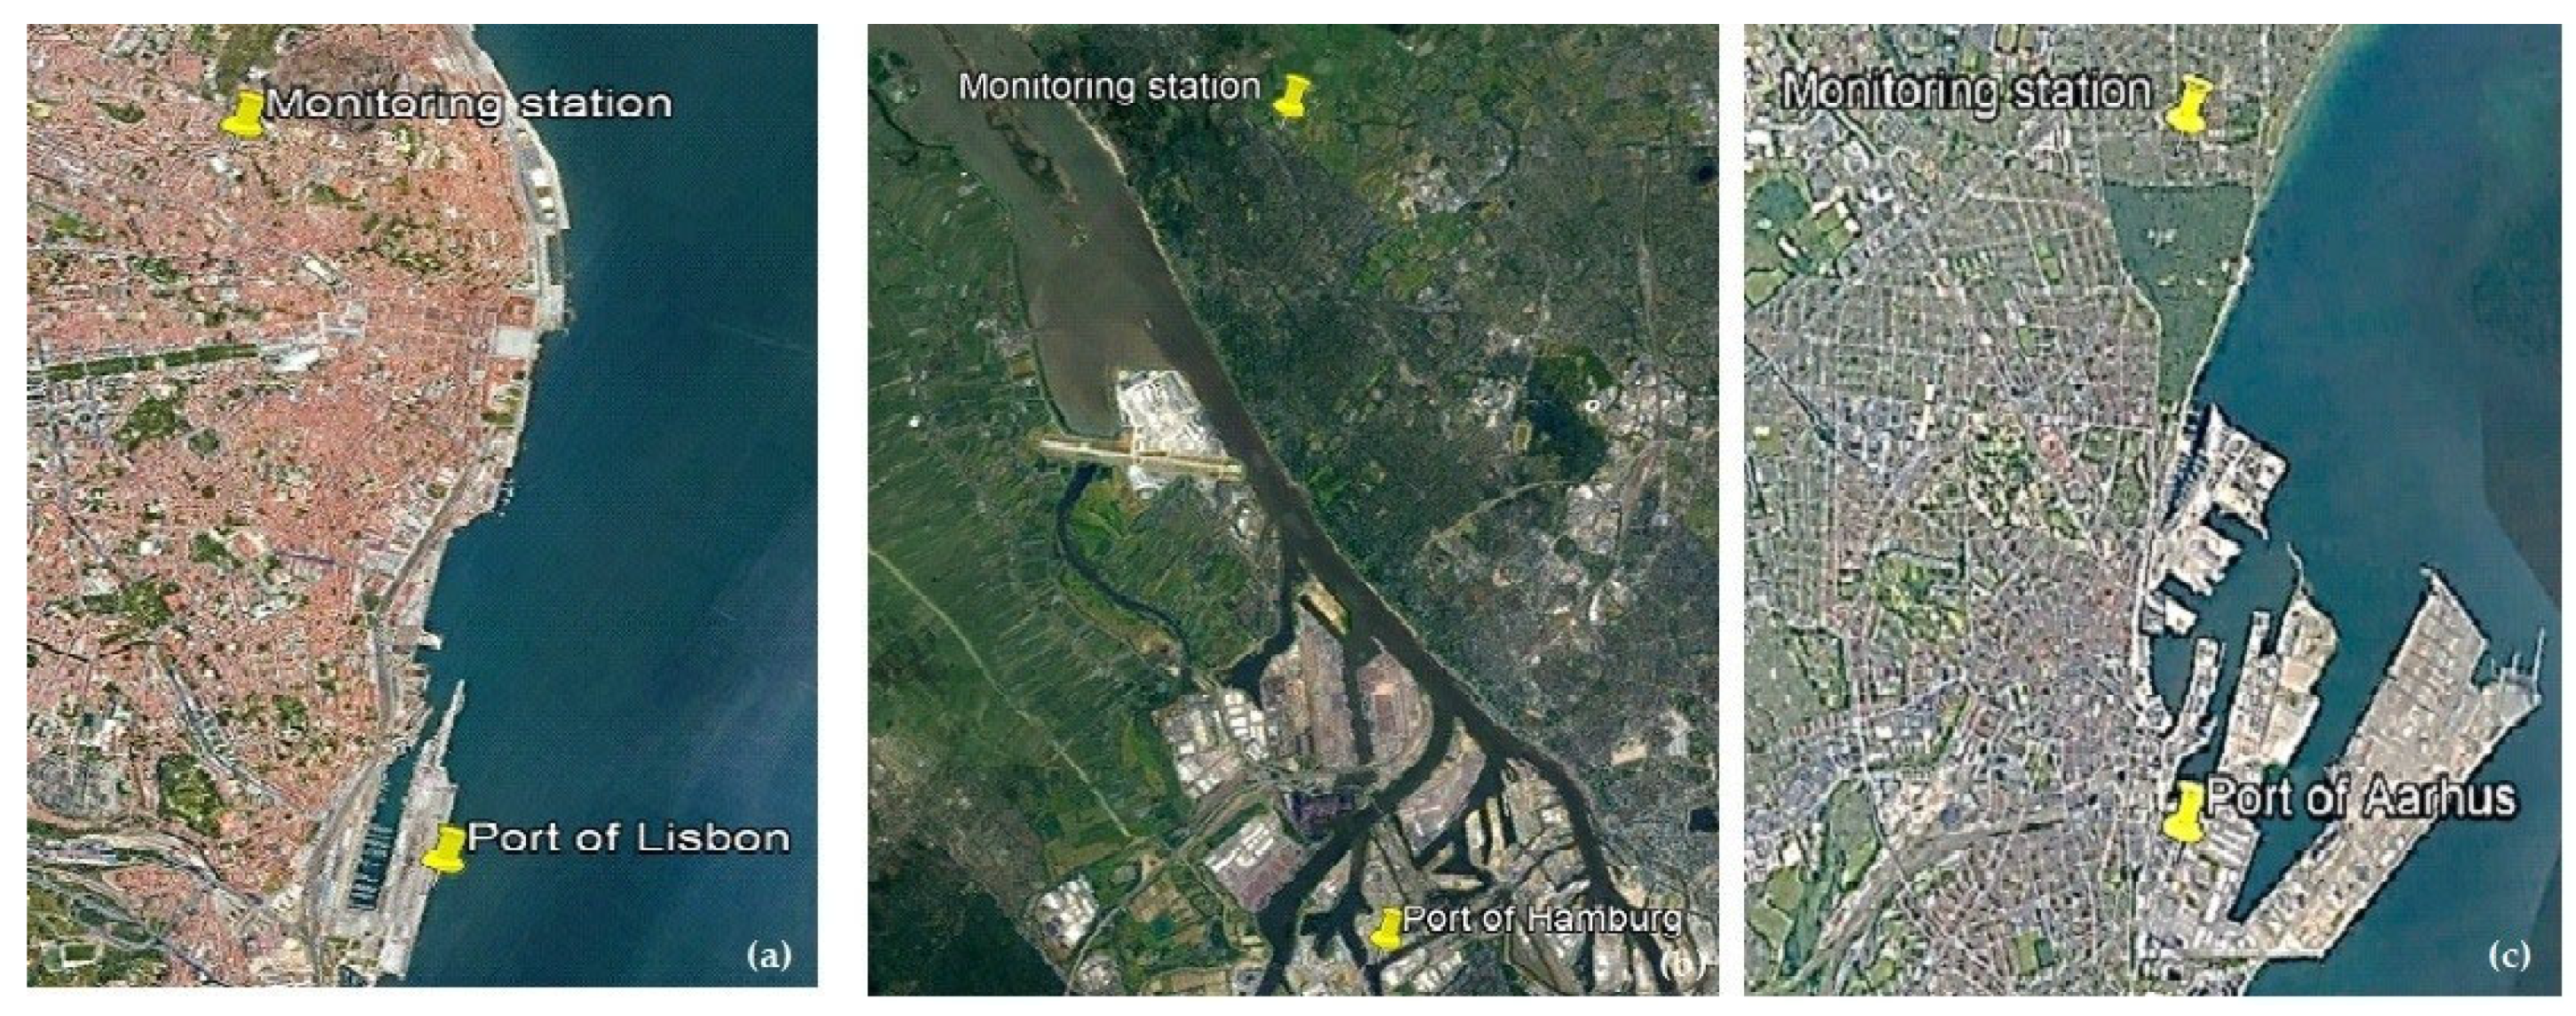
2. Area of Study
3. Methodology
3.1. Instrumentation
3.2. Calculation of Intake Dose
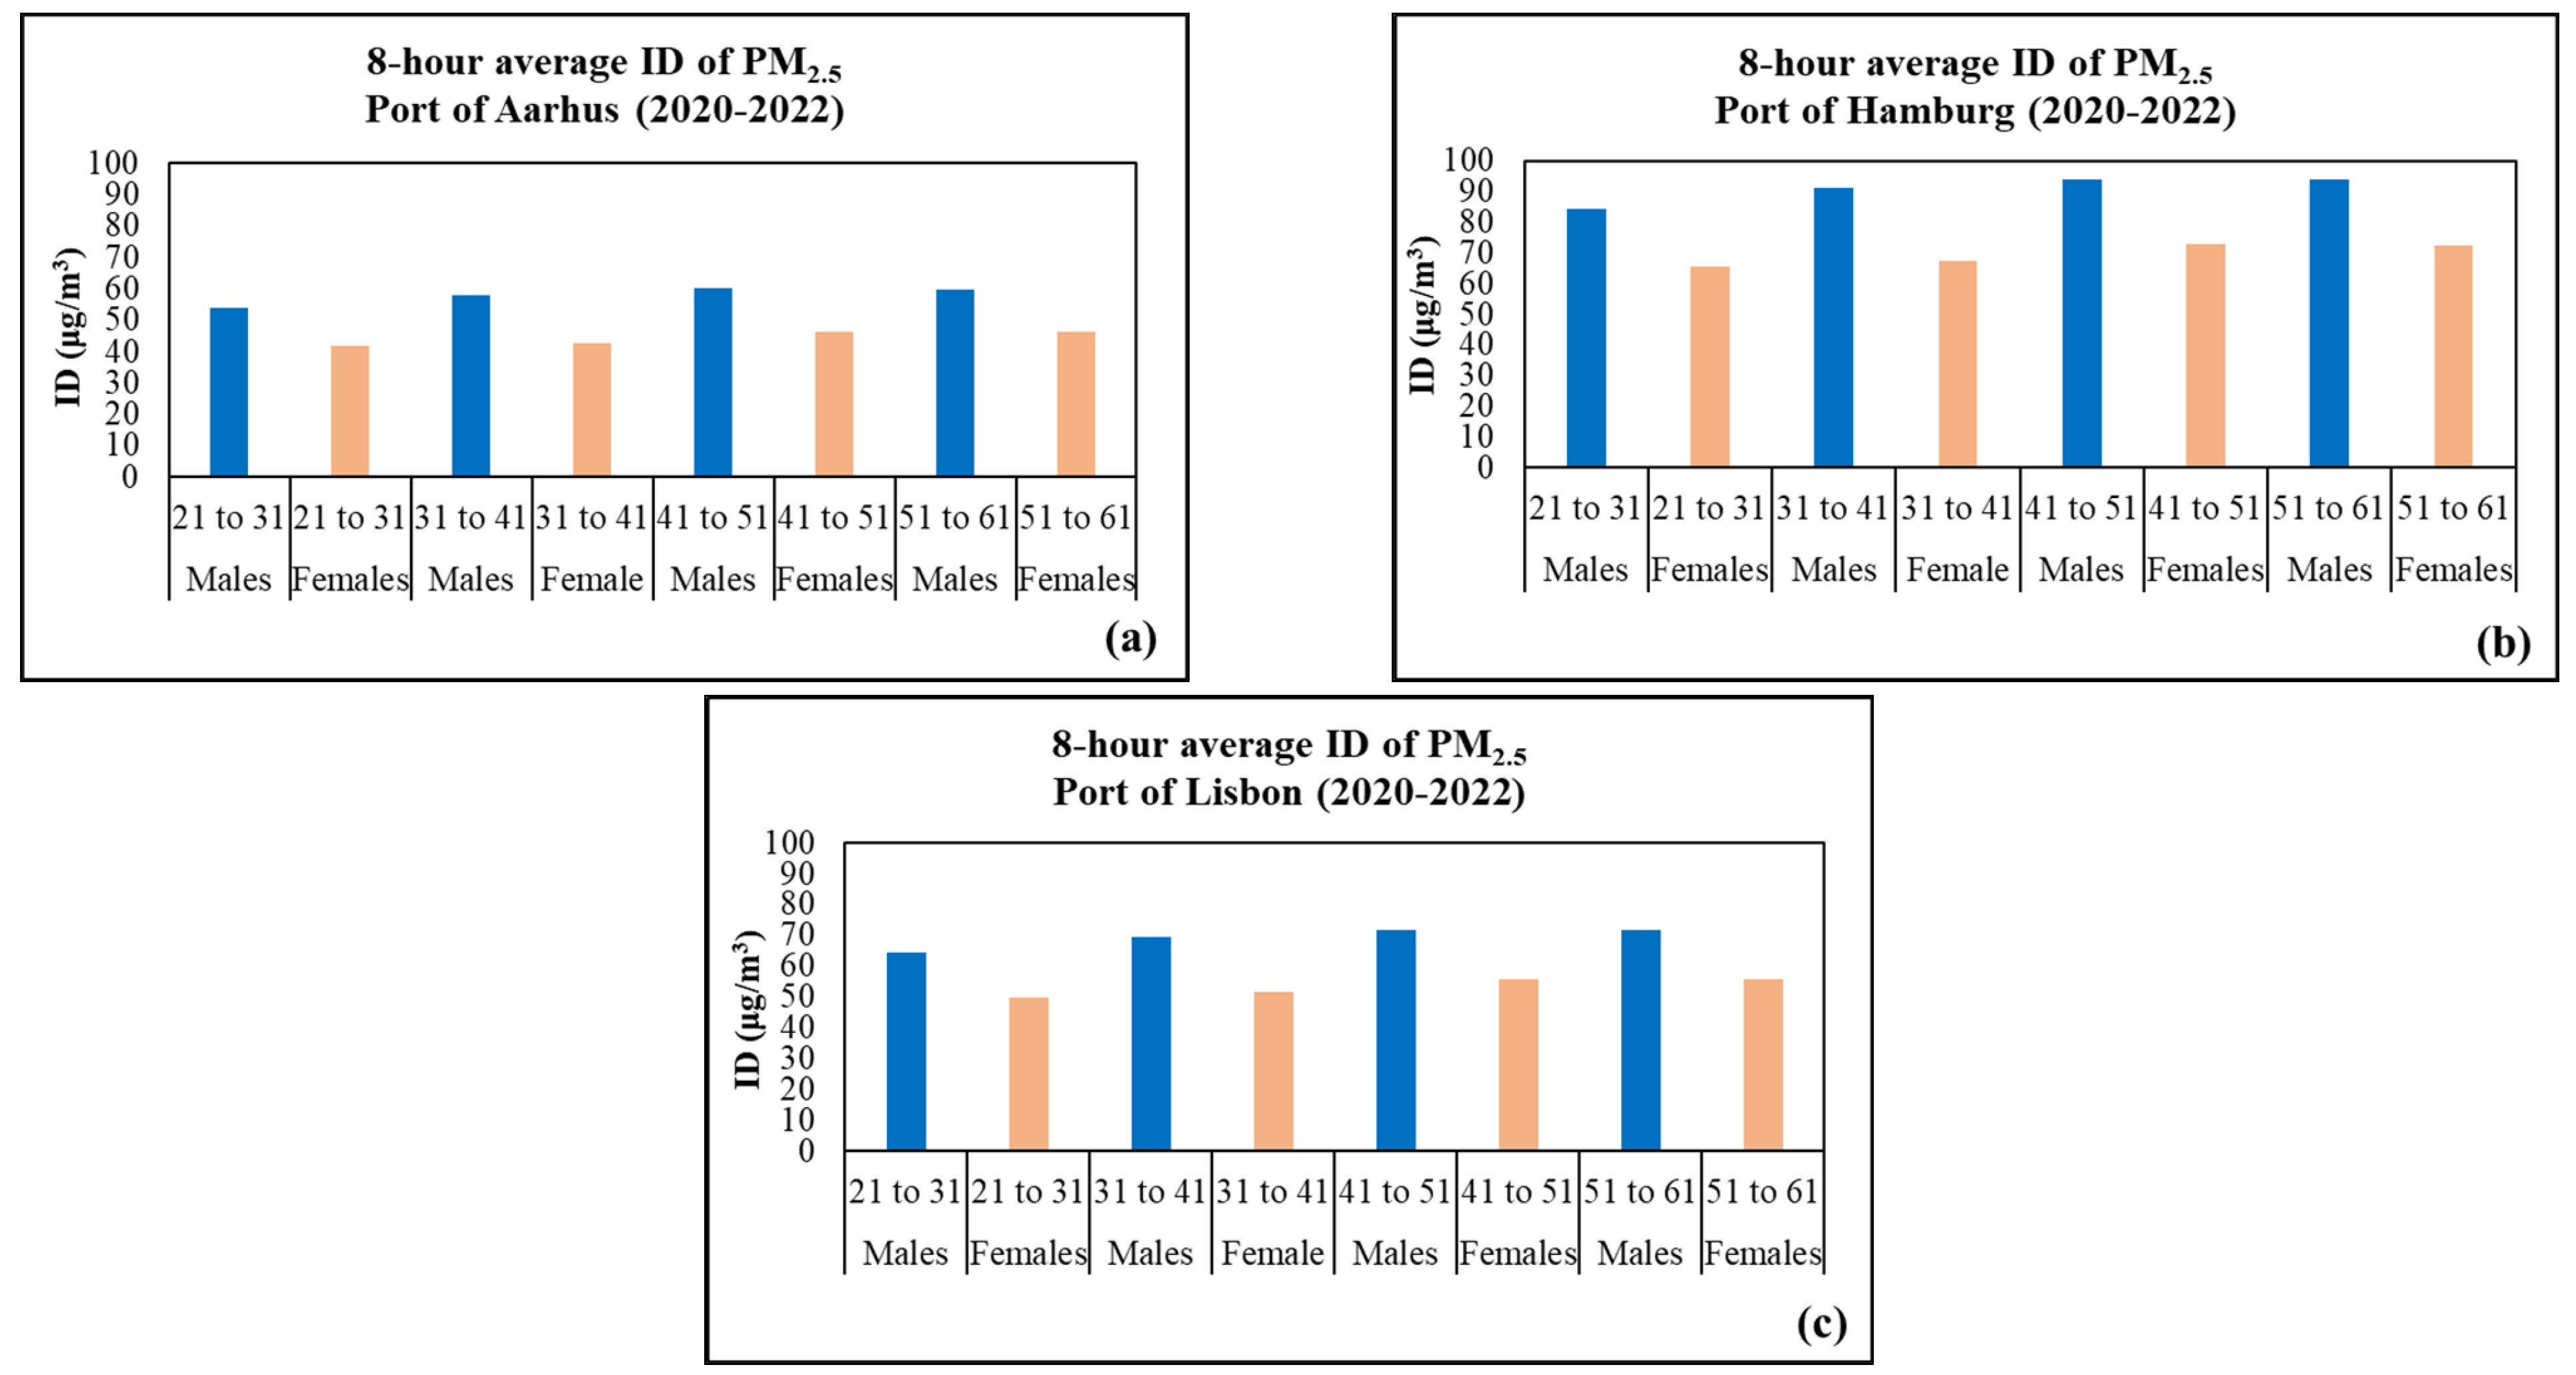
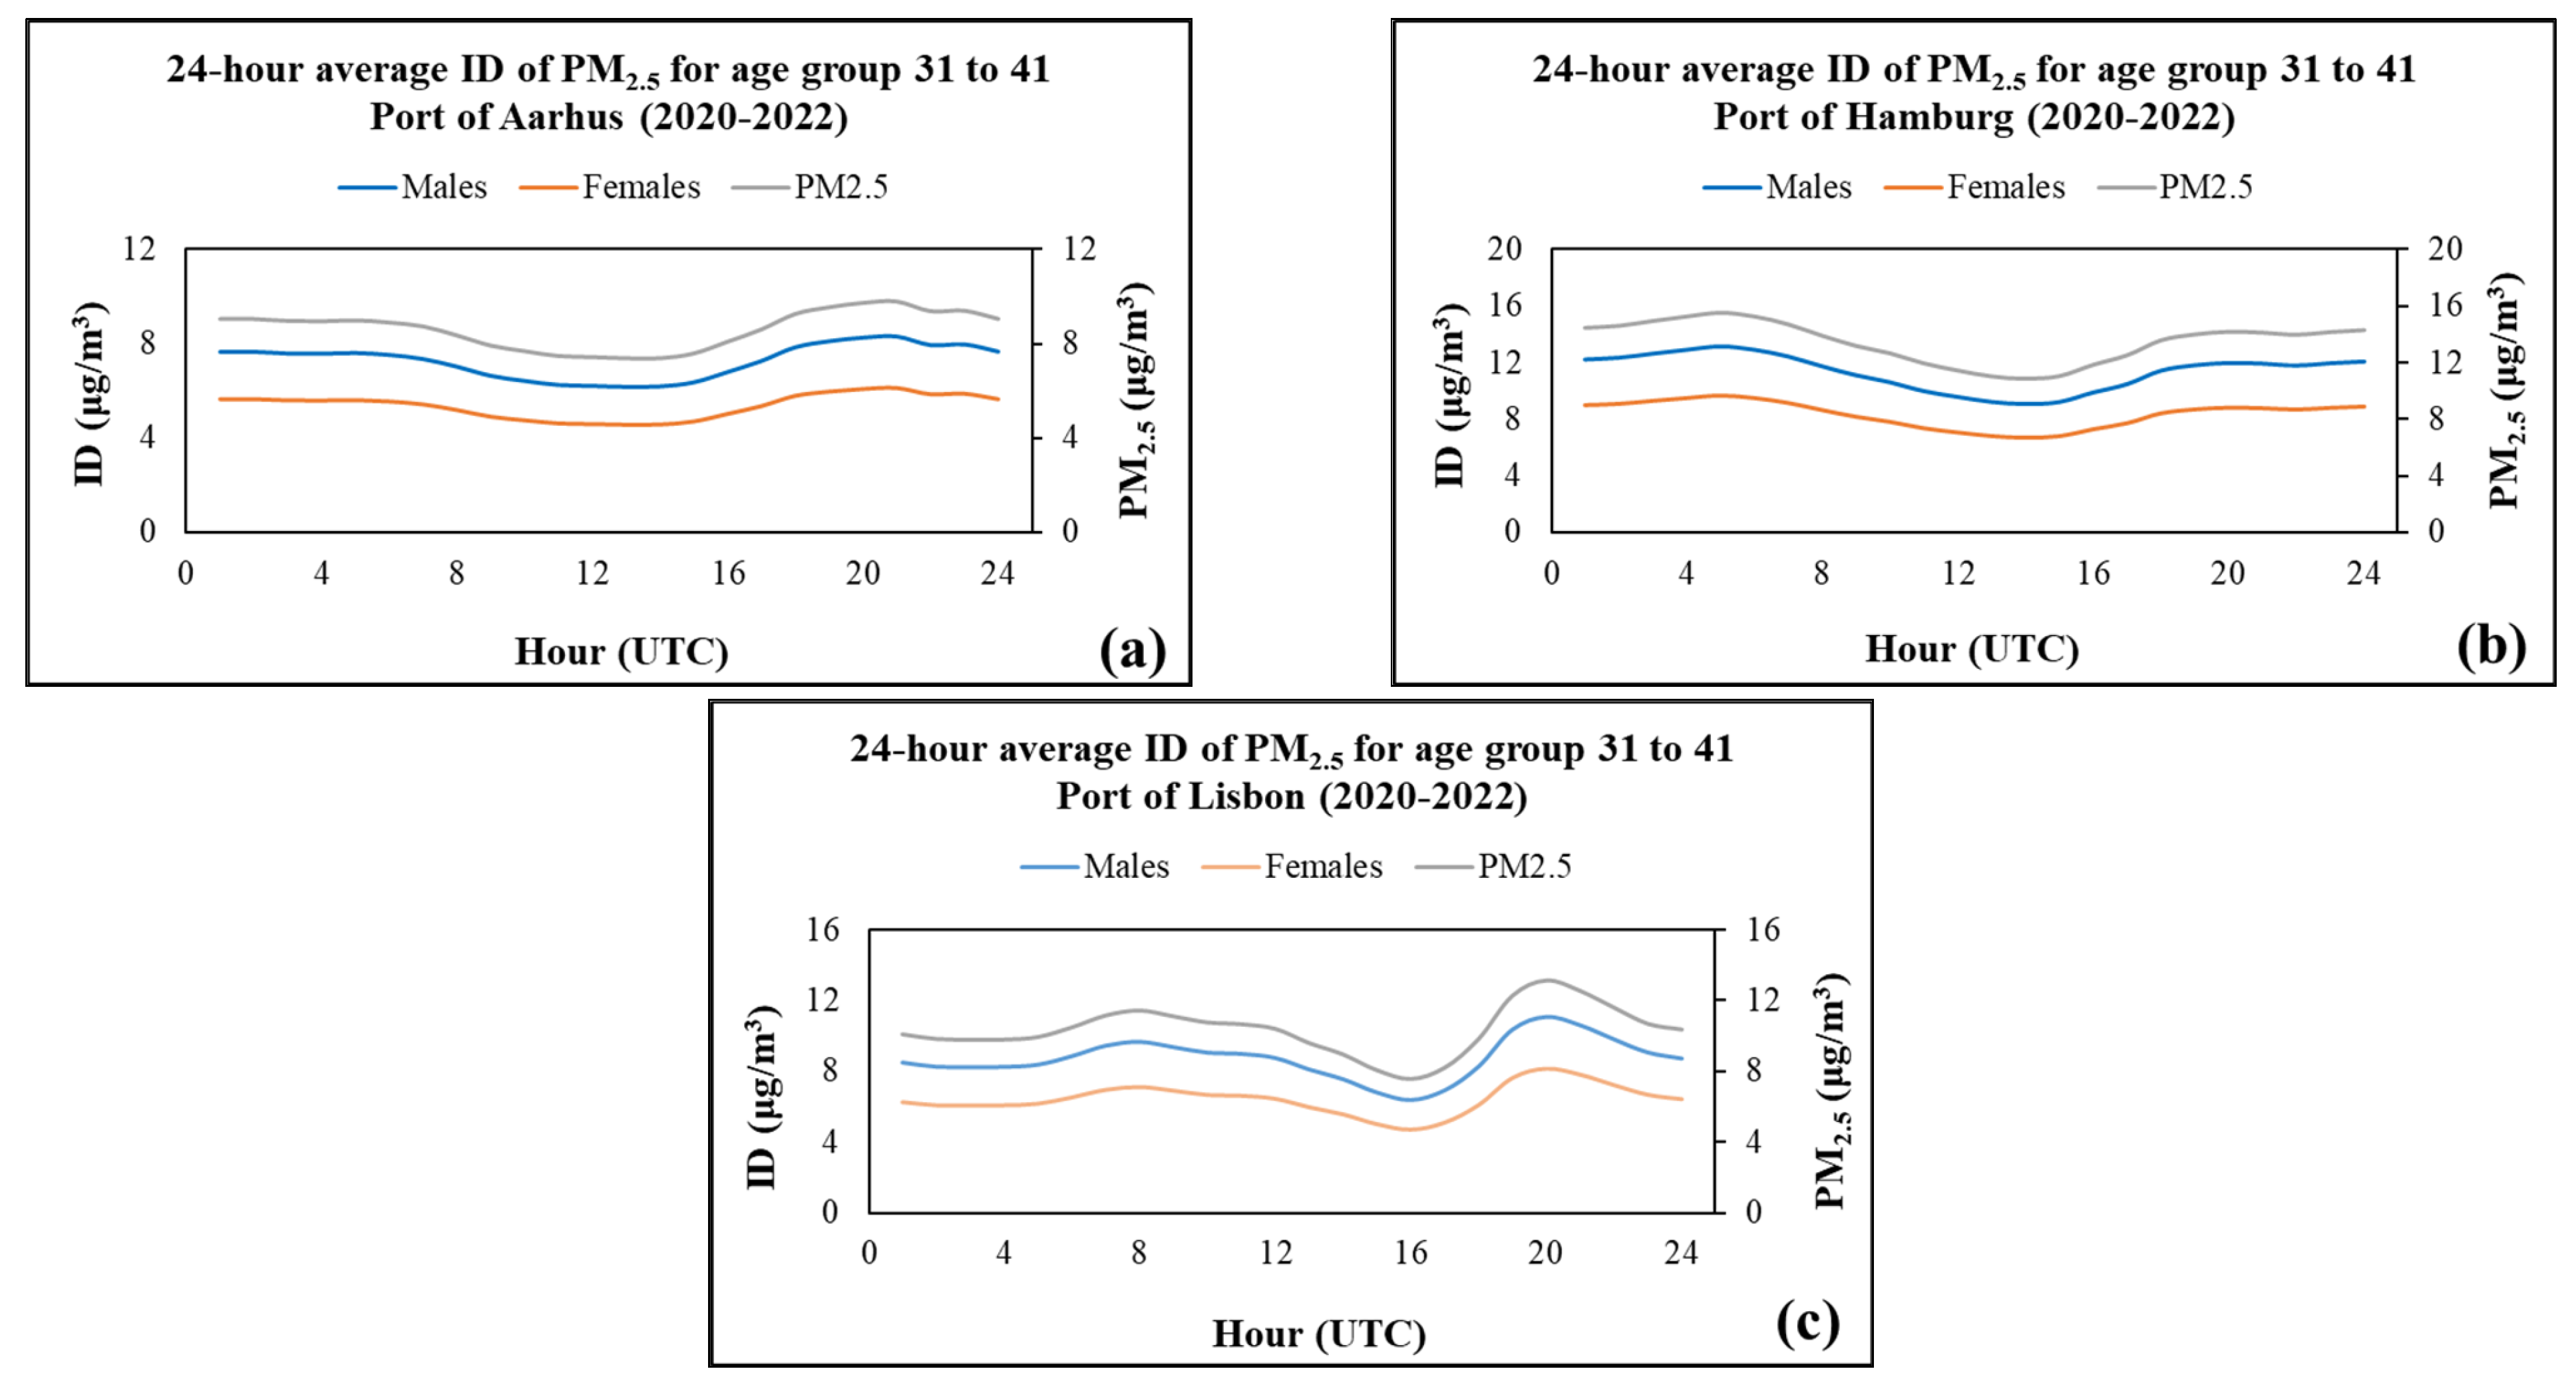
4. Results
5. Conclusions
Author Contributions
Funding
Institutional Review Board Statement
Informed Consent Statement
Data Availability Statement
Acknowledgments
Conflicts of Interest
References
- Billions of People Still Breathe Unhealthy Air: New WHO Data (2022), 4 April. Available online: https://www.who.int/news/item/04-04-2022-billions-of-people-still-breathe-unhealthy-air-new-who-data (accessed on 28 March 2023).
- Yang, L.; Zhang, Y.; Qi, W.; Zhao, T.; Zhang, L.; Zhou, L.; Ye, L. Adverse effects of PM2.5 on cardiovascular diseases. Rev. Environ. Health 2022, 37, 71–80. [Google Scholar] [CrossRef] [PubMed]
- Bae, H.R.; Chandy, M.; Aguilera, J.; Smith, E.M.; Nadeau, K.C.; Wu, J.C.; Paik, D.T. Adverse effects of air pollution-derived fine particulate matter on cardiovascular homeostasis and disease. Trends Cardiovasc. Med. 2022, 32, 487–498. [Google Scholar] [CrossRef] [PubMed]
- Kim, J.B.; Prunicki, M.; Haddad, F.; Dant, C.; Sampath, V.; Patel, R.; Smith, E.; Akdis, C.; Balmes, J.; Snyder, M.P.; et al. Cumulative Lifetime Burden of Cardiovascular Disease From Early Exposure to Air Pollution. J. Am. Heart Assoc. 2020, 9, e014944. [Google Scholar] [CrossRef]
- Al-Kindi, S.G.; Brook, R.D.; Biswal, S.; Rajagopalan, S. Environmental determinants of cardiovascular disease: Lessons learned from air pollution. Nat. Rev. Cardiol. 2020, 17, 656–672. [Google Scholar] [CrossRef] [PubMed]
- Anenberg, S.C.; Achakulwisut, P.; Brauer, M.; Moran, D.; Apte, J.S.; Henze, D.K. Particulate matter-attributable mortality and relationships with carbon dioxide in 250 urban areas worldwide. Sci. Rep. 2019, 9, 11552. [Google Scholar] [CrossRef] [PubMed]
- Hooper, L.G.; Kaufman, J.D. Ambient Air Pollution and Clinical Implications for Susceptible Populations. Ann. Am. Thorac. Soc. 2018, 15 (Suppl. 2), S64–S68. [Google Scholar] [CrossRef] [PubMed]
- Rajagopalan, S.; Brauer, M.; Bhatnagar, A.; Bhatt, D.L.; Brook, J.R.; Huang, W.; Münzel, T.; Newby, D.; Siegel, J.; Brook, R.D. Personal-Level Protective Actions Against Particulate Matter Air Pollution Exposure: A Scientific Statement From the American Heart Association. Circulation 2020, 142, e411–e431. [Google Scholar] [CrossRef] [PubMed]
- Lelieveld, J.; Evans, J.S.; Fnais, M.; Giannadaki, D.; Pozzer, A. The contribution of outdoor air pollution sources to premature mortality on a global scale. Nature 2015, 525, 367–371. [Google Scholar] [CrossRef] [PubMed]
- Corbett, J.J.; Winebrake, J.J.; Green, E.H.; Kasibhatla, P.; Eyring, V.; Lauer, A. Mortality from Ship Emissions: A Global Assessment. Environ. Sci. Technol. 2007, 41, 8512–8518. [Google Scholar] [CrossRef] [PubMed]
- Brzozowski, K.; Ryguła, A.; Maczyński, A. The use of low-cost sensors for air quality analysis in road intersections. Transp. Res. Part D Transp. Environ. 2019, 77, 198–211. [Google Scholar] [CrossRef]
- Kortoçi, P.; Motlagh, N.H.; Zaidan, M.A.; Fung, P.L.; Varjonen, S.; Rebeiro-Hargrave, A.; Niemi, J.V.; Nurmi, P.; Hussein, T.; Petäjä, T.; et al. Air pollution exposure monitoring using portable low-cost air quality sensors. Smart Health 2022, 23, 100241. [Google Scholar] [CrossRef]
- Lu, Y.; Giuliano, G.; Habre, R. Estimating hourly PM2.5 concentrations at the neighborhood scale using a low-cost air sensor network: A Los Angeles case study. Environ. Res. 2021, 195, 110653. [Google Scholar] [CrossRef] [PubMed]
- Wallace, L.; Bi, J.; Ott, W.R.; Sarnat, J.; Liu, Y. Calibration of low-cost PurpleAir outdoor monitors using an improved method of calculating PM. Atmos. Environ. 2021, 256, 118432. [Google Scholar] [CrossRef]
- Novak, R.; Kocman, D.; Robinson, J.A.; Kanduč, T.; Sarigiannis, D.; Horvat, M. Comparing Airborne Particulate Matter Intake Dose Assessment Models Using Low-Cost Portable Sensor Data. Sensors 2020, 20, 1406. [Google Scholar] [CrossRef] [PubMed]
- US-EPA. Exposure Factors Handbook: 2011 Edition; EPA/600/R-090/052F; United States Environmental Protection Agency: Washington, DC, USA, 2011.


| Sex | Age Groups (Years) | Mean Inhalation Rate Values (m3/day) |
|---|---|---|
| Male | 21 to <31 | 18.82 |
| 31 to <41 | 20.29 | |
| 41 to <51 | 20.94 | |
| 51 to <61 | 20.91 | |
| Female | 21 to <31 | 14.57 |
| 31 to <41 | 14.98 | |
| 41 to <51 | 16.20 | |
| 51 to <61 | 16.19 |
| Port | Year | Mean Annual PM2.5 Concentrations (μg/m3) |
|---|---|---|
| Aarhus | 2020 | 8.89 |
| 2021 | 8.59 | |
| 2022 | 8.31 | |
| Hamburg | 2020 | 13.75 |
| 2021 | 14.89 | |
| 2022 | 11.51 | |
| Lisbon | 2020 | 11.01 |
| 2021 | 10.50 | |
| 2022 | 9.36 |
Disclaimer/Publisher’s Note: The statements, opinions and data contained in all publications are solely those of the individual author(s) and contributor(s) and not of MDPI and/or the editor(s). MDPI and/or the editor(s) disclaim responsibility for any injury to people or property resulting from any ideas, methods, instructions or products referred to in the content. |
© 2023 by the authors. Licensee MDPI, Basel, Switzerland. This article is an open access article distributed under the terms and conditions of the Creative Commons Attribution (CC BY) license (https://creativecommons.org/licenses/by/4.0/).
Share and Cite
Karagiannopoulou, E.; Fameli, K.-M.; Tsitsis, C.; Moustris, K.; Ntourou, K. Estimating the Air Pollution Intake Dose in Three Port Cities in Europe with the Use of Ambient Fine Particulate Matter Measurements from Low-Cost Sensors. Environ. Sci. Proc. 2023, 26, 71. https://doi.org/10.3390/environsciproc2023026071
Karagiannopoulou E, Fameli K-M, Tsitsis C, Moustris K, Ntourou K. Estimating the Air Pollution Intake Dose in Three Port Cities in Europe with the Use of Ambient Fine Particulate Matter Measurements from Low-Cost Sensors. Environmental Sciences Proceedings. 2023; 26(1):71. https://doi.org/10.3390/environsciproc2023026071
Chicago/Turabian StyleKaragiannopoulou, Efstratia, Kyriaki-Maria Fameli, Christos Tsitsis, Konstantinos Moustris, and Kleopatra Ntourou. 2023. "Estimating the Air Pollution Intake Dose in Three Port Cities in Europe with the Use of Ambient Fine Particulate Matter Measurements from Low-Cost Sensors" Environmental Sciences Proceedings 26, no. 1: 71. https://doi.org/10.3390/environsciproc2023026071
APA StyleKaragiannopoulou, E., Fameli, K.-M., Tsitsis, C., Moustris, K., & Ntourou, K. (2023). Estimating the Air Pollution Intake Dose in Three Port Cities in Europe with the Use of Ambient Fine Particulate Matter Measurements from Low-Cost Sensors. Environmental Sciences Proceedings, 26(1), 71. https://doi.org/10.3390/environsciproc2023026071