1. Introduction
Nitrogen dioxide (NO
2) is a major pollutant worldwide, playing a key role in the tropospheric and stratospheric chemistry [
1]. It partly affects the ozone (O
3) distribution in the Earth’s atmosphere through contribution to the catalytic destruction of ozone in the upper troposphere and lower stratosphere [
2]. In the lower troposphere (mostly in the boundary layer), the horizontal and vertical distributions of NO
2 strongly affect the air quality and, consequently, human health [
3].
Retrievals of total vertical column amount of NO
2 from space-borne sensors are usually performed by applying Differential Optical Absorption Spectroscopy (DOAS) on radiance measurements of scattered sunlight [
4]. Concerning the ground-based systems, sky radiances are measured either in the zenith direction (zenith-sky DOAS) [
5] or in multiple directions (MAX-DOAS) [
6].
In this work, the direct-sun DOAS (DS-DOAS) technique was used for the retrieval of total NO
2 column amounts. This technique has proven to be accurate for deriving NO
2 concentrations from ground-based instruments using measurements of direct solar irradiance [
7], where the Air Mass Factor is approximated by the secant of the solar zenith angle (SZA), as discussed in the Data and Methodology section. The DS-DOAS method is equally sensitive to stratospheric and tropospheric NO
2 concentrations. It does not require complicated radiative transfer calculations, is not affected by the Ring effect, does not require prior knowledge of ground reflectivity [
7], nor the assumption of horizontal homogeneity (except for large SZA), typical of zenith-sky DOAS and MAXDOAS.
2. Instrumentation
A new research-grade MAX-DOAS instrument, Delta, was developed at the Laboratory of Atmospheric Physics in collaboration with the Royal Belgian Institute for Space Aeronomy (BIRA-IASB), in the framework of the PANhellenic infrastructure for Atmospheric Composition and Climate Change (PANACEA) project. Delta is characterized by increased sensitivity and accuracy in measuring trace gases and aerosols, providing valuable insights into air quality and atmospheric chemistry. Delta consists of two separate units: The external unit houses the optical head which is mounted on a sun tracker that allows accurate orientation of the optics at different viewing directions. The Delta system’s internal unit consists of a spectrograph that analyzes the incoming radiation and produces a spectrum and a CCD camera that functions as a detector and measures the spectral intensity. Both are placed in a thermally isolated box, designed by Raymetrics S.A. (
https://raymetrics.com, accessed on 25 March 2023), where the temperature is kept constant at 20 °C with a thermoelectric Peltier system.
The Pandora 2S instrument was designed from a collaboration of the National Aeronautics and Space Administration (NASA) and the European Space Agency (ESA) with SciGlob to address the gap in air quality validation of satellite measurements. It is an easy-to-deploy, ground-based system that monitors various atmospheric trace gases absorbing in the UV and visible spectral ranges, such as NO2, O3 and formaldehyde (HCHO). The Pandora 2S Head sensor is mounted on a microprocessor-controlled azimuth and elevation sun tracker and can point in any direction in the sky. The control software (Blick Software Suite 1.8) supports automated measurements, remote monitoring and data transfers over the internet. Pandora system’s internal unit consists of a controller running the BlickO 1.8 operating software under Microsoft Windows 10 Pro, the power distribution and system interface electronics unit and the two spectrometers (UV/Vis and Vis/NIR). All these components are installed to a thermally isolated box.
3. Data and Methodology
The Pandora direct-sun total NO
2 column data were produced using Pandora’s standard NO
2 algorithm implemented in the BlickP 1.8 software [
8]. The measured direct-sun spectra in the range of 400–440 nm were used in the analysis. The reference spectrum is a synthetic reference spectrum, which is usually the average over several spectra measured by the Pandora unit and corrected for the estimated total optical depth of the different atmospheric extinction processes included in it.
Two spectral fittings were applied to the data, which differ in the effective temperature of NO2 absorption. In one case, the NO2 cross section is taken for the boundary layer temperature climatology and for the stratospheric temperature climatology in the other case. For the final NO2 total column product, an effective height for the stratosphere and a stratospheric NO2 climatology are used to estimate the stratospheric NO2 fraction.
A direct-sun NO
2 inversion method, similar to that described in [
7], was applied to the radiances measured by the Delta system. These measurements were analyzed using the QDOAS (version 3.2, September 2017) spectral fitting software suite developed by BIRA-IASB (
https://uv-vis.aeronomie.be/software/QDOAS/, accessed on 12 May 2023) to derive the slant column density (SC) of NO
2 relative to a reference spectrum. The measured relative slant columns SC
RELi at time i would be given by the linear relation:
where SC
i is the absolute slant column at time i.
The reference spectrum that is used in the DOAS analysis is a direct-sun spectrum recorded around noon during a summer day under low NO
2 conditions (12/07/2022). The slant column density in the reference spectrum was calculated with the Bootstrap Estimation method [
9] which will be discussed in the Results section.
From the SC, the vertical column density (VC) is calculated by division with the appropriate airmass factor. For the calculation of the direct-sun air mass factor, we use Equation (2):
where r is the distance from the center of the Earth to the measurement location (~6370 km), SZAa is the apparent solar zenith angle (i.e., the true SZA corrected for refraction), and h
EFF is the assumed effective height of the NO
2 layer. Here, we assume h
EFF = 25 km to derive the stratospheric AMFs and h
EFF = 12.5 km for the total column AMF.
The absorption cross sections used are the same with those used in Pandora’s data analysis [
10] for NO
2 effective temperatures of 220, 298 and 254.5 K, which are representative for the stratospheric, tropospheric and total NO
2 columns, respectively. The other atmospheric gases’ absorption cross sections used are for O
3 at 223 K [
11], H
2O at 293 K, O
4 at 262 K [
12], OIO at 298 K [
13] and I
2 at 295 K [
14].
4. Results
To calculate the total VC from the Delta system measurements, it is essential that the SC of the reference spectrum is calculated. The method applied to perform this is the Bootstrap Estimation method [
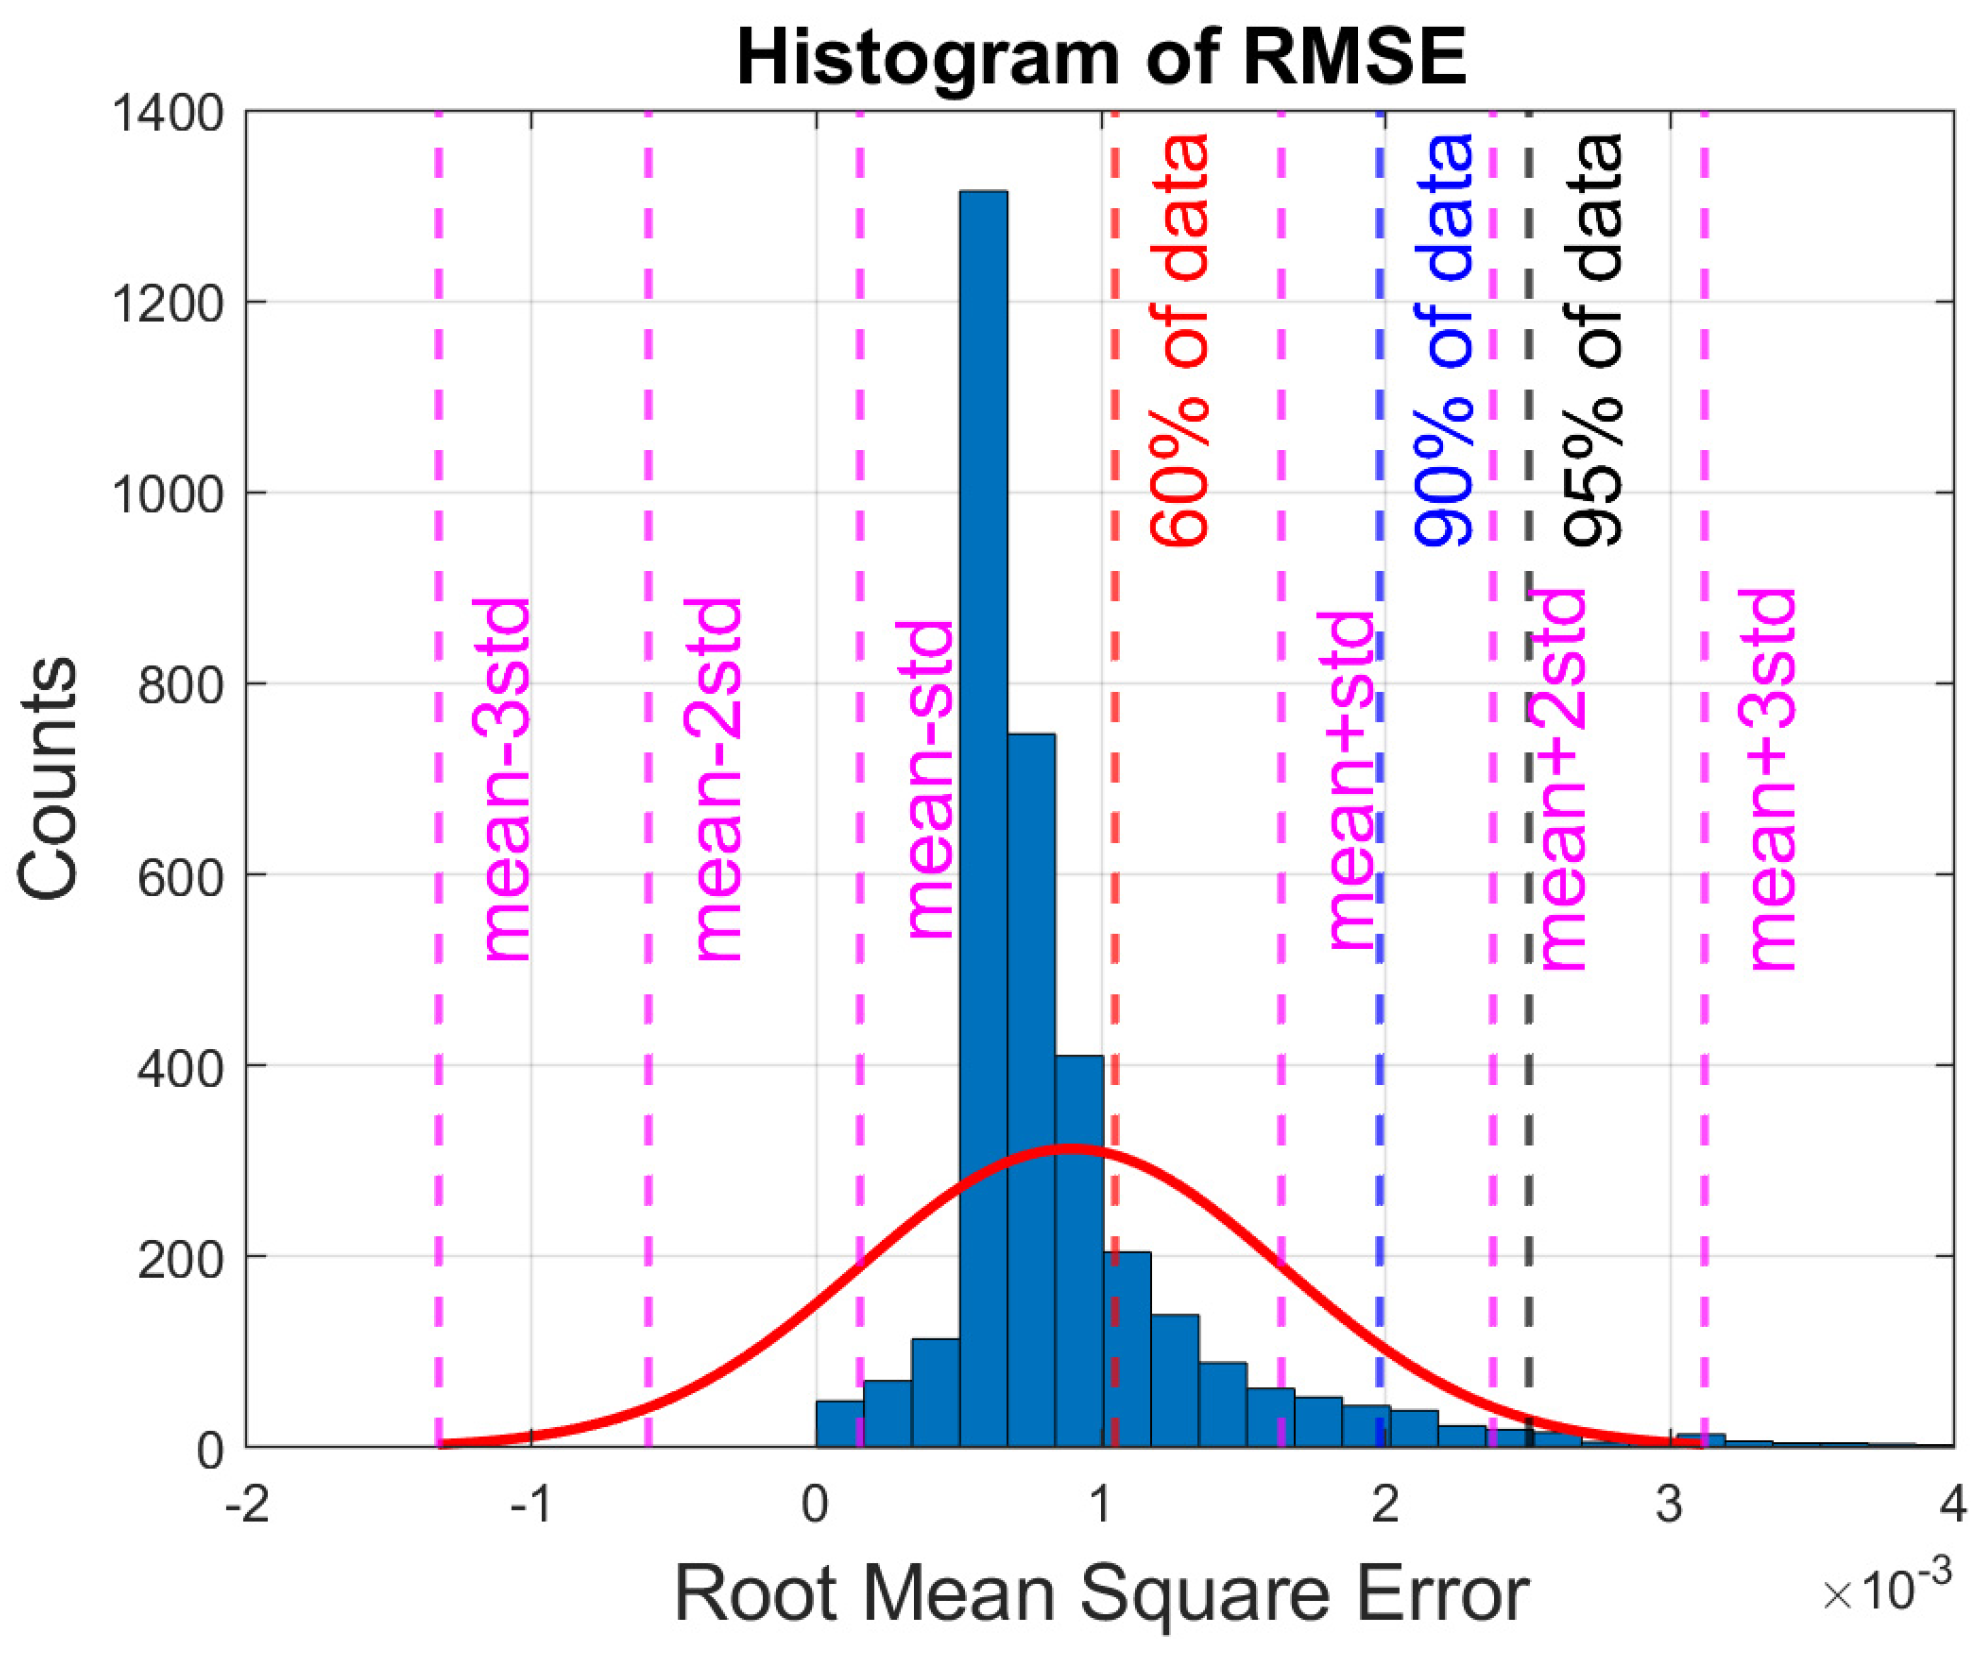
14]. Data with Root Mean Square Errors greater than 2 are excluded to achieve a better performance of the method. The reason for selecting a value of 2 is because it excludes the 10% of the data with the greatest errors, as can be seen in the histogram in
Figure 1.
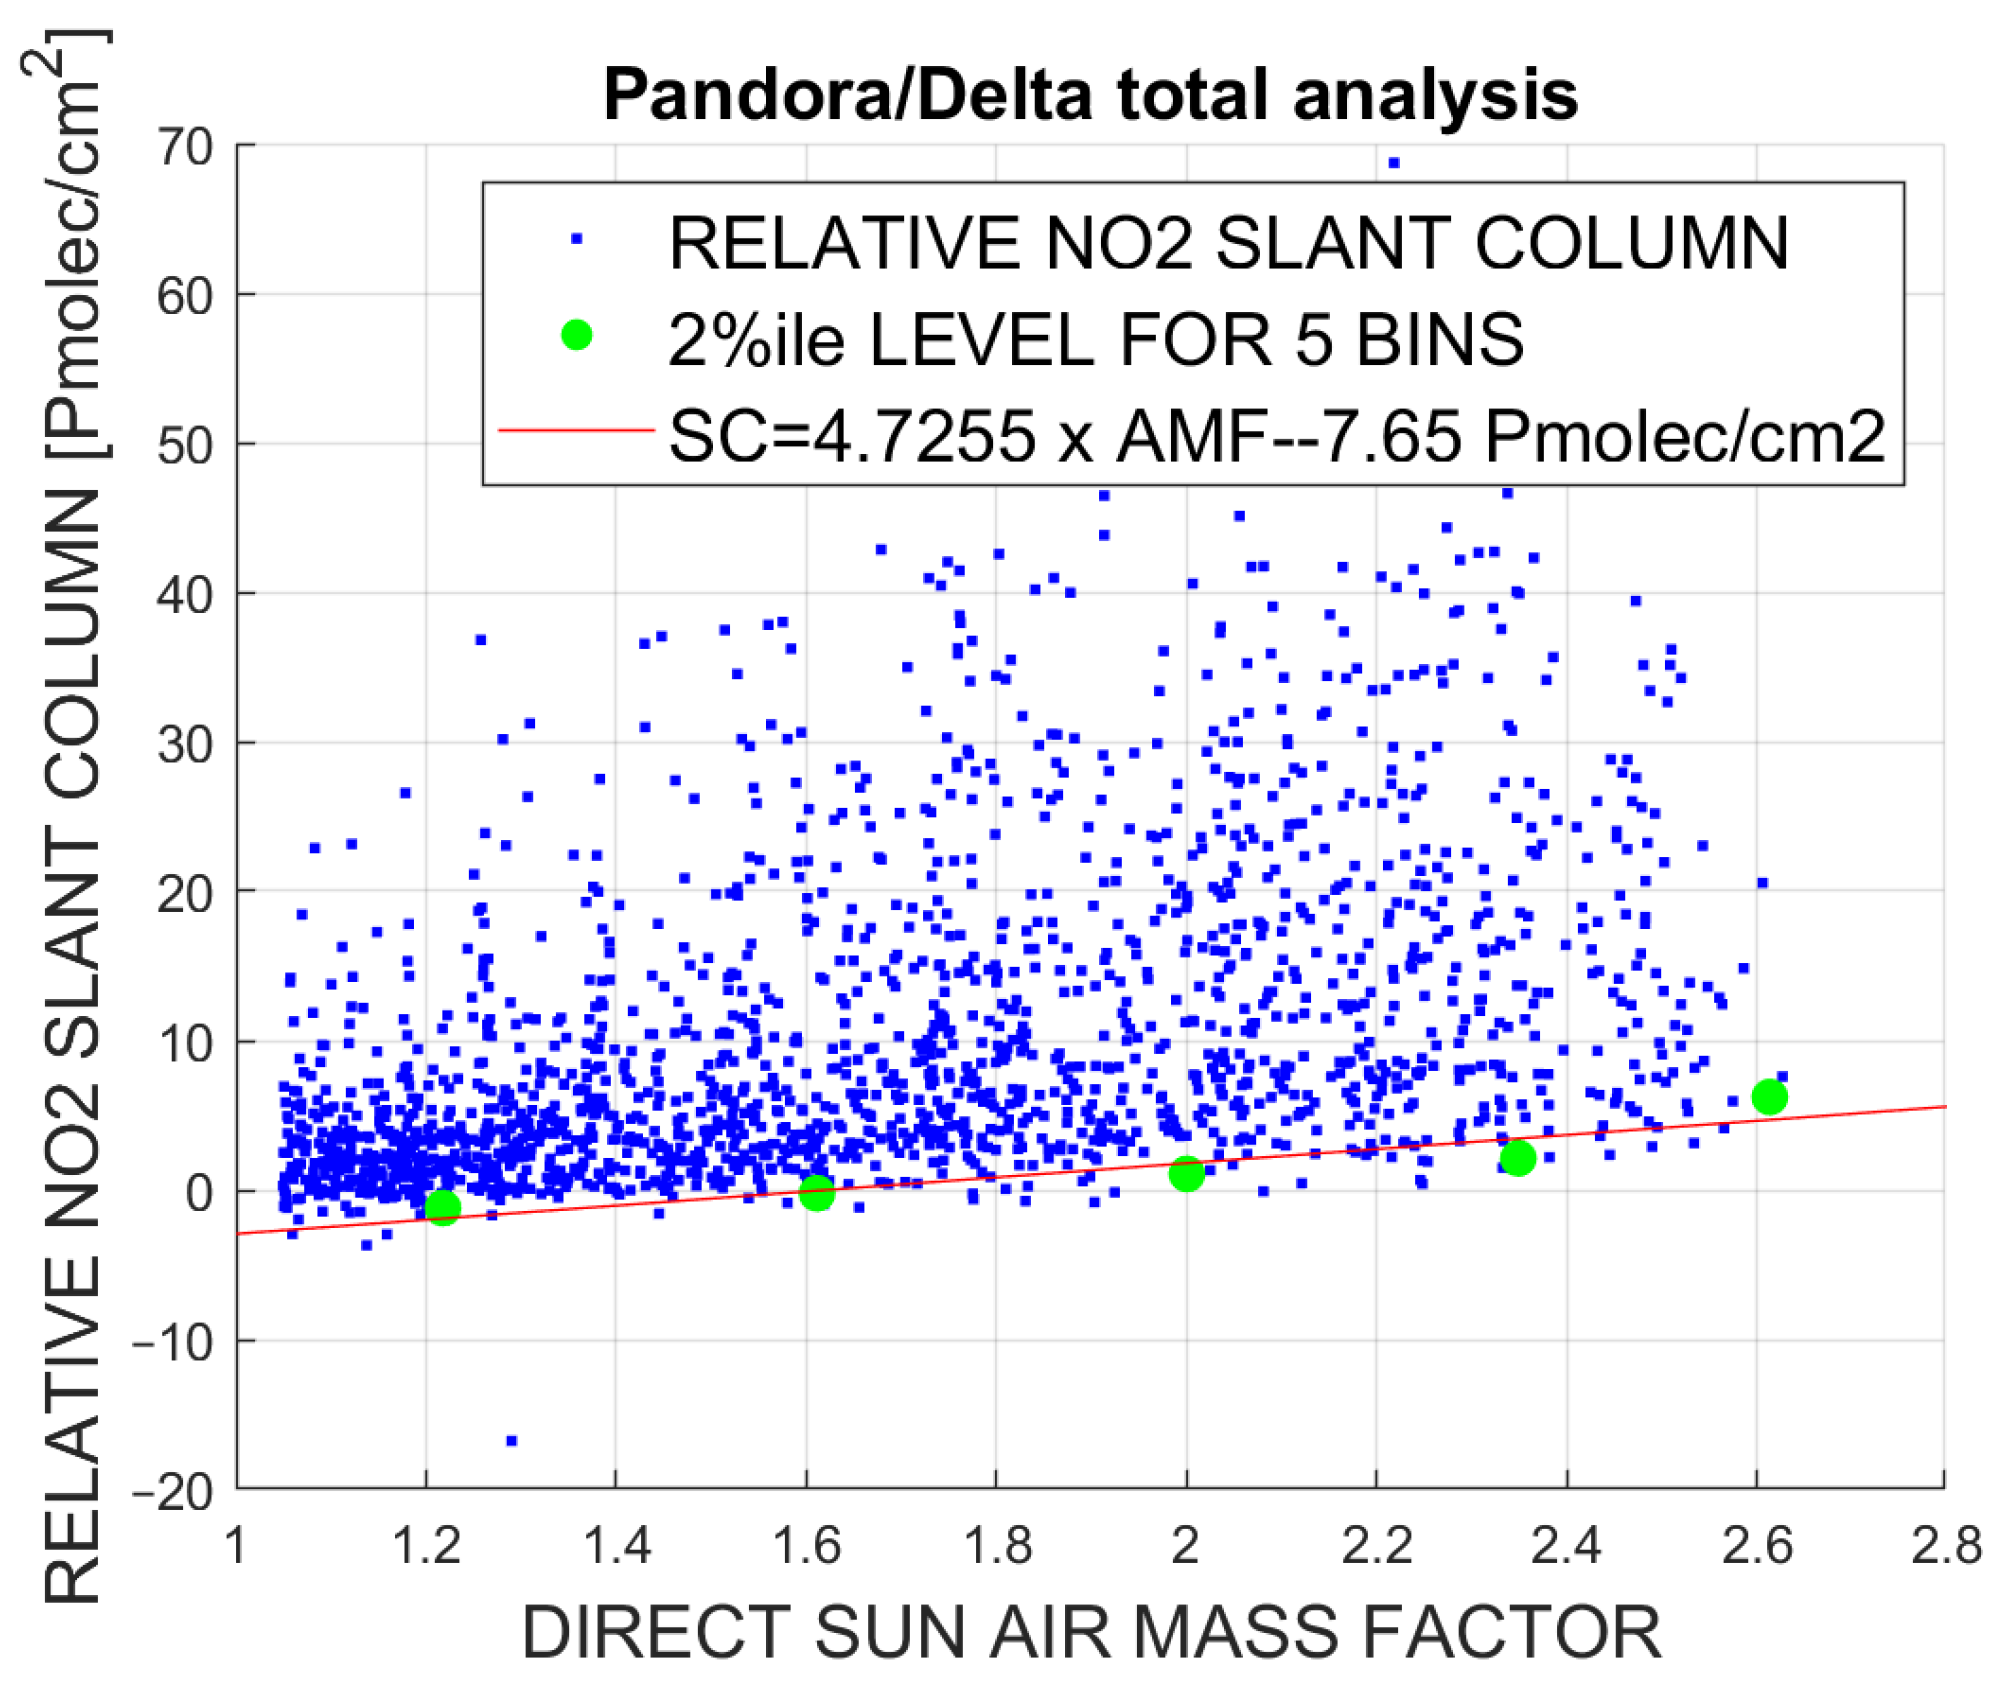
For the Bootstrap method, the relative slant columns are binned with respect to AMFs and the average of the lowest 2nd percentile in each bin is plotted against the corresponding AMFs. The bin size was chosen to be 0.4 units of AMFs. The slant column density of the reference day, SC
REF = 7.65 Pmolec/cm
2, is derived from the linear fit of the 2nd percentile averages and the corresponding AMFs (see
Figure 2) as the intercept of the regression line.
The total slant column density for the Delta system SC
TOTD is derived from Equation (3):
where SC
TD and SC
SD are, respectively, the tropospheric and stratospheric slant columns from the Delta system and AMF
S are calculated assuming that most of the absorption occurs due to the stratospheric NO
2. Finally, q
CLIM represents the climatological value of the stratospheric NO
2 column for the location, season and time of each measurement.
The SC
TD and SC
SD are derived from the QDOAS analysis using cross sections for the climatological temperatures of the troposphere (298 K) and the stratosphere (220 K), respectively. Essentially, Equation (3) partitions the tropospheric and stratospheric columns to the total column of NO
2 under the assumption that the stratospheric column remains close to the climatological values. Finally, the absolute total vertical column is calculated for the Delta system:
where AMF
TOT is the AMF calculated for the effective height 12.5 km, which is assumed to be representative of the total NO
2 column.
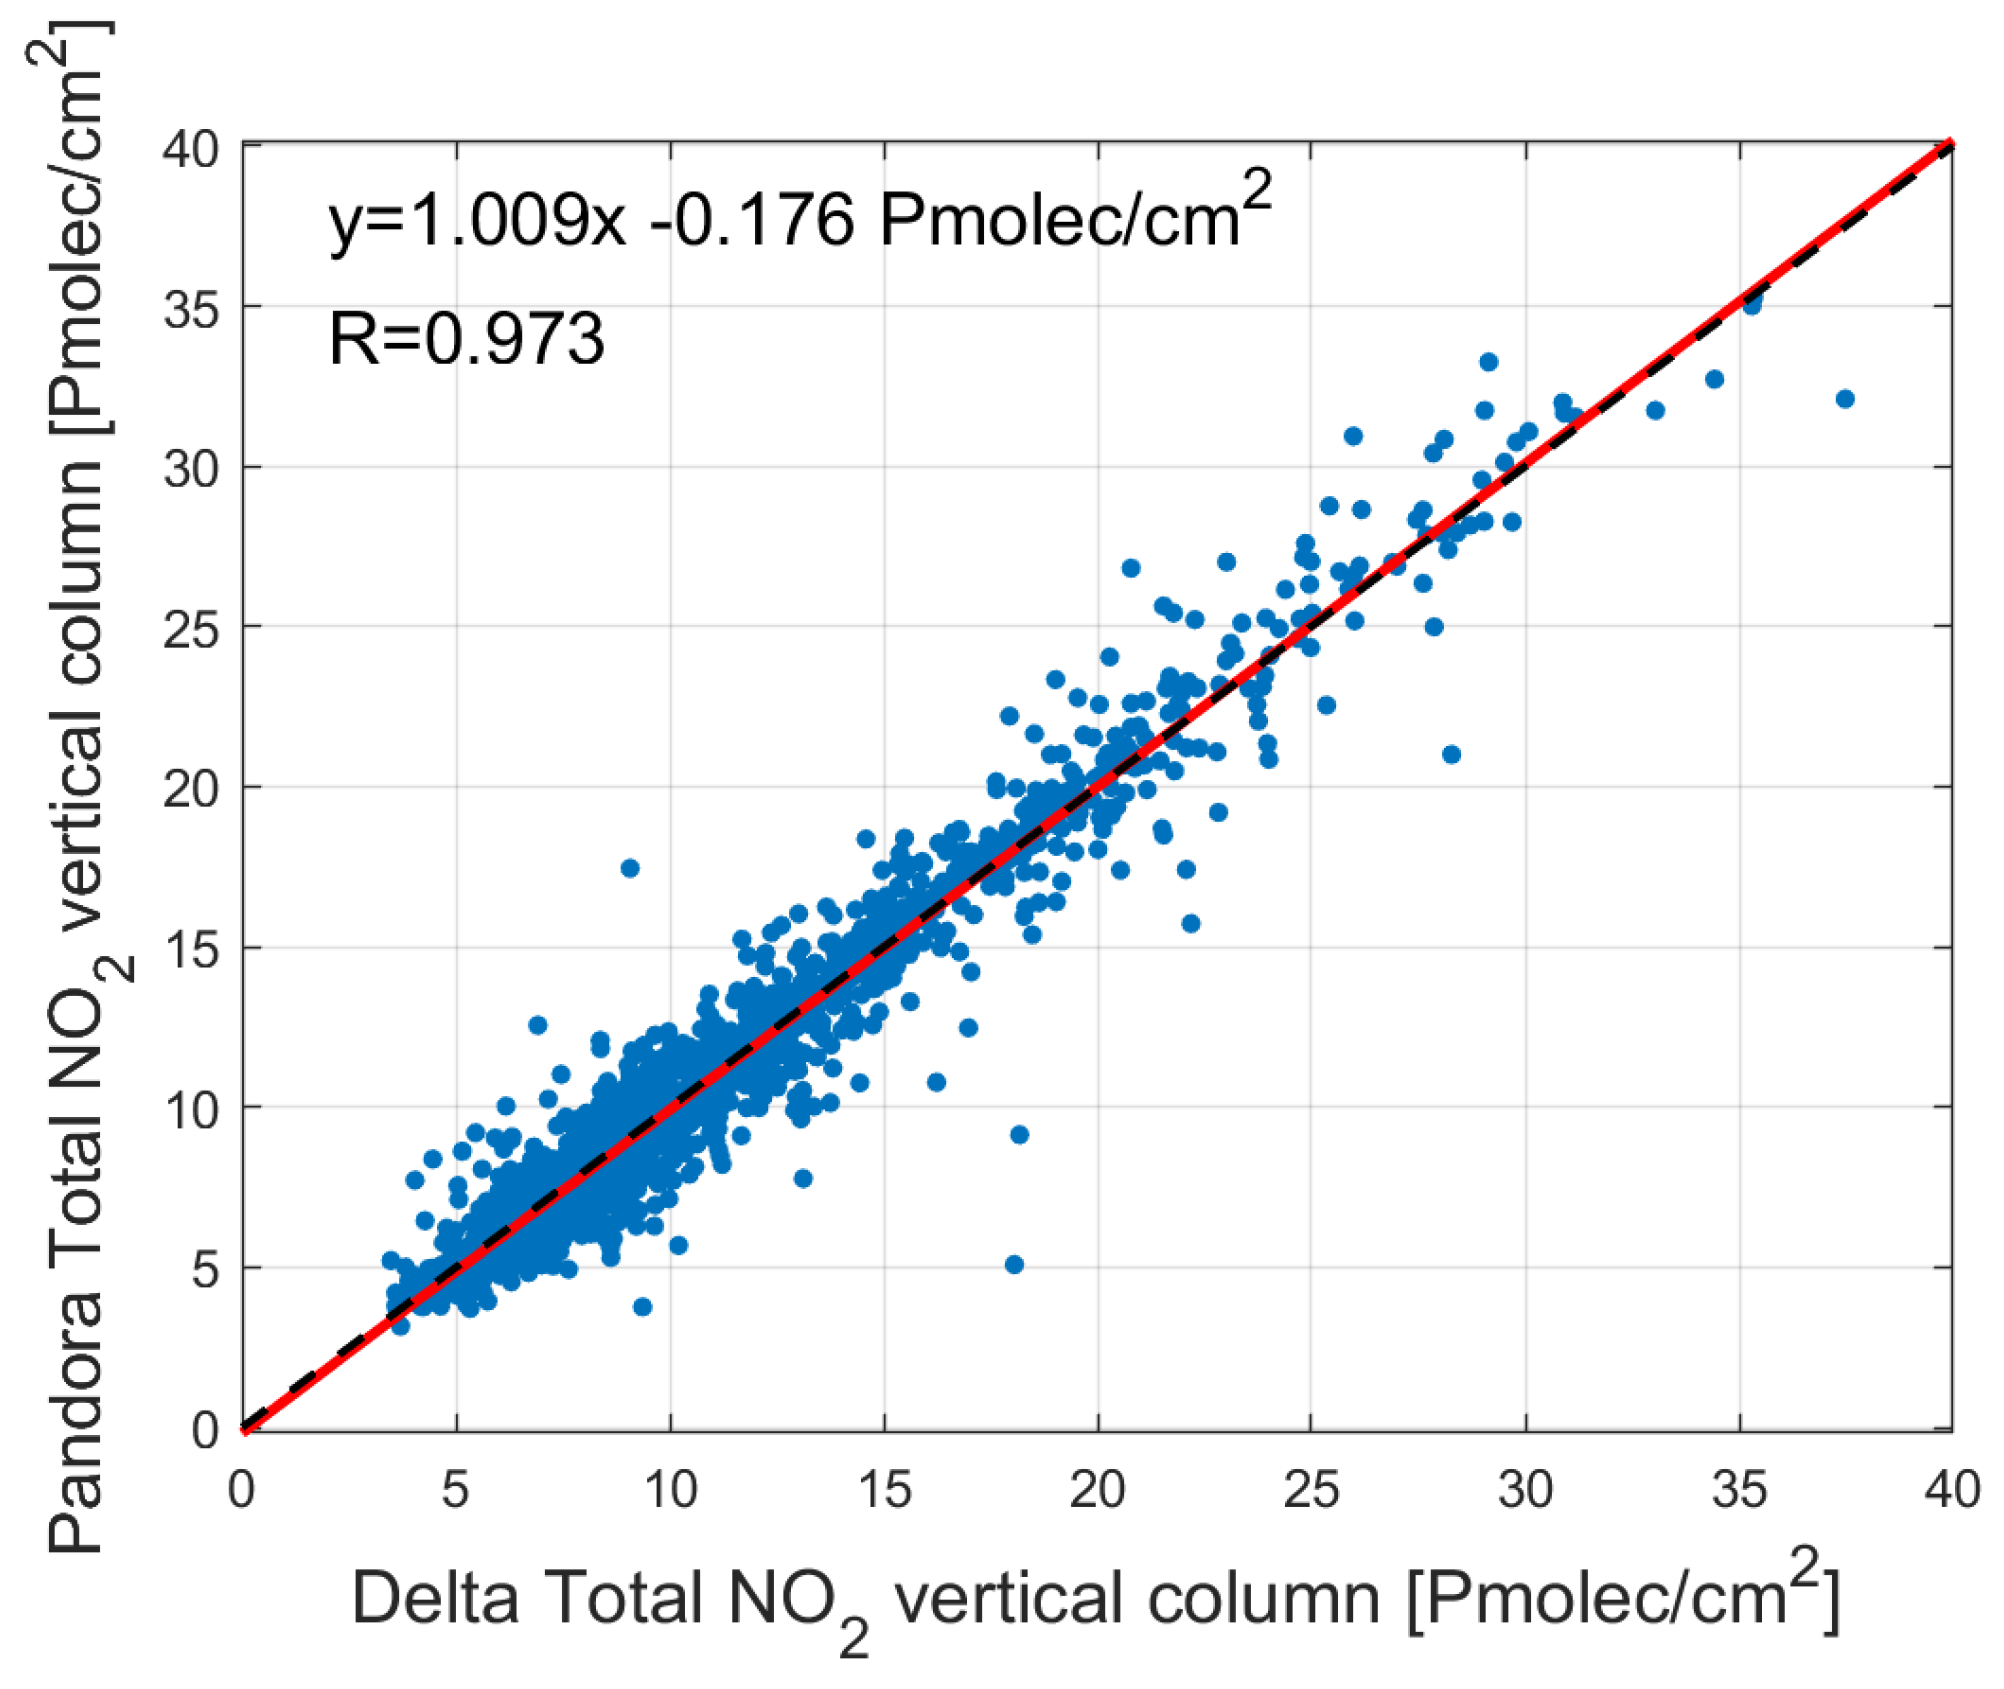
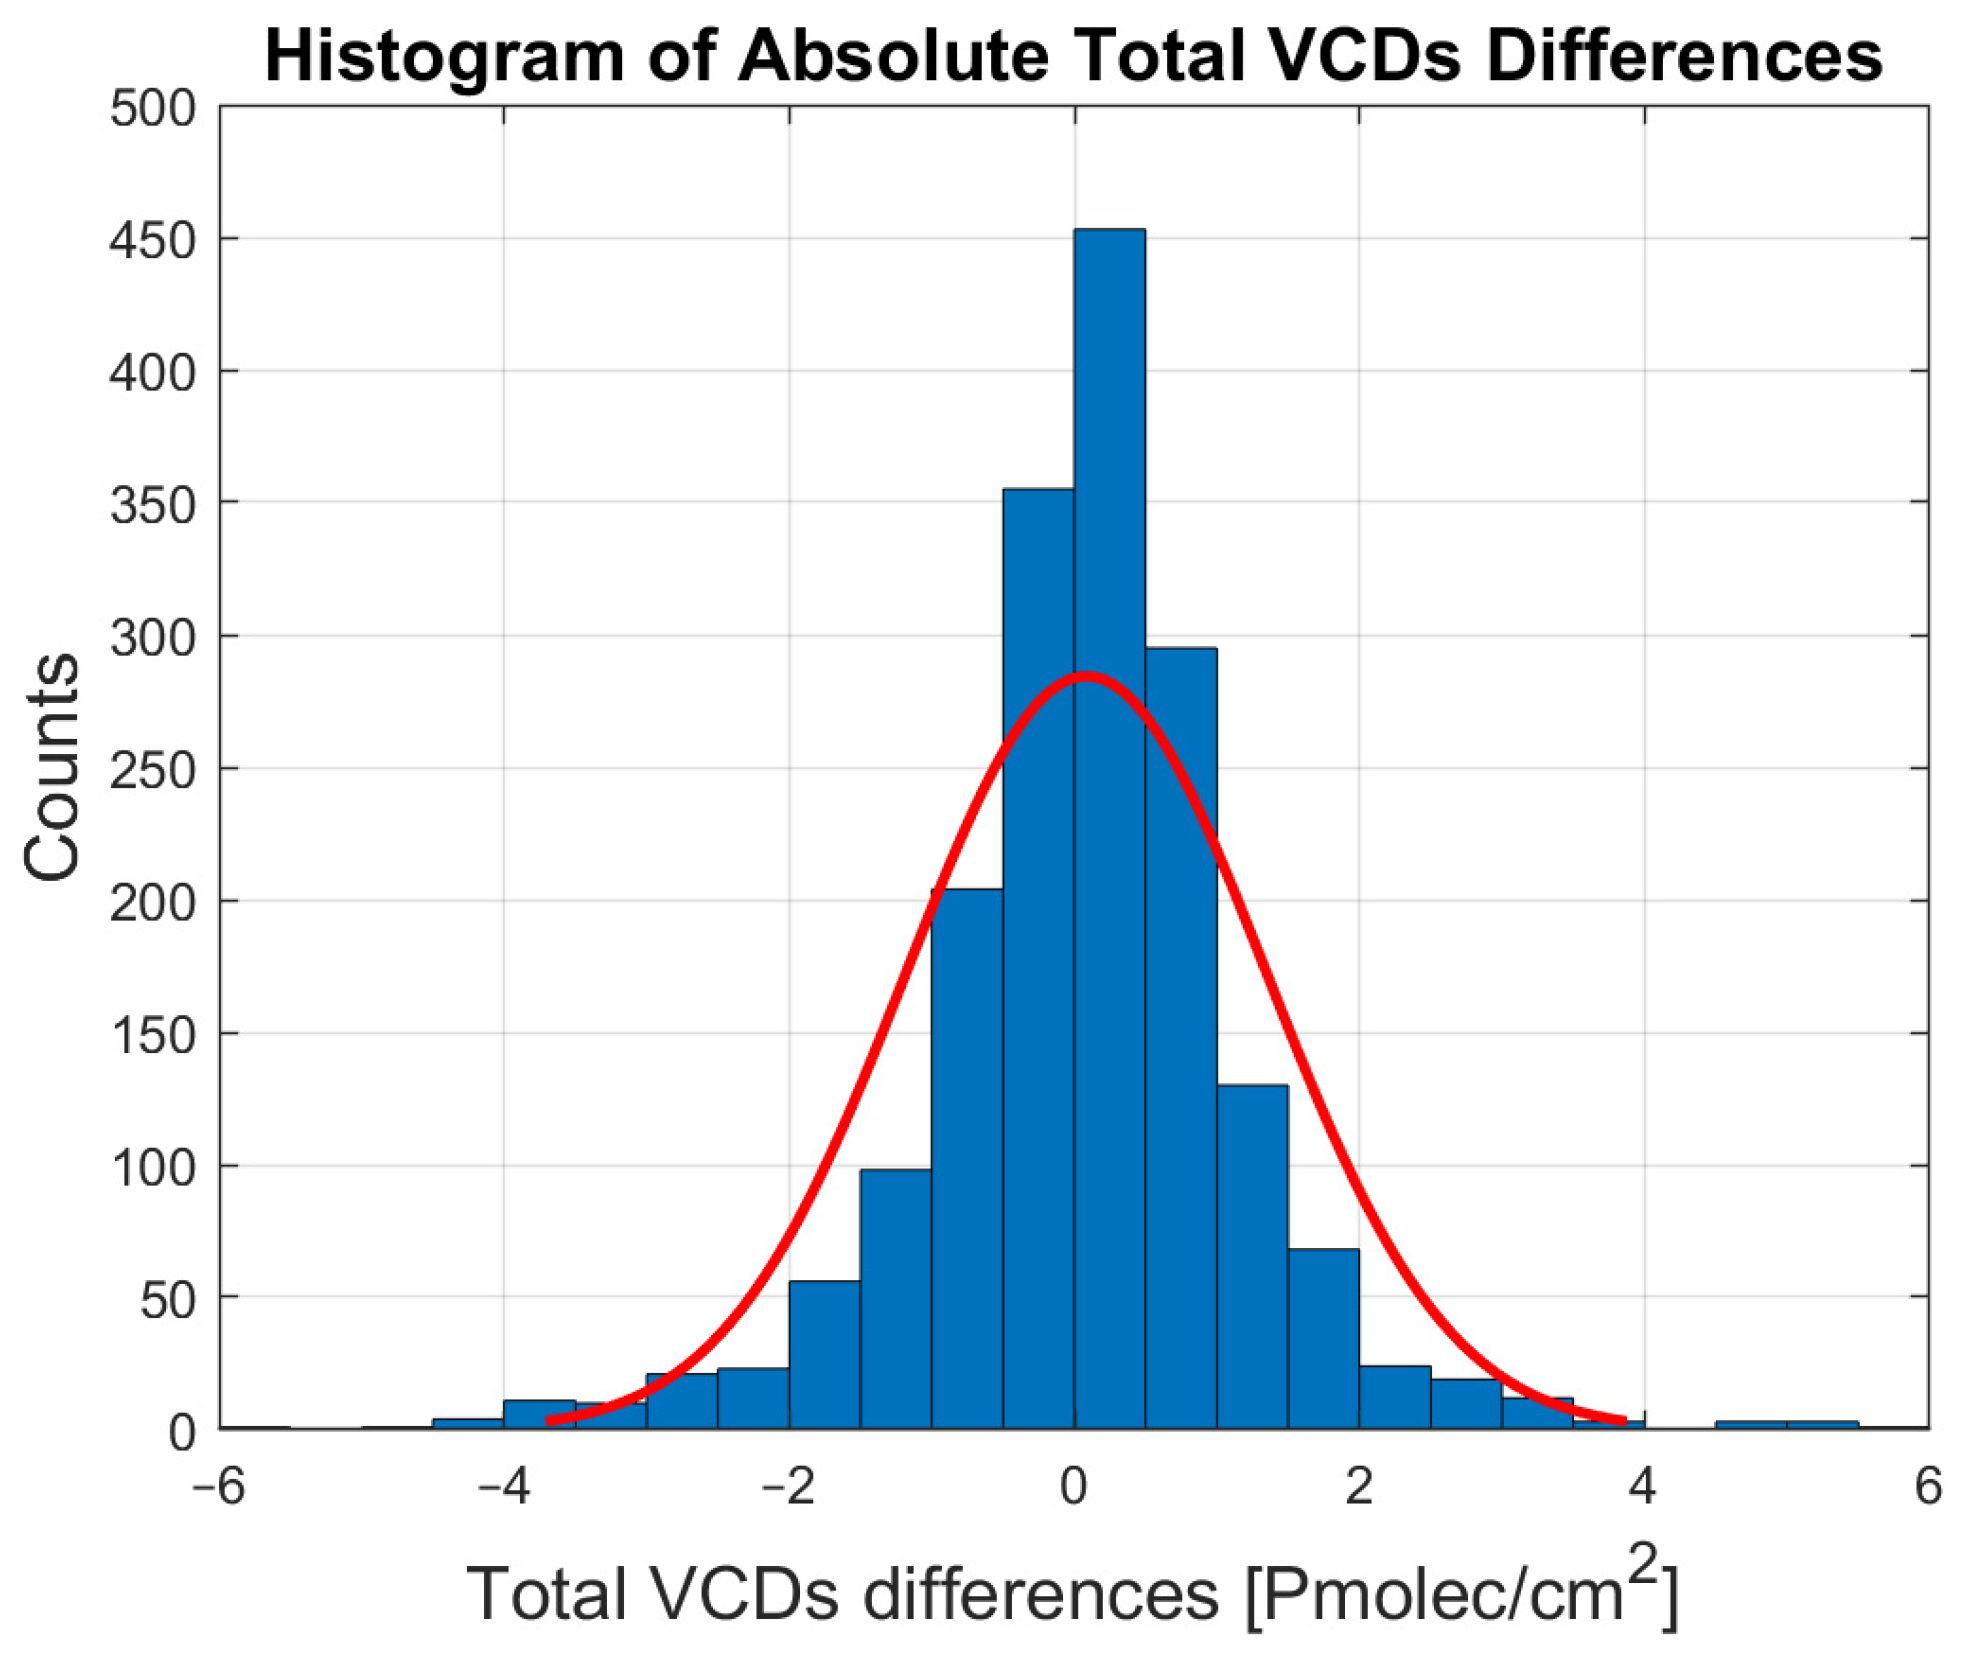
The comparison of the absolute total VCDs from the two systems is visualized in
Figure 3. In
Figure 4, the differences between the absolute total vertical column amounts from the two systems are shown.
The comparison of the total NO2 absolute vertical columns measured by the two systems reveals generally a very good correlation (R ≈ 0.97), with a few outliers. The slope of the linear regression was very close to the ideal value of 1 (1.009) and the offset was close to 0.1 Pmolec/cm2. The points deviating from the ideal line are due to residual noise in the retrieval algorithms and instrumental noise and uncertainties. The distribution of the differences peaks very close to 0.1, which can be explained by the offset value, indicates that more than 95% of the measurements agree to within 0.1 Pmolec/cm2.
5. Conclusions
A methodology for the calculation of the total NO2 column density for a research-grade DOAS system (Delta) operating in Thessaloniki at the Laboratory of Atmospheric Physics, AUTH, was presented. The data from this system were compared to data from a collocated Pandora system that has been operating since September 2022. The comparison of the total ΝO2 vertical column densities between the Pandora and the Delta systems shows a good agreement, taking into account that the two systems are completely independent. As the Pandora system has been validated before delivery in the frame of the Pandonia Global Network, their achieved agreement suggests that the Delta system is reliable regarding its setup and operation, and, along with other products, it can be used to reliably monitor the NO2 total column amounts in Thessaloniki.
Author Contributions
Conceptualization, D.N., D.K. and A.F.B.; methodology, D.N. and A.F.B.; writing—original draft preparation, D.N.; writing—review and editing, D.K. and A.F.B.; visualization, D.N.; supervision, A.F.B. All authors have read and agreed to the published version of the manuscript.
Funding
This research received no external funding.
Institutional Review Board Statement
Not applicable.
Informed Consent Statement
Not applicable.
Data Availability Statement
The data presented in this study are available on request from the corresponding author. The data are not publicly available because they are preliminary retrievals.
Conflicts of Interest
The authors declare no conflict of interest.
References
- Crutzen, P.J.; Heidt, L.E.; Krasnec, J.P.; Pollock, W.H.; Seiler, W. Biomass Burning as a Source of Atmospheric Gases CO, H2, N2O, NO, CH3Cl and COS. Nature 1979, 282, 253–256. [Google Scholar] [CrossRef]
- Brasseur, G.P.; Cox, R.A.; Hauglustaine, D.; Isaksen, I.; Lelieveld, J.; Lister, D.H.; Sausen, R.; Schumann, U.; Wahner, A.; Wiesen, P. European Scientific Assessment of the Atmospheric Effects of Aircraft Emissions. Atmos. Environ. 1998, 32, 2329–2418. [Google Scholar] [CrossRef]
- Air Quality in Europe 2022—European Environment Agency, Web Report. Available online: https://www.eea.europa.eu/publications/air-quality-in-europe-2022 (accessed on 10 May 2023).
- Platt, U.; Stutz, J. Differential Optical Absorption Spectroscopy; Springer: Berlin/Heidelberg, Germany, 2008. [Google Scholar] [CrossRef]
- Liley, J.B.; Johnston, P.V.; McKenzie, R.L.; Thomas, A.J.; Boyd, I.S. Stratospheric NO2 Variations from a Long Time Series at Lauder, New Zealand. J. Geophys. Res. Atmos. 2000, 105, 11633–11640. [Google Scholar] [CrossRef]
- Hönninger, G.; Von Friedeburg, C.; Platt, U. Multi Axis Differential Optical Absorption Spectroscopy (MAX-DOAS). Atmos. Chem. Phys. 2004, 4, 231–254. [Google Scholar] [CrossRef]
- Cede, A.; Herman, J.; Richter, A.; Krotkov, N.; Burrows, J. Measurements of Nitrogen Dioxide Total Column Amounts Using a Brewer Double Spectrophotometer in Direct Sun Mode. J. Geophys. Res. 2006, 111, D05304. [Google Scholar] [CrossRef]
- Zhao, X.; Griffin, D.; Fioletov, V.; McLinden, C.; Davies, J.; Ogyu, A.; Lee, S.C.; Lupu, A.; Moran, M.D.; Cede, A.; et al. Retrieval of Total Column and Surface NO2 from Pandora Zenith-Sky Measurements. Atmos. Chem. Phys. 2019, 19, 10619–10642. [Google Scholar] [CrossRef]
- Herman, J.; Cede, A.; Spinei, E.; Mount, G.; Tzortziou, M.; Abuhassan, N. NO2 Column Amounts from Ground-Based Pandora and MFDOAS Spectrometers Using the Direct-Sun DOAS Technique: Intercomparisons and Application to OMI Validation. J. Geophys. Res. 2009, 114, D13307. [Google Scholar] [CrossRef]
- Vandaele, A.C.; Hermans, C.; Simon, P.C.; Carleer, M.; Colin, R.; Fally, S.; Merienne, M.F.; Jenouvrier, A.; Coquart, B. Measurements of the NO2 Absorption Cross-Section from 42 000 cm−1 to 10 000 cm−1 (238–1000 Nm) at 220 K and 294 K. J. Quant. Spectrosc. Radiat. Transf. 1998, 59, 171–184. [Google Scholar] [CrossRef]
- Bogumil, K.; Orphal, J.; Homann, T.; Voigt, S.; Spietz, P.; Fleischmann, O.C.; Vogel, A.; Hartmann, M.; Kromminga, H.; Bovensmann, H.; et al. Measurements of Molecular Absorption Spectra with the SCIAMACHY Pre-Flight Model: Instrument Characterization and Reference Data for Atmospheric Remote-Sensing in the 230–2380 Nm Region. J. Photochem. Photobiol. A Chem. 2003, 157, 167–184. [Google Scholar] [CrossRef]
- Thalman, R.; Volkamer, R. Temperature Dependent Absorption Cross-Sections of O2–O2 Collision Pairs between 340 and 630 Nm and at Atmospherically Relevant Pressure. Phys. Chem. Chem. Phys. 2013, 15, 15371–15381. [Google Scholar] [CrossRef] [PubMed]
- Spietz, P.; Martín, J.C.; Burrows, J.P. Spectroscopic Studies of the I2/O3 Photochemistry: Part 2. Improved Spectra of Iodine Oxides and Analysis of the IO Absorption Spectrum. J. Photochem. Photobiol. A Chem. 2005, 176, 50–67. [Google Scholar] [CrossRef]
- Saiz-Lopez, A.; Saunders, R.W.; Joseph, D.M.; Ashworth, S.H.; Plane, J.M. Absolute Absorption Cross-Section and Photolysis Rate of I2. Atmos. Chem. Phys. 2004, 4, 1443–1450. [Google Scholar] [CrossRef]
| Disclaimer/Publisher’s Note: The statements, opinions and data contained in all publications are solely those of the individual author(s) and contributor(s) and not of MDPI and/or the editor(s). MDPI and/or the editor(s) disclaim responsibility for any injury to people or property resulting from any ideas, methods, instructions or products referred to in the content. |
© 2023 by the authors. Licensee MDPI, Basel, Switzerland. This article is an open access article distributed under the terms and conditions of the Creative Commons Attribution (CC BY) license (https://creativecommons.org/licenses/by/4.0/).


