1. Introduction
Heterogeneous ice formation is an important process in aerosol–cloud interaction. Solid aerosol particles trigger the nucleation of ice crystals at relatively high temperatures from 0 to about −35 °C usually via heterogeneous freezing and nucleation mechanisms. At these temperatures, ice formation (and the formation of mixed-phase clouds) is not possible without the assistance of ice-nucleating particles (INPs). Even at lower temperatures (from −40 to −65 °C), at which homogeneous freezing usually dominates, heterogeneous ice nucleation with dust and soot particles can have a strong impact at relative humidities (RHs) of ice, with an RHi of <140–150% on the evolution and lifetime of tropospheric clouds.
Cyprus, in the centre of the eastern Mediterranean region, offers favourable conditions for atmospheric and climate research, especially in the field of cloud and precipitation formation, with a focus on the influence of natural (desert dust, soil dust, and marine particles) and anthropogenic aerosols (urban haze and biomass burning smoke) on these processes. The island exhibits Middle Eastern atmospheric and climate conditions, and its air quality is strongly affected by a mixture of urban haze originating mainly from urban and industrial conglomerations in southeastern Europe, but also from the Middle East and northern Africa. There are very few locations on Earth which experience such complex aerosol structures, vertical layering, and mixtures, which can sensitively influence cloud evolution and precipitation processes.
In this article here, we discuss lidar observations of ice clouds that were generated in aged North American wildfire smoke layers at the tropopause. The measurements were performed in Limassol, Cyprus, in the Eastern Mediterranean in October–November 2020. Ice nucleation started in the lowest part of these smoke layers (just below the tropopause). The freshly nucleated ice crystals formed extended fields of long fall streaks (virga). The simultaneous occurrence of smoke layers together with intense cirrus features is a strong sign that smoke particles served as the dominant INPs.
2. Dataset and Methodology
2.1. Cyprus Atmospheric Remote Sensing Observatory
An aerosol multiwavelength polarization Raman lidar Polly system (POrtabLe Lidar sYstem) [
1] and a wind doppler lidar system currently operate at the Cyprus Atmospheric Remote Sensing Observatory (CARO) of the Eratosthenes Centre of Excellence in Limassol (34.677° N, 33.0375° E, and 2.8 m above sea level, a.s.l.) for the continuous vertical profiling of aerosols and wind. The observatory is expected to be fully operational by 2024, with a containerized cloud radar, microwave radiometer, and a disdrometer used for cloud and precipitation monitoring. The fully equipped station will allow in depth studies of the interaction between aerosols, clouds, precipitation, and atmospheric dynamics in the highly polluted eastern Mediterranean region, where complex mixtures of desert and soil dust, biogenic particle components, and anthropogenic haze regularly occur [
2,
3,
4]. CARO is the planned ACTRIS (Aerosols, Clouds and Trace gases Research InfraStructure) National Facility of the Republic of Cyprus for the remote sensing of aerosols and clouds, and the Limassol lidar station is part of PollyNET, a network of continuously operated Polly lidar stations [
5]. In addition, a sun photometer has been operated in Limassol since 2010 in the framework of AERONET (Aerosol Robotic Network, CUT-TEPAK station) [
6,
7].
2.2. The Methodology
In this study, the profiles of the 532 nm particle backscatter coefficients at the smoke and cirrus height levels retrieved by the PollyXT lidar system in Limassol were used. The so-called Klett–Fernald method [
8,
9] allows the determination of the backscatter coefficient profiles from strong elastic backscatter signal profiles. The prior lidar ratio given as the input may cause the relative uncertainty in the order of 20–40%. In contrast, the Raman lidar method [
10] does not need critical input parameters, and thus, is more accurate; to keep the influence of enhanced signal noise low, longer vertical smoothing and longer signal averaging times are required when using this method.
The POLIPHON (POlarization LIdar PHOtometer Networking) method [
11,
12] enables us to retrieve aerosol-type-dependent microphysical products from the measured height profiles of the particle backscatter coefficient and to estimate cloud-process-relevant properties, such as CCN and INP concentrations. A detailed view of the POLIPHON potential regarding dust and wildfire smoke retrievals is given in [
13,
14]. In this study, we make use of the conversion of 532 nm backscatter coefficients into particle surface area concentration (s) and particle number concentration (n250) (number concentration of particles with radius >250 nm). S is the smoke input parameter in the INP parameterization, which is described in the next section, and n250 can be regarded as a rough proxy for the INP reservoir (available particles that could potentially be activated as INP). The relationships given in [
12,
14] are used to calculate s and n250 with the extinction-to-surface-area conversion factor cs and the extinction-to-number conversion factor c250 for 532 nm equal to 1.75 Mm μm
2 cm
−3 and 0.35 Mm cm
−3, respectively, as is indicated for strongly light-absorbing smoke particles. Considering an uncertainty of 25% in the conversion factors and a lidar ratio uncertainty of about 15–20%, we can obtain the microphysical properties with a relative uncertainty of about 30%.
3. Observations
3.1. Smoke Identifications and Optical Properties
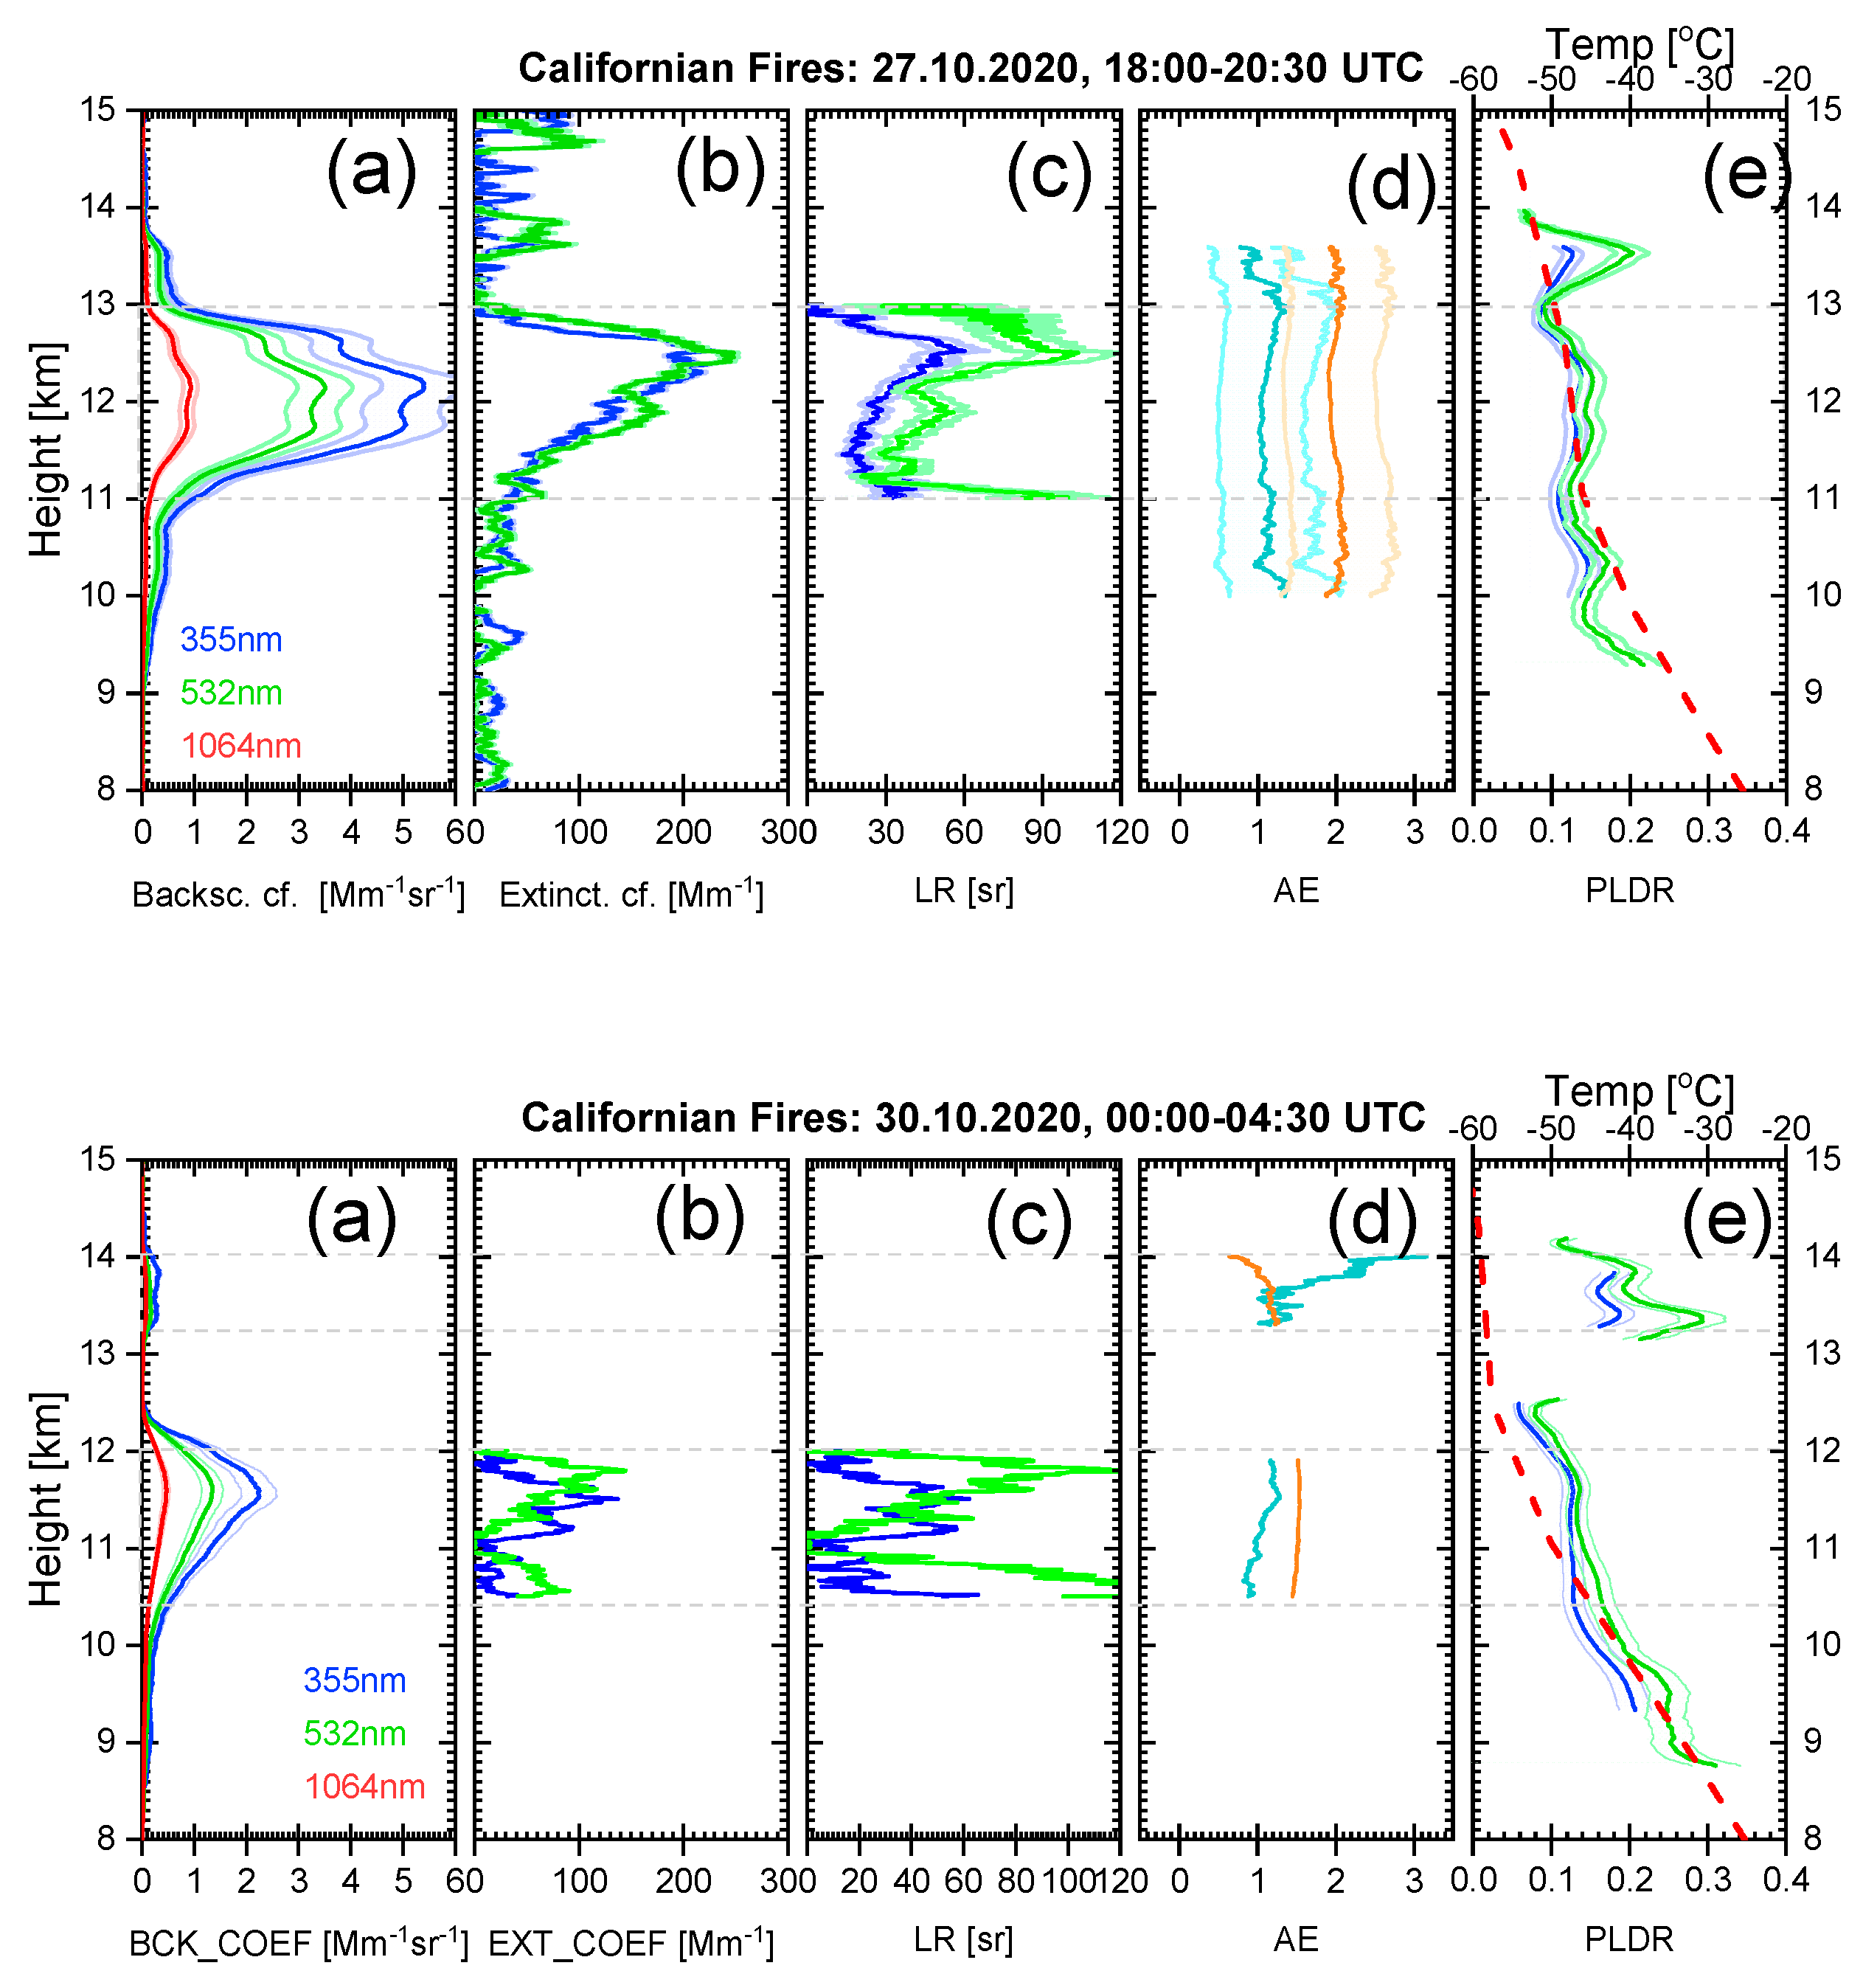
From 21 October to 3 November 2020, extended North American wildfire smoke layers crossed the Mediterranean Basin from Portugal to Cyprus in the altitude range of 6–14 km asl [
15]. The smoke originated from large wildfires in California, USA, and travelled for 8 days before reaching Europe. The top of
Figure 1 top shows the smoke measurements taken with the Polly instrument in Cyprus on 27 October 2020, and the bottom of
Figure 1 shows the smoke layers on 30 October 2020 [
16]. Weak aerosol structures are visible at 6–11 km asl, and pronounced layers were detected in the altitude range of 11–14 km asl.
The strong wavelength dependence of the backscatter coefficient and the respective high-level backscatter Ångström exponents of 1–2 and the weak wavelength dependence of the extinction coefficient are typical for aged, strongly light-absorbing wildfire smoke particles. In the optically thickest part at 12–13 km asl with the highest particle extinction coefficients, the lidar ratio was about 70–90 sr at 532 nm and 50–60 sr at 355 nm. This inverse spectral dependence of the lidar ratio is characteristic for aged wildfire smoke [
17]. The main smoke layer was above the tropopause.
The enhanced particle depolarization ratio of 0.1-0.15 at both wavelengths indicates non-spherical particles.
3.2. Ice Nucleation in Smoke Layers
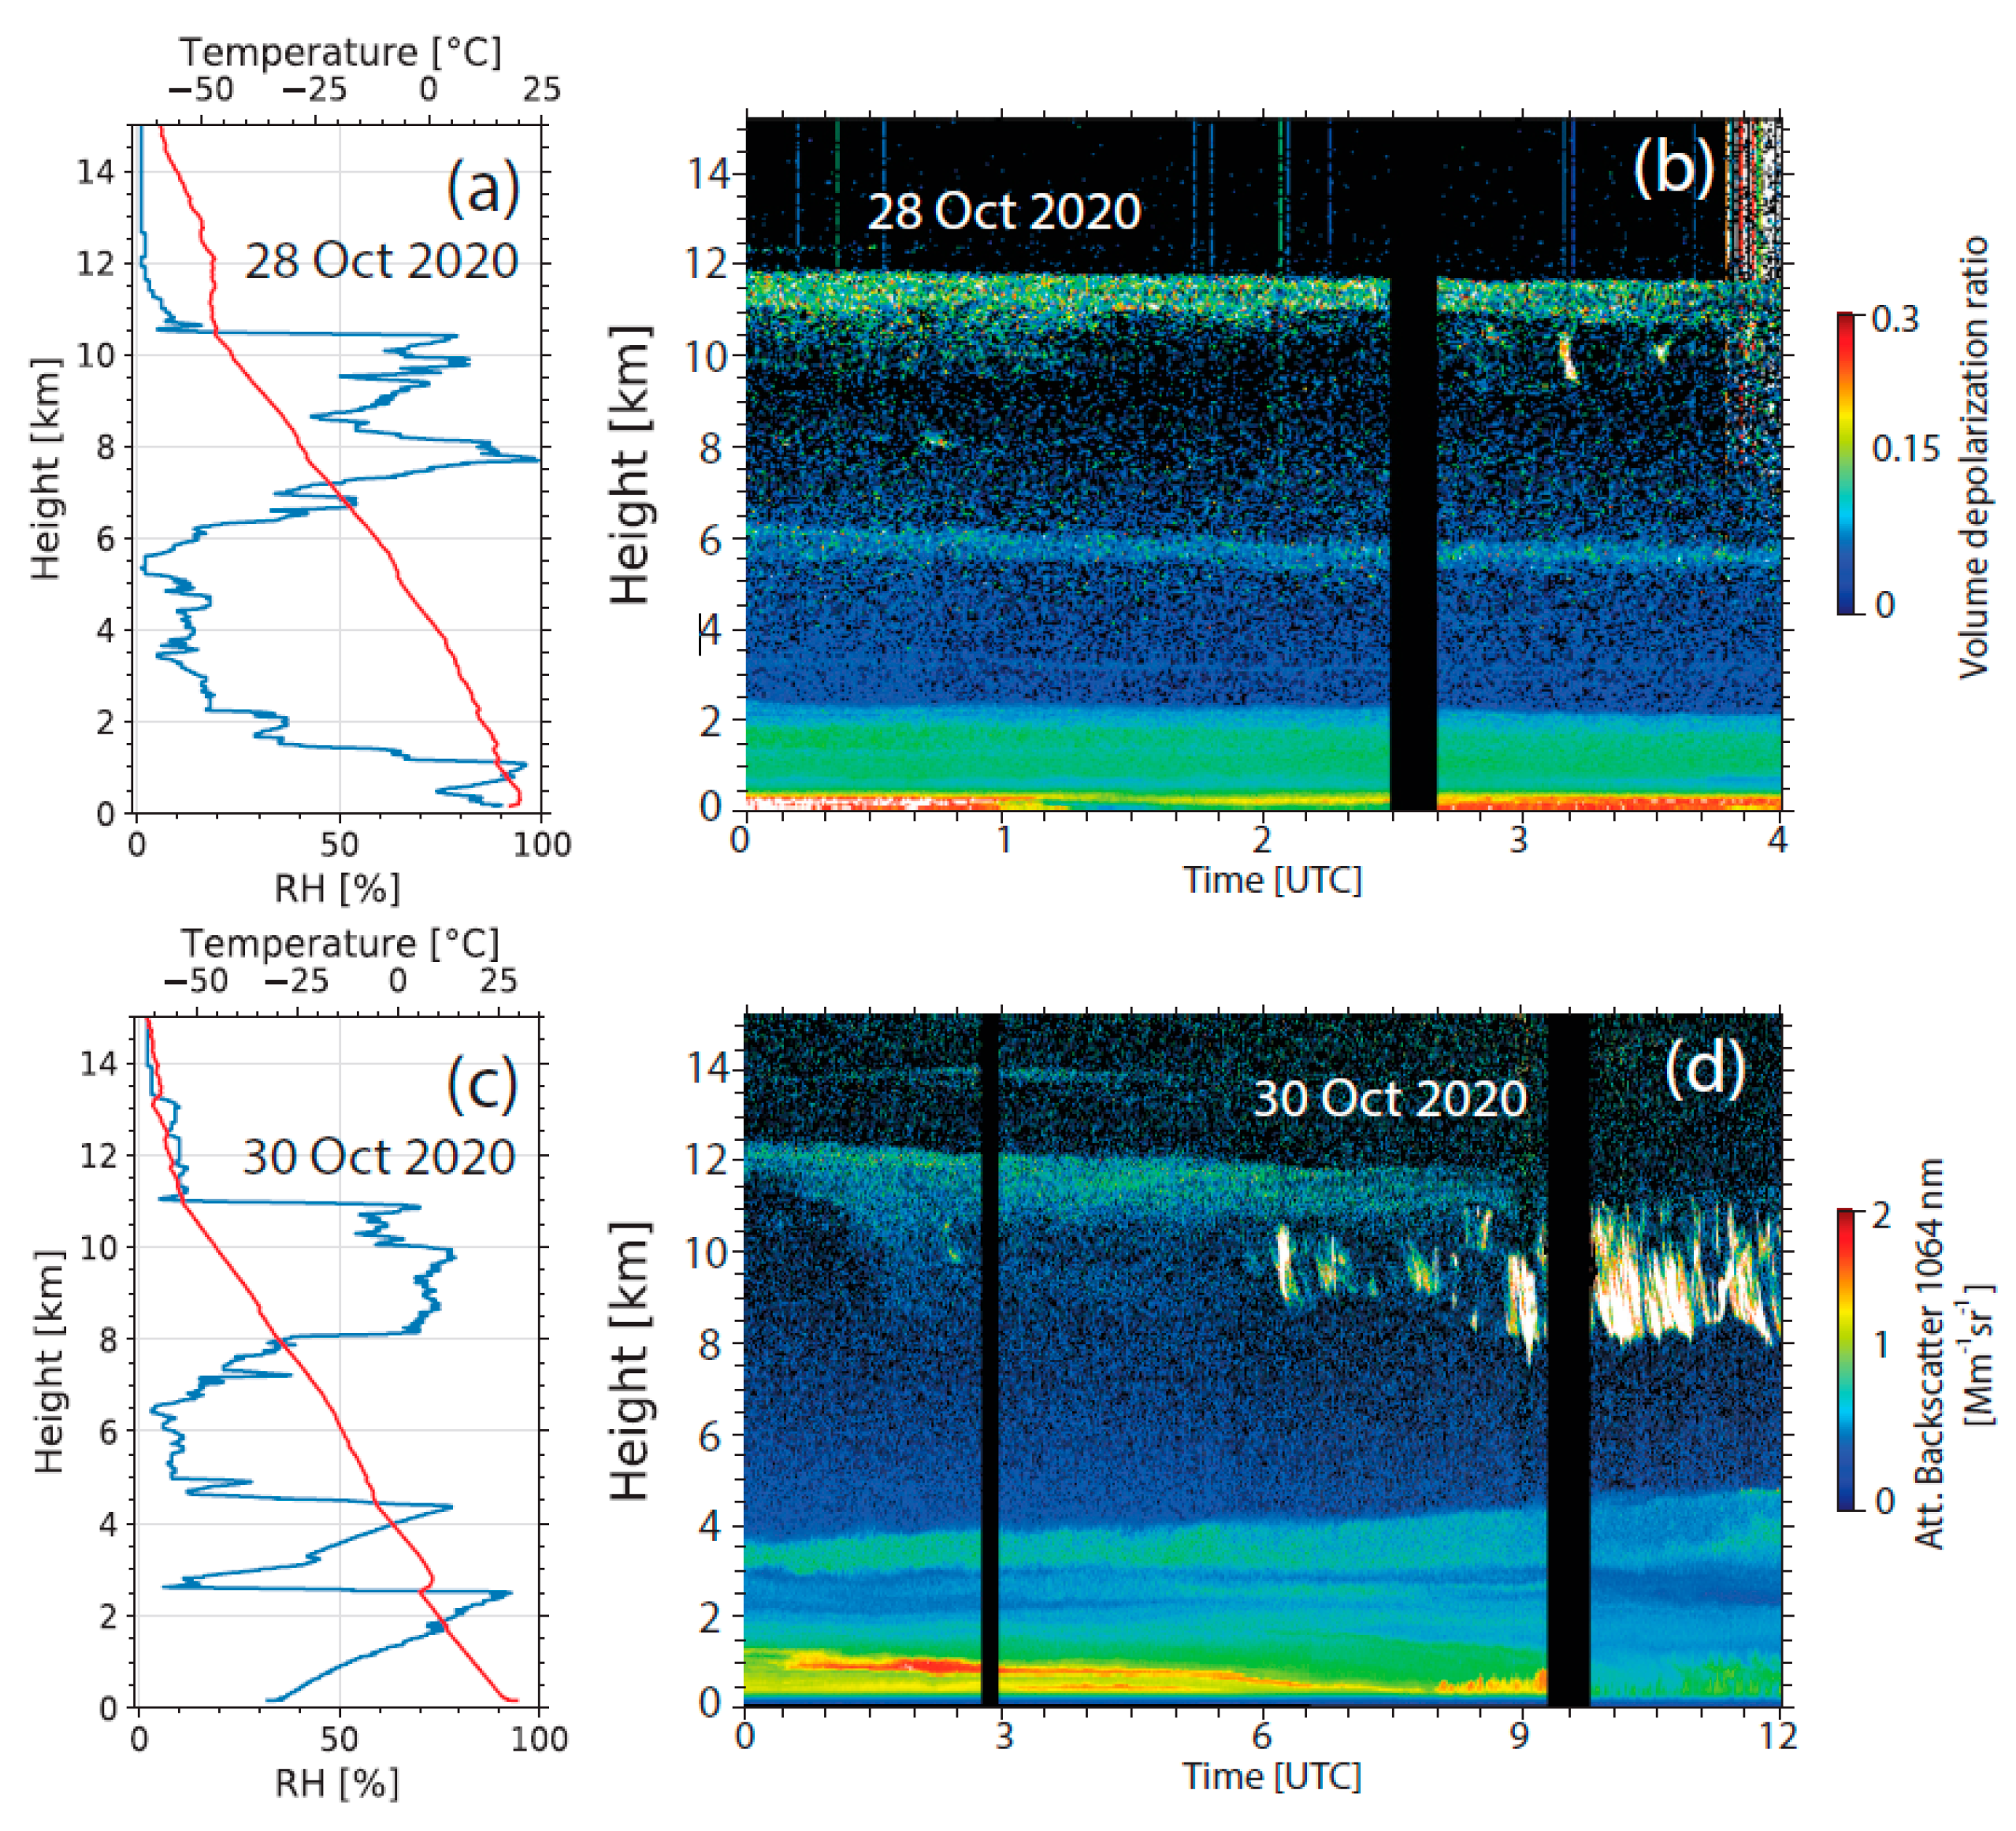
On 28 and 30 October 2020, ice clouds developed at the tropopause over Cyprus. Data from Athalassa’s Radiosondes Station 17607 (35.14° N, 33.39° E, and 160 m a.s.l.) in Nicosia, Cyprus, were used in this study for the estimation of the tropopause heights. The sonde measures the pressure, temperature, dew point, horizontal wind velocity, and direction (Nicosia-Athalassa-RS, 2023). The radiosonde station is 61.4 km northeast of CARO.
The main smoke layer was located between the tropopause and 12–12.5 km asl on these two days, as shown in
Figure 2b,d. The sharp drop in the RH profiles in
Figure 2a,c at 10.5 km (28 October) and 11 km (30 October) indicates the tropopause. The volume depolarization ratio is shown in
Figure 2b to better identify the smoke layers at 10–12 km and at 6 km asl on this day. The white, tilted column-like features in
Figure 2b,d are ice virga consisting of falling ice crystals. The nucleation of ice crystals on smoke particles most probably started at the top of the humid layer in the coldest part of the troposphere (at temperatures from −47 to −53 °C).
These ice crystals grew fast in supersaturated air and immediately started to fall. Well-structured coherent virga are formed by these crystals. Hexagonal ice crystals cause strong depolarization ratios around 40%. The virga are visible as long as the RH is high so that the sublimation of ice crystals, even in subsaturated air, is slow or prohibited.
Cirrus formation intensified on 30 October from 6 UTC to 12 UTC, and the optical depth of the virga increased so that the smoke layer above the virga is no longer visible in
Figure 2d (after 9:45 UTC). The colour plot is based on the lidar profiles measured with 7.5 m vertical and 30 s temporal resolutions. Averaging the signal profiles over, e.g., 15–20 min and vertical smoothing with window lengths of 150–750 m are required to resolve the entire cirrus and smoke layer structures up to the smoke layer top.
Strong ice nucleation and virga evolution were observed over many hours in the evening of 30 October 2020 (not shown here).
3.3. Conclusions
In this study, we present lidar observations in Limassol, Cyprus, in the eastern Mediterranean region that shown clear evidence of the impact of wildfire smoke on cirrus formation in the tropopause region from −47 to −53 °C. Optically dense smoke layers crossed the Mediterranean Basis in October–November 2020.
This analysis was based on the application of a specific INP parameterization developed for organic aerosol particles to describe the ice-nucleating efficiency of aged wildfire smoke particles. This work will be further extended with respect to gravity waves simulation analysis (publication under preparation: [
18]). We will continue our research not only analysing lidar observations, but the lidar-derived INP estimates in addition to combine radar–lidar observations for the estimation of the ice crystal number concentration following the methodology presented in [
19,
20].
Author Contributions
Conceptualization, R.-E.M. and A.A.; methodology, R.-E.M. and A.A.; visualization, R.-E.M.; writing—original draft preparation, R.-E.M.; project administration, A.N. and D.G.H.; funding acquisition, D.G.H.; R.-E.M., A.N. and D.E. were involved in the operation and maintenance of the station. All authors have read and agreed to the published version of the manuscript.
Funding
This research was funded by the ‘EXCELSIOR’: ERATOSTHENES: EΧcellence Research Centre for Earth Surveillance and Space-Based Monitoring of the Environment H2020 Widespread Teaming project (
www.excelsior2020.eu (accessed on 30 August 2023)) The ‘EXCELSIOR’ project has received funding from the European Union’s Horizon 2020 research and innovation programme under Grant Agreement No 857510 from the Government of the Republic of Cyprus through the Directorate General for the European Programmes, Coordination and Development and the Cyprus University of Technology. The study is also supported by the “ACCEPT” project (Prot. No: LOCALDEV-0008), which is co-financed by the Financial Mechanism of Norway (85%) and the Republic of Cyprus (15%) in the framework of the programming period 2014–2021.
Institutional Review Board Statement
Not applicable.
Informed Consent Statement
Not applicable.
Data Availability Statement
Polly lidar observations (level 0 data, measured signals) are from the PollyNet database (PollyNET, 2023). All the analysis products are available upon request. Radiosonde data (Nicosia-Athalassa) are available at on a daily basis from the WMO Information System Portal through the link
https://gisc.dwd.de/wisportal/ (accessed on 30 August 2023). AERONET observational data were downloaded from the respective databases (10 June 2023).
Acknowledgments
The authors acknowledge the Nicosia-Athalassa radiosonde station for excellent radiosonde observations and especially to Demitris Charalambous, Meteorology Officer at the Cyprus Department of Meteorology for the provision of historic data.
Conflicts of Interest
The authors declare no conflict of interest.
References
- Engelmann, R.; Kanitz, T.; Baars, H.; Heese, B.; Althausen, D.; Skupin, A.; Wandinger, U.; Komppula, M.; Stachlewska, I.S.; Amiridis, V.; et al. The automated multiwavelength Raman polarization and water-vapor lidar PollyXT: The neXT generation. Atmos. Meas. Tech. 2016, 9, 1767–1784. [Google Scholar] [CrossRef]
- Nisantzi, A.; Mamouri, R.E.; Ansmann, A.; Hadjimitsis, D. Injection of mineral dust into the free troposphere during fire events observed with polarization lidar at Limassol, Cyprus. Atmos. Chem. Phys. 2014, 14, 12155–12165. [Google Scholar] [CrossRef]
- Rogozovsky, I.; Ansmann, A.; Althausen, D.; Heese, B.; Engelmann, R.; Hofer, J.; Baars, H.; Schechner, Y.; Lyapustin, A.; Chudnovsky, A. Impact of aerosol layering, complex aerosol mixing, and cloud coverage on high-resolution MAIAC aerosol optical depth measurements: Fusion of lidar, AERONET, satel- lite, and ground-based measurements. Atmos. Environ. 2021, 247, 118163. [Google Scholar] [CrossRef]
- Heese, B.; Floutsi, A.A.; Baars, H.; Althausen, D.; Hofer, J.; Herzog, A.; Mewes, S.; Radenz, M.; Schechner, Y.Y. The vertical aerosol type distribution above Israel—2 years of lidar observations at the coastal city of Haifa. Atmos. Chem. Phys. 2022, 22, 1633–1648. [Google Scholar] [CrossRef]
- Baars, H.; Kanitz, T.; Engelmann, R.; Althausen, D.; Heese, B.; Komppula, M.; Preißler, J.; Tesche, M.; Ansmann, A.; Wandinger, U.; et al. An overview of the first decade of PollyNET: An emerging network of automated Raman-polarization lidars for continuous aerosol profiling. Atmos. Chem. Phys. 2016, 16, 5111–5137. [Google Scholar] [CrossRef]
- Holben, B.N.; Eck, T.F.; Slutsker, I.; Tanré, D.; Buis, J.P.; Setzer, A.; Vermote, E.; Reagan, J.A.; Kaufman, Y.J.; Nakajima, T.; et al. AERONET—A federated instrument network and data archive for aerosol characterization. Remote Sens. Environ. 1998, 66, 1–16. [Google Scholar] [CrossRef]
- AERONET: Aerosol Robotic Network Aerosol Data Base. 2023. Available online: http://aeronet.gsfc.nasa.gov/ (accessed on 27 March 2023).
- Klett, J.D. Stable Analytic Inversion Solution for Processing Lidar Returns. Appl. Opt. 1981, 20, 211–220. [Google Scholar] [CrossRef] [PubMed]
- Fernald, F.G. Analysis of atmospheric lidar observations: Some comments. Appl. Opt. 1984, 23, 652–653. [Google Scholar] [CrossRef] [PubMed]
- Ansmann, A.; Wandinger, U.; Riebesell, M.; Weitkamp, C.; Michaelis, W. Independent measurement of extinction andbackscatter profiles in cirrus clouds by using a combined Raman elastic–backscatter lidar. Appl. Opt. 1992, 31, 7113–7131. [Google Scholar] [CrossRef] [PubMed]
- Mamouri, R.-E.; Ansmann, A. Potential of polarization lidar to provide profiles of CCN- and INP-relevant aerosol parameters. Atmos. Chem. Phys. 2016, 16, 5905–5931. [Google Scholar] [CrossRef]
- Mamouri, R.-E.; Ansmann, A. Potential of polarization/Raman lidar to separate fine dust, coarse dust, maritime, and anthropogenic aerosol profiles. Atmos. Meas. Tech. 2017, 10, 3403–3427. [Google Scholar] [CrossRef]
- Ansmann, A.; Mamouri, R.-E.; Hofer, J.; Baars, H.; Althausen, D.; Abdullaev, S.F. Dust mass, cloud condensation nuclei, and icenucleating particle profiling with polarization lidar: Updated POLIPHON conversion factors from global AERONET analysis. Atmos. Meas. Tech. 2019, 12, 4849–4865. [Google Scholar] [CrossRef]
- Ansmann, A.; Ohneiser, K.; Mamouri, R.-E.; Knopf, D.A.; Veselovskii, I.; Baars, H.; Engelmann, R.; Foth, A.; Jimenez, C.; Seifert, P.; et al. Tropospheric and stratospheric wildfire smoke profiling with lidar: Mass, surface area, CCN, and INP retrieval. Atmos. Chem. Phys. 2021, 21, 9779–9807. [Google Scholar] [CrossRef]
- Michailidis, K.; Koukouli, M.-E.; Balis, D.; Veefkind, J.P.; de Graaf, M.; Mona, L.; Papagianopoulos, N.; Pappalardo, G.; Tsikoudi, I.; Amiridis, V.; et al. Validation of the TROPOMI/S5P aerosol layer height using EARLINET lidars. Atmos. Chem. Phys. 2023, 23, 1919–1940. [Google Scholar] [CrossRef]
- PollyNET: PollyNET Lidar Data Base. 2023. Available online: http://polly.tropos.de/ (accessed on 24 April 2023).
- Haarig, M.; Ansmann, A.; Baars, H.; Jimenez, C.; Veselovskii, I.; Engelmann, R.; Althausen, D. Depolarization and lidar ratios at 355, 532, and 1064 nm and microphysical properties of aged tropospheric and stratospheric Canadian wildfire smoke. Atmos. Chem. Phys. 2018, 18, 11847–11861. [Google Scholar] [CrossRef]
- Mamouri, R.-E.; Ansmann, A.; Ohneiser, K.; Knopf, D.A.; Nisantzi, A.; Bühl, J.; Engelmann, R.; Skupin, A.; Seifert, P.; Baars, H.; et al. Wildfire smoke triggers cirrus formation: Lidar observations over the Eastern Mediterranean (Cyprus). EGUsphere 2023. [Google Scholar] [CrossRef]
- Bühl, J.; Seifert, P.; Radenz, M.; Baars, H.; Ansmann, A. Ice crystal number concentration from lidar, cloud radar and radar wind profiler measurements. Atmos. Meas. Tech. 2019, 12, 6601–6617. [Google Scholar] [CrossRef]
- Ansmann, A.; Mamouri, R.-E.; Bühl, J.; Seifert, P.; Engelmann, R.; Hofer, J.; Nisantzi, A.; Atkinson, J.D.; Kanji, Z.A.; Sierau, B.; et al. Ice-nucleating particle versus ice crystal number concentration in altocumulus and cirrus layers embedded in Saharan dust: A closure study. Atmos. Chem. Phys. 2019, 19, 15087–15115. [Google Scholar] [CrossRef]
| Disclaimer/Publisher’s Note: The statements, opinions and data contained in all publications are solely those of the individual author(s) and contributor(s) and not of MDPI and/or the editor(s). MDPI and/or the editor(s) disclaim responsibility for any injury to people or property resulting from any ideas, methods, instructions or products referred to in the content. |
© 2023 by the authors. Licensee MDPI, Basel, Switzerland. This article is an open access article distributed under the terms and conditions of the Creative Commons Attribution (CC BY) license (https://creativecommons.org/licenses/by/4.0/).


 and
and 