Abstract
Windblown dust plays a crucial role in the Earth system, impacting climate, ecosystems, human activities, and health. The spatiotemporal evolution of dust plumes during transport is determined by wind, the primary driver of dust emission. In this study, we utilize outputs from the ECMWF-IFS, assimilating quality-assured Aeolus wind profiles, to initialize dust simulations with the WRF-Chem model. The aim is to assess the impact of Aeolus wind observations on modeling the desert dust cycle. Focusing on the ASKOS/JATAC campaign in September 2021 near Cabo Verde, we qualitatively and quantitatively evaluate the simulated dust-related outputs, revealing that even small differences in wind significantly affect the simulated dust emission rates and dust optical depth.
1. Introduction
Strong desert winds mobilize substantial quantities of dust aerosols, which are transported across various distances and directions. Quantifying the contribution of dust components to the total budget remains uncertain due to the complex mechanisms involved [1]. The “dust belt” [2] from the western Sahara to East Asia serves as major global dust sources, with northern African deserts contributing about 55% and the Middle East 15–20% [3]. The ALADIN instrument, onboard ESA’s Aeolus satellite, is capable of enhancing weather forecasts and atmospheric dynamics understanding, including dust transport. Assimilating Aeolus wind profiles into numerical models shows positive impacts on short- and medium-term forecasts [4] This study investigates the potential improvements in the WRF-Chem dust simulation performance using Aeolus wind profiles and evaluates its performance against the LIVAS pure dust dataset during the ASKOS/JATAC campaign [5].
2. Data and Methodology
2.1. Aeolus Winds Assimilation in IFS Datasets
Numerical experiments in this study utilized the WRF model with meteorological fields from ECMWF’s Integrated Forecasting System. Two sets of outputs are used: a control run and an experimental run. The experimental run incorporated Aeolus wind profiles (Rayleigh-clear and Mie-cloudy HLOS) [6]. Quality screening was applied to the Aeolus profiles [4]. Both simulations assimilated observations to generate an analysis, employing the 4D-Var technique with LWDA (Long Window Data Analysis) to maximize the inclusion of observations within specific time windows (00:00 and 12:00 UTC analyses).
2.2. LIVAS Pure Dust Dataset
Dust vertical concentrations from the LIVAS dust products [7,8] are used. The product is based on the dust signature in the particle depolarization ratio measurements, and is developed using the methodology described in [8]. The product has the vertical resolution of the Level 2 CALIPSO curtain products (60 m) and a horizontal resolution of 1 × 1 degree. The LIVAS dust product has been used in numerous studies dealing with the evaluation of dust model outputs (e.g., [9,10,11,12,13]).
2.3. WRF Model Set-Up and Methodology
We utilized the WRF-ARW-Chem version 4.2.1 model (Advanced Research Weather version of the Weather Research and Forecasting coupled with Chemistry), [14] coupled with the Georgia Institute of Technology-Goddard Global Ozone Chemistry Aerosol Radiation and Transport (GOCART) aerosol model and the Air Force Weather Agency (AFWA) dust emission scheme [15] for studying the life cycle of mineral aerosols in the region of interest (ROI, Sahara Desert and Atlantic Ocean). See Table A1 in the Appendix A for the chosen physics and dust parameterization options.
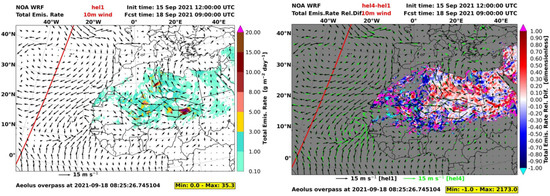
The model domain configuration (12 km × 12 km, spatial resolution and 70 vertical levels up to 50 hPa) covers mainly North Africa, the southern part of the European continent, and the dust outflow region of the Atlantic Ocean (Figure 1).

Figure 1.
Dust emission rates for hel1 (left) and relative differences ((hel4 − hel1)/hel1, right) of the model emission rates on 18–09–2021_09:00:00 UTC. Arrows show the wind speed vectors at 10 m above surface for hel1 (black) and hel4 (green) experiments. Red lines correspond to Aeolus overpasses closest to the time of the WRF-Chem hourly output.
For short-term WRF-Chem dust forecasts, 84 h cycles are performed using high-resolution (0.125° × 0.125°) outputs from the ECMWF IFS. Two scenarios are compared: one with Aeolus wind profiles assimilated (hel4 IFS analysis) and one without (hel1 IFS analysis). WRF-Chem outputs from 1 September 2021 to 30 September 2021, after a 15-day dust spin-up period, are compared to the LIVAS pure dust dataset (2.3) to assess the potential improvements in dust field representation due to Aeolus wind assimilation in the ROI.
3. Results
3.1. Impact on Simulated Emission Rates
In Figure 1, a comparison of WRF-Chem simulated emission rates between hel1 (no-Aeolus) and hel4 (with-Aeolus) experiments demonstrates the impact of the Aeolus assimilated winds in the emission rates. The arrows show the simulated winds at 10 m above surface. Even slight differences in the wind speed can cause significant differences in the emission rates, which are more evident near the main Sahara sources and at lead times near the Aeolus overpasses.
3.2. Impact on Dust Optical Depth (DOD)
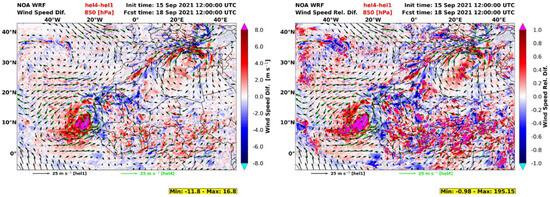
In Figure 2, a comparison with WRF-Chem of the absolute and relative differences of the winds at 850 hPa between hel1 (no-Aeolus) and hel4 (with-Aeolus) experiments is presented, which demonstrates how the assimilation of Aeolus data changes the predicted wind speed and alters the atmospheric circulation.

Figure 2.
Wind speed absolute (left) and relative (right) differences ((hel4 − hel1)/hel1). The depicted model WRF-Chem outputs correspond to 18–09–2021_12:00:00 UTC. Arrows show the wind speed vectors at 850 hPa for hel1 (black) and hel4 (green) experiments.
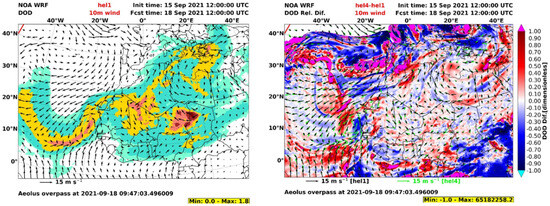
This differences in the atmospheric circulation led to differences in the simulated dust optical depth (DOD), which is verified with DOD absolute values and the absolute and relative differences given in Figure 3, where model results show that both dust circulation and areas of minimum and maximum DOD are modified, compared to hel1 simulations.

Figure 3.
DOD for hel1 (left), and DOD relative differences ((hel4 − hel1)/hel1, right). The depicted model WRF-Chem outputs correspond to 18–09–2021_12:00:00 UTC. Arrows show the wind speed vectors at 10 m above surface for hel1 (black) and hel4 (green) experiments. Red lines correspond to Aeolus overpasses closest to the time of the WRF-Chem hourly output.
3.3. Impact on the Vertical Distribution of Dust
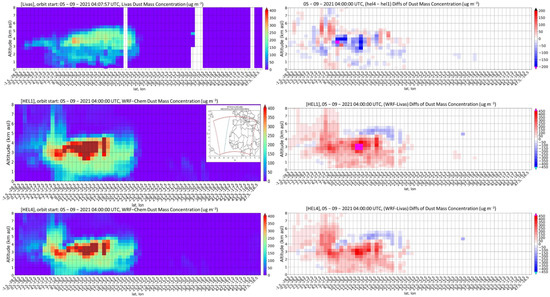
Figure 4 depicts the collocated vertical dust concentration (ug m−3) observed by LIVAS and simulated in hel1 and hel4 over the Eastern Tropical Atlantic on the 5th of September, 2021, assessing the impact of Aeolus data in the vertical distribution of dust.

Figure 4.
Collocated hel1 and hel4 to LIVAS depicting vertical dust concentrations (ug m−3) on 05–09–2021 04:00 UTC along the CALIPSO track represented by the blue line within the WRF model domain, (red polygon, top right). The top-left image shows the original CALIPSO pure dust backscatter coefficient at 532 nm. Given in rows 2 to 3, on the left column, are the collocated CALIPSO-LIVAS, hel1 and hel4 dust concentration curtain plots, respectively. In rows 1 to 3, on the right column, calculated differences of hel4 vs. hel1, hel1 vs. LIVAS and hel4 vs. LIVAS are presented, respectively.
As seen in Figure 4 (mid row) the CALIPSO overpass (blue line on domain map) crosses the dust outflow zone off the African coasts, capturing the dust plume that is moving westwards over the Atlantic. The comparison of the collocated LIVAS dust observations against the model outputs for hel1 and hel4 (Figure 4, left column, rows 1 to 3) shows a reduction of the positive WRF biases (Figure 4, right column, rows 2 and 3) when WRF is initialized with IFS hel4 outputs, as it is also seen when calculating concentration differences between hel1 and hel4 (Figure 4, right column, row 1).
4. Conclusions
Aeolus assimilated winds have a significant impact on the WRF-Chem model simulated emission rates, dust optical depth, and circulation. Comparison with LIVAS observations show improved representation of dust fields when WRF is initialized with Aeolus data (hel4), reducing positive biases and enhancing agreement with observations.
Author Contributions
Conceptualization, E.D., A.G. and V.A.; methodology, E.D., A.G., E.M., E.P. and E.D.; software, E.D. and G.P.; validation, E.D., E.M. and E.P.; investigation, E.D., A.G., E.M., E.P. and V.A.; resources, V.A.; data curation, Ε.D., M.R., A.B., Ε.Μ. and E.P.; writing—original draft preparation, E.D.; writing—review and editing, E.D., V.A., A.G., E.M., E.P., C.R., D.B. and P.K.; visualization, E.D. and G.P.; supervision, V.A., A.G. and E.P.; project administration, V.A.; funding acquisition, V.A. All authors have read and agreed to the published version of the manuscript.
Funding
This research has been supported by the European Space Agency (grant no. NEWTON, 4000133130/20/IBG//Aeolus+ Innovation (Aeolus+I)); the D-TECT ERC Consolidator Grant funded by the European Research Council (ERC, grant no. 725698); and the ESA’s ASKOS project (contract nr. 4000131861/20/NL/IA); and the PANGEA4CalVal project (Grant Agreement 101079201) funded by the European Union.
Institutional Review Board Statement
Not applicable.
Informed Consent Statement
Not applicable.
Data Availability Statement
LIVAS pure-dust products are available upon request from Eleni Marinou (elmarinou@noa.gr), Vassilis Amiridis (vamoir@noa.gr), and Emmanuil Proestakis (proestakis@noa.gr).
Acknowledgments
This work was supported by computational time granted from the National Infrastructures for Research and Technology S.A. (GRNET S.A.) in the National HPC facility–ARIS –WINDAST project. We also thank NASA/LaRC/ASDC for making the CALIPSO products available, which are used to build LIVAS products. E. Proestakis was supported by the AXA Research Fund for postdoctoral researchers under the project entitled “Earth Observation for Air-Quality–Dust Fine-Mode-EO4AQ-DustFM”.
Conflicts of Interest
The authors declare no conflict of interest.
Appendix A

Table A1.
WRF-NOA model configuration with the basic parameterization schemes and their corresponding (number) runtime option.
Table A1.
WRF-NOA model configuration with the basic parameterization schemes and their corresponding (number) runtime option.
| Parameterization | Scheme | Parameterization | Scheme |
|---|---|---|---|
| Surface Model | Unified Noah [16] | sf_surface_physics | 2 |
| Surface Layer | Monin-Obukhov [17,18,19,20,21] | sf_sfclay_physics | 2 |
| Radiation (SW, LW) | RRTMG [22] | ra_sw(lw)_physics | 4 |
| Microphysics | Morrison 2-moment scheme [23] | mp_physics | 10 |
| Cumulus | Grell-3D [24,25] | cu_physics | 5 |
| Boundary Layer | MYNN [26,27,28] | bl_pbl_physics | 5 |
| Chemistry | GOCART simple [24,25] | chem_opt | 300 |
References
- Schepanski, K. Transport of mineral dust and its impact on climate. Geosciences 2018, 8, 151. [Google Scholar] [CrossRef]
- Prospero, J.M.; Ginoux, P.; Torres, O.; Nicholson, S.E.; Gill, T.E. Environmental Characterization of Global Sources of Atmospheric Soil Dust Identified with the Nimbus 7 Total Ozone Mapping Spectrometer (Toms) Absorbing Aerosol Product. Rev. Geophys. 2002, 40, 2-1–2-31. [Google Scholar] [CrossRef]
- Ginoux, P.; Prospero, J.M.; Gill, T.E.; Hsu, N.C.; Zhao, M. Global-scale attribution of anthropogenic and natural dust sources and their emission rates based on MODIS Deep Blue aerosol products. Rev. Geophys. 2012, 50. [Google Scholar] [CrossRef]
- Rennie, M.P.; Isaksen, L.; Weiler, F.; de Kloe, J.; Kanitz, T.; Reitebuch, O. The impact of Aeolus wind retrievals on ECMWF global weather forecasts. Q. J. R. Meteorol. Soc. 2021, 147, 3555–3586. [Google Scholar] [CrossRef]
- Marinou, E.; Amiridis, V.; Paschou, P.; Tsikoudi, I.; Tsekeri, A.; Daskalopoulou, V.; Baars, H.; Floutsi, A.; Kouklaki, D.; Pirloaga, R. ASKOS Campaign 2021/2022: Overview of measurements and applications. In Proceedings of the EGU General Assembly 2023, Vienna, Austria, 24–28 April 2023. [Google Scholar]
- Baars, H.; Herzog, A.; Heese, B.; Ohneiser, K.; Hanbuch, K.; Hofer, J.; Yin, Z.; Engelmann, R.; Wandinger, U. Validation of Aeolus wind products above the Atlantic Ocean. Atmos. Meas. Tech. Discuss. 2020, 13, 6007–6024. [Google Scholar] [CrossRef]
- Amiridis, V.; Wandinger, U.; Marinou, E.; Giannakaki, E.; Tsekeri, A.; Basart, S.; Kazadzis, S.; Gkikas, A.; Taylor, M.; Baldasano, J.; et al. Optimizing CALIPSO Saharan dust retrievals. Atmospheric Meas. Tech. 2013, 13, 12089–12106. [Google Scholar] [CrossRef]
- Marinou, E.; Amiridis, V.; Binietoglou, I.; Tsikerdekis, A.; Solomos, S.; Proestakis, E.; Konsta, D.; Papagiannopoulos, N.; Tsekeri, A.; Vlastou, G.; et al. Three-dimensional evolution of Saharan dust transport towards Europe based on a 9-year EARLINET-optimized CALIPSO dataset. Atmospheric Meas. Tech. 2017, 17, 5893–5919. [Google Scholar] [CrossRef]
- Tsikerdekis, A.; Zanis, P.; Steiner, A.L.; Solmon, F.; Amiridis, V.; Marinou, E.; Katragkou, E.; Karacostas, T.; Foret, G. Impact of dust size parameterizations on aerosol burden and radiative forcing in RegCM4. Atmos. Chem. Phys. 2017, 17, 769–791. [Google Scholar] [CrossRef]
- Solomos, S.; Ansmann, A.; Mamouri, R.E.; Binietoglou, I.; Patlakas, P.; Marinou, E.; Amiridis, V. Remote sensing and modelling analysis of the extreme dust storm hitting the Middle East and eastern Mediterranean in September 2015. Atmos. Chem. Phys. 2017, 17, 4063–4079. [Google Scholar] [CrossRef]
- Georgoulias, A.K.; Tsikerdekis, A.; Amiridis, V.; Marinou, E.; Benedetti, A.; Zanis, P.; Alexandri, G.; Mona, L.; Kourtidis, K.A.; Lelieveld, J. A 3-D evaluation of the MACC reanalysis dust product over Europe, northern Africa and Middle East using CALIOP/CALIPSO dust satellite observations. Atmos. Chem. Phys. 2018, 18, 8601–8620. [Google Scholar] [CrossRef]
- Konsta, D.; Binietoglou, I.; Gkikas, A.; Solomos, S.; Marinou, E.; Proestakis, E.; Basart, S.; García-Pando, C.P.; El-Askary, H.; Amiridis, V. Evaluation of the BSC-DREAM8b regional dust model using the 3D LIVAS-CALIPSO product. Atmos. Environ. 2018, 195, 46–62. [Google Scholar] [CrossRef]
- Drakaki, E.; Amiridis, V.; Tsekeri, A.; Gkikas, A.; Proestakis, E.; Mallios, S.; Solomos, S.; Spyrou, C.; Marinou, E.; Ryder, C.; et al. Modelling coarse and giant desert dust particles. Atmos. Chem. Phys. Discuss. 2022, 2022, 12727–12748. [Google Scholar] [CrossRef]
- Grell, G.A.; Peckham, S.E.; Schmitz, R.; McKeen, S.A.; Frost, G.; Skamarock, W.C.; Eder, B. Fully coupled “online” chemistry within the WRF model. Atmos. Environ. 2005, 39, 6957–6975. [Google Scholar] [CrossRef]
- LeGrand, S.L.; Polashenski, C.; Letcher, T.W.; Creighton, G.A.; Peckham, S.E.; Cetola, J.D. The AFWA dust emission scheme for the GOCART aerosol model in WRF-Chem v3.8.1. Geosci. Model Dev. 2019, 12, 131–166. [Google Scholar] [CrossRef]
- Tewari, M.; Chen, F.; Wang, W.; Dudhia, J.; Lemone, M.A.; Mitchell, K.E.; Ek, M.; Gayno, G.; Wegiel, J.W.; Cuenca, R. Implementation and verification of the unified NOAH land surface model in the WRF model. In Proceedings of the 20th conference on weather analysis and forecasting/16th conference on numerical weather prediction, Seattle, WA, USA, 14 January 2004. [Google Scholar]
- Monin, A.S.; Obukhov, A. M. Basic laws of turbulent mixing in the surface layer of the atmosphere. Contrib. Geophys. Inst. Acad. Sci. USSR 1954, 27, 163–187. [Google Scholar]
- Janjić, Z.I. The Step-Mountain Eta Coordinate Model: Further Developments of the Convection, Viscous Sublayer, and Turbulence Closure Schemes. Mon. Weather Rev. 1994, 122, 927–945. [Google Scholar] [CrossRef]
- Janjic, Z.I. The surface layer in the NCEP Eta Model. In Proceedings of the Eleventh conference on numerical weather prediction, Norfolk, VA, USA, MA, USA, 19–23 August 1996; American Meteorological Society: Boston, MA, USA; pp. 354–355. [Google Scholar]
- Janjic, Z. The Surface Layer Parameterization in the NMM Models; Office note 497 (National Meteorological Center (U.S.)); NOAA/NWS/NCEP Environmental Modeling Center: College Park, MD, USA, 2019. [Google Scholar] [CrossRef]
- Janji, Z.I. Nonsingular Implementation of the Mellor-Yamada Level 2.5 Scheme in the NCEP Meso Model; Office note, no. 437; National Centers for Environmental Prediction (U.S.): Washington, DC, USA, 2001; p. 61. [Google Scholar]
- Iacono, M.J.; Delamere, J.S.; Mlawer, E.J.; Shephard, M.W.; Clough, S.A.; Collins, W.D. Radiative forcing by long-lived greenhouse gases: Calculations with the AER radiative transfer models. J. Geophys. Res. Atmos. 2008, 113, D13103. [Google Scholar] [CrossRef]
- Morrison, H.; Thompson, G.; Tatarskii, V. Impact of Cloud Microphysics on the Development of Trailing Stratiform Precipitation in a Simulated Squall Line: Comparison of One- and Two-Moment Schemes. Mon. Weather. Rev. 2009, 137, 991–1007. [Google Scholar] [CrossRef]
- Grell, G.A. Prognostic Evaluation of Assumptions Used by Cumulus Parameterizations. Mon. Weather Rev. 1993, 121, 764–787. [Google Scholar] [CrossRef]
- Grell, G.A.; Dévényi, D. A generalized approach to parameterizing convection combining ensemble and data assimilation techniques. Geophys. Res. Lett. 2002, 29, 38-1–38-4. [Google Scholar] [CrossRef]
- Nakanishi, M.; Niino, H. An Improved Mellor-Yamada Level-3 Model: Its Numerical Stability and Application to a Regional Prediction of Advection Fog. Bound.-Layer Meteorol. 2006, 119, 397–407. [Google Scholar] [CrossRef]
- Nakanishi, M.; Niino, H. Development of an Improved Turbulence Closure Model for the Atmospheric Boundary Layer. J. Meteorol. Soc. Jpn. Ser. II 2009, 87, 895–912. [Google Scholar] [CrossRef]
- Olson, J.B.; Kenyon, J.S.; Angevine, W.M.; Brown, J.M.; Pagowski, M.; Sušelj, K. A Description of the MYNN-EDMF Scheme and the Coupling to Other Components in WRF–ARW; NOAA Technical Memorandum OAR GSD; NOAA: Washington, DC, USA, 2019; Volume 61, p. 37. [Google Scholar] [CrossRef]
Disclaimer/Publisher’s Note: The statements, opinions and data contained in all publications are solely those of the individual author(s) and contributor(s) and not of MDPI and/or the editor(s). MDPI and/or the editor(s) disclaim responsibility for any injury to people or property resulting from any ideas, methods, instructions or products referred to in the content. |
© 2023 by the authors. Licensee MDPI, Basel, Switzerland. This article is an open access article distributed under the terms and conditions of the Creative Commons Attribution (CC BY) license (https://creativecommons.org/licenses/by/4.0/).
