
Heating and Cooling Energy Consumption Estimation in a Typical House in the Greater Thessaloniki Area, Applying Cooling and Heating Degree Days Method †


Abstract
:1. Introduction
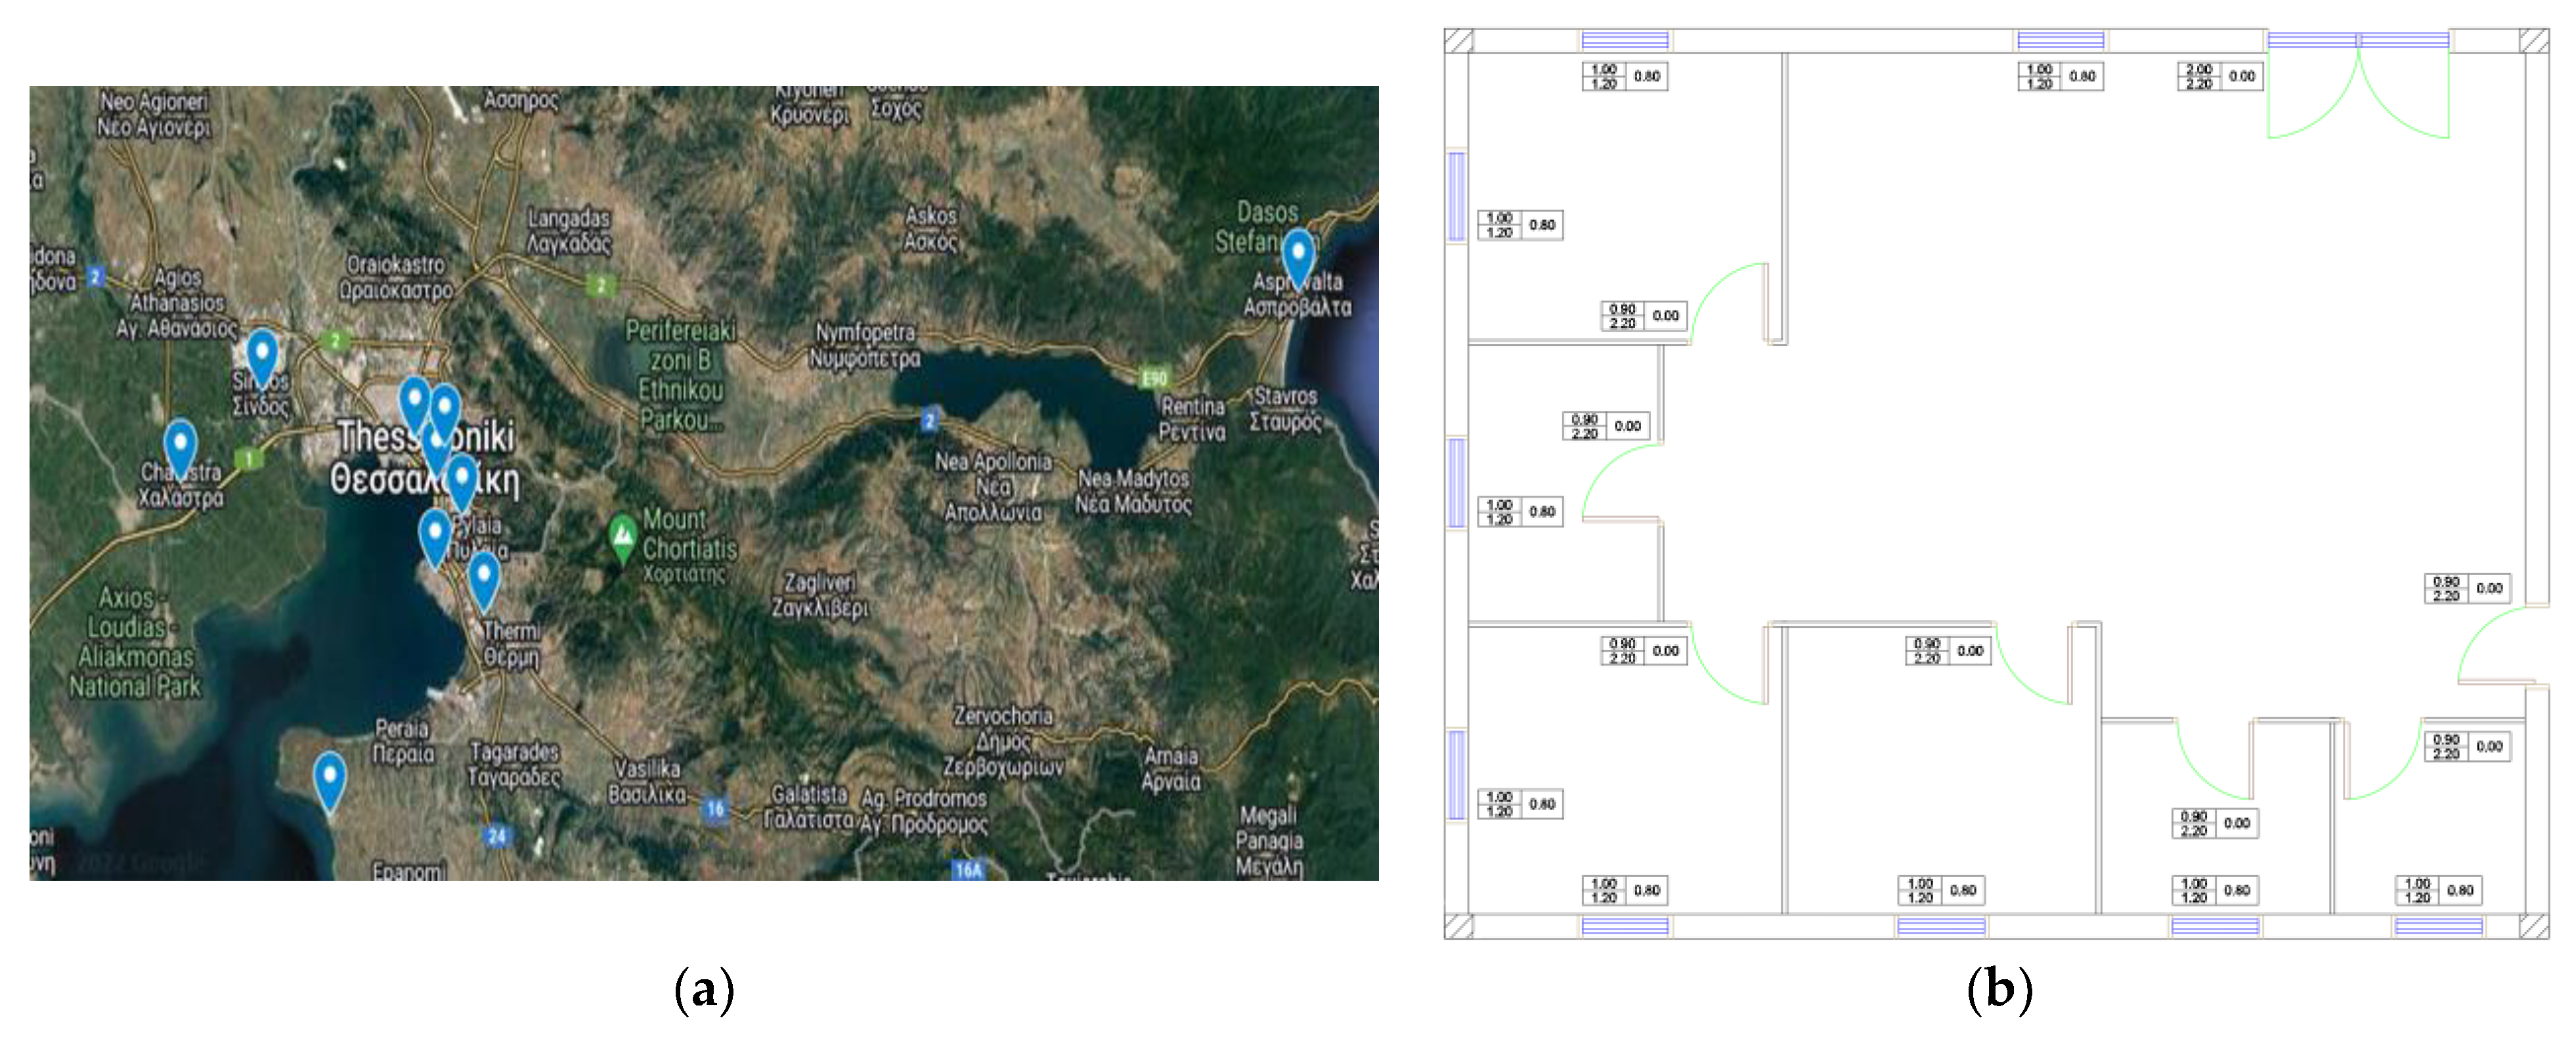
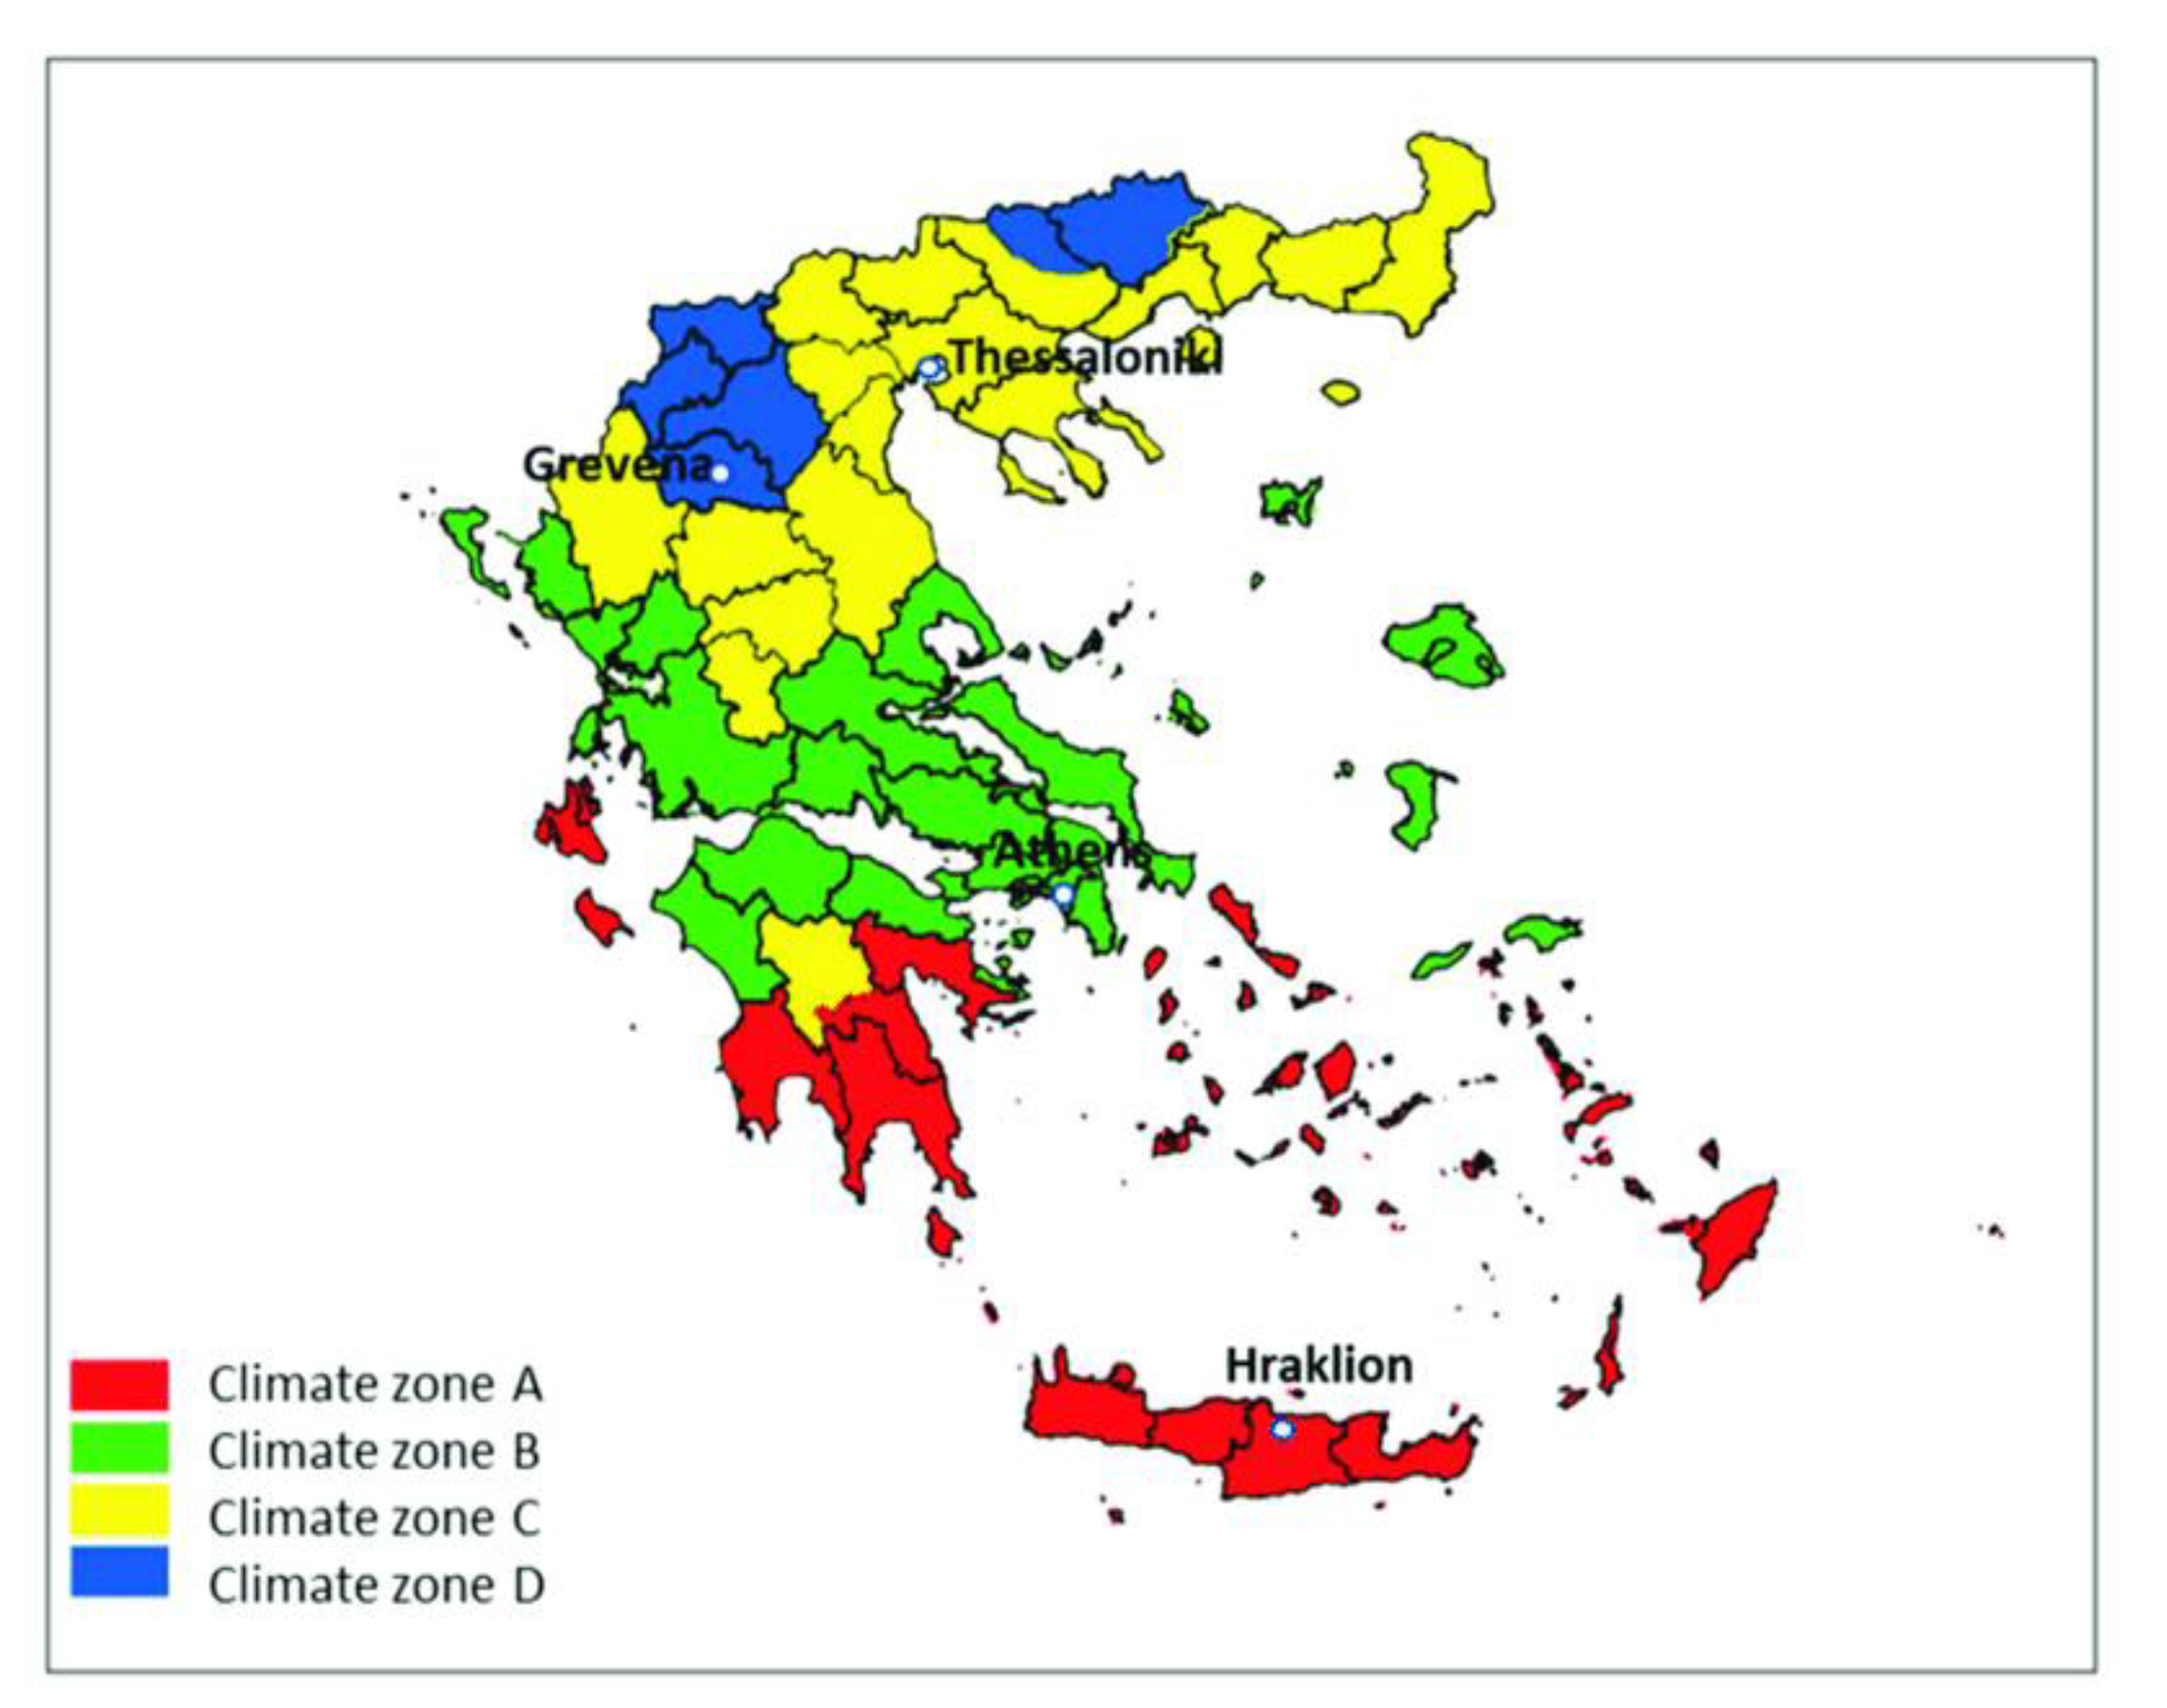
2. Data and Methodology
3. Results and Discussion
4. Conclusions
Author Contributions
Funding
Institutional Review Board Statement
Informed Consent Statement
Data Availability Statement
Conflicts of Interest
References
- Harvey, D.L.D. Using modified multiple heating-degree-day (HDD) and cooling-degree-day (CDD) indices to estimate building heating and cooling loads, Canada. Energy Build. 2020, 229, 110475. [Google Scholar] [CrossRef]
- Zeng, Y.; Dong, L. Thermal human biometeorological conditions and subjective thermal sensation in pedestrian streets in Chengdu, China. Int. J. Biometeorol. 2015, 59, 99–108. [Google Scholar] [CrossRef]
- Lai, D.; Guo, D.; Hou, Y.; Lin, C.; Chen, Q. Studies of outdoor thermal comfort in northern China, China. Build. Environ. 2014, 77, 110–118. [Google Scholar] [CrossRef]
- Wang, Z.; Zhang, H.; He, Y.; Luo, M.; Li, Z.; Hong, T.; Lin, B. Revisiting individual and group differences in thermal comfort based on ASHRAE database, USA, China. Energy Build. 2020, 219, 110017. [Google Scholar] [CrossRef]
- Verichev, K.; Zamorano, M.; Fuentes-Sepulveda, A.; Cardenas, N.; Carpio, M. Adaptation and mitigation to climate change of envelope wall thermal insulation of residential buildings in a temperate oceanic climate, Chile. Energy Build. 2021, 235, 110719. [Google Scholar] [CrossRef]
- Amani, N.; Kiaee, E. Developing a two-criteria framework to rank thermal insulation materials in nearly zero energy buildings using multi-objective optimization approach. J. Clean. Prod. 2020, 276, 122592. [Google Scholar] [CrossRef]
- Li, X.; Peng, C.; Liu, L. Experimental study of the thermal performance of a building wall with vacuum insulation panels and extruded polystyrene foams, China. Appl. Therm. Eng. 2020, 180, 115801. [Google Scholar] [CrossRef]
- Gulotta, T.M.; Cellura, M.; Guarino, F.; Longo, S. A bottom-up harmonized energy-enviromental models for Europe (BOHEEME): A case study on the thermal insulation of the EU-28 building stock, Italy. Energy Build. 2020, 231, 110584. [Google Scholar] [CrossRef]
- Technical Guide Technical Chamber of Greece T.O.T.E.E. 20701-1/2017. Regulation of Buildings’ Energy Performance-KENAK. 2023. Available online: https://portal.tee.gr/portal/page/portal/SCIENTIFIC_WORK/GR_ENERGEIAS/kenak/files/TOTEE_20701-1_2017_TEE_1st_Edition.pdf (accessed on 30 April 2023).
- National Observatory of Athens. Network of Automatic Meteorological Stations. Available online: https://meteosearch.meteo.gr/ (accessed on 1 May 2023).


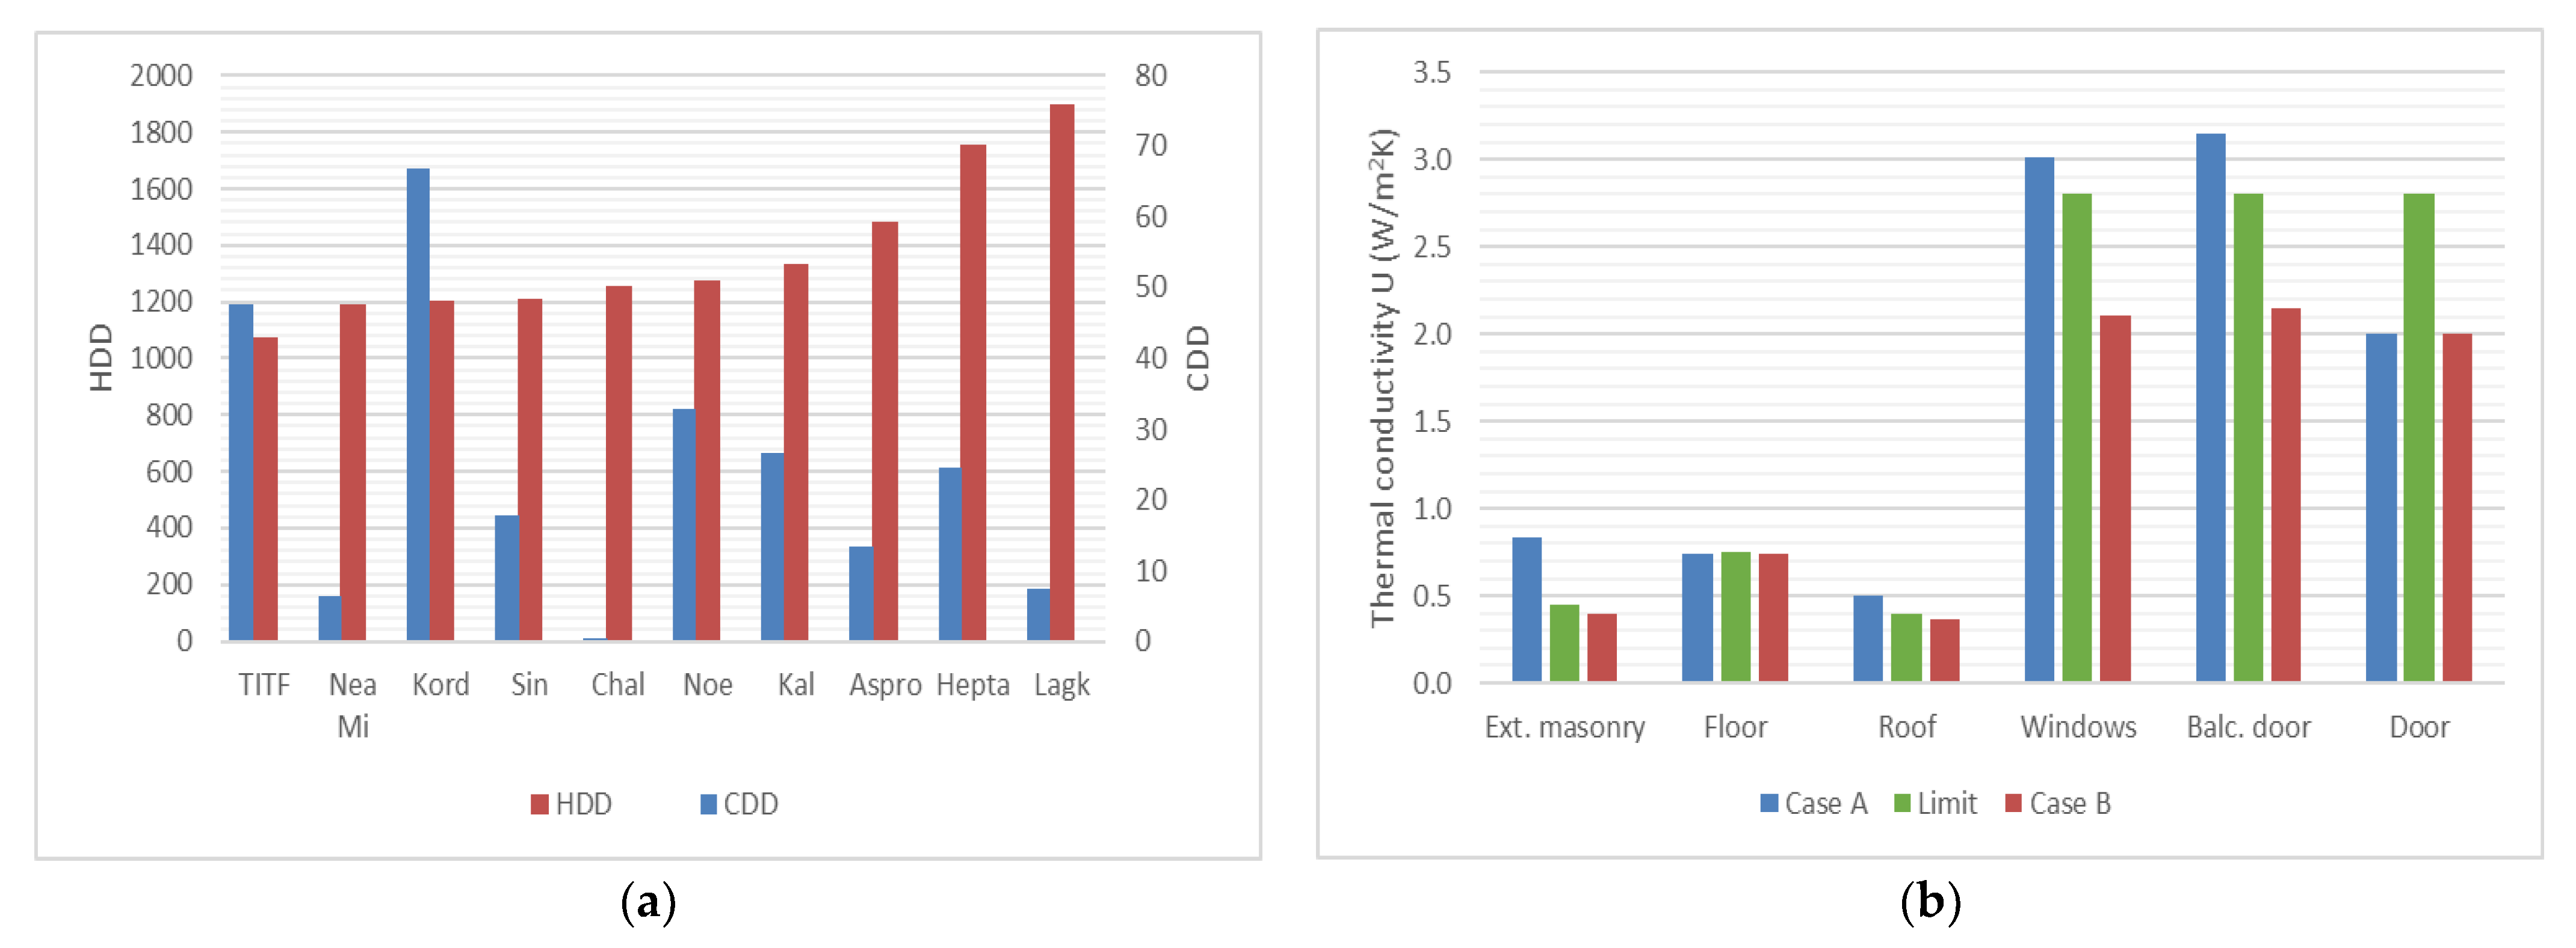
| Station | HDD (°C) | CDD (°C) |
|---|---|---|
| TITF | 1071.29 | 47.72 |
| Nea Mixaniona | 1192.04 | 6.33 |
| Kordelio | 1203.58 | 66.90 |
| Sindos | 1212.71 | 17.73 |
| Chalastra | 1253.43 | 0.53 |
| Noesis | 1272.58 | 32.80 |
| Kalamaria | 1336.75 | 26.65 |
| Asprovalta | 1482.47 | 13.49 |
| Heptapyrgion | 1757.88 | 24.55 |
| Lagkadas | 1896.19 | 7.50 |
| Structural Material | First Case U (W/m2K) | Second Case U (W/m2K) | Upper Threshold U (W/m2K) |
|---|---|---|---|
| External masonry | 0.838 | 0.396 | 0.45 |
| Floor | 0.738 | 0.738 | 0.75 |
| Roof | 0.497 | 0.381 | 0.40 |
| Windows | 3.011 | 2.103 | 2.80 |
| Balcony door | 3.149 | 2.151 | 2.80 |
| Door | 2.000 | 2.000 | 2.80 |
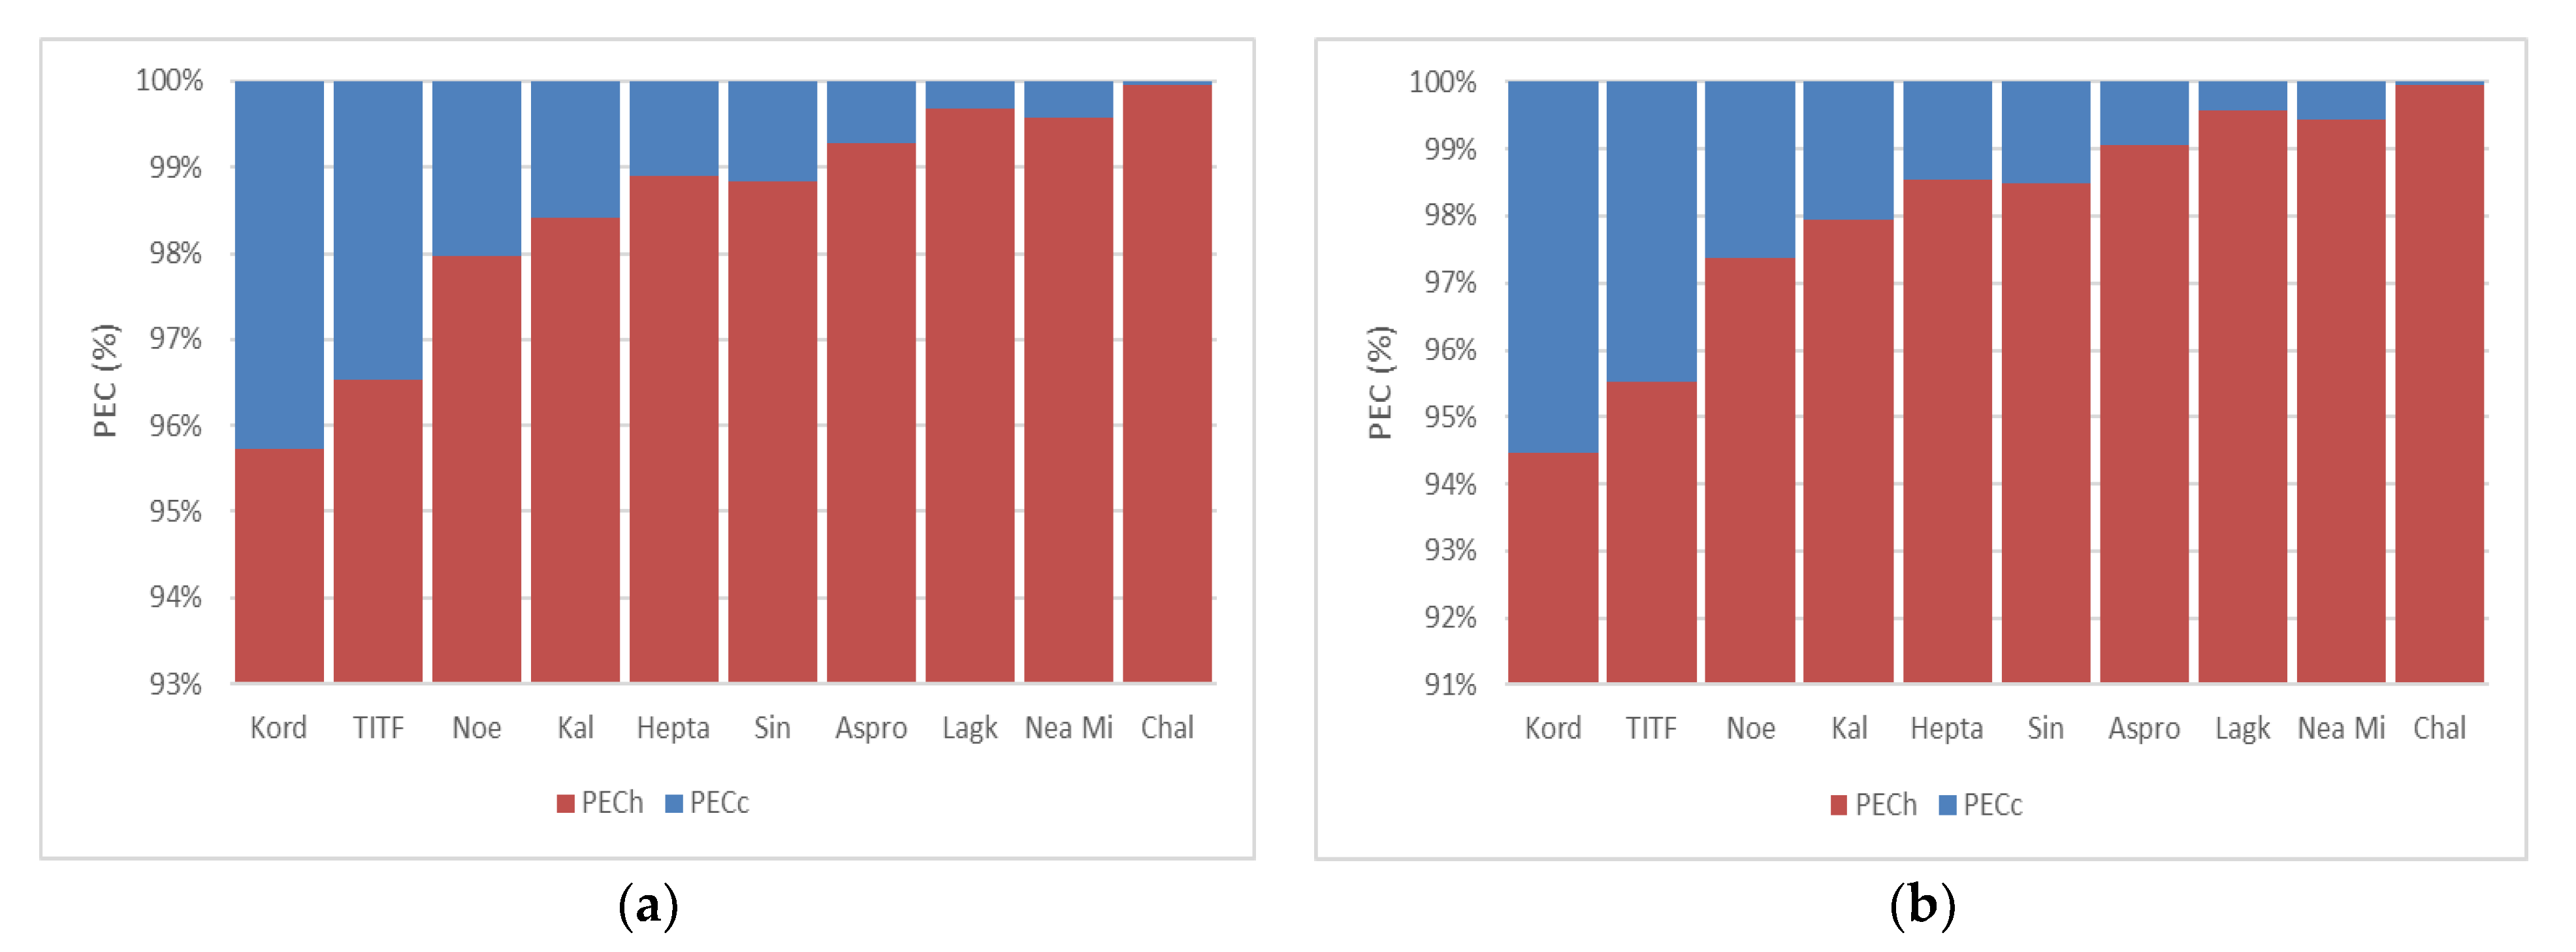
| Station | First Case | Second Case | Same in Both Cases | |||
|---|---|---|---|---|---|---|
| Qh (kWh) | PECh (kWh) | Qh (kWh) | PECh (kWh) | Qc (kWh) | PECc (kWh) | |
| TITF | 8870.35 | 25,724.00 | 6788.07 | 19,685.41 | 317.98 | 922.13 |
| Nea Mixaniona | 9870.14 | 28,623.41 | 7553.17 | 21,904.19 | 42.20 | 122.39 |
| Kordelio | 9965.69 | 28,900.50 | 7626.29 | 22,116.24 | 445.80 | 1292.83 |
| Sindos | 10,041.29 | 29,119.73 | 7684.14 | 22,284.00 | 118.17 | 342.69 |
| Chalastra | 10,378.48 | 30,097.59 | 7942.18 | 23,032.31 | 3.55 | 10.31 |
| Noesis | 10,536.99 | 30,557.28 | 8063.48 | 23,384.09 | 218.57 | 633.85 |
| Kalamaria | 11,068.36 | 32,098.25 | 8470.11 | 24,563.33 | 177.58 | 514.97 |
| Asprovalta | 12,274.90 | 35,597.22 | 9393.43 | 27,240.93 | 89.88 | 260.65 |
| Heptapyrgion | 14,555.30 | 42,210.38 | 11,138.51 | 32,301.68 | 163.59 | 474.42 |
| Lagkadas | 15,700.59 | 45,531.71 | 12,014.94 | 34,843.34 | 49.97 | 144.92 |
Disclaimer/Publisher’s Note: The statements, opinions and data contained in all publications are solely those of the individual author(s) and contributor(s) and not of MDPI and/or the editor(s). MDPI and/or the editor(s) disclaim responsibility for any injury to people or property resulting from any ideas, methods, instructions or products referred to in the content. |
© 2023 by the authors. Licensee MDPI, Basel, Switzerland. This article is an open access article distributed under the terms and conditions of the Creative Commons Attribution (CC BY) license (https://creativecommons.org/licenses/by/4.0/).
Share and Cite
Kotakis, V.; Moustris, K. Heating and Cooling Energy Consumption Estimation in a Typical House in the Greater Thessaloniki Area, Applying Cooling and Heating Degree Days Method. Environ. Sci. Proc. 2023, 26, 100. https://doi.org/10.3390/environsciproc2023026100
Kotakis V, Moustris K. Heating and Cooling Energy Consumption Estimation in a Typical House in the Greater Thessaloniki Area, Applying Cooling and Heating Degree Days Method. Environmental Sciences Proceedings. 2023; 26(1):100. https://doi.org/10.3390/environsciproc2023026100
Chicago/Turabian StyleKotakis, Vassilis, and Konstantinos Moustris. 2023. "Heating and Cooling Energy Consumption Estimation in a Typical House in the Greater Thessaloniki Area, Applying Cooling and Heating Degree Days Method" Environmental Sciences Proceedings 26, no. 1: 100. https://doi.org/10.3390/environsciproc2023026100
APA StyleKotakis, V., & Moustris, K. (2023). Heating and Cooling Energy Consumption Estimation in a Typical House in the Greater Thessaloniki Area, Applying Cooling and Heating Degree Days Method. Environmental Sciences Proceedings, 26(1), 100. https://doi.org/10.3390/environsciproc2023026100