1. Introduction
Traditional risk management systems, based on therapy and restoration after the failure occurrence, have been proven to be ineffective and often inadequate: better to prevent hazards rather than correcting them, especially across a water supply network where water moves quickly from the source to the consumers.
The main challenge is to identify, characterize, and control the potential hazards that may arise at the drinking water abstraction sites: water comes from heterogeneous and wide underground aquifers, susceptible to events occurring in the external environment.
To move towards a prognosis and prevention proposition and effectively implement WSPs, it is therefore mandatory to protect groundwater from pollution.
One of the main approaches available to preserve groundwater is the definition of Wellhead Protection Areas (WHPAs): land-use restriction and safeguard measures can then be adopted around the abstraction points to ensure the protection of water quality (static protection), while monitoring networks may be used to secure the safety of drinking water in the occurrence of contamination events outside the protection zones (dynamic protection) [
1].
WHPAs represent the surface and subsurface areas through which contaminants are reasonably likely to move through to reach a water abstraction site: they should be defined calculating the well (or wellfield) capture zone and isochrones along the groundwater flow path lines, using deterministic (backward particle tracking) or probabilistic methods by means of numerical modelling.
Groundwater flow models rely on simplified representations of the hydrogeological system (conceptual models), which describes and quantifies the relevant geological characteristics, pattern of flow conditions, hydrogeochemical processes, anthropogenic activities, and their mutual interactions.
The formulation of a conceptual model is based on the collection of reliable site-specific data which may be scattered across various (private and/or public) sources, including field survey and monitoring campaign to be conducted ad hoc to fill the knowledge gap.
In fact, depending on priority objectives, economic budget, and timing, available data can be integrated with specific investigations.
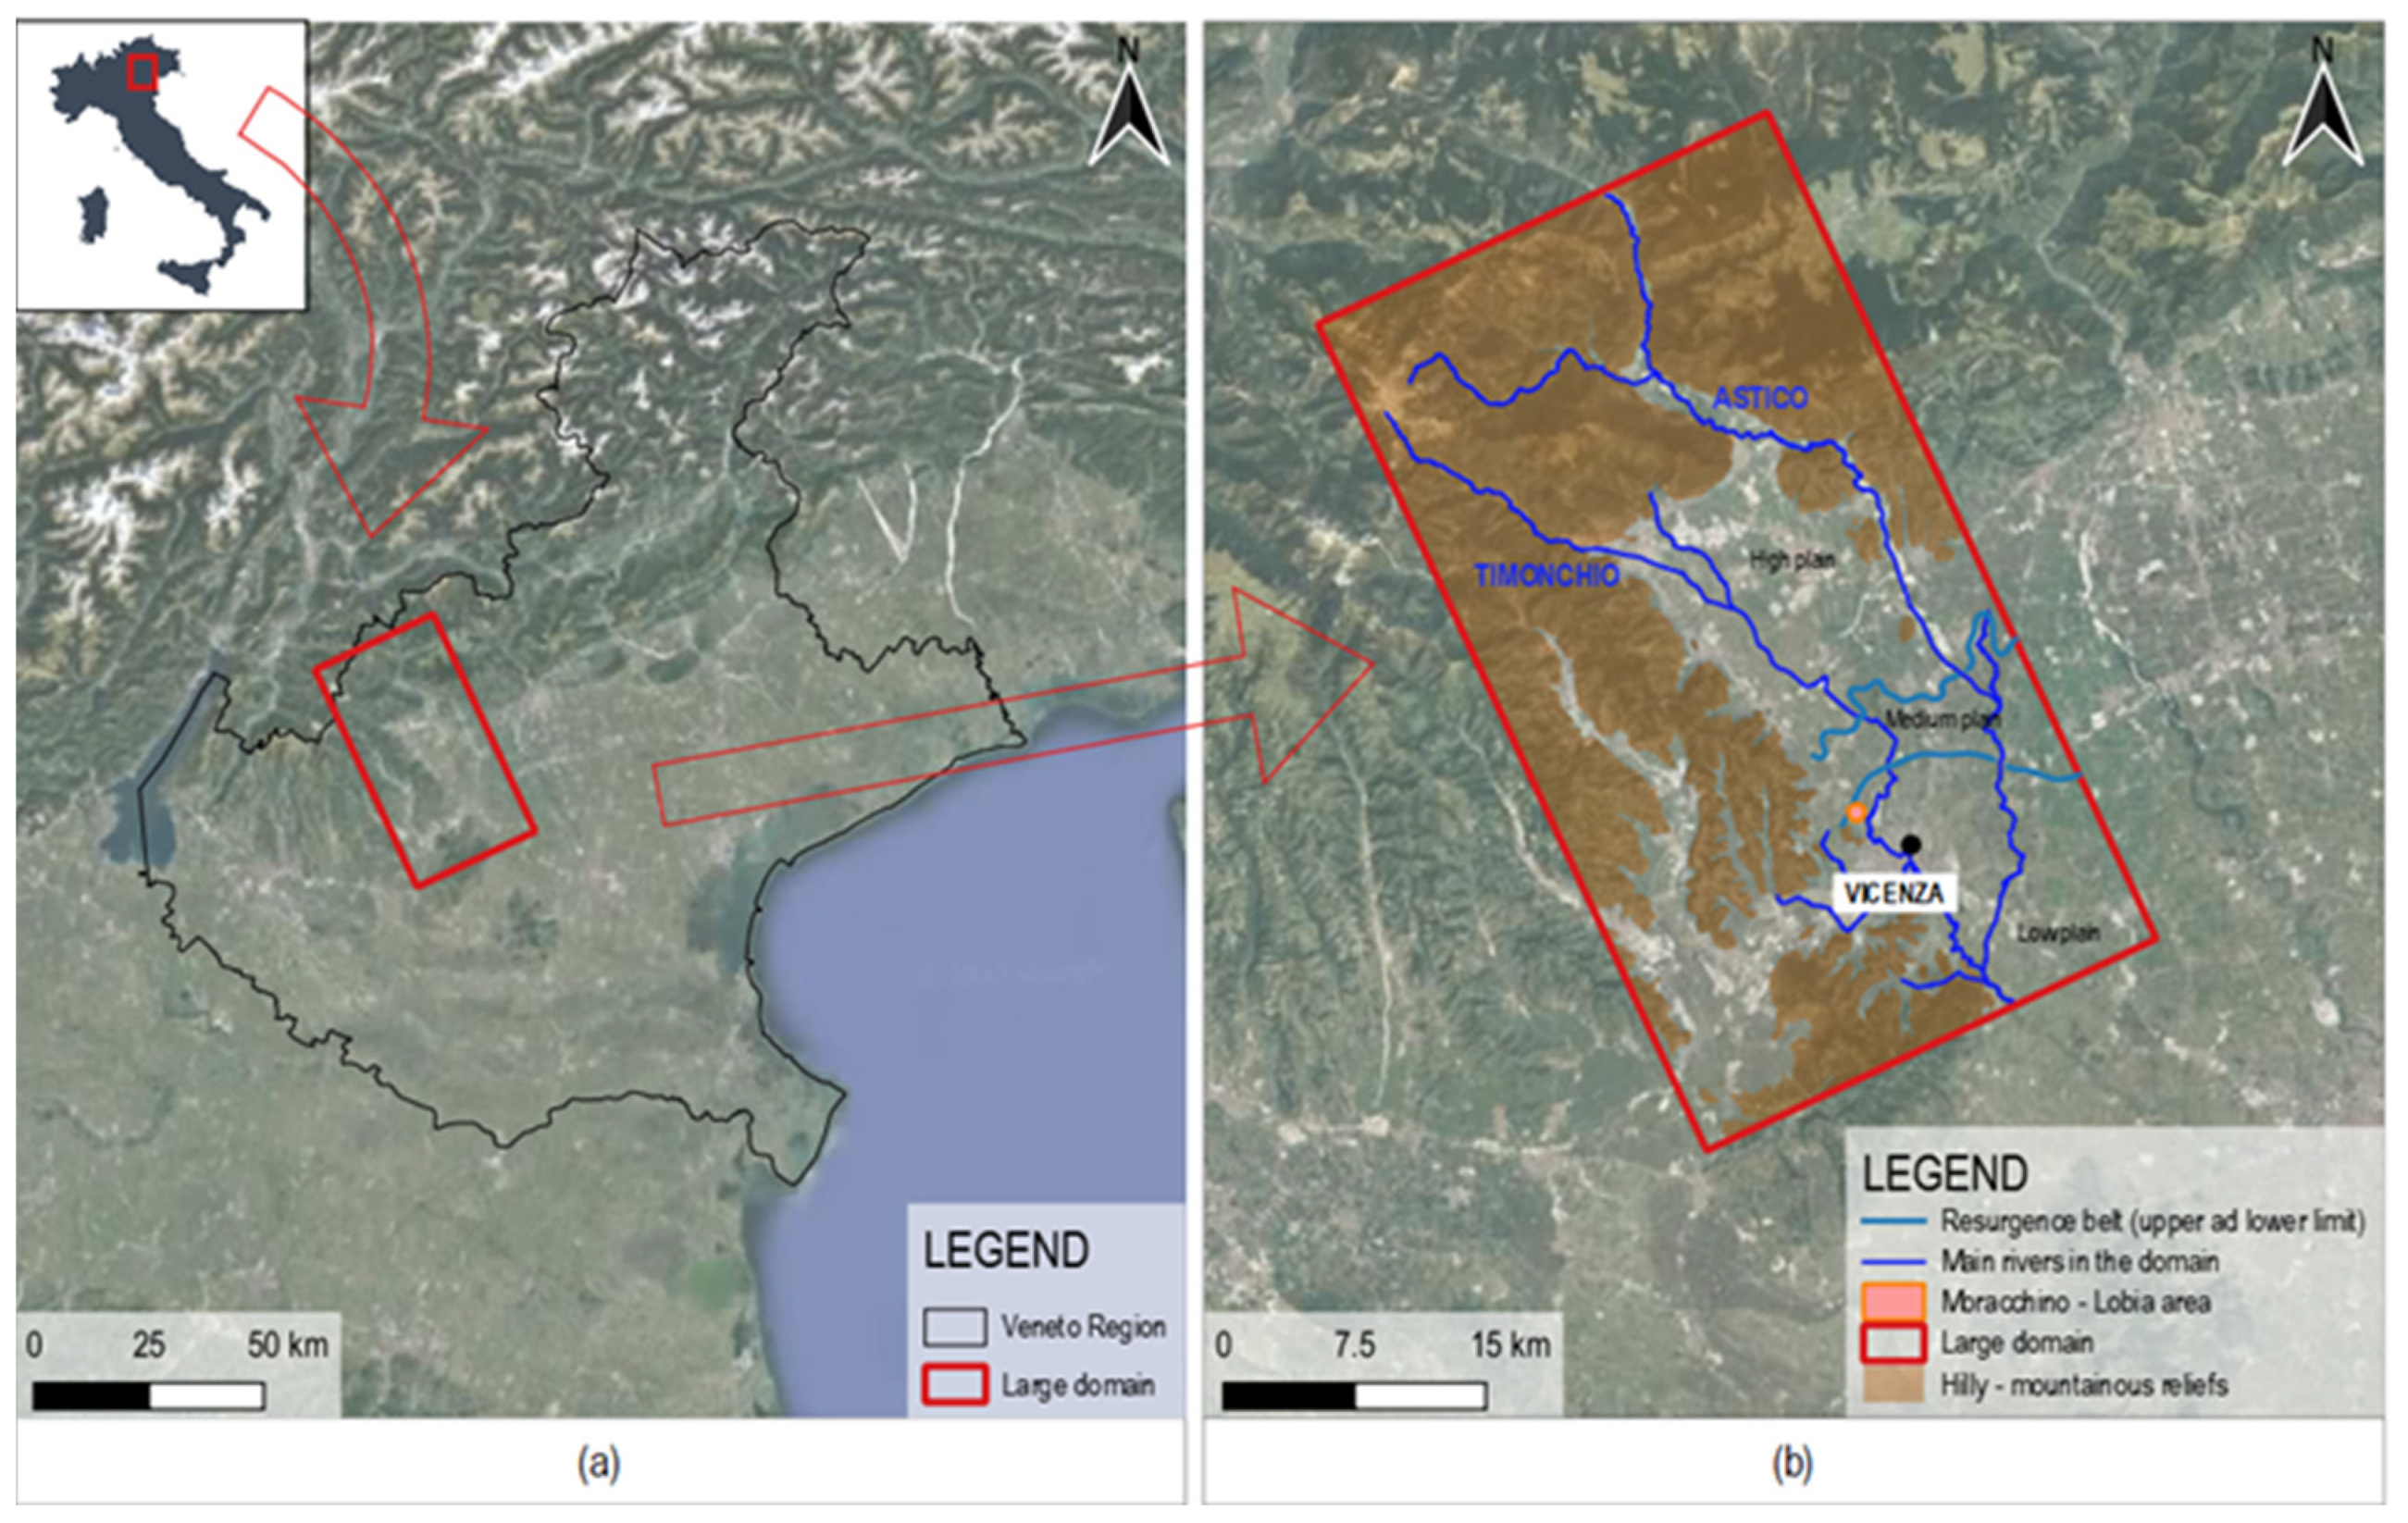
The study describes the procedural steps implemented in order to define the wellhead protection areas and the vulnerability aquifer classification for the main drinking water production field in the city of Vicenza (Moracchino district—loc. Lobia), which is strategically placed a few hundred meters downstream of a resurgence area, representing the “overflow” of one of the wider and most productive unconfined aquifer system in the Veneto region.
The pumping station, characterized by a dozen active wells exploiting the artesian aquifer, are confined between 70 to 200 m below ground level (mbg), supplying 10 million cubic meters of fresh water annually. The complexity of the hydrogeological structure, coupled with the strong anthropization and criticalities (hazard and pressure points) that the upstream recharge area has been experiencing for a few decades, compels water managers to assess the risks and plan for proper mitigation and prevention actions, fully embracing the WSPs integrated approach.
2. Materials and Methods
2.1. Study Area
The study area is located in the north-east of Italy, Veneto region, near the city of Vicenza. The Moracchino–Lobia pumping station intercepts the hydrogeological system of the Venetian Plain, downstream from the transition area from the northern unconfined aquifer to the southern multi-layered aquifers. To improve the structural and hydrodynamic assessment, the study has considered a large domain (
Figure 1), including the aquifer recharge zone, characterized by an important alluvial hydro-structure, which is strictly related to conoids and alluvial fans built by the main water courses (i.e., Astico e Timonchio).
2.2. Data Collection to Developthe Geological—Hydrogeological Model
The knowledge assessment was based on several data sources, such as:
Data provided by the local water utility:
hydrochemical quality assessment of the water supplied from the wellfield,
coordinates and monographs relating to the wells,
reports describing the results of previously pumping tests,
geological logs referring to boreholes around the study area,
information about the water volumes withdrawn,
historical series relating to hydraulic head monitoring.
Supplementary bibliographic data:
extracted from an internal database, which constitutes a collection of more than 10,000 resources relating to hydrogeological and environmental issues,
documentation provided by the local office of civil engineering, which has been digitalized, normalized, and georeferenced,
institutional open access web databases made available by municipality and province, the Regional Agency for Environmental Protection and Prevention, Veneto Region, Italian Institute for Environmental Protection and Research, etc.
Field survey carried out as part of the study:
hydraulic head data series,
chemical and isotopic analytical results of groundwater and surface water,
groundwater levels surveys,
pumping tests performed at the site.
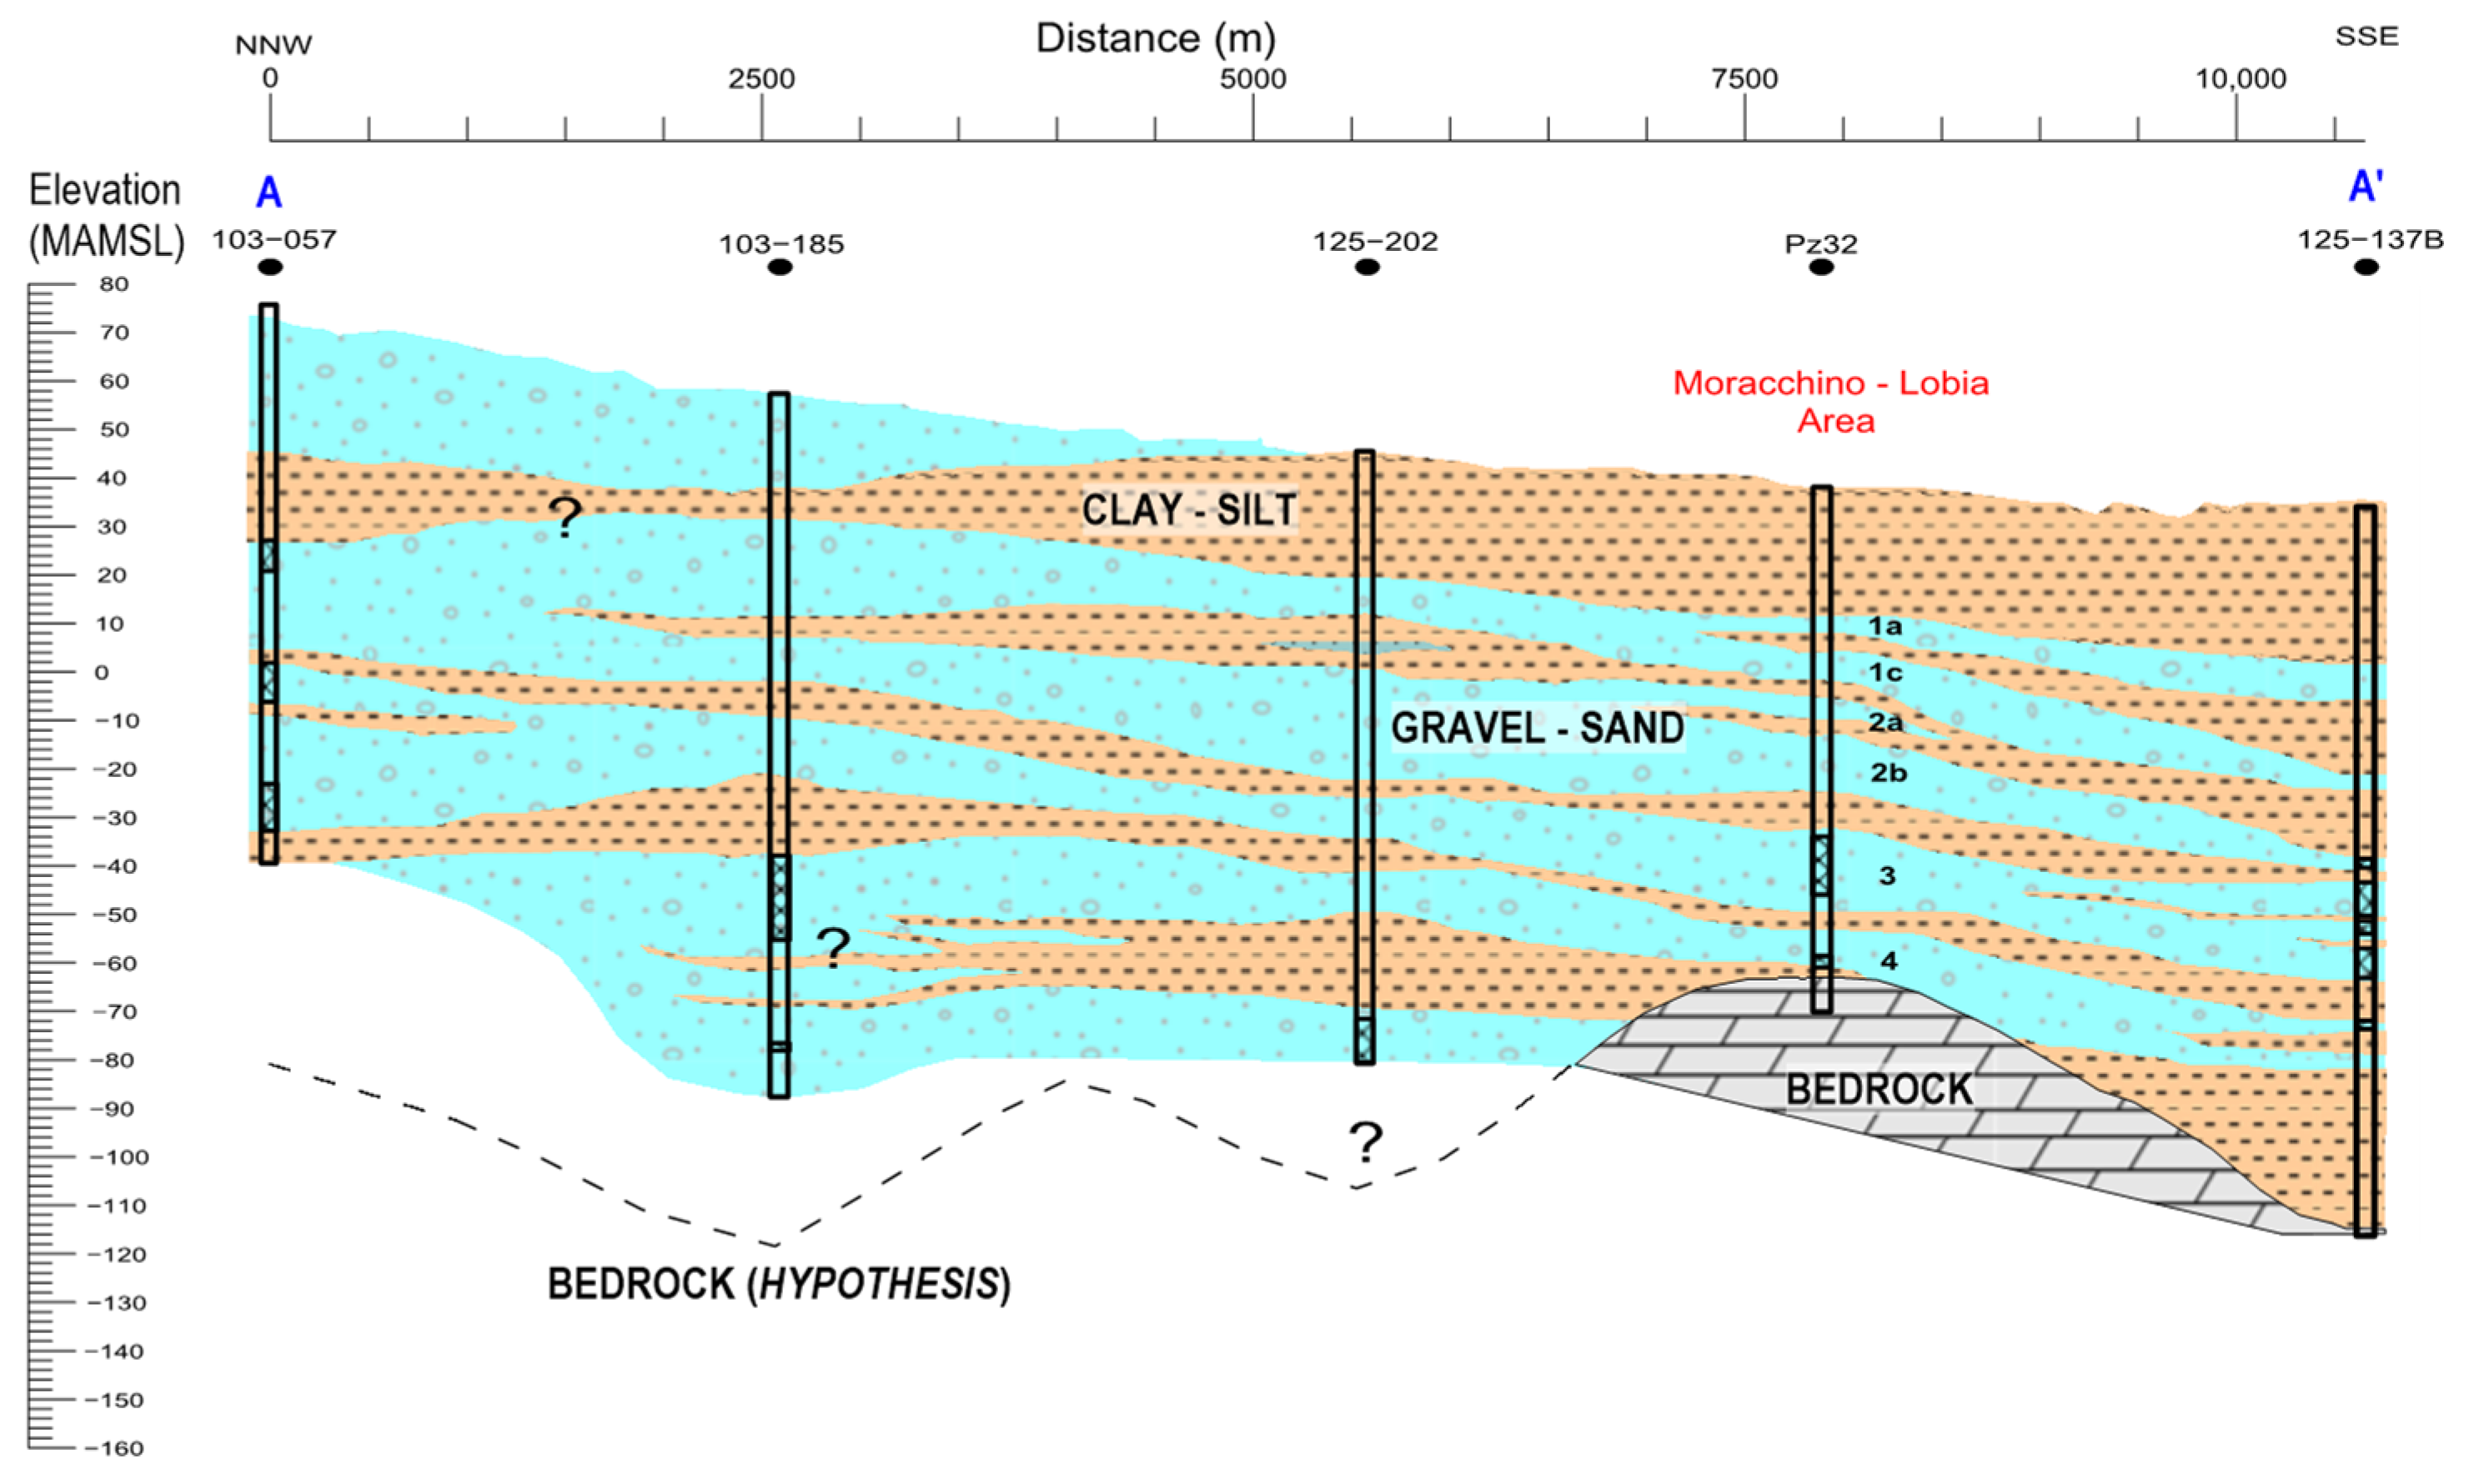
Data processing allows the preparation of interpretative geological sections (
Figure 2), outlined in order to define the geological and hydrogeological structural context of the large-scale domain.
The Moracchino–Lobia wells particularly benefit from the artesian aquifers confined between 90 to 150 mbg (identified by the abbreviation 4): supplemental investigations were therefore focused on these deep hydro-structures.
2.3. Filling the Gaps: Field Activities
2.3.1. Site Inspection
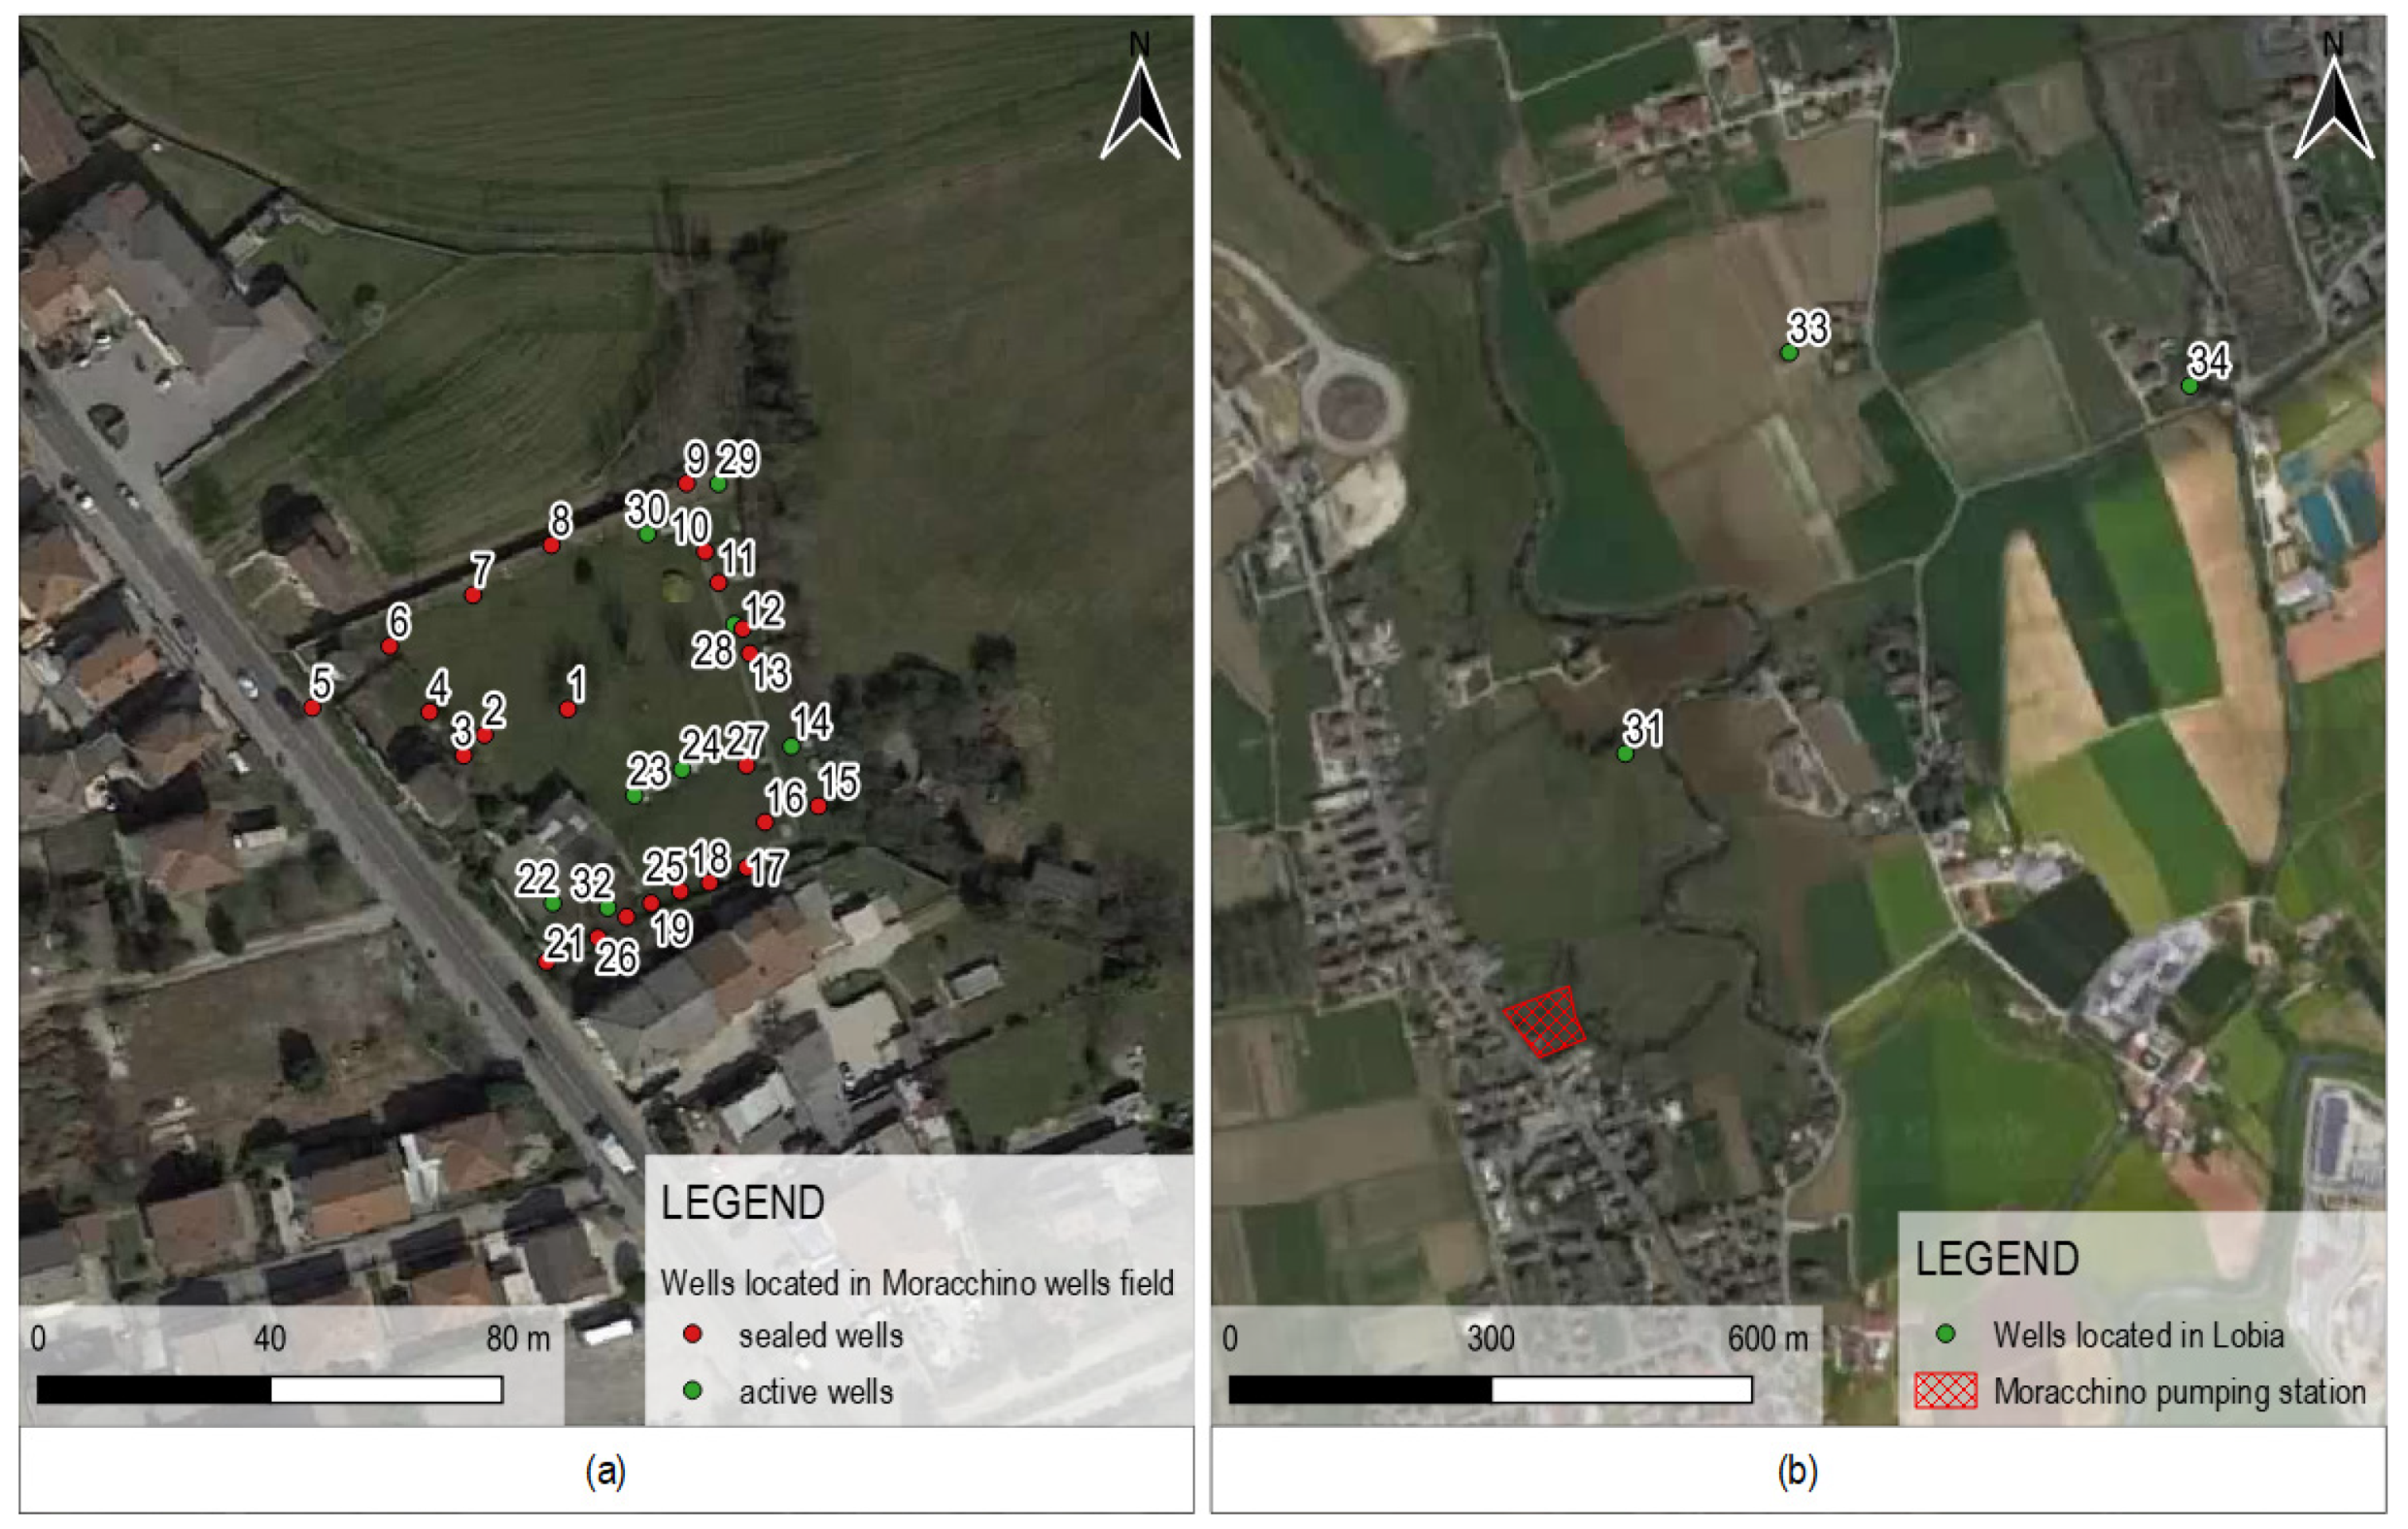
The Moracchino area presents several wells: the firsts were built in 1896 and, thereafter, several boreholes have been further developed to satisfy the water demand.
The initial inspection activities permit updating the water abstraction layout and map the utilized wells: 23 of the 34 wells that were found (
Figure 3) were sealed.
2.3.2. Hydraulic Head Measures
A groundwater level measurement campaign was carried out to update the available piezometric maps, referring to a wide sector of the Venetian plain and drawn up over 30 years ago [
2]. The surveys allowed us to obtain a detailed representation of the groundwater flow within the study domains, which includes both the undifferentiated aquifer and the confined layers.
The monitoring wells network was defined on the basis of previous professional and research experiences conducted by Sinergeo and the University of Padua [
3], then integrated with additional measuring points identified by public and private databases. An important effort was made to localize wells intercepting the fourth confined aquifer outside the Moracchino–Lobia wellfield in order to properly assess the hydro-structure most exploited by the water supply system.
Piezometric groundwater measurements were performed on 187 points. Where the examined wells were subjected to active pumping or water extraction, the measurements were corrected to consider the head losses attributable to the withdrawals.
2.3.3. Groundwater Level Monitoring
The groundwater level monitoring system activated as part of the study consists of:
five automatic pressure transducers installed within the pumping station wells,
a network of about 50 automatic sensors measuring the piezometric head within the study domain.
2.3.4. Pumping Tests
Pumping tests (Step Drawdown Tests, Recovery and Constant Rate Test) were performed according to international standards and methods to characterize hydraulic features of the aquifer system and determine a well performance pattern.
A testing program was designed and performed to fulfil current water demand and avoid service interruption. Many experimental tests were therefore carried out during nighttime, paying particular attention to maintain the operating pressure in the pipelines of the distribution systems.
2.3.5. Sampling Activities
Hydrochemical and isotopic features of groundwater were assessed to evaluate the recharge processes of the hydrogeological system under study. The parameters considered are listed below:
field parameters, measured at the time of sampling: pH, electrical conductivity, temperature, redox potential, dissolved oxygen;
dissolved macro-elements: Chlorides, Sulphates, Bicarbonates, Nitrates, Silica, Calcium, Sodium, Potassium, Magnesium;
dissolved micro-elements: Barium, Strontium, Lithium, Phosphates, Fluorides
stable isotopes: δ18O, δ2H.
2.4. Data Management
All information was homogenized and subjected to scrupulous quality assessment. In particular:
the field data were validated and completely digitized,
all piezometric measures were georeferenced in GIS platform,
piezometric monitoring data underwent calibration, outlier identification/elimination, correlation with management logics, flow measurements, effective recharge–precipitation, etc.,
chemical data were collected and then analysed for comparison,
satellite data were converted from Digital Number to sensor radiance value for determine soil classification by interpretation of the spectral signature (for the aquifer recharge zone);
input data were selected to apply the SINTACS [
4] scoring system (for intrinsic vulnerability calculation) and define the boundary conditions of the flux model domain.
The constructed database allowed us to perform:
geostatistical interpolations of groundwater levels,
detailed conceptual modelling using stratigraphic logs, hydrochemical–isotopic data, and physical parameters of aquifers,
land use classification for the groundwater recharge area,
intrinsic vulnerability map,
WHPA definition for Moracchino–Lobia groundwater pumping station,
sustainability evaluation of a water uptake increase scenario.
3. Results and Discussion
3.1. Production of Hydraulic Head Map
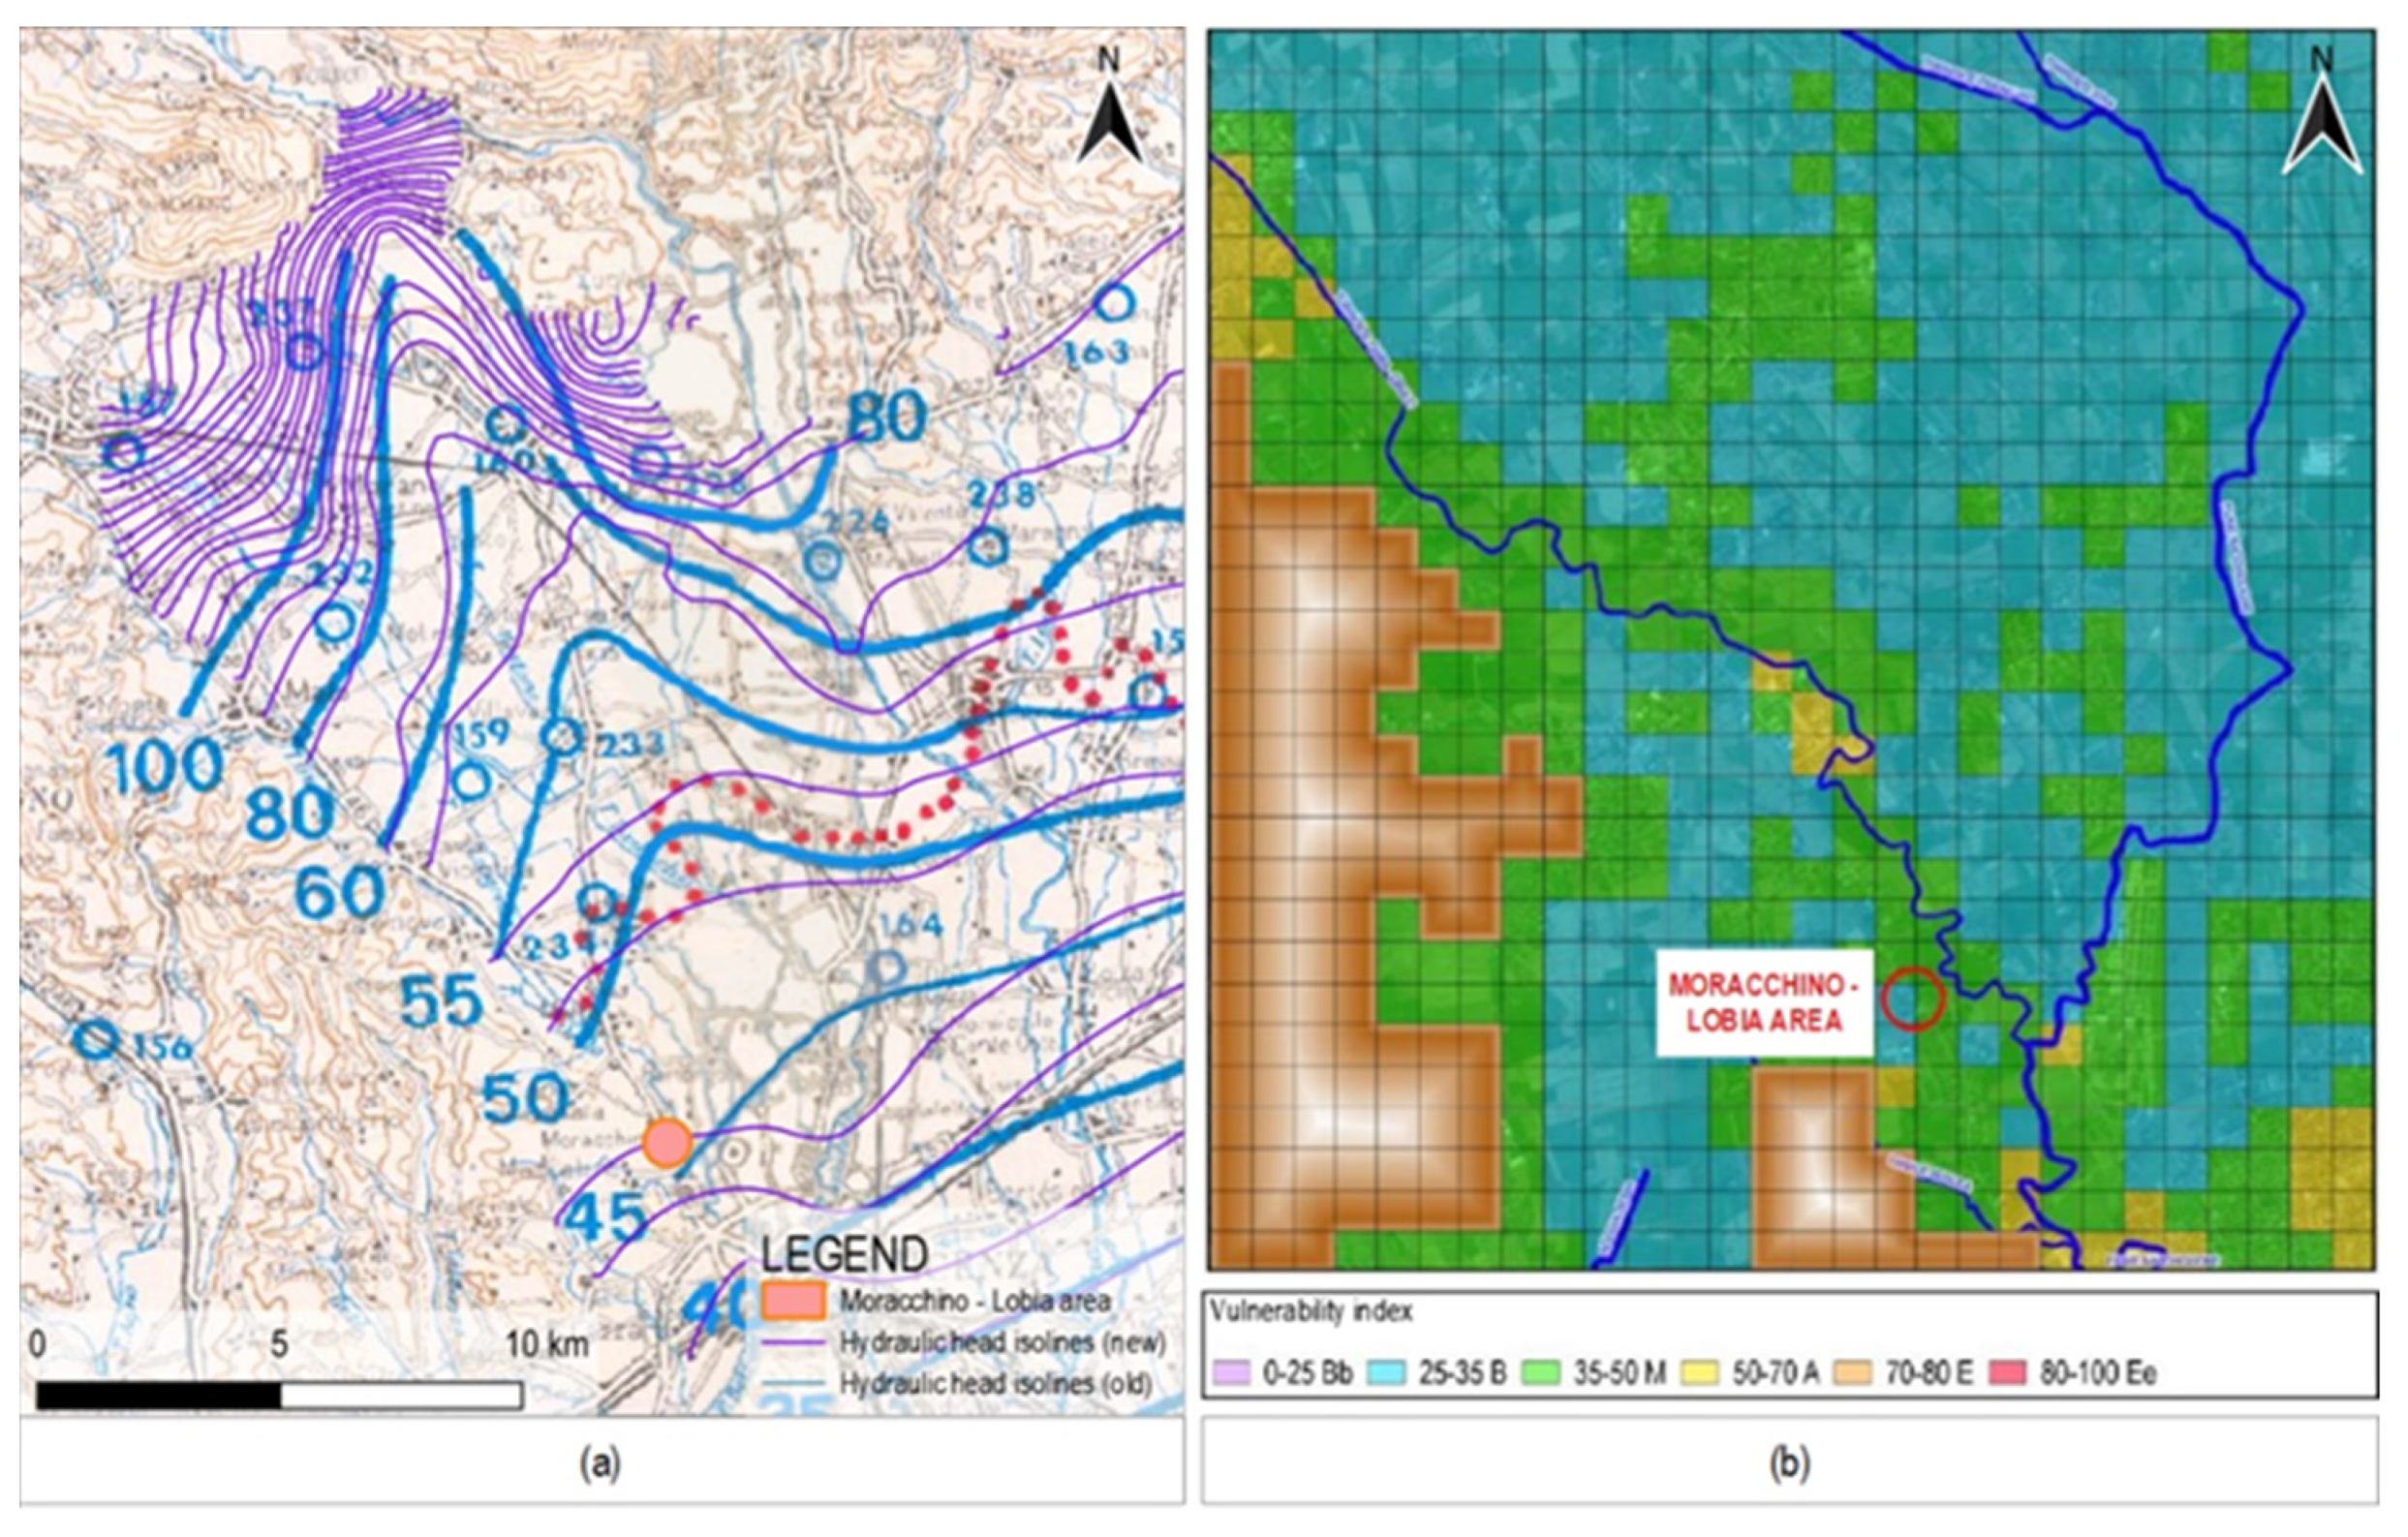
The reconstruction of the regionalized flow field (
Figure 4a) was used to obtain updated information relating to groundwater flow direction and gradient. The elaborations allowed us to identify the presence of preferential underground flow channels corresponding to paleo-riverbeds and the fluvial dispersion of the main rivers. Such outputs were fundamental to implement the numerical model finalized to WHPA estimation.
3.2. Conceptual Model of the Investigated Plain Sector
The hydrochemical and isotopic data allowed us to assess river–groundwater interactions, assess the recharge dynamics, and the relative water balance of watersheds.
3.3. Intrinsic Vulnerability Map
The intrinsic aquifer vulnerability map developed (
Figure 4b) drives the adoption of land-use restriction and safeguard measures around the abstraction points to ensure the preservation of water quality (static protection).
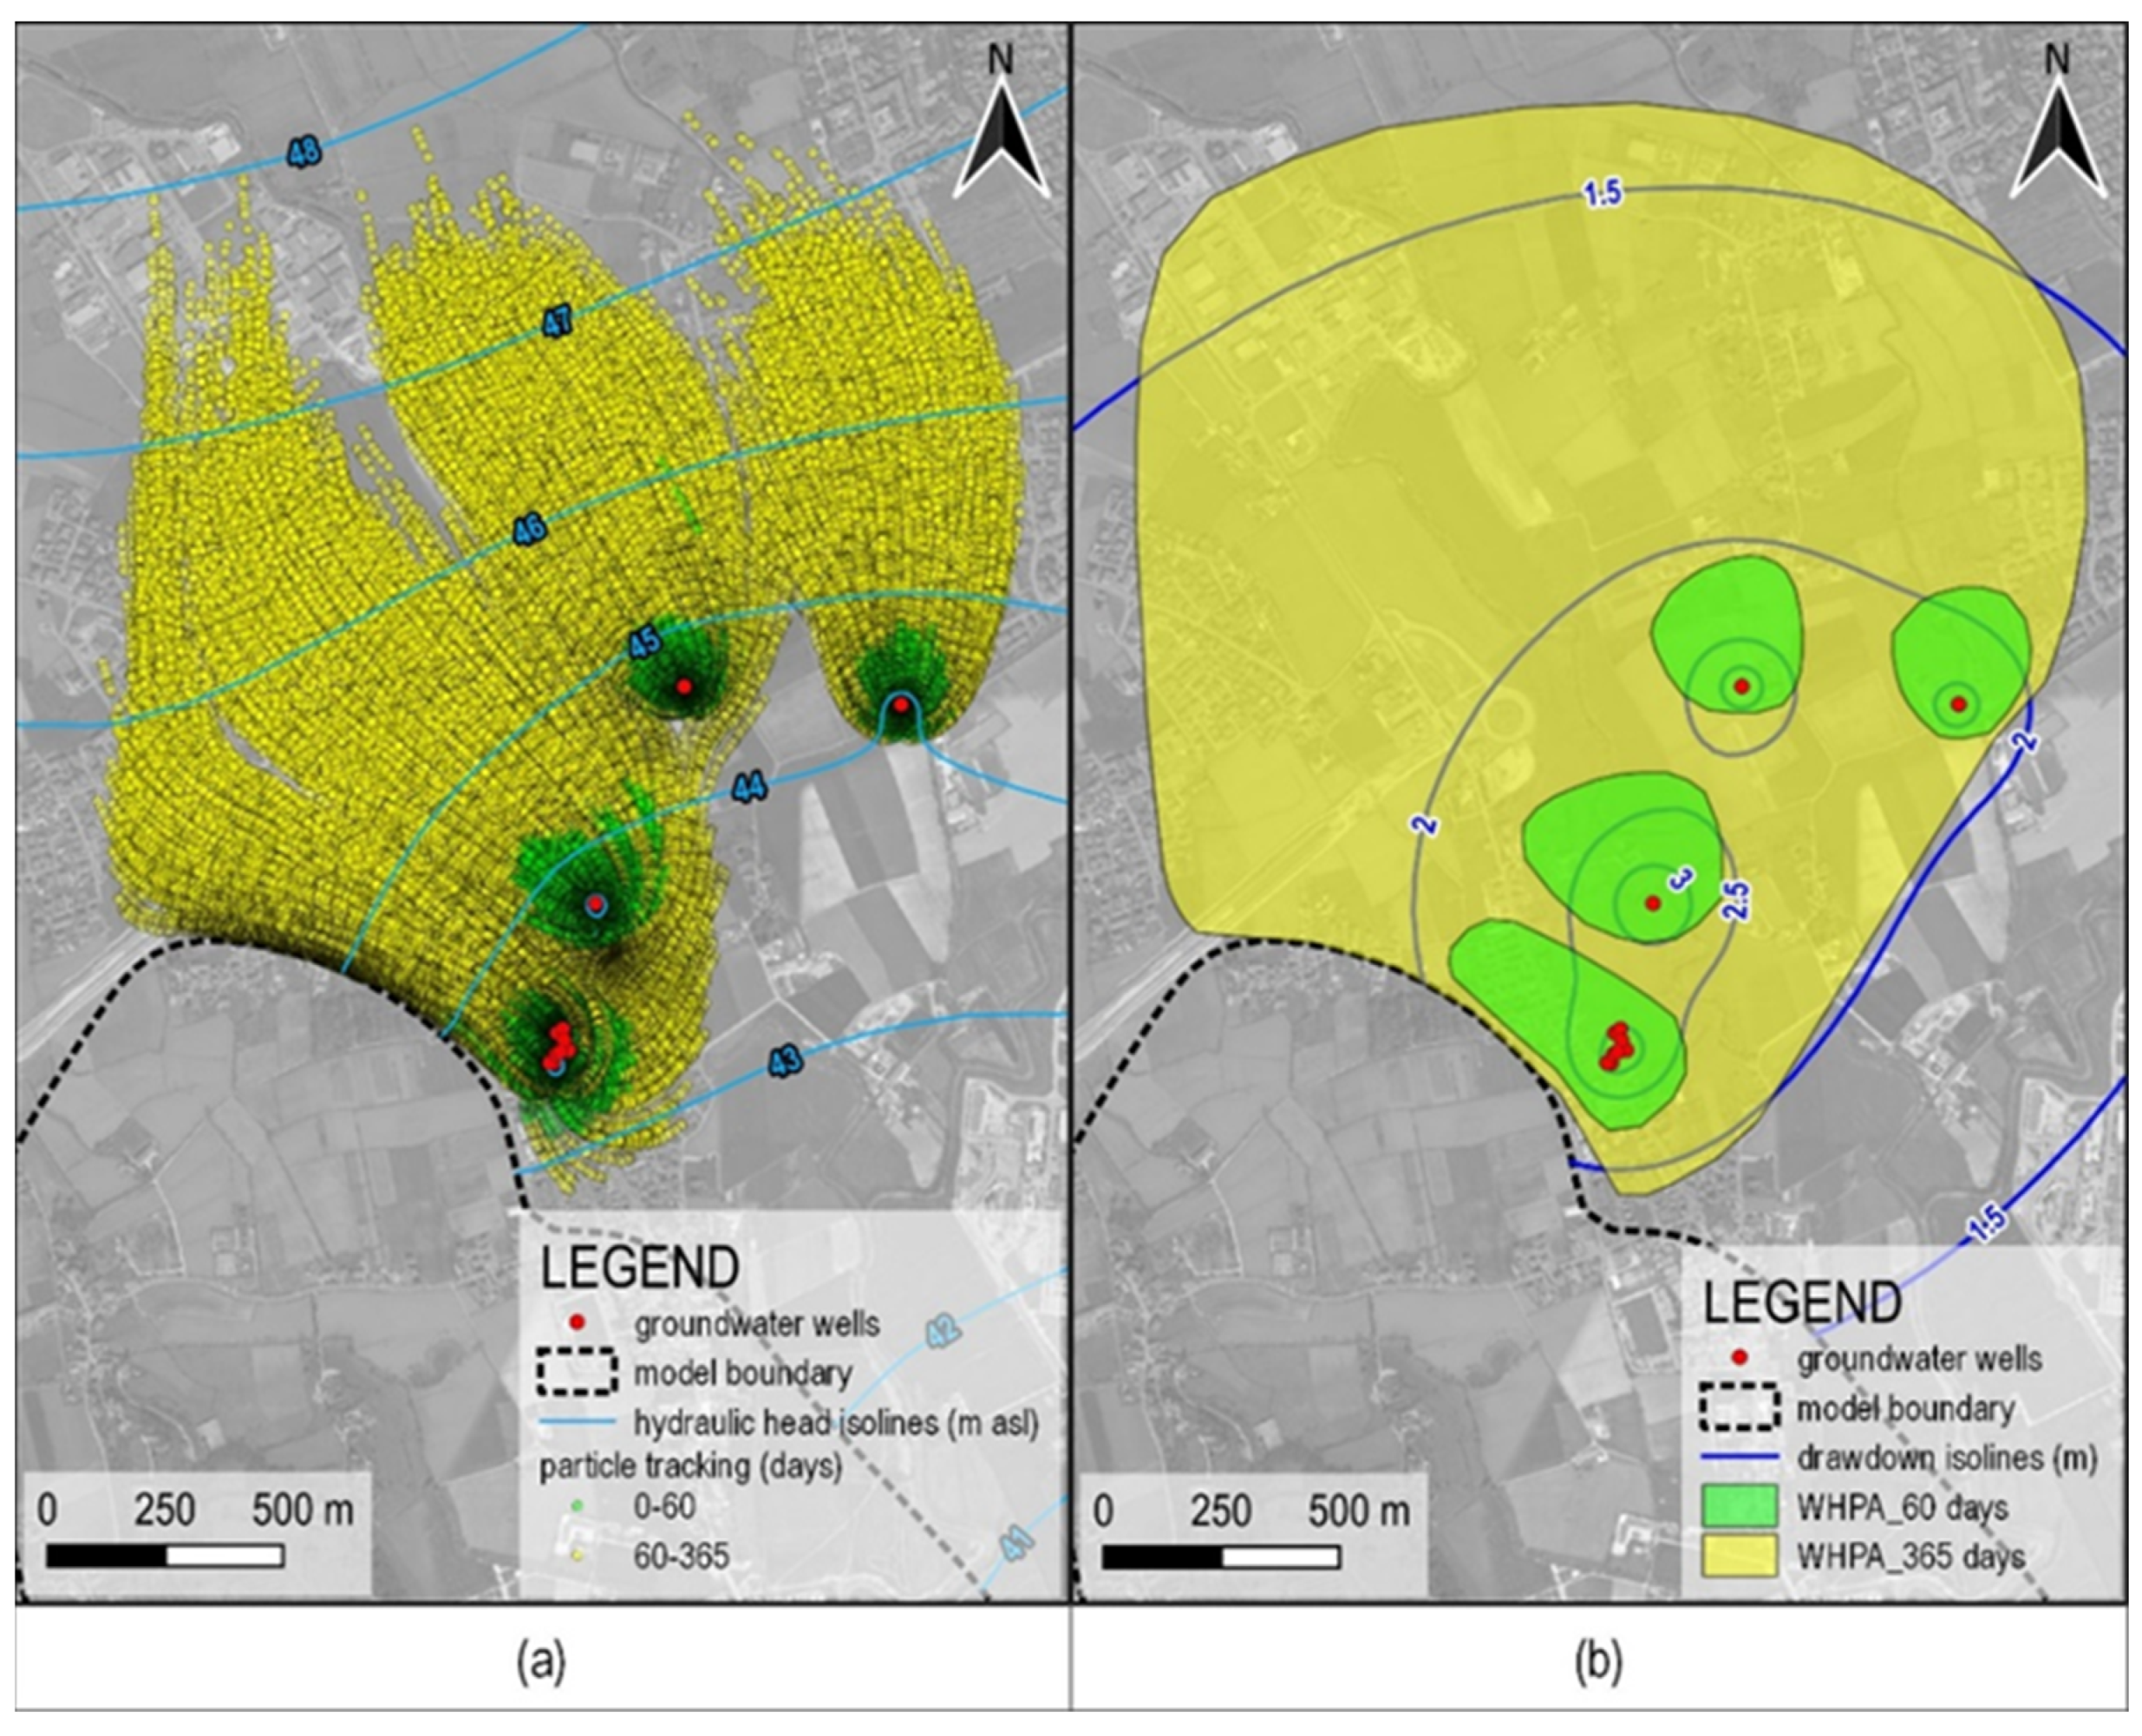
3.4. Numerical Model Results
The numerical modelling is functional to WHPAs identification and estimation of hydraulic drawdown, as well documented in many previous studies [
5,
6,
7]; the protection zones are directly outlined from particle tracking results, in relation to the 60 and 365 day isochrones, while the zone of influence is represented with drawdown isolines (
Figure 5).
In our case study, a series of Feflow model runs were implemented with stochastic generated parameter fields using the post-calibration Monte Carlo analysis provided by PEST; particle tracking results were then overlayered and integrated to obtain the WHPAs shapes. The final interpretation includes 50 selected realizations, based on different spatial distribution of hydraulic conductivity, all fitting the observation dataset below a predefined error threshold (normalized root mean squared error < 5%). Initial values of hydraulic conductivity were estimated from a series of pumping tests, ranging from 1 × 10⁻⁴ to 7 × 10⁻³ m/s.
The same process was initially conducted including other hydraulic parameters and boundary conditions, finding out that hydraulic conductivity’s influence on simulation results was significantly higher and then focusing the analysis on that specific parameter, with all the others fixed to their most prudential values.
Regardless of the method used, model results should always include a range of different outputs, depending on the uncertainty evaluation. As new experimental information becomes available, the prediction could be updated, and hopefully the numerical model reliability will progressively increase.
4. Conclusions
The implementation of WSP to the entire drinking supply chain represents a challenging paradigm, especially when dealing with the water abstraction. To assess the risk and implement effective and robust prevention and mitigation strategies, complex data research, acquisition, processing, and interpreting is required.
The case study presented the methodological steps was developed to assess the vulnerability aquifer classification and the wellhead protection areas of the Moracchino–Lobia pumping station. The exercise provided useful suggestions for tuning the main elements and influencing the technical and decision-making processes, reaching a conscious conceptualization of the hydrogeological system and implementation of the numerical model.
Aquifer structure is commonly outlined on the basis of available stratigraphical logs and cross sections, flow direction and gradient are derived from hydraulic head measurements, while hydraulic conductivity and effective porosity need experimental tests and bibliographic information to be assessed. A pumping test with drawdown observation in one or more monitoring wells is currently the most used and reliable method available for hydraulic conductivity estimation. On the other hand, effective porosity is exceedingly difficult to assess in the field, so that this variable is often assumed from bibliographic background in relation to aquifer granulometry. In most cases, the fundamental parameters remain unknown or not characterized enough. Some of the most critical issues are summarized as follows:
stratigraphical logs are very few or not deep enough on the investigated area, so it is very difficult to assess the continuity of impermeable layers and, consequently, the thickness and geometry of the aquifers;
few values of hydraulic parameter are available for a very large domain and, considering that all aquifers show a strong heterogenous pattern, it is not always possible to develop a representative simulation;
monitoring network is not present, so groundwater level variation is not properly evaluated, neglecting seasonal changes and possible groundwater flow rotations;
constructive details of the pumping wells (e.g., well-screens placement) are unknown;
available data does not allow to us correlate and gather feedback mechanisms between groundwater and river features that could directly recharge the groundwater wells or potentially influence their capture areas.
Field observations are particularly useful as calibration targets, including the typical inverse modelling optimization with hydraulic head measurements or further calibration techniques [
8], using water temperature monitoring or other types of experimental data. If possible, calibrating a numerical model with more than one dataset is advisable in order to verify the model response to different hydrogeological conditions and different observations.
Table 1 offers a scheme that summarizes the approach that may be adopted according to the degree of knowledge.
The current availability of advanced measurement technologies and high-definition characterization systems constitutes a substantial prerequisite to fill the main knowledge gaps and optimize the likelihood of the territorial representation.
The methodological approach described may support the water supply managers within the implementation of the WSP from a hydrogeological point of view.
Technical activities were organized and conducted in compliance with the available regional guidelines [
9] which govern groundwater use, starting from the quantitative evaluation of water resources capacity up to the environmental compatibility analysis of the withdrawal, utilization, and return flow.
The national framework of groundwater abstraction highlights the strategic and irreplaceable role of this resource, in constant balance between over-exploitation practices, qualitative issues (contamination events), territorial and climate transformations [
10].
Water Safety Plans seek concrete answers to the actual challenges associated with the sustainable management of groundwater: state-of-the-art numerical methods, when supported by reliable and robust information, periodically updated, and recalibrated, constitute an irreplaceable instrument to consolidate this paradigm.
Author Contributions
Conceptualization, A.S. and M.R.; software, L.V.; validation, A.S., L.V. and P.R.; formal analysis, S.B.; investigation, S.B.; resources, P.R.; data curation, S.B.; writing—original draft preparation, M.R.; writing—review and editing, M.R.; visualization, M.R.; supervision, A.S. All authors have read and agreed to the published version of the manuscript.
Funding
This research received no external funding.
Institutional Review Board Statement
Not applicable.
Acknowledgments
The work was carried out with the constant support of Giovanni Cappellari (Viacqua Spa), who is thanked for the useful technical discussions.
Conflicts of Interest
The authors declare no conflict of interest.
References
- European Commission. Guidance on preventing or limiting direct and indirect inputs in the context of the groundwater directive 2006/118/EC. Common implementation strategy for the WFD 2000/60/EC. In Guidance Document No. 17; European Commission: Luxembourg, 2007. [Google Scholar]
- Mari, G.M. Carta isofreatica. In Rilievi del Dicembre 1983 e Carta Piezometrica; Regione del Veneto, Segr. Reg. per il Territorio, Dipart. per l’Ecologia: Venezia, Italy, 1985. [Google Scholar]
- Rinaldo, A.; Altissimo, L.; Putti, M.; Passadore, G.; Monego, M.; Sottani, A. Modello matematico di flusso nei sistemi acquiferi dei territori dell’Autorità d’Ambito Territoriale Ottimale ATO Brenta. Relazione finale; Università degli Studi di Padova, Centro idrico di Novoledo, Provincia di Padova, Provincia di Vicenza, ATO Brenta: Padua, Italy, 2010. [Google Scholar]
- Civita, M.; De Maio, M.; Ubertini, L. Valutazione e cartografia Automatica della Vulnerabilità degli Acquiferi All’inquinamento con il Sistema Parametrico Sintacs R5: A New Parametric System for the Assessment and Automatic Mapping of Ground Water Vulnerability to Contamination; Pitagora: Rome, Italy, 2000. [Google Scholar]
- Paradis, D.; Martel, R.; Karanta, G.; Lefebvre, R.; Michaud, Y.; Therrien, R.; Nastev, M. Comparative study of methods for WHPA delineation. Ground Water 2007, 45, 158–167. [Google Scholar] [CrossRef] [PubMed]
- New Jersey Department of Environmental Protection (NJDEP); New Jersey Geological Survey. Guidelines for Well Head Protection Areas in New Jersey; New Jersey Department of Environmental Protection: Trenton, NJ, USA, 2003; 33p. [CrossRef]
- Environmental Protection Agency (EPA). Handbook: Ground Water and Wellhead Protection; EPA/625/R-94/001; EPA: Washington, DC, USA, 1994; 239p.
- Doherty, J. Calibration and Uncertainty Analysis for Complex Environmental Models; Watermark Numerical Computing: Brisbane, Australia, 2015.
- Regione del Veneto. Direttive tecniche per la delimitazione delle aree di salvaguardia in aree territoriali omogenee (prelievi di acque sotterranee destinate al consumo umano erogate mediante impianto di acquedotto) ALLEGATO A DGR nr. 1621 del 05 novembre 2019. 2019. Available online: https://bur.regione.veneto.it/BurvServices/pubblica/DettaglioDgr.aspx?id=407480 (accessed on 5 November 2019).
- Istat. Utilizzo e Qualità della Risorsa Idrica in Italia; Istituto Nazionale di Statistica: Roma, Italy, 2019; p. 104. [Google Scholar]
| Publisher’s Note: MDPI stays neutral with regard to jurisdictional claims in published maps and institutional affiliations. |
© 2022 by the authors. Licensee MDPI, Basel, Switzerland. This article is an open access article distributed under the terms and conditions of the Creative Commons Attribution (CC BY) license (https://creativecommons.org/licenses/by/4.0/).


