Abstract
Entropy and resilience metrics are proposed as indices to measure the robustness of water distribution networks (WDN) regarding pipe failures and permanent district metering areas (DMAs). Whereas pipe failures represent a temporary disruption of some pipes of WDN (i.e., pipe restoration or replacement), the creation of DMAs involves a permanent alteration closing multiple pipes simultaneously. Although entropy and resilience provide different information about network behavior, they are often used for the same purpose: cost-based multi-objective optimal network design techniques. However, the two metrics were compared with other commonly used hydraulic performance indicators to determine which of them could be better used as surrogate indices for water network robustness. For this purpose, the effects on entropy and resilience due to two different scenarios (pipe failures and permanent DMAs) were evaluated for a medium-sized water distribution network in southern Italy. The hydraulic simulations and water network partitioning were performed with a pressure-driven approach using SWANP 4.0 software.
1. Introduction
The issues of reliability and robustness of a water distribution network are widely discussed in the literature. In this context, evaluating the reliability of a water distribution system involves measuring the system’s ability to meet consumer demands for quantity and quality under both normal and abnormal operating conditions [1].
The measure of reliability is associated with the probability that the stochastic pressure at the node is above a prescribed minimum value. Indeed, robustness is generally defined as the ability of a system to maintain its function under a specified number of perturbations [2]. From this point of view, it allows a deterministic definition [3] and it includes the variation in system performance.
Since evaluating the reliability and robustness of water distribution networks could be computationally intensive and infeasible [4], several synthetic metrics [5,6,7] have been proposed to overcome these problems. Among all the proposals, the most important metrics used are the resilience index as defined in [8] and the flow entropy [9,10]. Both metrics are often compared as indirect measures of reliability [4,11,12] and robustness [3,13,14] of water networks.
In this paper, based on the results reported in [3], the generalized resilience failure index (GRF), proposed in [15], and the flow entropy (S) are investigated as surrogate measures of water network robustness. They are tested to quantify the ability of a real water network to maintain a given level of performance under two types of adverse conditions: the simultaneous break of two pipes and the multiple placements of shutoff (or isolation) valves to divide the network in permanent DMAs. All hydraulic simulations were carried out with a pressure-driven approach (PDA) using SWANP 4.0 software (www.swanp.net (accessed on 24 January2022)) [16].
2. Materials and Methods
In this study, the flow entropy, S, of water distribution network and the generalized resilience and failure index, GRF, are applied as entropy and resilience metrics, respectively. The following recursive formula [17] was used for the calculation of S, which is regarded as a measure of pipe flow rates uniformity:
On the right-hand side of Equation (1), the first term is the entropy of supply nodes and the second is the entropy of demand nodes; NS is the number of supply nodes; T is the total supplied flow rate; NN is the number of demand nodes; Qi represents the inflow at the i-th source node; Tj is the total flow rate reaching the j-th demand node; Qj is the water demand at the j-th demand node; qij is the flow rate in the pipe connecting node j with surrounding node i; and Nj is the number of pipes carrying water from the j-th demand node towards other surrounding nodes.
Whereas Equation (2) reports the formula of generalized resilience and failure index:
With
And
where quser and d are the vectors of the water discharges delivered to the users and the users’ demands, respectively. H, H0, and Hp are the vectors of total heads at demanding nodes, water sources, and pumps, respectively. Q0 and Qp are the vectors of supplied water discharges by water sources and pumps, respectively. Finally, Hdes = z + hdes, where z and hdes are the vectors of nodal ground elevations and desired nodal pressure, respectively.
To investigate the effectiveness of the flow entropy, S, and the generalized resilience failure index, GRF, as surrogates for the robustness of the water network, they are used to analyze different scenarios: pipe failure and permanent DMAs.
The first scenario, pipe failure, simulates the simultaneous break of two pipes except for the supply pipes connecting the water sources to the demand nodes. The number of network layouts obtained, Nl, is determined by the binomial coefficient (Equation (5)):
where, nc = 2 is the simultaneous number of closed pipes and Np is the total number of pipes in the water network.
The second scenario, permanent DMAs, allows to simulate different of network layouts with the simultaneous closure of numerous pipes (generally, the closed pipes are those in which the isolation valves are placed) that cause a permanent perturbation of the network [17]. Permanent DMAs were calculated using the following two-step methodology: the first step is the clustering phase, which aims to define the shape and size of each DMA; the second is the dividing phase, which determines the optimal positioning of flow meters and isolation valves [16]. In this work, using SWANP 4.0 software [16], three different algorithms were applied to compute the clustering phase with a number of DMAs from 2 up to 10: multilevel recursive bisection (MLRB) [18], edge betweenness community (EBC) [16] and spectral graph clustering (SC) [19]. For each algorithm, different combinations of weights are used for both nodes and pipes, which are summarized in Table 1.

Table 1.
Combinations of weights used for the execution clustering phase.
After clustering, the dividing phase is performed with SWANP 4.0 software, which consists of a heuristic optimal positioning of flow meters and isolation valves on pipes connecting different DMAs (so-called boundary pipes defined in the previous step of clustering phase). This phase was achieved using the non-dominated sorting genetic algorithm II (NSGA-II) [20] to minimize the following multi-objective constrained function (MOF):
where the first term of MOF represents the node power [18] and nfm is the number of flow meters. At the end of the optimization process, all Pareto front solutions for all clustering layouts were automatically considered to create the permanent DMAs scenario using SWANP 4.0 software.
In order to verify whether the proposed indices are able to synthesize the robustness of the network, the relationship between some indices commonly used to evaluate the hydraulic performance of water supply networks is investigated. In particular, the following indices are calculated [21]: the mean hydraulic pressure,
the standard deviation of the nodal pressure, h, from the desired pressure,
and the flow deficit index,
Hydraulic simulations were performed using the pressure-driven approach (PDA) [22] under peak conditions. The PDA approach assumes the formula described in [23] as a pressure–demand relationship at the nodes, in which the main variables were hmin and hdes, which represent the minimum pressure heads for outflow to users greater than 0 and for full satisfaction of user demand at the generic node, respectively.
3. Results
The ability of resilience and entropy indices to measure the robustness of water distribution networks was tested for the case study of Parete, a municipality with about 11,000 inhabitants in the province of Caserta. The hydraulic model of the Parete network was characterized by 184 nodes, 282 pipes with a total length of about 32 km, and a peak demand of 110 L/s and hdes = 19 m [3].
The total number of network layouts studied was 40.719 (39.060 for the pipe failure scenario and 1659 for the permanent DMAs scenario). With respect to the scenario of permanent DMAs, the combination of the clustering algorithm described in Table 1 generates 90 different sets of boundary pipes consisting of 4 to 62 elements. Based on the boundary pipes computed in the clustering phase, the dividing phase generates DMA layouts with a number of flow meters ranging from 0 up to 56.
Figure 1 shows the scatter plots of resilience and entropy for the two scenarios. The cloud scattering clearly shows that there is no form of correlation between S and GRF, which emphasizes that the two indices provide different information about the performance of the network in the proposed case study. However, with respect to the pipe failure scenario, a decreasing relationship between entropy and the positive values of the generalized resilience index can be seen, although the coefficient of determination is very low, R2 = 0.254. Despite no significant trends can be observed for the negative values of GRF, but the points tend to form different clouds.
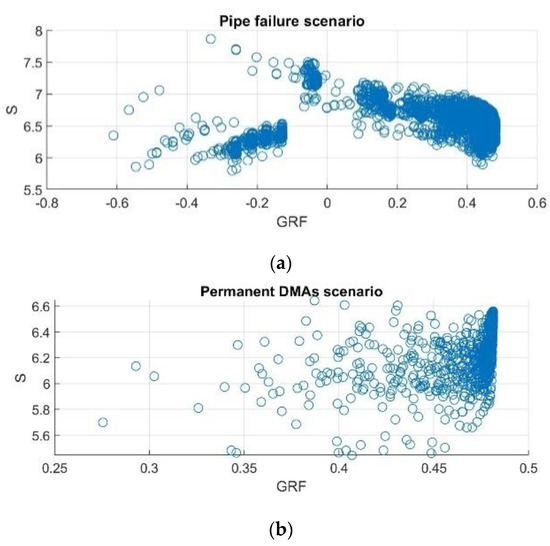
Figure 1.
Scatter plot of entropy, S, vs. generalized resilience failure index, GRF, for both scenarios: (a) pipe failure and (b) permanent DMAs.
Figure 2 and Figure 3 illustrate the relationship between entropy and mean pressure, and the generalized resilience index and mean pressure. The trends in Figure 2 are very similar to those in Figure 1. While the scatter point of the permanent DMAs scenario does not provide any information, the pipe failure scenario, as in Figure 1, highlights a low correlation for HM ≥ hdes (R2 = 0.262), which corresponds to positive values of GRF.

Figure 2.
Scatter plot of entropy, S, vs. mean hydraulic pressure, HM, for both scenarios: (a) pipe failure and (b) permanent DMAs.

Figure 3.
Scatter plot of generalized resilience failure index, GRF, vs. mean hydraulic pressure, HM, for both scenarios: (a) pipe failure and (b) permanent DMAs.
Conversely, as proven in another study by the authors [3], the resilience metric shows a strong correlation with the average nodal pressure for both scenarios, as evidenced by the determination coefficient for the two scenarios: 0.997 and 0.932.
The relationship between entropy and RMSH reported in Figure 4 indicates a very poor correlation for the pipe failure scenario (R2 = 0.251); a lack of correlation is also confirmed for the permanent DMAs scenario. Conversely, the trends of GRF versus RMSH, depicted in Figure 5, show a strong correlation for the scenario of permanent DMAs, while using RMSH in conjunction with GRF for the failure scenario provides a distinction between pressure surplus (corresponding to positive values of the resilience metric) and pressure deficit (corresponding to negative values of the resilience metric). Based on Equation (2), an excess of network power (multiple nodes with pressure greater than hdes) results in positive values of GRF, otherwise, a deficit of network power (multiple nodes with pressure lower than hdes).

Figure 4.
Scatter plot of entropy, S, vs. the standard deviation of the nodal pressure, RMSH, for both scenarios: (a) pipe failure and (b) permanent DMAs.
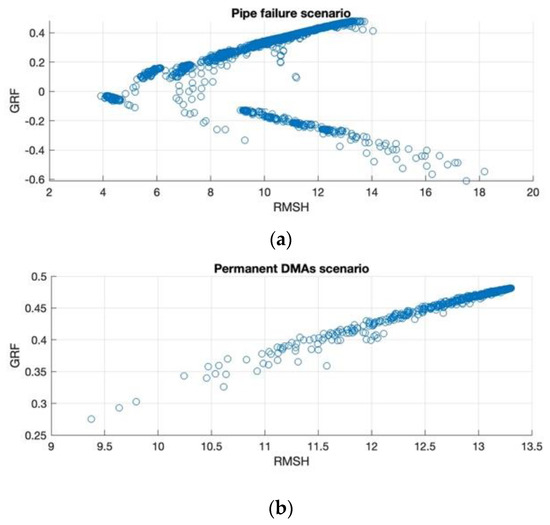
Figure 5.
Scatter plot of generalized resilience failure index, GRF, vs. the standard deviation of the nodal pressure, RMSH, for both scenarios: (a) pipe failure and (b) permanent DMAs.
The last relationships examined are those between entropy and FDI and the generalized resilience failure index and FDI. The results are given only for the scenario of pipe failure since all layouts of water network partitioning are designed to satisfy the condition that the nodal pressure is at least equal to hdes. In this case, the trends in Figure 6 describe a good correlation between GRF and FDI, while the entropy metric shows no significant correlation with FDI. When all node demands are fulfilled, the points in Figure 6 are clearly aligned along a vertical (FDI = 1).
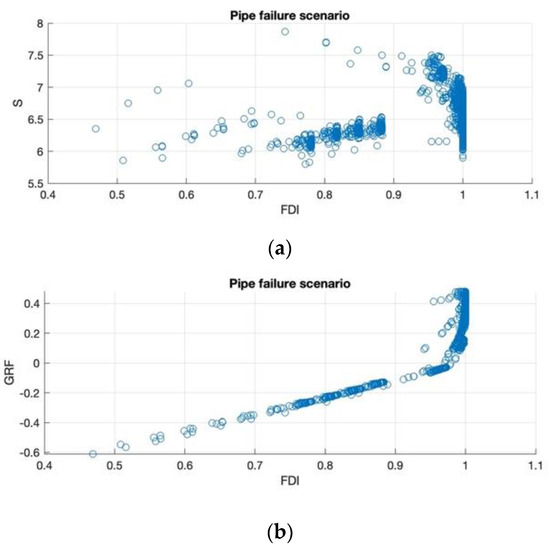
Figure 6.
Scatter plot of entropy (a) S vs. the flow deficit index, FDI, and (b) generalize generalized resilience failure index, GRF, vs. flow deficit index, FDI for the pipe failure scenario.
4. Conclusions
The definition of synthetic indices to measure the robustness of a water distribution system is essential to water network planning, rehabilitation, and partitioning. To this aim, the flow entropy, S, and the generalized resilience failure index, GRF, were compared using two scenarios: one based on the simultaneous failure of two network pipes and the other based on the placement of multiple isolation valves to define permanent DMAs.
The resilience and entropy metrics were calculated for the case study of the Parete water distribution network, and the hydraulic simulations were performed using SWANP 4.0 software with PDA approach.
Despite the previous work [3], a new scenario (permanent DMA) was calculated and the hydraulic simulations were performed using the PDA approach; however, the obtained results confirm what the authors showed in their earlier work: the two metrics provide different information about the water network, and the generalized resilience failure index shows a strong correlation with the common hydraulic performance indicators, especially with the mean pressure at the nodes.
Although the pipe failure scenario results show a low correlation between S and GRF, entropy cannot show the network’s ability to maintain an acceptable level of performance after a link failure occurs. Moreover, with respect to the scenario of permanent DMAs, the entropy metric has no significant correlation with any of the other more traditional hydraulic performance indices considered.
Since a correlation between flow entropy and some topological metrics has been observed [14], feature works could also consider this aspect to explore the additional information provided by entropy.
Author Contributions
Conceptualization, G.F.S., A.D.N. and R.G.; methodology, G.F.S.; writing—original draft preparation, G.F.S.; writing—review and editing, A.D.N. and R.G. All authors have read and agreed to the published version of the manuscript.
Funding
This research received no external funding.
Institutional Review Board Statement
Not applicable.
Informed Consent Statement
Not applicable.
Conflicts of Interest
The authors declare no conflict of interest.
References
- Xu, C.; Goulter, I.C. Probabilistic Model for Water Distribution Reliability. J. Water Resour. Plann. Manag. 1998, 124, 218–228. [Google Scholar] [CrossRef]
- Huizar, L.H.; Lansey, K.E.; Arnold, R.G. Sustainability, Robustness, and Resilience Metrics for Water and Other Infrastructure Systems. Sustain. Resilient Infrastruct 2018, 3, 16–35. [Google Scholar] [CrossRef]
- Greco, R.; Di Nardo, A.; Santonastaso, G. Resilience and Entropy as Indices of Robustness of Water Distribution Networks. J. Hydroinf. 2012, 14, 761–771. [Google Scholar] [CrossRef]
- Atkinson, S.; Farmani, R.; Memon, F.A.; Butler, D. Reliability Indicators for Water Distribution System Design: Comparison. J. Water Resour. Plann. Manag. 2014, 140, 160–168. [Google Scholar] [CrossRef]
- Liu, H.; Savić, D.A.; Kapelan, Z.; Creaco, E.; Yuan, Y. Reliability Surrogate Measures for Water Distribution System Design: Comparative Analysis. J. Water Resour. Plann. Manag. 2017, 143, 04016072. [Google Scholar] [CrossRef]
- Jung, D.; Kim, J.H. Water Distribution System Design to Minimize Costs and Maximize Topological and Hydraulic Reliability. J. Water Resour. Plann. 2018, 144, 06018005. [Google Scholar] [CrossRef]
- Wang, Q.; Huang, W.; Wang, L.; Zhan, Y.; Wang, Z.; Wang, X.; Zhan, X.; Liu, S. How Are Various Surrogate Indicators Consistent with Mechanical Reliability of Water Distribution Systems: From a Perspective of Many-Objective Optimization. Water 2019, 11, 1669. [Google Scholar] [CrossRef]
- Todini, E. Looped Water Distribution Networks Design Using a Resilience Index Based Heuristic Approach. Urban Water 2000, 2, 115–122. [Google Scholar] [CrossRef]
- Awumah, K.; Goulter, I.; Bhatt, S.K. Assessment of Reliability in Water Distribution Networks Using Entropy Based Measures. Stoch. Hydrol. Hydraul. 1990, 4, 309–320. [Google Scholar] [CrossRef]
- Tanyimboh, T.T.; Templeman, A.B. Calculating Maximum Entropy Flows in Networks. J. Oper. Res. Soc. 1993, 44, 383. [Google Scholar] [CrossRef]
- Setiadi, Y.; Tanyimboh, T.T.; Templeman, A.B. Modelling Errors, Entropy and the Hydraulic Reliability of Water Distribution Systems. Adv. Eng. Softw. 2005, 36, 780–788. [Google Scholar] [CrossRef]
- Creaco, E.; Franchini, M.; Todini, E. The Combined Use of Resilience and Loop Diameter Uniformity as a Good Indirect Measure of Network Reliability. Urban Water J. 2016, 13, 167–181. [Google Scholar] [CrossRef]
- Creaco, E.; Fortunato, A.; Franchini, M.; Mazzola, M.R. Comparison between Entropy and Resilience as Indirect Measures of Reliability in the Framework of Water Distribution Network Design. Procedia Eng. 2014, 70, 379–388. [Google Scholar] [CrossRef]
- Santonastaso, G.; Di Nardo, A.; Di Natale, M.; Giudicianni, C.; Greco, R. Scaling-Laws of Flow Entropy with Topological Metrics of Water Distribution Networks. Entropy 2018, 20, 95. [Google Scholar] [CrossRef]
- Creaco, E.; Franchini, M.; Todini, E. Generalized Resilience and Failure Indices for Use with Pressure-Driven Modeling and Leakage. J. Water Resour. Plann. Manag. 2016, 142, 04016019. [Google Scholar] [CrossRef]
- Di Nardo, A.; Di Natale, M.; Di Mauro, A.; Martínez Díaz, E.; Blázquez Garcia, J.A.; Santonastaso, G.F.; Tuccinardi, F.P. An advanced software to design automatically permanent partitioning of a water distribution network. Urban Water J. 2020, 17, 259–265. [Google Scholar] [CrossRef]
- Tanyimboh, T.; Sheahan, C. A Maximum Entropy Based Approach to the Layout Optimization of Water Distribution Systems. Civ. Eng. Environ. Syst. 2002, 19, 223–253. [Google Scholar] [CrossRef]
- Di Nardo, A.; Di Natale, M.; Santonastaso, G.F.; Venticinque, S. An Automated Tool for Smart Water Network Partitioning. Water Resour. Manag. 2013, 27, 4493–4508. [Google Scholar] [CrossRef]
- Di Nardo, A.; Giudicianni, C.; Greco, R.; Herrera, M.; Santonastaso, G.F. Applications of Graph Spectral Techniques Towater Distribution Network Management. Water 2018, 10, 45. [Google Scholar] [CrossRef]
- Deb, K.; Pratap, A.; Agarwal, S.; Meyarivan, T. A Fast and Elitist Multiobjective Genetic Algorithm: NSGA-II. IEEE Trans. Evol. Comput. 2002, 6, 182–197. [Google Scholar] [CrossRef]
- Di Nardo, A.; Di Natale, M.; Santonastaso, G.F.; Tzatchkov, V.G.; Alcocer-Yamanaka, V.H. Performance Indices for Water Network Partitioning and Sectorization. Water Supply 2015, 15, 499–509. [Google Scholar] [CrossRef]
- Creaco, E.; Di Nardo, A.; Iervolino, M.; Santonastaso, G. High-Order Global Algorithm for the Pressure-Driven Modeling of Water Distribution Networks. J. Water Resour. Plann. Manag. 2021, 148, 04021109. [Google Scholar] [CrossRef]
- Wagner, J.M.; Shamir, U.; Marks, D.H. Water Distribution Reliability: Simulation Methods. J. Water Resour. Plann. Manag. 1988, 114, 276–294. [Google Scholar] [CrossRef]


Publisher’s Note: MDPI stays neutral with regard to jurisdictional claims in published maps and institutional affiliations. |
© 2022 by the authors. Licensee MDPI, Basel, Switzerland. This article is an open access article distributed under the terms and conditions of the Creative Commons Attribution (CC BY) license (https://creativecommons.org/licenses/by/4.0/).