Proceeding Paper

Non-Revenue Water in Water Supply Systems of Serbia and Montenegro †

1
Department of Strategic Planning, Environmental Protection and International Cooperation, Jaroslav Černi Water Institute, 11226 Belgrade, Serbia
2
Waterworks Company Nikšić, 81400 Nikšić, Montenegro
*
Author to whom correspondence should be addressed.
Presented at the International Conference EWaS5, Naples, Italy, 12–15 July 2022.
Environ. Sci. Proc. 2022, 21(1), 10; https://doi.org/10.3390/environsciproc2022021010
Published: 19 October 2022

Abstract

:
Non-revenue water (NRW) can be expressed using different parameters (indices) in certain water supply systems (WSSs). The most used are percentages (as a share of NRW in system input water) and the infrastructure leakage index (ILI) based on the IWA methodology. The technical indicator of real losses (TIRLs) is also an index used for the estimation of certain WSS efficiency. Both real and apparent losses are significant in many WSSs in the Balkan region. Thirty-seven WSSs in Serbia and Montenegro, which differ in many aspects, were analyzed. After presenting the methodology and discussing the results, a conclusion is drawn, as well as general guidelines regarding the approach for the reduction of NRW for this region.

1. Introduction

Global warming and an increase in water demand are present in the countries of the Balkan region, as in many other parts of the world [1]. Some cities and regions have already observed a reduction in water source availability. As a result, water supply efficiency [2,3] and water management in general have become more important than ever [4,5]. Serbia and Montenegro are developing countries, and their water utility companies (WUCs) are faced with many challenges. The present drinking water (DW) price in all WSSs only covers operational costs and, in some cases, partial maintenance costs, but system development (upgrading) is possible only with some outside investment. Therefore, the price of DW should be increased to meet the economic DW price [6]. However, a gradual DW price increase till full cost recovery requires time. One of the main problems is the condition of the infrastructure (which includes ageing) and/or a lack of funds for certain improvements, which is contributing to increased water losses and NRW in general. Exceptions are WUCs (primarily larger ones), which have found a way to upgrade their WSS or to repair their infrastructure. It is important to increase awareness that operational and maintenance of one WSS requires significant funds and that the necessary developments require both time and funds.
The WSSs differ in many aspects [7]: regarding topography conditions, the amount of precipitation, water availability, population density and their habits, industries and institutions which are connected to the WSS, and the degree of rationality in managing of certain WSSs (degree of apparent losses, average pressure in the network, etc.) [8]. This paper analyzes the state of NRW in 37 cities of Serbia (SRB) and Montenegro (MNE). NRW in their systems ranges from 25% to 70%, with some exhibiting even higher percentages. The causes of these high NRW values are different, but they are primarily the result of decades of non-investment or relatively low investment in infrastructure. The condition for a WSS can be obtained through appropriate indicators, such as the ILI or TIRLs, and by discussing the results, possible directions for solving the problems can be pointed out. It has also been shown that the state of many WSSs is not as bad as perceived once they have been evaluated using some of these indices.

2. Methodology, Study Area, and Data

The International Water Association (IWA) has defined terms when calculating water balance components in a WSS. As various synonyms can be found in the literature for many of these [3,9] (such as entry in the system for system input volume or no-paid water for non-revenue water, etc.), in this paper, we shall use the terms defined in Table 1.
Non-revenue water (NRW) is calculated as the difference between system input volume (SIV) and billed authorized consumption, and they are often expressed as a percentage of SIV. Water losses (real + apparent) and unbilled authorized consumption compose NRW. Water losses, as well as NRW are generally higher in developing countries (to which Serbia and Montenegro belong), compared to developed countries. Expressed in percentages, the average NRW in a WSS in the analyzed regions of central Serbia is over 50%, while in Montenegro, it is higher—over 60% of SIV. When comparing different WSSs, NRW (in %) is not an adequate index as it does not consider all the relevant parameters. In addition to NRW (as % of SIV), two more indices are often used to express the efficiency of certain WSSs. These are the ILI and TIRL indices—the second is also abbreviated as RLB2 in some papers [9].
The TIRL index is the quotient of CARLs (in m3/year or in L/day) and the number of connections (Nc) in a certain WSS (usually expressed in L/connection/day). CARLs are actual real losses in the system. For a WSS where the water balance has been calculated, the obtained value is used for CARLs. For the remaining WSSs (majority of the analyzed systems), CARLs are calculated with the empirical formula:
CARL = (23.25 × Ln(NRW in %) − 55.67) × SIV/100
This empirical formula is based on the analyses of the water balance components of several WSSs and is related to those WSSs that have NRW higher than 20% (a great majority of WSSs in the region).
Perhaps the most popular indicator of the success of a WSS is the infrastructure leakage index (ILI). This index represents the quotient of actual losses in the system—CARLs and unavoidable annual losses (UARLs) (both are usually calculated in m3/year or in L/day). The ILI is calculated using the following formula:
ILI = CARL/UARL;
where:
As known, UARL = (18 × Lm + 0.80 × Nc + 25 × Lp) × P;
where:
  • Lm is the length of the water supply distribution network in km (existing data for all WSSs);
  • Nc is the number of user connections (existing data for all WSSs);
  • Lp is the total length of connection pipes from the street network to user water meters in km (the average length from the net to the user’s water flowmeter is 5 m for all WSSs);
  • P is the mean working pressure expressed in m—average values from 35 m (in the lowland) to 50 m (for very hilly areas) were adopted.
It can be seen from the formula that UARLs, as well as the ILI depend on the WSS’s characteristics, such as the total pipe length, number of connections, average pressure, and total length of connection pipes.
According to the World Bank Institute classification system, Table 2 presents the criteria for the estimation of the efficiency of a certain WSS (regarding water losses) for developing countries (using the ILI and TIRL index values):
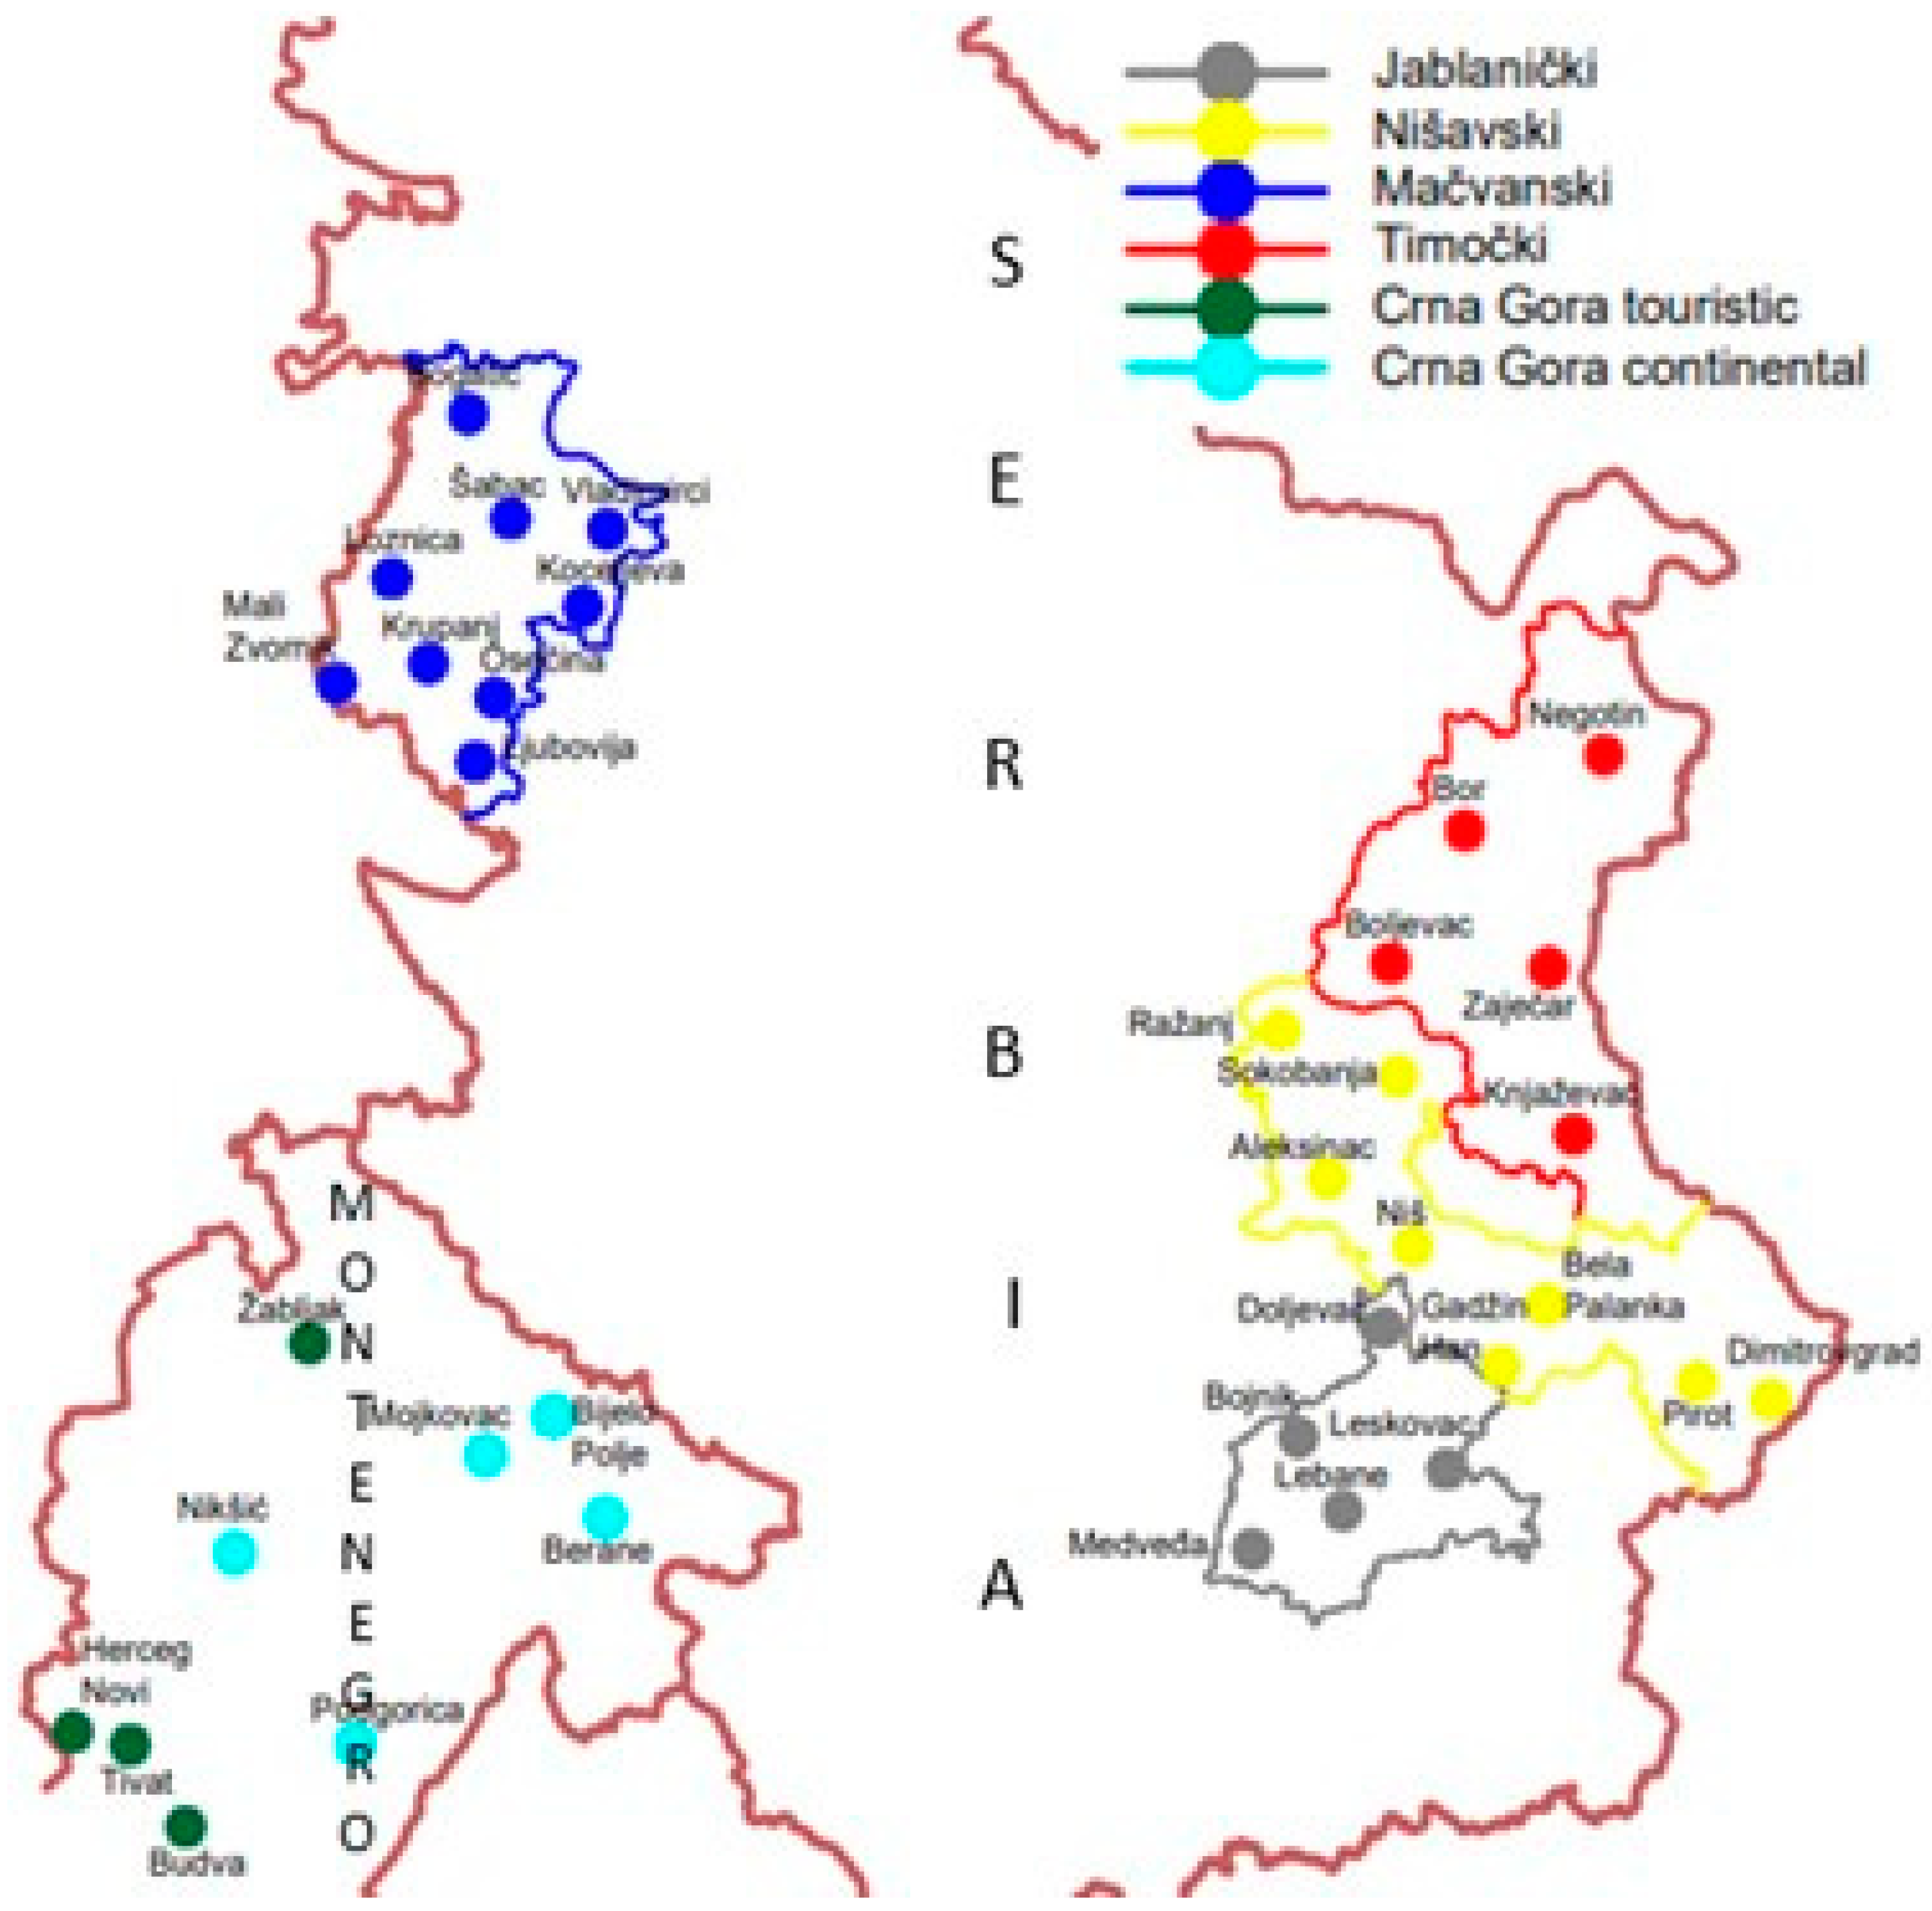
The study area covering Montenegro (10 WSS) and 4 regions with 27 WSSs (in total) in Serbia is shown in Figure 1.
The lack of sufficiently accurate data is a real problem with some/many WSSs. In general, “safer” data include data on the network length (Lm), number of connections (Nc), and revenue water (RW). Input data related to the total length of connection pipes from the street network to the user water meters (Lp) and the mean working pressure in the network (P) are estimated to have acceptable accuracy. The most challenging data are those related to the system input volume of water (SIV). The absence of flowmeters is not uncommon, leading to a very rough estimation. One such example is related to a relatively new (20 years old) regional water supply system built for the Bojnik and Doljevac municipalities. Water is abstracted from the Brestovac reservoir and treated at the Brestovac water treatment plant (WTP), which is located at a distance of 15 km. Following treatment, water is delivered to these two municipalities. The only existing flowmeter is installed upstream of the WTP. Similar situations exist in some other WSSs.
In addition to the calculated values of the indices for all CWSSs, correlations between NRW (in %) and the ILI and the classification of the considered CWSS based on the ILI and TIRL indices are presented and discussed. Additionally, total water demand per capita and billed consumption per capita, as well as pipe length per inhabitant and the number of inhabitants per connection were calculated, also followed by a discussion.

3. Results

The following Table 3, Table 4, Table 5, Table 6 and Table 7 present the results of the calculations of the TIRL, ILI, NRW, and CARL indices for the analyzed regions (cities) in Serbia and Montenegro. The year of input data differs from system to system, but most of them are from one of the past five years. In a few cases, where certain input data were not clearly indicated or greatly differed depending on the sources, averages were applied or the most probable assumption was made. Cities with a significant number of tourists (visitors) are underlined.
Table 3, Table 4, Table 5, Table 6 and Table 7 show that class A was recorded 14 times, B is the most frequent—36 times, C—23 times and D once (in sum, 74 classes = 2 indices × 37 CWSS). It could be said that classification is much more accurate when using the ILI and TIRL indices as opposed NRW (%). This is most likely due to the great pipeline length and numerous connections (low population density). When the ILI and TIRL classes of indicators are compared in Table 3, Table 4, Table 5, Table 6 and 
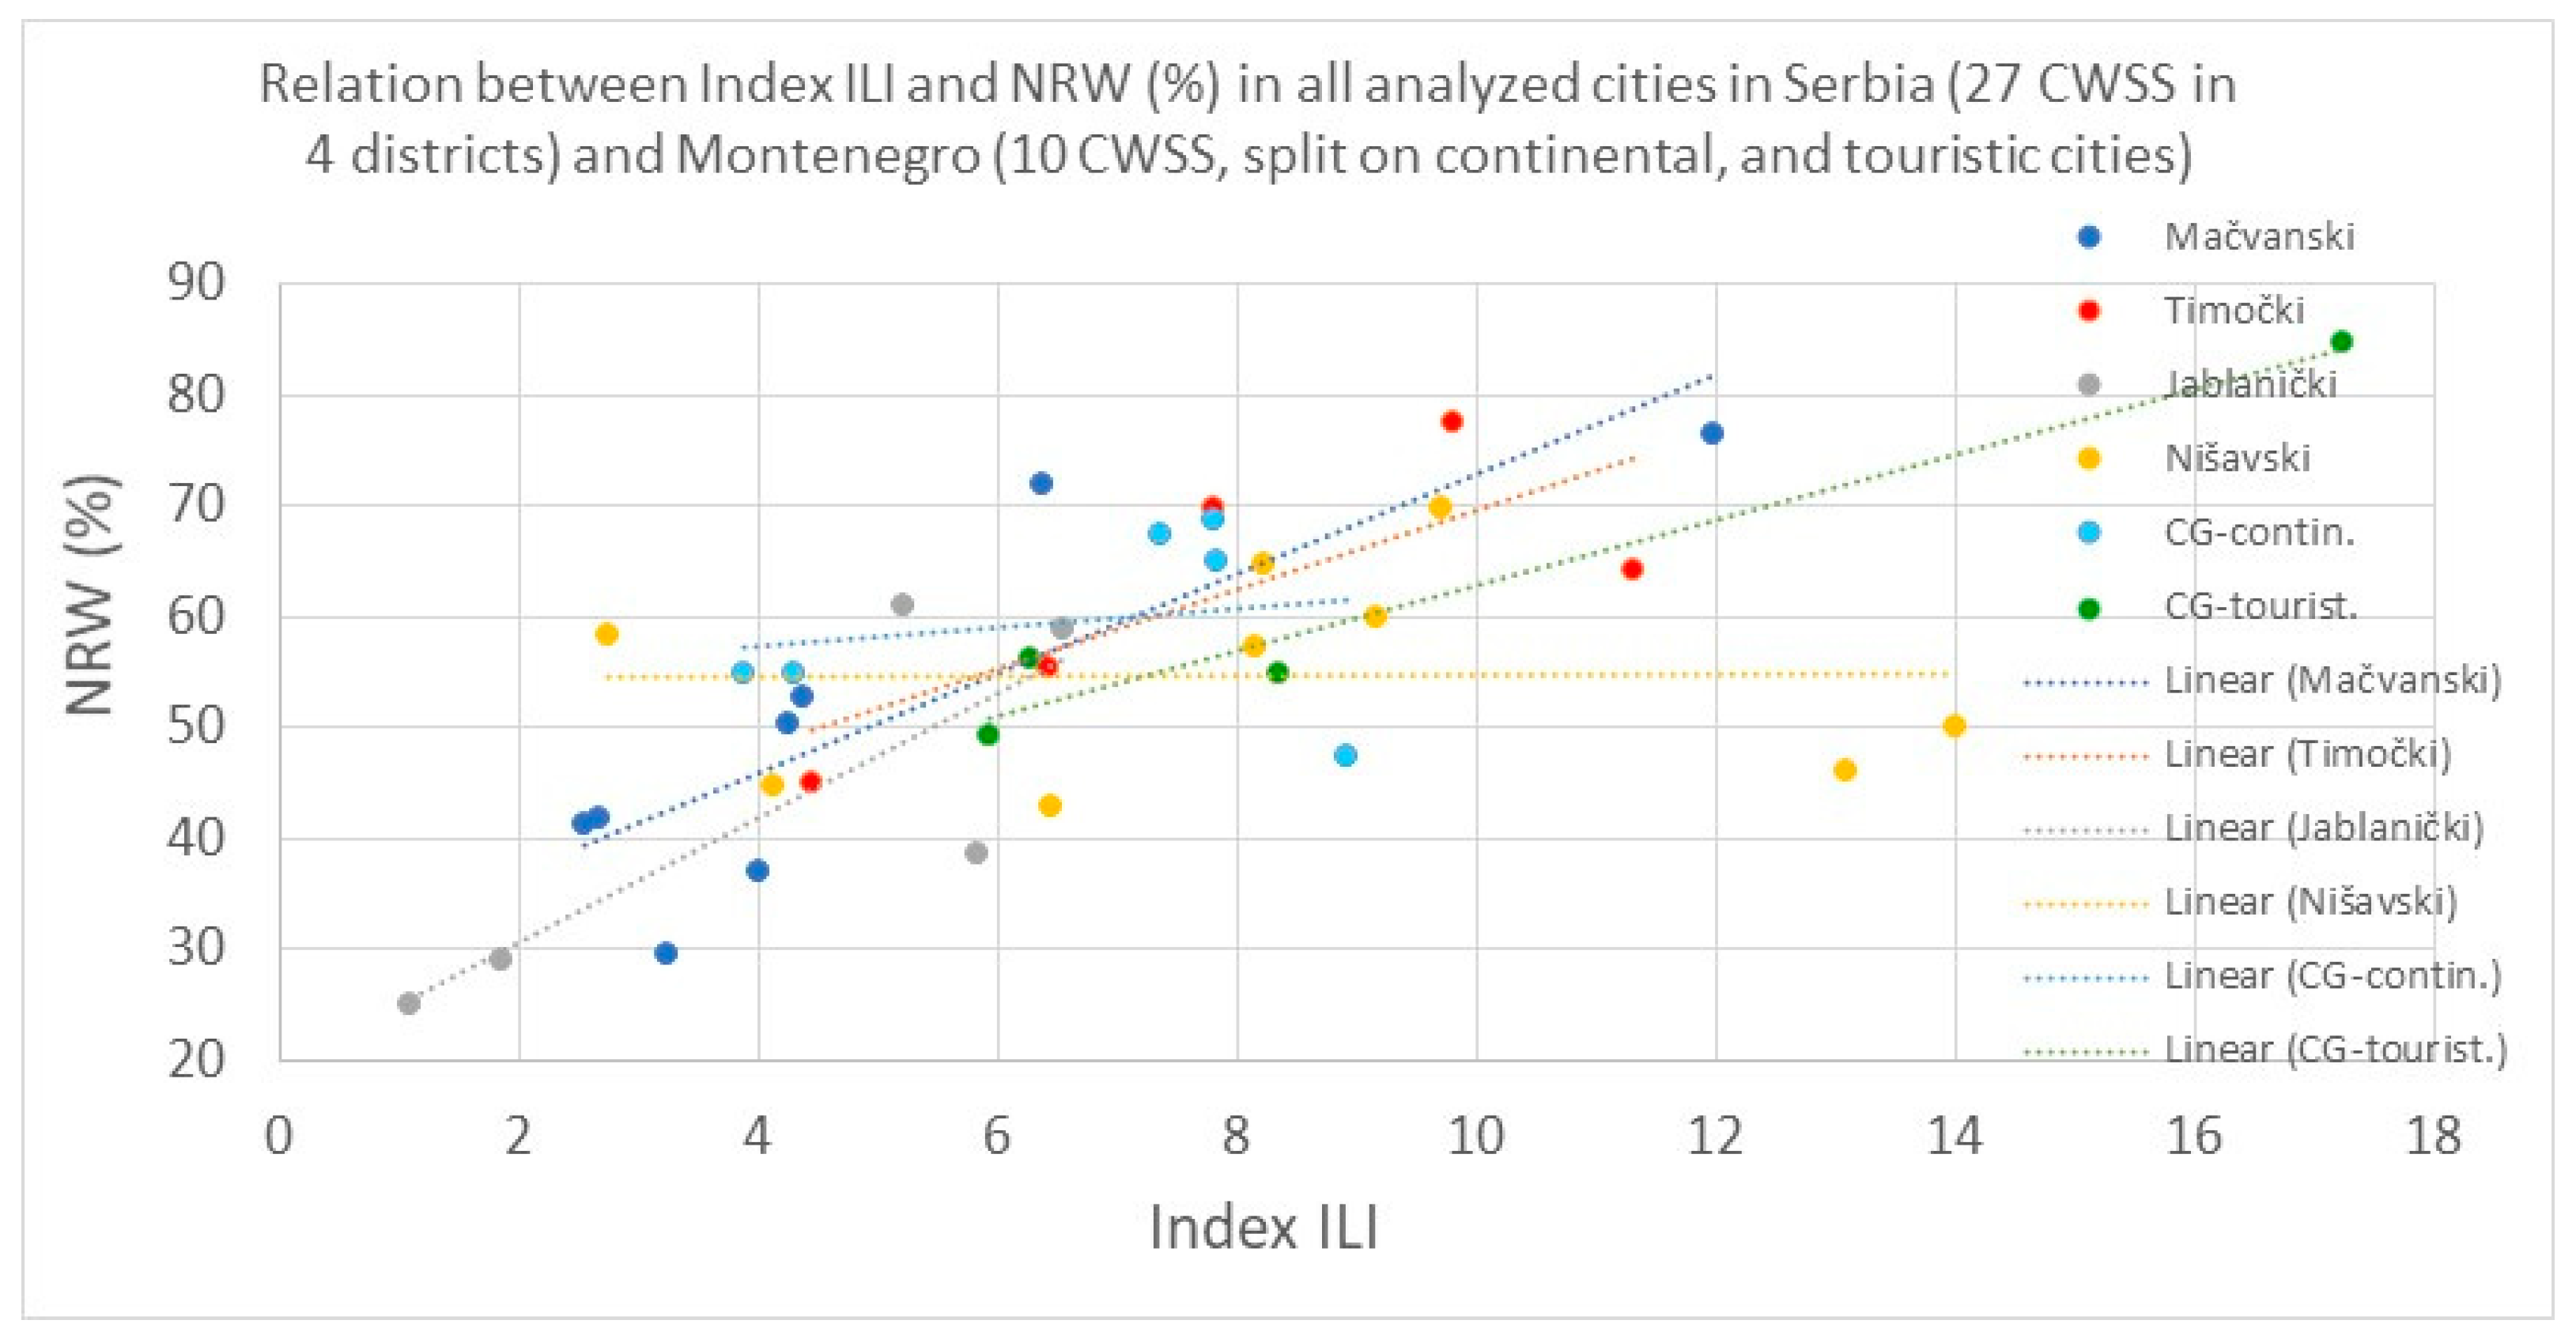
Table 7, there is practically no difference between them—24/37 have the same class. For 6/37, TIRLs reflect a better class, and for 7/37, and ILI reflects a better class (and all values in such cases are close to the boundary between the two classes). By applying an empirical formula (1) for the CARLs’ (%) calculation, the majority of obtained values (31/37) varied from 30% to 46%. If we compare the ILI and NRW% (Figure 2), only Nišavski district and, to some extent, Montenegro continental cities did not show any correlation between two indices.
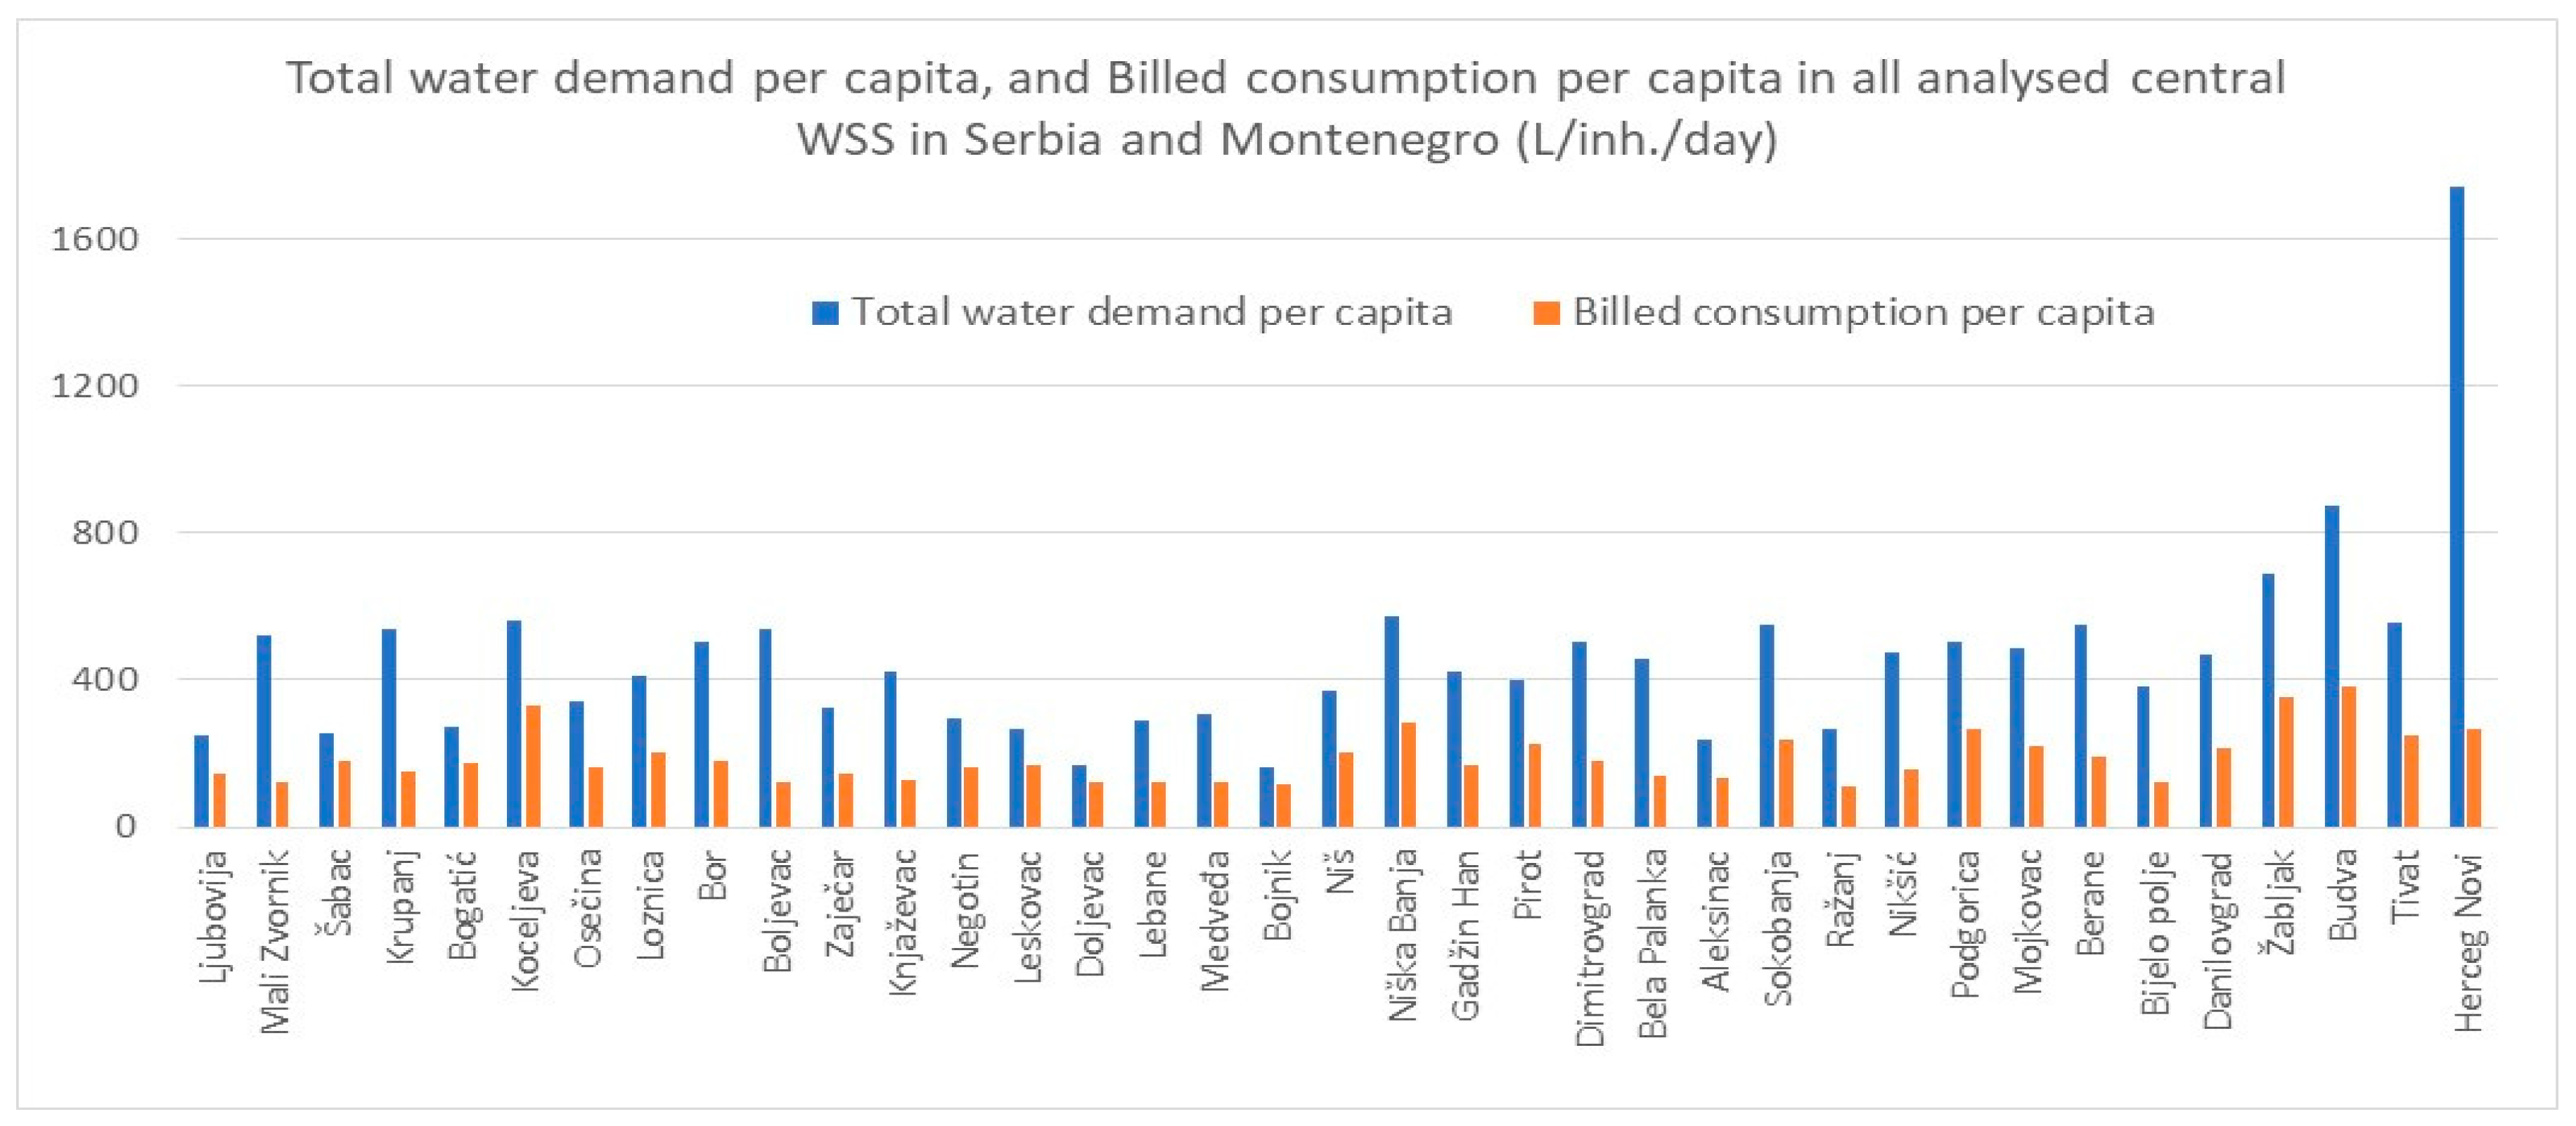
Total water demand per capita (calculated as the quotient of SIV and No. of connected inhabitants) and billed consumption per capita (calculated as a quotient of billed authorized consumption and No. of connected inhabitants) are presented in Figure 3, while total pipe length per inhabitant and number of inhabitants per connection are presented in Figure 4, for all analyzed CWSSs in the two countries. Table 8 presents the same data obtained as averages of all CWSSs for each of the six groups of regions (cities) in Serbia and in Montenegro.
Cities with the lowest billed consumption per capita (primarily households) are in the Jablanički district—the reasons for this are lower pressures in the network and the habits of people in this district, as well as the lack of water in two CWSSs during the driest parts of the year. As expected, the highest total water demand per capita and billed consumption per capita have touristic cities. This is similarly valid for the number of inhabitants per connection. Pipe lengths per inhabitant differ substantially (values higher than 25 are not shown for three CWSSs in Figure 4) and depend on the source’s locations and population density.
NRW (expressed in %) in CWSSs in cities in Montenegro is a little bit higher compared to CWSSs in central Serbia. Higher average pressure in the distribution network and higher levels of apparent losses, among other things, are likely the most important factors. Billed consumption (predominantly households) is also slightly higher in MNE, due to warmer climate conditions, which impact higher consumption [10].
Pressure in the network is a very important factor for WSS rationality and efficiency [8]. When all 37 CWSSs were grouped into a category depending on the estimated average pressure in the network (35 m, 40 m, 45 m, 50 m), the following average values for the ILI and NRW (%) were obtained (Table 9).
As the pressure in the network increases, the values of the considered indices also increase, and the average values for the cities with the lowest average pressure (35 m) show the importance of this parameter in regulating the state of certain water supply systems.

4. Conclusions

Insufficient funds for the maintenance and development of water supply systems have led to an increase in losses (NRW) for the majority of systems in both countries. Expressed as percentages, these are on average over 50% in central Serbia and over 60% in Montenegro. These are certainly high values, but if they are compared to the values obtained using the ILI, the situation is much more favorable. The reasons for this should be sought regarding the extensive network lengths and the large number of connections in relation to the number of inhabitants.
Due to insufficient funding, problems in reducing the losses of certain WSSs are generally greater in smaller systems than in larger ones. In addition to the apparent losses, which are slowly decreasing in most systems, the situation with real losses is much more difficult. Competent persons from WUCs often cite age and inadequate material used for pipelines as the main problems. The configuration of the terrain is also very important. The importance of pressure management in certain networks is neglected, as the results presented in this paper show. Quite often, there are large losses on the main pipeline, from the source to the treatment plant.
The situation in water supply systems is not satisfactory, but there is room for improvement with a good approach to troubleshooting—first maximizing the reduction of apparent losses, then systematically repairing, and reducing actual (real) losses, with adequate zoning and network pressure management.
Incidentally, it is noted that water quality issues, which are often the most significant of all issues in a certain water supply system, were not discussed in this paper.

Author Contributions

D.D. wrote the paper. M.B. helped in writing and preparing the figures. D.K. and M.P. gave relevant data and checked the paper. All authors have read and agreed to the published version of the manuscript.

Funding

This research was funded by IPA funds for the Adrian-Ionian region, through the MUHA Project.

Institutional Review Board Statement

Not applicable.

Informed Consent Statement

Not applicable.

Data Availability Statement

Not applicable.

Acknowledgments

To International Project MUHA (2020–2022) and UNESCO center II category Water for Sustainable Development and Adaptation to Climate change (WSDAC)—Belgrade.

Conflicts of Interest

The authors declare no conflict of interest.

References

  1. López-Ballesteros, A.; Senent-Aparicio, J.; Martínez, C.; Pérez-Sánchez, J. Assessment of Future Hydrologic Alteration due to Climate Change in the Aracthos River Basin (NW Greece). Sci. Total Environ. 2020, 733, 139299. [Google Scholar] [CrossRef]
  2. Tsitsifli, S.; Papadopoulou, A.; Kanakoudis, V.; Gonelas, K. Water Use Efficiency Current Status Assessment in the Context of WATenERgy CYCLE Project. Proceedings 2018, 2, 602. [Google Scholar] [CrossRef] [Green Version]
  3. Radivojević, D. Technical Indicators for Assessment of the Situation and Proposal of Measures for Improving the Performance of Smaller Water Supply Systems in the Republic of Serbia. Ph.D. Dissertation, University of Niš, Niš, Serbia, 2013. [Google Scholar]
  4. Bou-Zeid, E.; El Fadel, M. Climate Change and Water Resources in Lebanon and the Middle East. J. WR Plan. Manag. 2002, 128, 343–355. [Google Scholar] [CrossRef] [Green Version]
  5. Curk, B.C.; Vrhovnik, P.; Verbovšek, T.; Dimkić, D.; Marjanović, P.; Tahy, A.; Simonffy, Z.; Alessandro, C.; Nistor, M.M.; Cheval, S.; et al. Vulnerability of Water Resources to Climate Change in South-East Europe. In Proceedings of the AQUA 2015 42nd IAH Congress, Rome, Italy, 13–18 September 2015. [Google Scholar]
  6. Dimkić, D.; Milovanović, M.; Dimkić, M.; Milojković, S. Current and Economic Price of Water in Serbia. In Proceedings of the 4th EWaS International Conference: Valuing the Water, Carbon, Ecological Footprints of Human Activities, Online, 24–27 June 2020. Environ. Sci. Proc. 2020, 2, 45. [Google Scholar] [CrossRef]
  7. Kujundzic, B. Large Water Supply Systems; Association for Water Technology and Sanitary Engineering: Belgrade, Serbia, 1996; ISBN 86-82931-01-X. [Google Scholar]
  8. Babić, B.; Đukić, A.; Stanić, M. Managing Water Pressure for Water Savings in Developing Countries. Water SA 2014, 40, 221. [Google Scholar] [CrossRef] [Green Version]
  9. Ociepa, E.; Mrowiec, M.; Deska, I. Analysis of Water Losses and Assessment of Initiatives Aimed at their Reduction in Selected Water Supply Systems. Water 2019, 11, 1037. [Google Scholar] [CrossRef] [Green Version]
  10. Dimkić, D. Temperature Impact on Drinking Water Consumption. In Proceedings of the 4th EWaS International Conference: Valuing the Water, Carbon, Ecological Footprints of Human Activities, Online, 24–27 June 2020. Environ. Sci. Proc. 2020, 2, 31. [Google Scholar] [CrossRef]
Figure 1. Locations of the cities where the CWSSs were analyzed.
Environsciproc 21 00010 g001
Figure 2. Relation between ILI and NRW (%) indices in all analyzed cities of Serbia and Montenegro.
Environsciproc 21 00010 g002
Figure 3. Total water demand per capita and billed consumption per capita in 37 analyzed cities in SRB and MNE.
Environsciproc 21 00010 g003
Figure 4. Total pipe lengths per inhabitant and No. of inhabitants per connection in all 37 analyzed CWSSs.
Environsciproc 21 00010 g004
Table 1. Water balance components in certain WSS-IWA Standard Terminology; Source: IWA (2000).
System Input VolumeAuthorised ConsumptionBilled Authorised ConsumptionBilled Metered ConsumptionRevenue Water
Billed Unmetered Consumption
Unbilled Authorised ConsumptionUnbilled Metered ConsumptionNon-Revenue Water (NRW)
Unbilled Unmetered Consumption
Water LossesApparent LossesUnauthorised Consumption
Metering Inaccuracies
Real LossesLeakage on Transmission and/or Distribution Mains
Leakage and Overflows at Utility’s Storage Tank
Lekage on Service Connections up to point of Customer Metering
Table 2. TIRL and ILI criteria for the estimation of WSS efficiency.
Efficient CategoryILITIRL (L/Connection/Day) When System Is under Operating Pressure of:
30 m35 m40 m45 m50 m
Developing countriesA1–4<150<175<200<225<250
B4–8150–300175–350200–400225–450250–500
C8–16300–600350–700400–800450–900500–1000
D>16>600>700>800>900>1000
A—very good state; B—good state; C—acceptable state; D—bad state.
Table 3. Number of inhabitants connected to the CWSS, input data, calculated parameters, indices TIRL and ILI (with classes), NRW, and CARLs (in %) for the central WSSs in municipalities of the Jablanički region—Serbia.
Central WSS in MunicipalityNo. of Con. Inhab.103Input DataCalculated ParametersIndices
LmNcLpPSIVRWNRWUARLsCARLsTIRLsILINRWCARLs
kmkmm103·m3/y103·m3/y103·m3/y103·m3/y103·m3/yL/con./d-%%
Leskovac79.254122,367112357.7684.7782.9903892.269278 (B)5.8 (B)38.529.2
Doljevac2.580704435152114382729113 (A)1.1 (A)25.019.2
Lebane10.0107330717351.06643862864417345 (B)6.5 (B)58.939.1
Medveđa3.750140674041916325632167326 (B)5.2 (B)61.139.9
Bojnik6.584234812353882761124787102 (A)1.9 (A)28.822.5
Average values of indices for the Jablanički region2334.042.530.0
Table 4. Number of inhabitants connected to the CWSS, input data, calculated parameters, indices TIRL and ILI (with classes), NRW, and CARLs (in %) for central WSSs in municipalities of the Nišavski region—Serbia.
Central WSS in MunicipalityNo. of Con. Inhab.103Input DataCalculated ParametersIndices
LmNcLpPSIVRWNRWUARLsCARLsTIRLsILINRWCARLs
kmkmm103·m3/y103·m3/y103·m3/y103·m3/y103·m3/yL/con./d-%%
Niš230.387541,8602094031.22216.84314.37979510.420682 (C)13.1 (C)46.133.4
Niška Banja12.348230012401.73486786744612729 (C)14.0(C)50.035.3
GadžinHan1.42275043532312919414128466 (C)9.2 (C)60.039.5
Pirot44.822516,70084456.5003.7122.7883202.062338 (B)6.4 (B)42.931.7
Dimitrovgrad7.655411721401.39749590270576383 (B)8.2 (C)64.641.2
B. Palanka7.742295015451.28938890157555516 (C)9.7 (C)69.943.1
Aleksinac31.620511,90660402.7181.5061.212215887204 (B)4.1 (B)44.632.6
Sokobanja7.948350018501.50068181975560438 (B) 7.5 (B)54.637.3
Ražanj1.8311485735173721012567.4124 (A)2.7 (A)58.338.9
Average values of indices for the Nišavski region4318.354.637.0
Table 5. Number of inhabitants connected to the CWSS, input data, calculated parameters, indices TIRL and ILI (with classes), NRW, and CARLs (in %) for central WSSs in the municipalities of the Timočki region—Serbia.
Central WSS in MunicipalityNo. of Con. Inhab.103Input DataCalculated ParametersIndices
LmNcLpPSIVRWNRWUARLsCARLsTIRLsILINRWCARLs
kmkmm103·m3/y103·m3/y103·m3/y103·m3/y103·m3/yL/con./d-%%
Bor37.940011,07455407.0002.5004.5002552.879712 (C)11.3 (C)64.341.1
Boljevac6.1105207510401.20027093056546720 (C)9.8 (C)77.545.5
Zaječar47.732018,07690405.6002.5003.1003282.108320 (B)6.4 (B)55.437.7
Knjaževac22.1277850043403.4001.0302.3701881.462471 (C)7.8 (B)69.743.0
Negotin18.411010,34652352.0001.100900148657174 (A)4.5 (B)45.032.8
Average values of indices for the Timočki region4798.062.440.0
Table 6. Number of inhabitants connected to the CWSS, input data, calculated parameters, indices TIRL and ILI (with classes), NRW, and CARLs (in %) for CWSSs in municipalities of the Mačvaski region (SRB) and averages for Serbia.
Central WSS in MunicipalityNo. of Con. Inhab.103Input DataCalculated ParametersIndices
LmNcLpPSIVRWNRWUARLsCARLsTIRLsILINRWCARLs
kmkmm103·m3/y103·m3/y103·m3/y103·m3/y103·m3/yL/con./d-%%
Ljubovija7.11622469124065037827276203225 (B)2.7 (A)41.931.2
M. Zvornik7.047281014401.3323141.01850601586 (C)12.0 (C)76.445.1
Šabac69.441330,750154356.4374.5341.9034581.485132 (A)3.2 (A)29.623.1
Krupanj4.2962348124083023259857363424 (C)6.4 (B)72.043.8
Bogatić5.7432555133556735820940160172 (A)4.0 (B)36.928.2
Koceljeva4.531033661735920540380111284231 (B)2.6 (A)41.330.8
Osečina3.988131074049023225841179375 (B)4.4 (B)52.736.5
Loznica54.389832,573163408.1164.0404.0766762.872242 (B)4.2 (B)50.235.4
Average values of indices for the Mačvanski region2985.050.134.0
Average values of indices for 27 CWSSs in Serbia3646.552.535.4
Table 7. No. of inhabitants connected to the CWSS, input data, calculated parameters, indices TIRL and ILI (with classes), NRW, and CARLs (in %) for CWSSs in cities in continental (first 6) and touristic (last 4) regions in Montenegro.
Central WSS in MunicipalityNo. of Con. Inhab.103Input DataCalculated ParametersIndices
LmNcLpPSIVRWNRWUARLsCARLsTIRLsILINRWCARLs
kmkmm103·m3/y103·m3/y103·m3/y103·m3/y103·m3/yL/con./d-%%
Nikšić6575023,7001195011.3003.7007.6006464766551 (C)7.4 (B)67.342.2
Podgorica175120068,0003404032,30016,98515.3151.23410,998443 (C)8.9 (C)47.434.1
Mojkovac3.5363300174062028034054232193 (A)4.3 (B)54.837.4
Berane2017092004650400014002.6002111655493 (B)7.8 (B)65.041.4
Bijelo polje2517080004050350011002.4001911492511 (C)7.8 (B)68.642.6
Danilovgrad1860080004045310014001.7002991160397 (B)3.9 (A)54.837.4
Žabljak2.543160084563032031037220377 (B)5.9 (B)49.234.9
Budva2530030,00015040800035004.5004843042278 (B)6.3 (B)56.338.0
Tivat1310081004135264311921.451119990335 (B)8.3 (C)54.937.5
HercegNovi2220421,5001084514,024213011.8943876671850 (C)17.2(D)84.847.6
Average values of indices for 10 CWSS in Montenegro4437.860.339.3
Average indices for CWSSs for cities in the continental part of Montenegro4316.759.739.2
Average indices for CWSSs for cities in the touristic part of Montenegro4609.561.339.5
Table 8. Total water demand per capita, billed consumption per capita, total pipe length per inhabitant, and number of inhabitants per connection—averages of 6 groups of all analyzed 37 CWSSs in Serbia and Montenegro.
Group of Regions in Serbia and Group of Cities in MontenegroTotal Water Demand per Capita (L/Con.Inh/Day)Billed Consumption per Capita (L/Con.Inh/Day)Total Pipe Length in WSS/No. of Connect. Inhab. (m/Con.Inh)No. of con. inh./No. of User Connections (Inh/Con)
Jablanički region in Serbia24012915.23.1
Nišavski region in Serbia4201867.52.8
Timočki region in Serbia41714710.62.7
Mačvanski region in Serbia39418321.72.2
Continental cities of Montenegro47819412.92.3
Touristic cities of Montenegro96831311.51.3
Table 9. Average values for the ILI and NRW% depending on estimated average pressure in the net.
List of Cities with Approximately the Same Average Pressure in the Net, by CategoryAverage Pressure (m)Average ILIAverage NRW (%)
Leskovac, Doljevac, Lebane, Bojnik, Gadžin Han, Ražanj, Negotin, Šabac, Bogatić, Koceljeva, Tivat 354.543.4
Medveđa, Niš, Niška Banja, Dimitrovgrad, Aleksinac, Bor, Boljevac, Knjaževac, Zaječar, Ljubovija, Mali Zvornik, Krupanj, Osečina, Loznica, Podgorica, Mojkovac, Budva407.657.9
Pirot, Bela Palanka, Danilovgrad, Žabljak, Herceg Novi458.660.3
Sokobanja, Nikšić, Berane, Bijelo Polje507.864.5
Publisher’s Note: MDPI stays neutral with regard to jurisdictional claims in published maps and institutional affiliations.

