Next Article in Journal
Drone-Based Ecohydraulic Signatures of Fully-Vegetated Ditches: Real-Scale Experimental Analysis
Previous Article in Journal
Assessing Cyber-Physical Threats under Water Demand Uncertainty
 
 
Please note that, as of 4 December 2024, Environmental Sciences Proceedings has been renamed to Environmental and Earth Sciences Proceedings and is now published here.
Proceeding Paper

Effects of Vegetation Density on Sediment Transport in Lateral Cavities †

by
Luiz Eduardo Domingos de Oliveira
1,2,*,
Felipe Rezende da Costa
1,
Carlo Gualtieri
2 and
Johannes Gérson Janzen
1
1
Faculty of Engineering, Architecture and Urban Planning, and Geography, Federal University of Mato Grosso do Sul, Campo Grande 79070-900, Brazil
2
Department of Civil, Building and Environmental Engineering, University of Naples Federico II, 80125 Napoli, Italy
*
Author to whom correspondence should be addressed.
Presented at the International Conference EWaS5, Naples, Italy, 12–15 July 2022.
Environ. Sci. Proc. 2022, 21(1), 16; https://doi.org/10.3390/environsciproc2022021016
Published: 19 October 2022

Abstract

:
In rivers and canals, lateral cavities are regions of low velocities and recirculation, which have ecological importance, such as sediment retention. The presence of vegetation in cavities has the potential to modify the flow and alter the retention of sediments inside the cavity. In this study, the impact of vegetation on hydrodynamics and sediment transport was investigated with a numerical model. The vegetation density was distributed from 0 to 10.65% in four cases. Sediment transport was investigated through the Rouse number, Hjulström, and Shields diagrams. The increase in vegetation density did not change the predominant sediment transport type. Furthermore, the increase in vegetation favoured the deposition of sediments in the lateral cavity.

1. Introduction

Lateral cavities are semi-enclosed volumes adjacent to the main channel flowing along its only open side, being found in a single cavity (as in the present study) or a series of cavities, occurring naturally or man-made. The presence of cavities in rivers (a) increases the lateral macro-roughness in rivers [1], (b) drives mass exchange processes with the open channel [2,3,4,5], (c) acts as transient storage zones [6,7], and (d) enhances biodiversity in the system [8,9,10].
Cavities are characterized by the presence of a recirculation system with slow velocity magnitudes. Inside the cavity, the flow velocity can become zero at the centre of the circulation and have magnitudes up to 60% of the main channel velocity [11]. These slow velocity profiles contribute to the settling of particles as the flow traction force is lower. The retention of fine sediments and, consequently, nutrients can constitute a favourable substrate for vegetation establishment and growth [12,13]. The presence of vegetation decreases the flow velocity and turbulence [11,14], increasing the functionality of lateral cavities by giving refuge and sustaining fish communities [15,16,17], trapping suspended material [18], and protecting from bank erosion [19].
Little is known about the influence of vegetation on the processes that happen inside a cavity, especially those related to sediment transport. For example, to the best of the authors’ knowledge, nobody has inferred from the hydrodynamics regions in the cavity that the possibility of deposition of sediment is higher. Thus, in this study, we investigated the effect of vegetation density inside a cavity on sediment transport.
This paper is organized into five main sections. Following the introduction, the details of the numerical model are described, along with the grid independence test and solution quality. Third, the main results about flow hydrodynamics and sediment transport are presented. Fourth, the results are discussed and, finally, conclusive remarks about the influence of vegetation on sediment transport inside lateral cavities are presented.

2. Materials and Methods

2.1. Model Equations

The simulations were performed in a computational fluid dynamics (CFD) environment. The approach used to solve the flow and turbulence was the large Eddy simulation (LES), which uses spatial filtering of the Navier–Stokes equations [20]. In this model, the fluid was considered incompressible, which simplifies the conservation equations of mass and momentum into the following:
u i ¯ / x i = 0
u i ¯ t + x j u i ¯ u j ¯ = 1 ρ p ¯ x i + x j ϑ 2 S ¯ ij τ ij + S M , i
where the overbar indicates resolved quantities; i and j = 1, 2, 3 correspond to x, y, and z directions, respectively; ui (m/s) is the velocity component in the i direction; ρ (kg/m3) is the fluid density; p (N/m2) is the dynamic pressure; ϑ (m2/s) is the kinematic viscosity; S ij = 0.5 ( u i / x j + u j / x i ) (1/s) is the strain-rate tensor; τ i j = u ¯ i u ¯ j u i u j ¯ (m2/s2) is the subgrid-scale stress; and SM,i (m/s2) is the sink term related to vegetation drag (Equation (3)). τij represents the effect of unresolved small-scale motion on the resolved flow and is based on the Eddy-viscosity assumption τ ij 1 3 τ kk δ ij = ϑ t ( 2 S ¯ ij ) , where ϑt (m2/s) is the eddy viscosity. The wall-adapting local Eddy-viscosity (WALE) model, proposed by [21], was chosen as the subgrid-scale model to calculate ϑt.
The vegetation was modelled as a porous medium following [22], in which the flow resistance induced by vegetation generates a momentum loss that is added as a sink term in Equation (2). In our study, momentum loss was computed with the Darcy–Forchheimer (DF) model:
S M , i = - ( ϑ d + 0.5 ρ | u jj | f ) u i
in which d (1/m2) is the viscosity drag coefficient and f (1/m) is the inertial coefficient. The coefficients d and f were calculated using the Ergun equation:
d = 150 D p 2 ( 1     ϵ ) 2 ϵ 3
f = 3.5 D p ( 1     ϵ ) ϵ 3  
in which Dp (cm) is the mean particle diameter, ϵ (= 1 − a) is the void fraction, a = nSv/Scav is the vegetation density in the cavity, n is the number of vegetation cylinders, SV (m2) is the horizontal cross-section area of the vegetation cylinders, and Scav (m2) is the cavity area. In order to account the anisotropic resistance of vegetation, the coefficients were calculated differently in the horizontal (XY plane) and the vertical direction (z-axis) [22,23]. In the horizontal direction, Dp assumed the value of the vegetation diameter extracted from [14]. In the vertical direction, the coefficients were calculated with the equivalent hydraulic diameter (dh), where Dp = dh. The value of a = 100% corresponds to a wall with a no-slip condition.

2.2. Numerical Model and Boundary Conditions

The 3D geometry consisted of a lateral cavity adjacent to a rectangular open channel (Figure 1). The geometry and flow conditions were extracted from [14], in order to validate this model. The main channel was Lc = 1.25 m long, B = 0.30 m wide, and had a depth H = 0.10 m that was held constant throughout all the geometry. The lateral cavity was W = 0.15 m wide and L = 0.25 m long, resulting in the aspect ratio W/L = 0.6. In all cases, the flow in the main channel was turbulent (Re = 9000) and subcritical (Fr = 0.102), with an averaged velocity U = 0.101 m/s.
The rigid-lid approximation was applied at the free surface of the domain (z = 0.10 m), which is valid for subcritical flows within Fr < 0.36 [24]. The free-slip wall condition was used at y = 0.30 m. The width of the main channel covered by the numerical model was only 0.30 m (the full width of the experimental main channel was 0.85 m), because, at this location, the effect caused by the cavity in the main channel is negligible [25]. The inlet was calculated in two phases: (a) precalculated velocity fields that were fully developed in a periodic channel, under the same flow conditions and the same main channel geometry; and (b) the average incoming flow was used to generate turbulent fluctuations using the turbulence divergence-free synthetic Eddy method [26]. A convective outflow boundary condition was adopted at the outlet, in which the zero-gradient condition allows the flow to exit the domain without having any backflow. The bottom of the domain, the walls of the main channel, and the cavity were considered no-slip walls. The turbulent viscosity was modelled in all of the no-slip walls of the domain with the Spalding wall function.
The vegetation density varied between a = 0 (no vegetation) and a = 10.65% and was distributed in four scenarios (Table 1). The scenarios were chosen based on typical values of vegetation density found in the literature [27]. It was assumed that vegetation was uniformly distributed in the cavity throughout the entire water depth.
The computational points in the entire domain were displaced in a rectangular grid, composed of hexahedral elements. The main channel was divided into a grid of 120 × 120 × 40, for the streamwise (x-axis), spanwise (y-axis), and vertical directions (z-axis), respectively, while the cavity was divided into 80 × 80 × 40. Figure 2 shows the computational grid in the free-surface plane. The total number of hexahedral elements was 1,408,000 elements and a maximum y+ = 6.8 and z+ = 2.2. The discretization of the domain was defined with the grid uncertainty evaluation proposed by [28]. Three grids were employed in which the calculated uncertainty was 1.74% in the medium grid, which was chosen for the next simulations. The model was decomposed and solved on 48 cores each (Intel Xeon E5-2670v3 (Haswell) with clock frequencies of 2.3 GHz) and took an average of ≈18 h to simulate 100 s of flow.
The simulations were calculated with the open-source package OpenFOAM (version 1912). To discretize the governing equations and numerical schemes, the module pimpleFoam, which employs the finite volume method (FVM) in a transient formulation, was used. To solve the convection-diffusion equations, the implicit second-order backward time-stepping scheme and additional second-order schemes were used. The residual tolerance was set to 1 × 10⁻⁴ for all variables. The timestep size was set as adaptative with a maximum Courant number of 0.9, a maximum time step of 0.05 s, and an averaged timestep size of 0.001 s. The simulation ran for nearly 150 H/U to stabilize the solution and develop the flow; after this period, the time-averaging procedure started and lasted for another 3600 H/U.

3. Results and Discussion

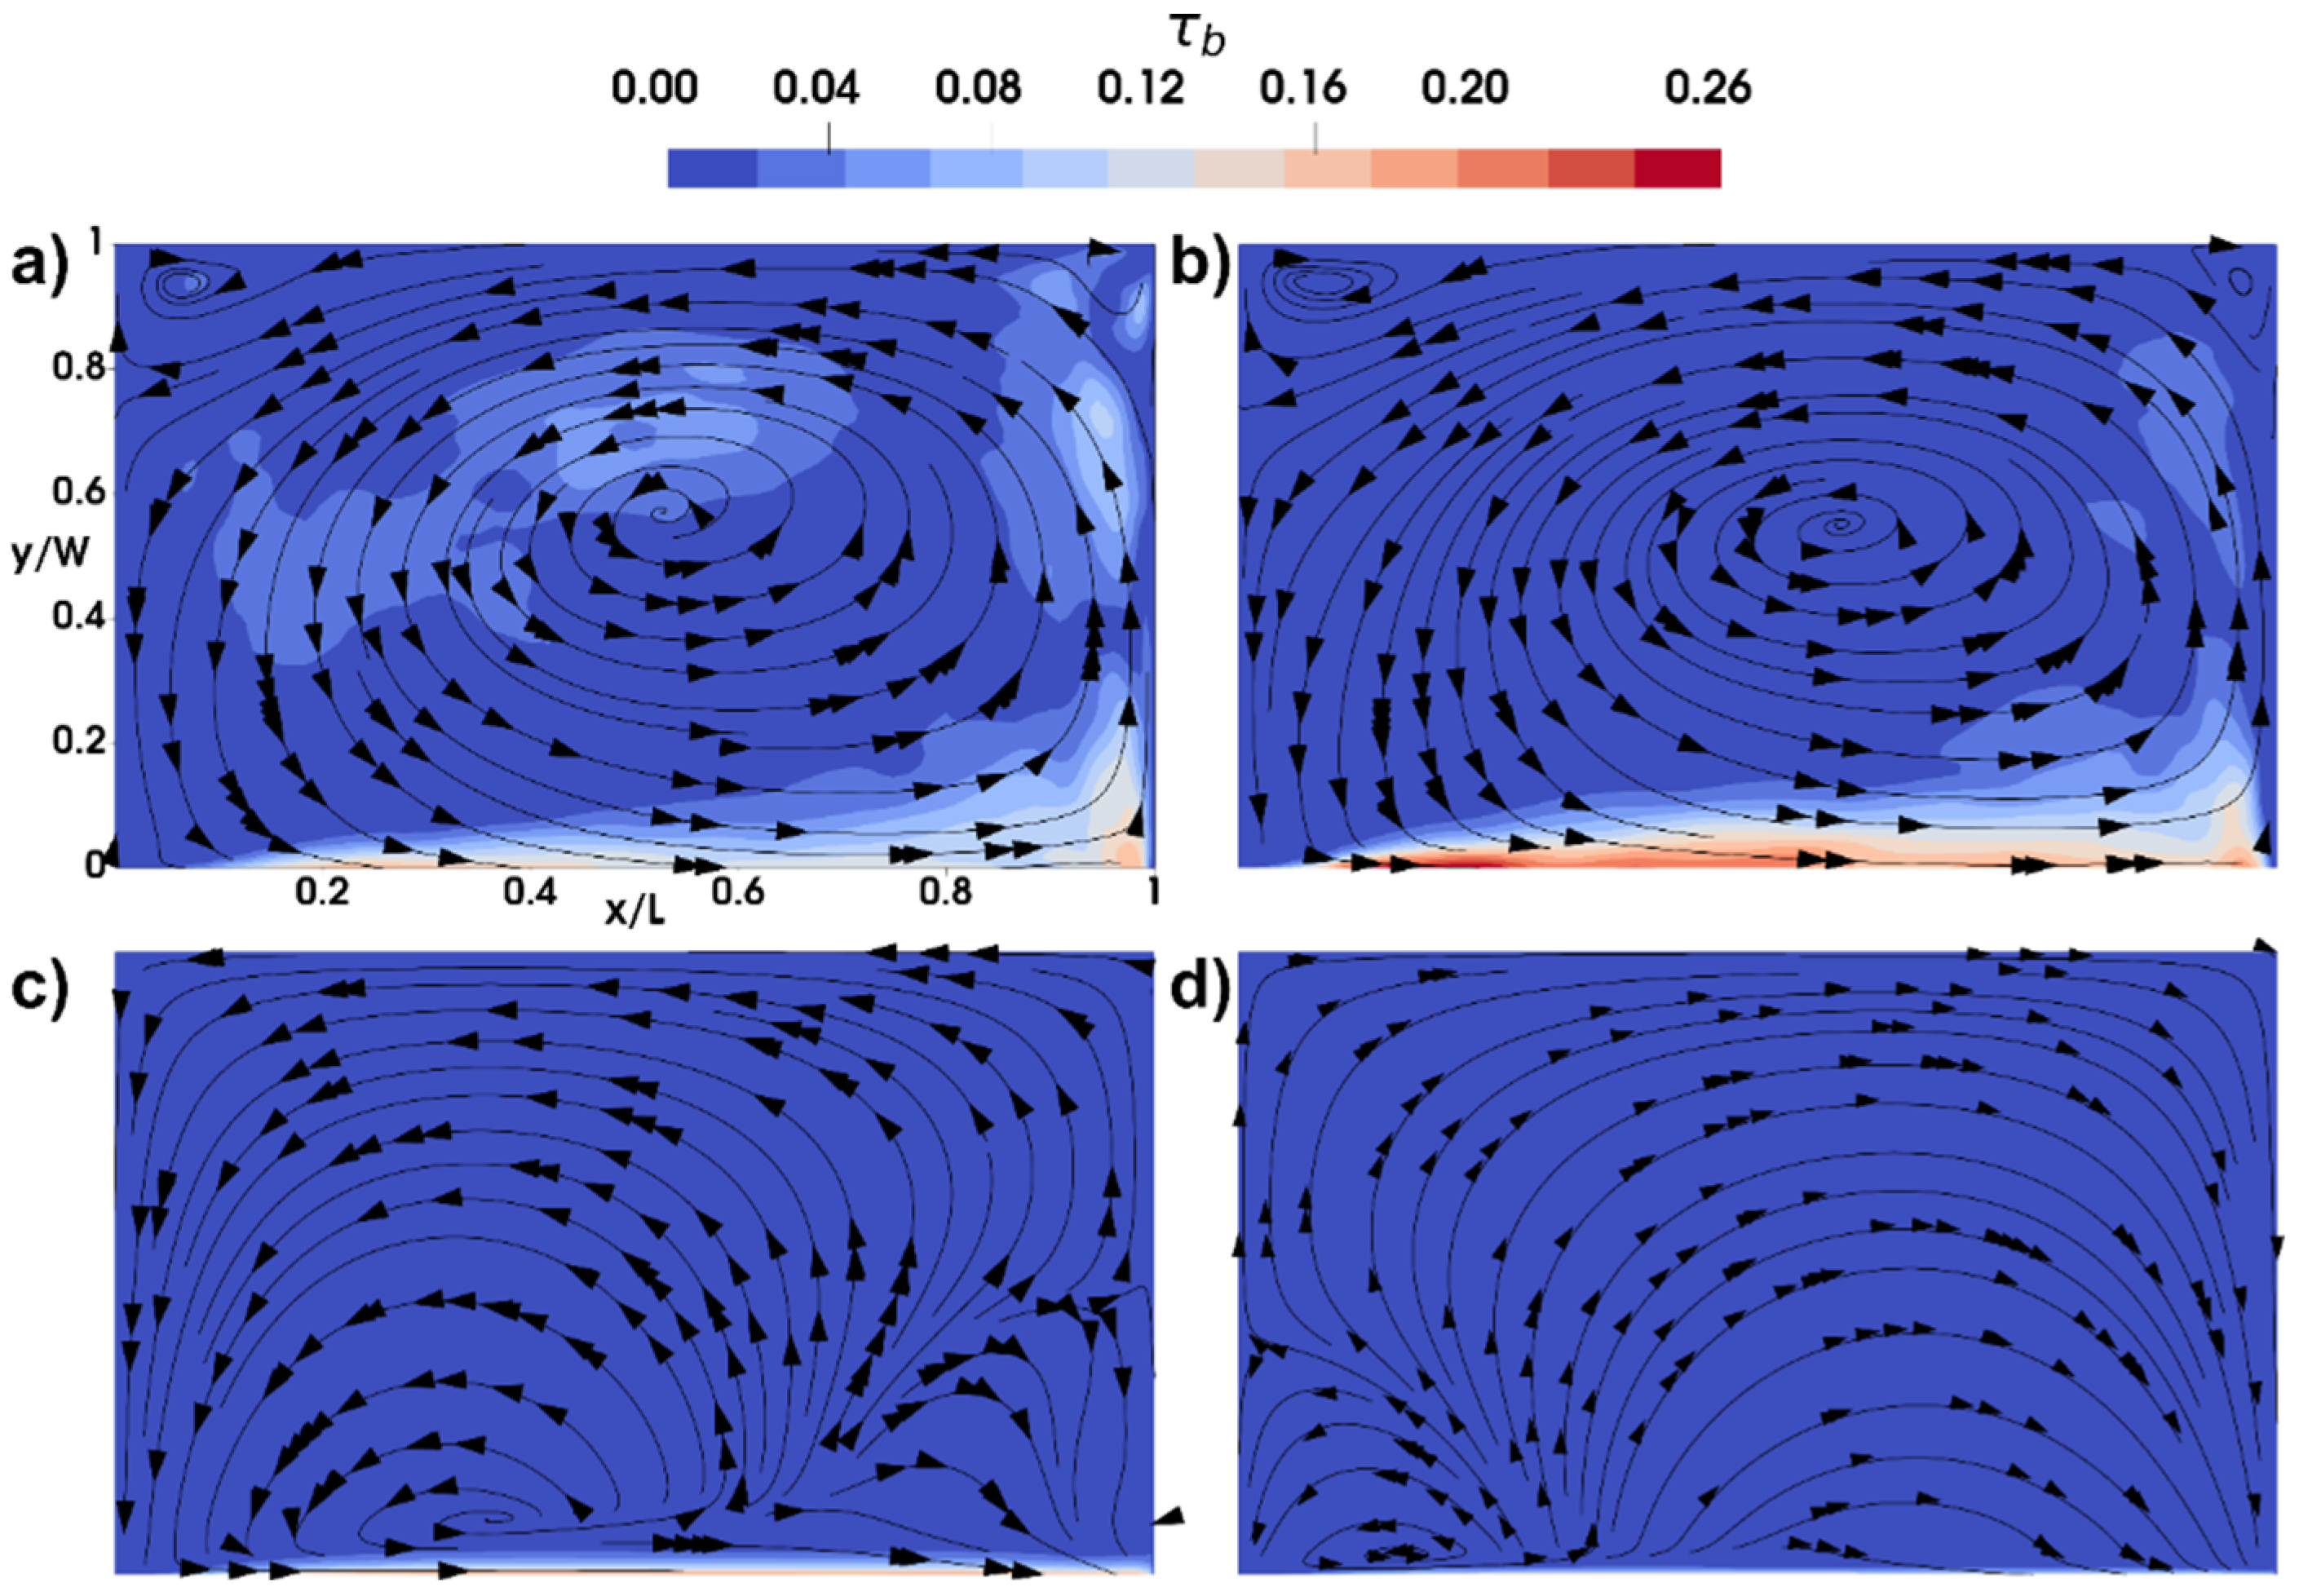
Figure 3 shows the contours of bed shear stress and the flow streamlines at z/H = 0.2 (z = 20Φ for very coarse sand, see Table 2). For a < 0.13%, a main anti-clockwise motion was formed (Figure 3a,b). For a > 3.99%, the main circulation started to develop a secondary circulation at x/L ≈ 0.8 and y/W ≈ 0.2 and the main circulation’s centre was translated to x/L ≈ 0.2 (Figure 3c). The further increase in density increased the size of the right circulation and started to suppress the left one (Figure 3d). Both circulations had contact with the main channel. Unlike the pattern for non-vegetated lateral cavities [29], the flow entered from the most upstream (x/L ≈ 0.3) part of the cavity and exited through the downstream (right portion) for a ≥ 3.99% (Figure 3c,d).
The maximum bed shear stress was located at the downstream wall of the cavity and at the interfacial region between the main channel and the cavity (Figure 3). Higher bed shear stresses were observed in the outer parts of the recirculation regions. Very low shear stresses were found in the central areas of the recirculation regions. As the vegetation density increased, in general, the bed shear stresses’ intensity diminished. The shear stress field at the cavity bed was used to estimate the sediment transport mode and the sediment motion by employing well-known criteria from the literature.
The cavity’s downstream wall and the interfacial region between the main channel and the cavity had the highest bed shear stress (Figure 3). The outlying parts of the recirculation regions have higher bed shear stresses, while the core parts of the recirculation regions have very low shear stresses. The intensity of bed shear stresses decreased as vegetation density increased. Using well-known criteria from the literature, the shear stress field at the cavity bed was used to estimate the sediment transport mode and sediment motion. For this analysis, the Shields number, S h = ρ u *   / ( ρ s ρ ) g ϕ , and the Rouse number, R o = w s / k u * , were calculated. In those numbers, ρ (kg/m3) is the density of water, u * = τ b / ρ (m/s) is the shear velocity, τ b (kg/ms2) is the bed shear stress, ρ s = 2650 (kg/m3) is the density of sediment (typical value for quartz and clay minerals), g = 9.802 (m/s2), Φ (m) is the particle diameter, ws (m/s) is the particle settling velocity, and k = 0.41 is the von Karmán constant. The tests were conducted for all ranges of sands. Typical values of particle diameter and settling velocity (Table 2) were extracted from [30].
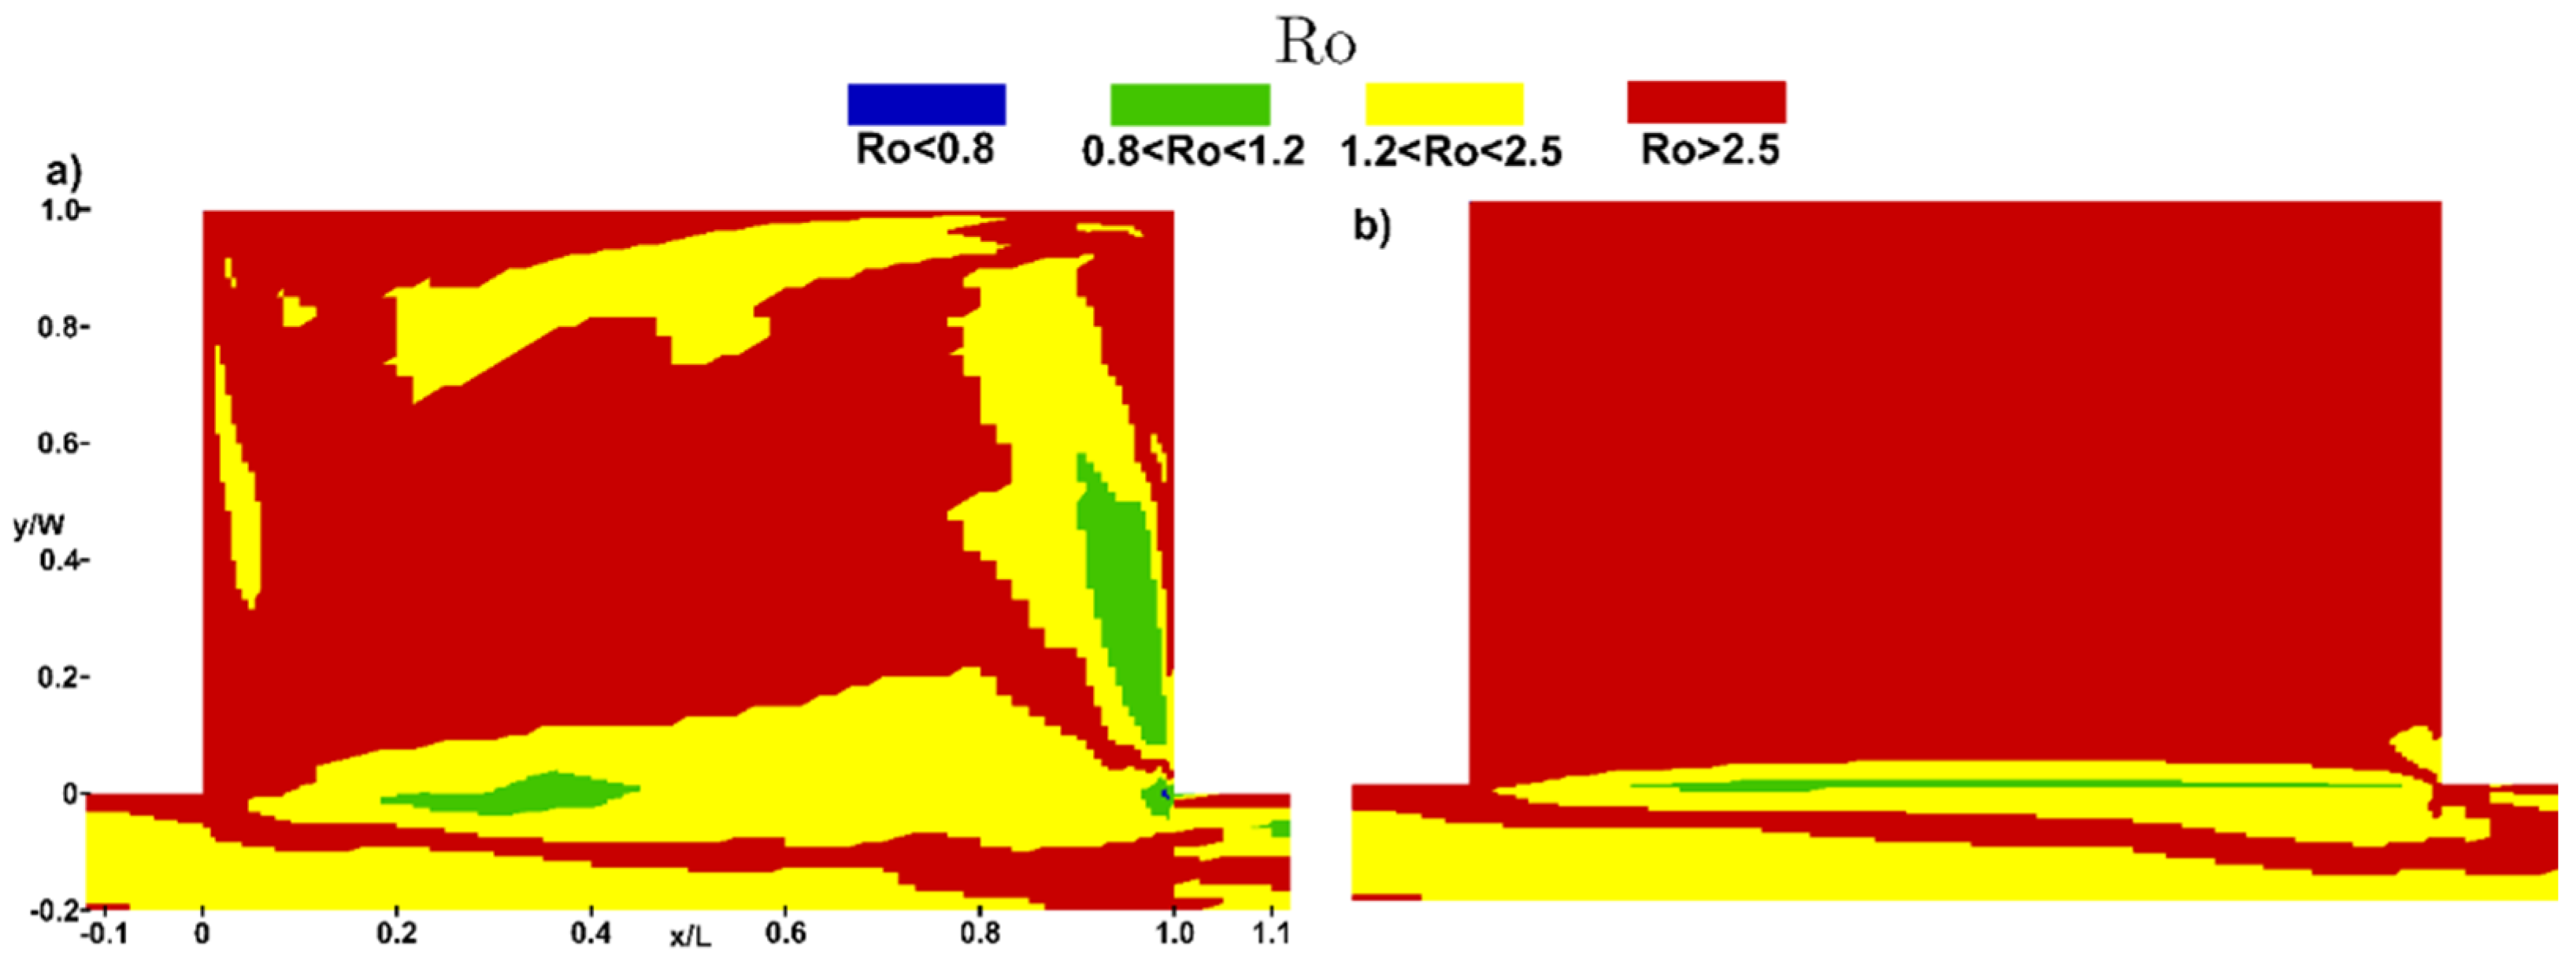
Concerning the sediment transport mode, Table 3 summarizes the statistical values of the Rouse number Ro. The minimum values were omitted from Table 3 because they represent the null value at the wall. Figure 4 presents the contours of the Rouse number in the cavity at the depth z = 20Φ for a = 0 and 3.99%. When Ro < 0.8, the transport is wash-load; when 0.8 < Ro < 1.2, 100% of the transport is suspended; when 1.2 < Ro < 2.5, 50% of the transport is suspended; and when Ro > 2.5, the transport is bedload [31]. For the non-vegetated case, a = 0%, with very fine sand, the main mode of movement was bedload transport. Further, in the non-vegetated cavity with very fine sand, there was a spatial variation in the values of Ro in the mixing layer region (−0.1 < y/W < 0.2) and outer part of the recirculation (Figure 4a), in which the predominant expected behaviour was 50% and 100% suspended transport. With the increase in vegetation density, the shear velocity reduced, which gradually increased the values of Ro (Figure 4b). In all vegetated cases, the main class of movement was bedload transport, as Ro > 2.5. As the velocity became more homogenous inside the cavity, with the increase in a (Figure 3), so did the distributions of Ro (Figure 4b) and Sh (not included in this paper).
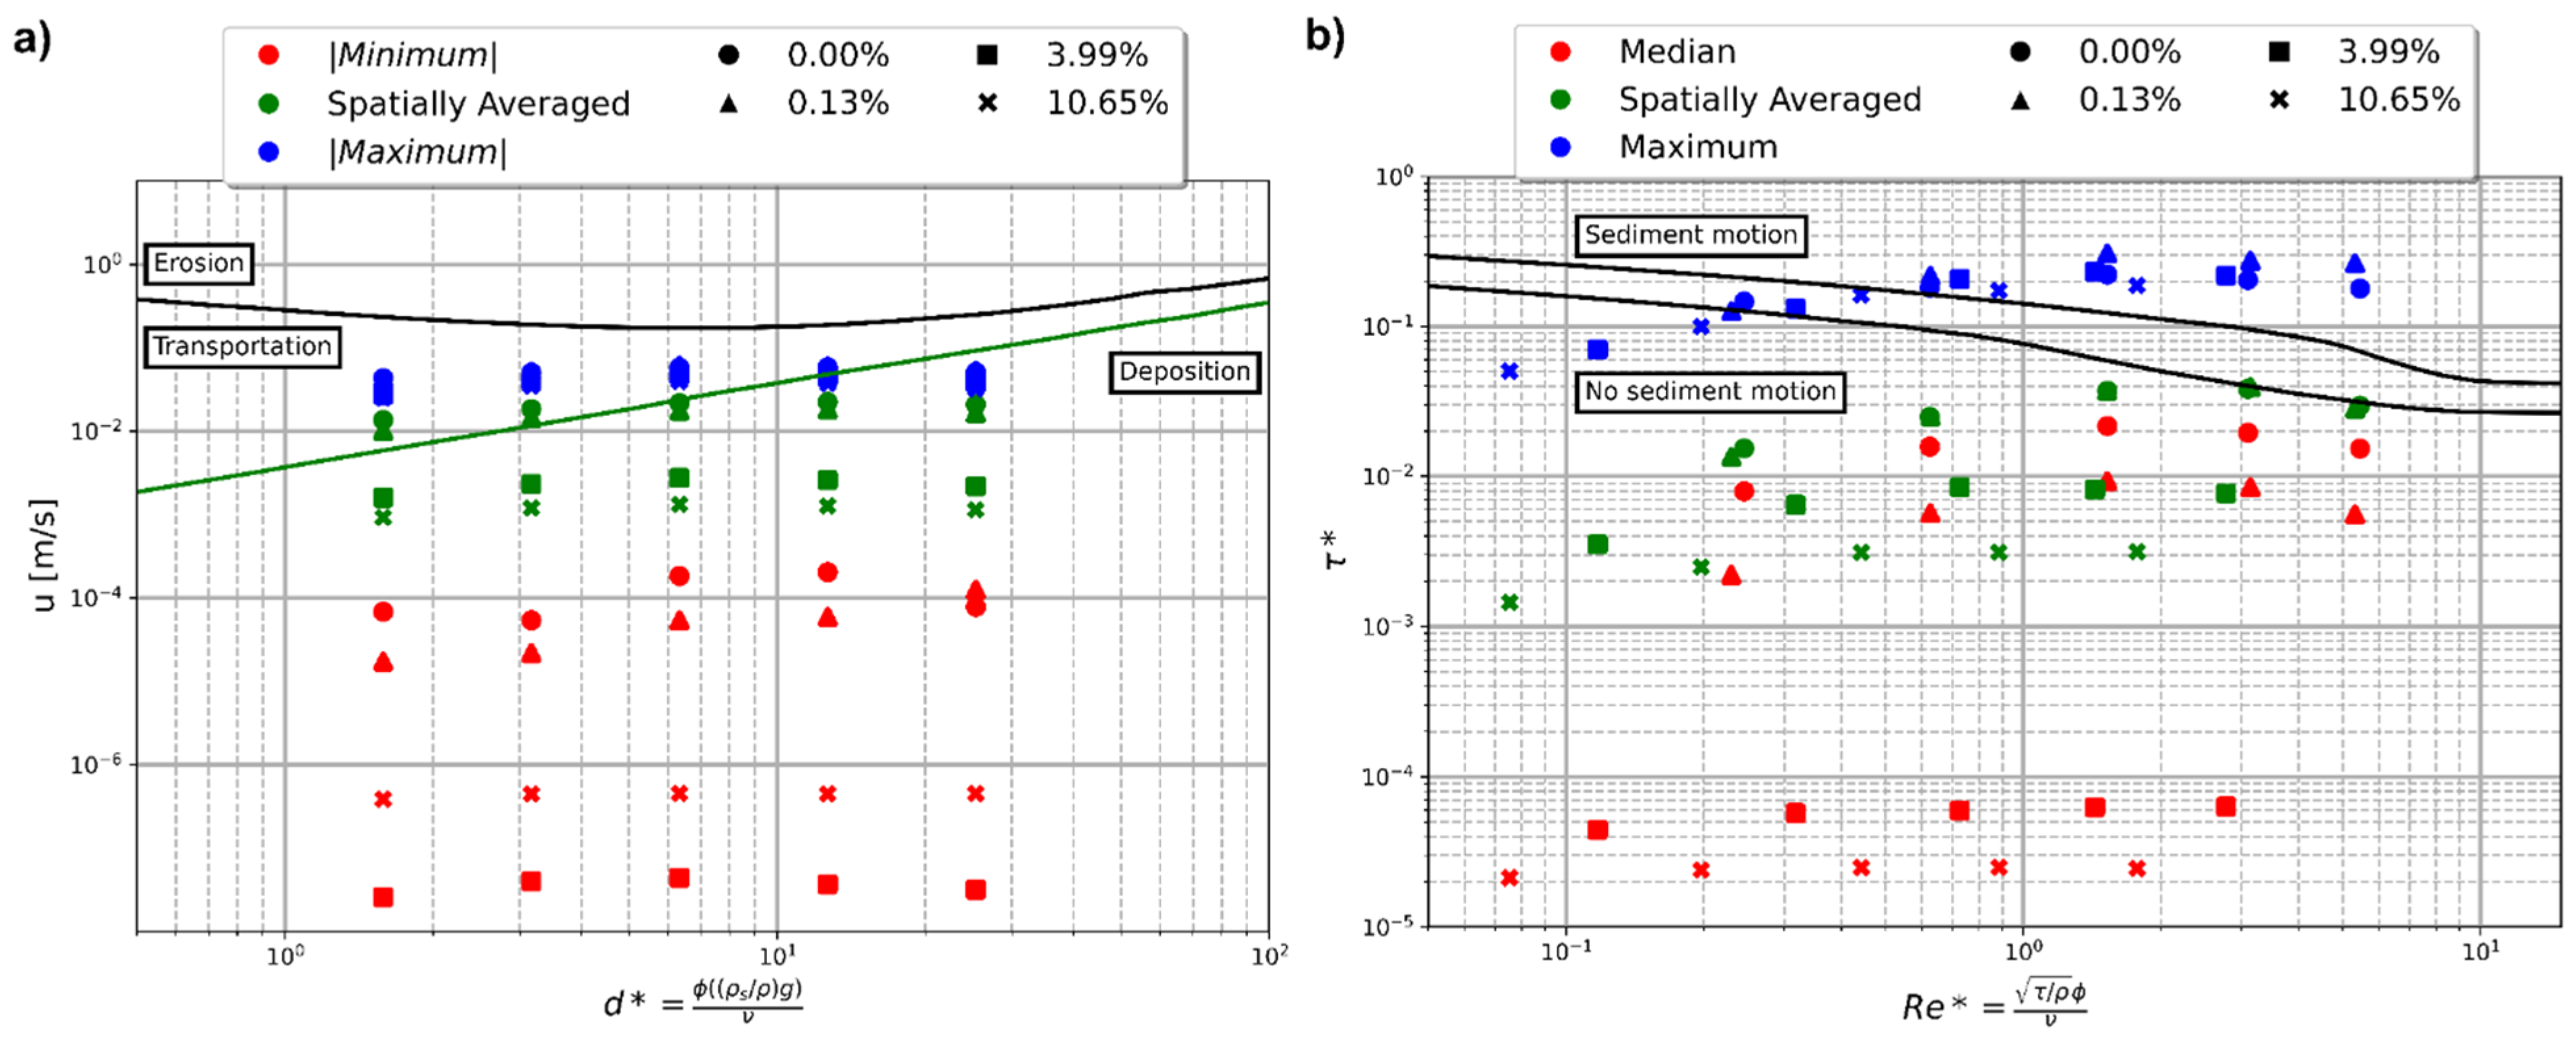
Sediment motion was analysed with Hjulström and Shields curves. Concerning the Hjulström curve, Figure 5a shows that, in the zones with high velocity (e.g., downstream wall of the cavity), and for sediments with Φ < 0.00025 m, transport can occur. For low and average velocities, sediment was deposited. In relation to the Shields curve in Figure 5b, sediment movement also only occurred in regions with high velocity and when the granulometry was larger than very fine. The increase in vegetation density reduced the bed shear stress, which secures that the “no sediment motion” status continued for denser vegetations. Thus, the increase in vegetation density tends to preserve trapped sediments inside the region. Furthermore, vegetation impacted sediment transport at different rates. In both diagrams in Figure 5, the maximum values of u and τ * were not largely influenced by the increase in vegetation density. Nevertheless, the enhancement in vegetation density impacted the spatial average and minimum values of u and τ * . Moreover, at the minimum series of the Hjulström diagram (Figure 5a), the velocity, for a = 3.99%, was higher than the higher densities (a = 10.65%), which did not occur for the shear stresses in the Shields diagram (Figure 5b). This behaviour indicates that a threshold not only occurs for the velocity, but also for sediment transport.

4. Conclusions

This study investigated the influence of vegetation density on sediment transport and velocity in lateral cavities. The increase in vegetation density reduced flow velocity inside the lateral cavity. For the vegetation density a > 3.99%, a secondary circulation appeared that was not expected with the chosen aspect ratio (width/length = 0.6). The presence of vegetation uniformised the sediment transport type and motion status along the entire cavity. The increase in vegetation density overall promoted the deposition/no sediment motion inside the cavity (Figure 5), which was not observed for all the sediment granulometries in a non-vegetated cavity. Thus, the vegetation enhances the protection mechanism to sediment movement, which might be beneficial for conserving the main channel depth and trapping contaminants attached to sediment particles.

Author Contributions

Conceptualization, L.E.D.d.O. and C.G.; methodology, L.E.D.d.O.; validation, L.E.D.d.O. and J.G.J.; formal analysis, L.E.D.d.O. and F.R.d.C.; writing—original draft preparation, L.E.D.d.O. and F.R.d.C.; writing—review and editing, L.E.D.d.O., C.G., and J.G.J.; visualization, L.E.D.d.O. and F.R.d.C.; supervision, C.G. and J.G.J.; funding acquisition, L.E.D.d.O. and J.G.J. All authors have read and agreed to the published version of the manuscript.

Funding

This study was financed in part by the Coordenação de Aperfeiçoamento de Pessoal de Nível Superior-Brazil (CAPES)—Finance Code 001 (88882.458262/2019-01). This study was funded by CAPES-Institutional Internationalisation Programme (Print) (88881.311850/2018-01)). This study was conducted in Lobo Carneiro cluster located in NACAD/Coppe-Rio de Janeiro, Brazil.

Data Availability Statement

The data that support the findings of this study are available from the corresponding author upon reasonable request.

Conflicts of Interest

The authors declare no conflict of interest. The funders had no role in the design of the study; in the collection, analyses, or interpretation of data; in the writing of the manuscript; or in the decision to publish the results.

References

  1. Juez, C.; Bühlmann, I.; Maechler, G.; Schleiss, A.J.; Franca, M.J. Transport of suspended sediments under the influence of bank macro-roughness. Earth Surf. Process. Landforms 2018, 43, 271–284. [Google Scholar] [CrossRef]
  2. Mignot, E.; Cai, W.; Launay, G.; Riviere, N.; Escauriaza, C. Coherent turbulent structures at the mixing-interface of a square open-channel lateral cavity. Phys. Fluids 2016, 28, 045104. [Google Scholar] [CrossRef] [Green Version]
  3. Ouro, P.; Juez, C.; Franca, M. Drivers for mass and momentum exchange between the main channel and river bank lateral cavities. Adv. Water Resour. 2020, 137, 103511. [Google Scholar] [CrossRef]
  4. Engelen, L.; Perrot-Minot, C.; Mignot, E.; Rivière, N.; De Mulder, T. Lagrangian study of the particle transport past a lateral, open-channel cavity. Phys. Fluids 2021, 33, 013303. [Google Scholar] [CrossRef]
  5. Gualtieri, C. Numerical simulation of flow patterns and mass exchange processes in dead zones. In Proceedings of the 4th International Congress on Environmental Modelling and Software (iEMSs 2008), Barcelona, Spain, 6–10 July 2008; Volume 1, pp. 150–161. [Google Scholar]
  6. Jackson, T.R.; Haggerty, R.; Apte, S.V. A fluid-mechanics based classification scheme for surface transient storage in riverine environments: Quantitatively separating surface from hyporheic transient storage. Hydrol. Earth Syst. Sci. 2013, 17, 2747–2779. [Google Scholar] [CrossRef] [Green Version]
  7. Jackson, T.R.; Apte, S.V.; Haggerty, R.; Budwig, R. Flow structure and mean residence times of lateral cavities in open channel flows: Influence of bed roughness and shape. Environ. Fluid Mech. 2015, 15, 1069–1100. [Google Scholar] [CrossRef]
  8. Harvey, J.W. Hydrologic Exchange Flows and Their Ecological Consequences in River Corridors. In Stream Ecosystems in a Changing Environment; Jones, J.B., Stanley, E.H., Eds.; Academic Press: Boston, MA, USA, 2016; pp. 1–83. Available online: http://www.sciencedirect.com/science/article/pii/B9780124058903000014 (accessed on 18 March 2022)ISBN 9780124058903.
  9. Ribi, J.-M.; Boillat, J.-L.; Peter, A.; Schleiss, A.J. Attractiveness of a lateral shelter in a channel as a refuge for juvenile brown trout during hydropeaking. Aquat. Sci. 2014, 76, 527–541. [Google Scholar] [CrossRef]
  10. Watts, R.J.; Johnson, M.S. Estuaries, lagoons and enclosed embayments: Habitats that enhance population subdivision of inshore fishes. Mar. Freshw. Res. 2004, 55, 641–651. [Google Scholar] [CrossRef]
  11. Oliveira, L.E.D. Mass Exchange in Dead Zones: A Numerical Approach. Fundação Universidade Federal de Mato Grosso do Sul, Campo Grande, Brazil, 2021. Master’s Thesis. Available online: https://repositorio.ufms.br/handle/123456789/3633 (accessed on 18 March 2022).
  12. Nepf, H.M. Flow and Transport in Regions with Aquatic Vegetation. Annu. Rev. Fluid Mech. 2012, 44, 123–142. [Google Scholar] [CrossRef] [Green Version]
  13. Jones, R.C. Recovery of a Tidal Freshwater Embayment from Eutrophication: A Multidecadal Study. Estuaries Coasts 2020, 43, 1318–1334. [Google Scholar] [CrossRef]
  14. Xiang, K.; Yang, Z.; Huai, W.; Ding, R. Large eddy simulation of turbulent flow structure in a rectangular embayment zone with different population densities of vegetation. Environ. Sci. Pollut. Res. 2019, 26, 14583–14597. [Google Scholar] [CrossRef] [PubMed]
  15. Kraus, R.T.; Jones, R.C. Fish abundances in shoreline habitats and submerged aquatic vegetation in a tidal freshwater embayment of the Potomac River. Environ. Monit. Assess. 2012, 184, 3341–3357. [Google Scholar] [CrossRef] [PubMed]
  16. Arend, K.K.; Bain, M.B. Fish communities in coastal freshwater ecosystems: The role of the physical and chemical setting. BMC Ecol. 2008, 8, 23. [Google Scholar] [CrossRef] [PubMed] [Green Version]
  17. Maceina, M.J.; Slipke, J.W.; Grizzle, J.M. Effectiveness of Three Barrier Types for Confining Grass Carp in Embayments of Lake Seminole, Georgia. N. Am. J. Fish. Manag. 1999, 19, 968–976. [Google Scholar] [CrossRef]
  18. Ward, L.G.; Michael Kemp, W.; Boynton, W.R. The influence of waves and seagrass communities on suspended particulates in an estuarine embayment. Mar. Geol. 1984, 59, 85–103. [Google Scholar] [CrossRef]
  19. Duró, G.; Crosato, A.; Kleinhans, M.G.; Roelvink, D.; Uijttewaal, W.S.J. Bank Erosion Processes in Regulated Navigable Rivers. J. Geophys. Res. Earth Surf. 2020, 125, e2019JF005441. [Google Scholar] [CrossRef]
  20. Rodi, W.; Constantinescu, G.; Stoesser, T. Large-Eddy Simulation in Hydraulics, 1st ed.; Davies, P.A., Ed.; CRC Press/Balkema: Leiden, The Netherlands, 2013; Volume 1, ISBN 9781138000247. [Google Scholar]
  21. Nicoud, F.; Ducros, F. Subgrid-scale stress modelling based on the square of the velocity gradient tensor. Flow Turbul. Combust. 1999, 62, 183–200. [Google Scholar] [CrossRef]
  22. Yamasaki, T.N.; de Lima, P.H.S.; Silva, D.F.; Preza, C.G.d.A.; Janzen, J.G.; Nepf, H.M. From patch to channel scale: The evolution of emergent vegetation in a channel. Adv. Water Resour. 2019, 129, 131–145. [Google Scholar] [CrossRef]
  23. Yamasaki, T.N.; Janzen, J.G. Estimating the resistance of a porous media that numerically represents a floating treatment wetland. In Proceedings of the 1st IAHR Young Professionals Congress; Carrillo, J.M., Fenrich, E., Ferràs, D., Wieprecht, S., Eds.; International Association for Hydro-Environment Engineering and Research-IAHR: Madrid, Spain, 2020; pp. 199–200. [Google Scholar]
  24. Khosronejad, A.; Arabi, M.G.; Angelidis, D.; Bagherizadeh, E.; Flora, K.; Farhadzadeh, A. A comparative study of rigid-lid and level-set methods for LES of open-channel flows: Morphodynamics. Environ. Fluid Mech. 2020, 20, 145–164. [Google Scholar] [CrossRef]
  25. Brevis, W.; García-Villalba, M.; Niño, Y. Experimental and large eddy simulation study of the flow developed by a sequence of lateral obstacles. Environ. Fluid Mech. 2014, 14, 873–893. [Google Scholar] [CrossRef]
  26. Poletto, R.; Craft, T.; Revell, A. A new divergence free synthetic eddy method for the reproduction of inlet flow conditions for les. Flow Turbul. Combust. 2013, 91, 519–539. [Google Scholar] [CrossRef]
  27. Chen, Z.; Ortiz, A.; Zong, L.; Nepf, H. The wake structure behind a porous obstruction and its implications for deposition near a finite patch of emergent vegetation. Water Resour. Res. 2012, 48. [Google Scholar] [CrossRef]
  28. Dutta, R.; Xing, T. Five-equation and robust three-equation methods for solution verification of large eddy simulation. J. Hydrodyn. 2018, 30, 23–33. [Google Scholar] [CrossRef]
  29. Mignot, E.; Cai, W.; Riviere, N. Analysis of the transitions between flow patterns in open-channel lateral cavities with increasing aspect ratio. Environ. Fluid Mech. 2019, 19, 231–253. [Google Scholar] [CrossRef]
  30. Julien, P.Y. Erosion and Sedimentation, 2nd ed.; Cambridge University Press: Cambridge, UK, 2010; Volume 52, ISBN 9780511806049. Available online: http://ebooks.cambridge.org/ref/id/CBO9780511806049 (accessed on 18 March 2022).
  31. Whipple, K. 12.163 Surface Processes and Landscape Evolution. 2004. Available online: https://ocw.mit.edu/courses/earth-atmospheric-and-planetary-sciences/12-163-surface-processes-and-landscape-evolution-fall-2004/lecture-notes/4_sediment_transport_edited.pdf (accessed on 18 March 2022).
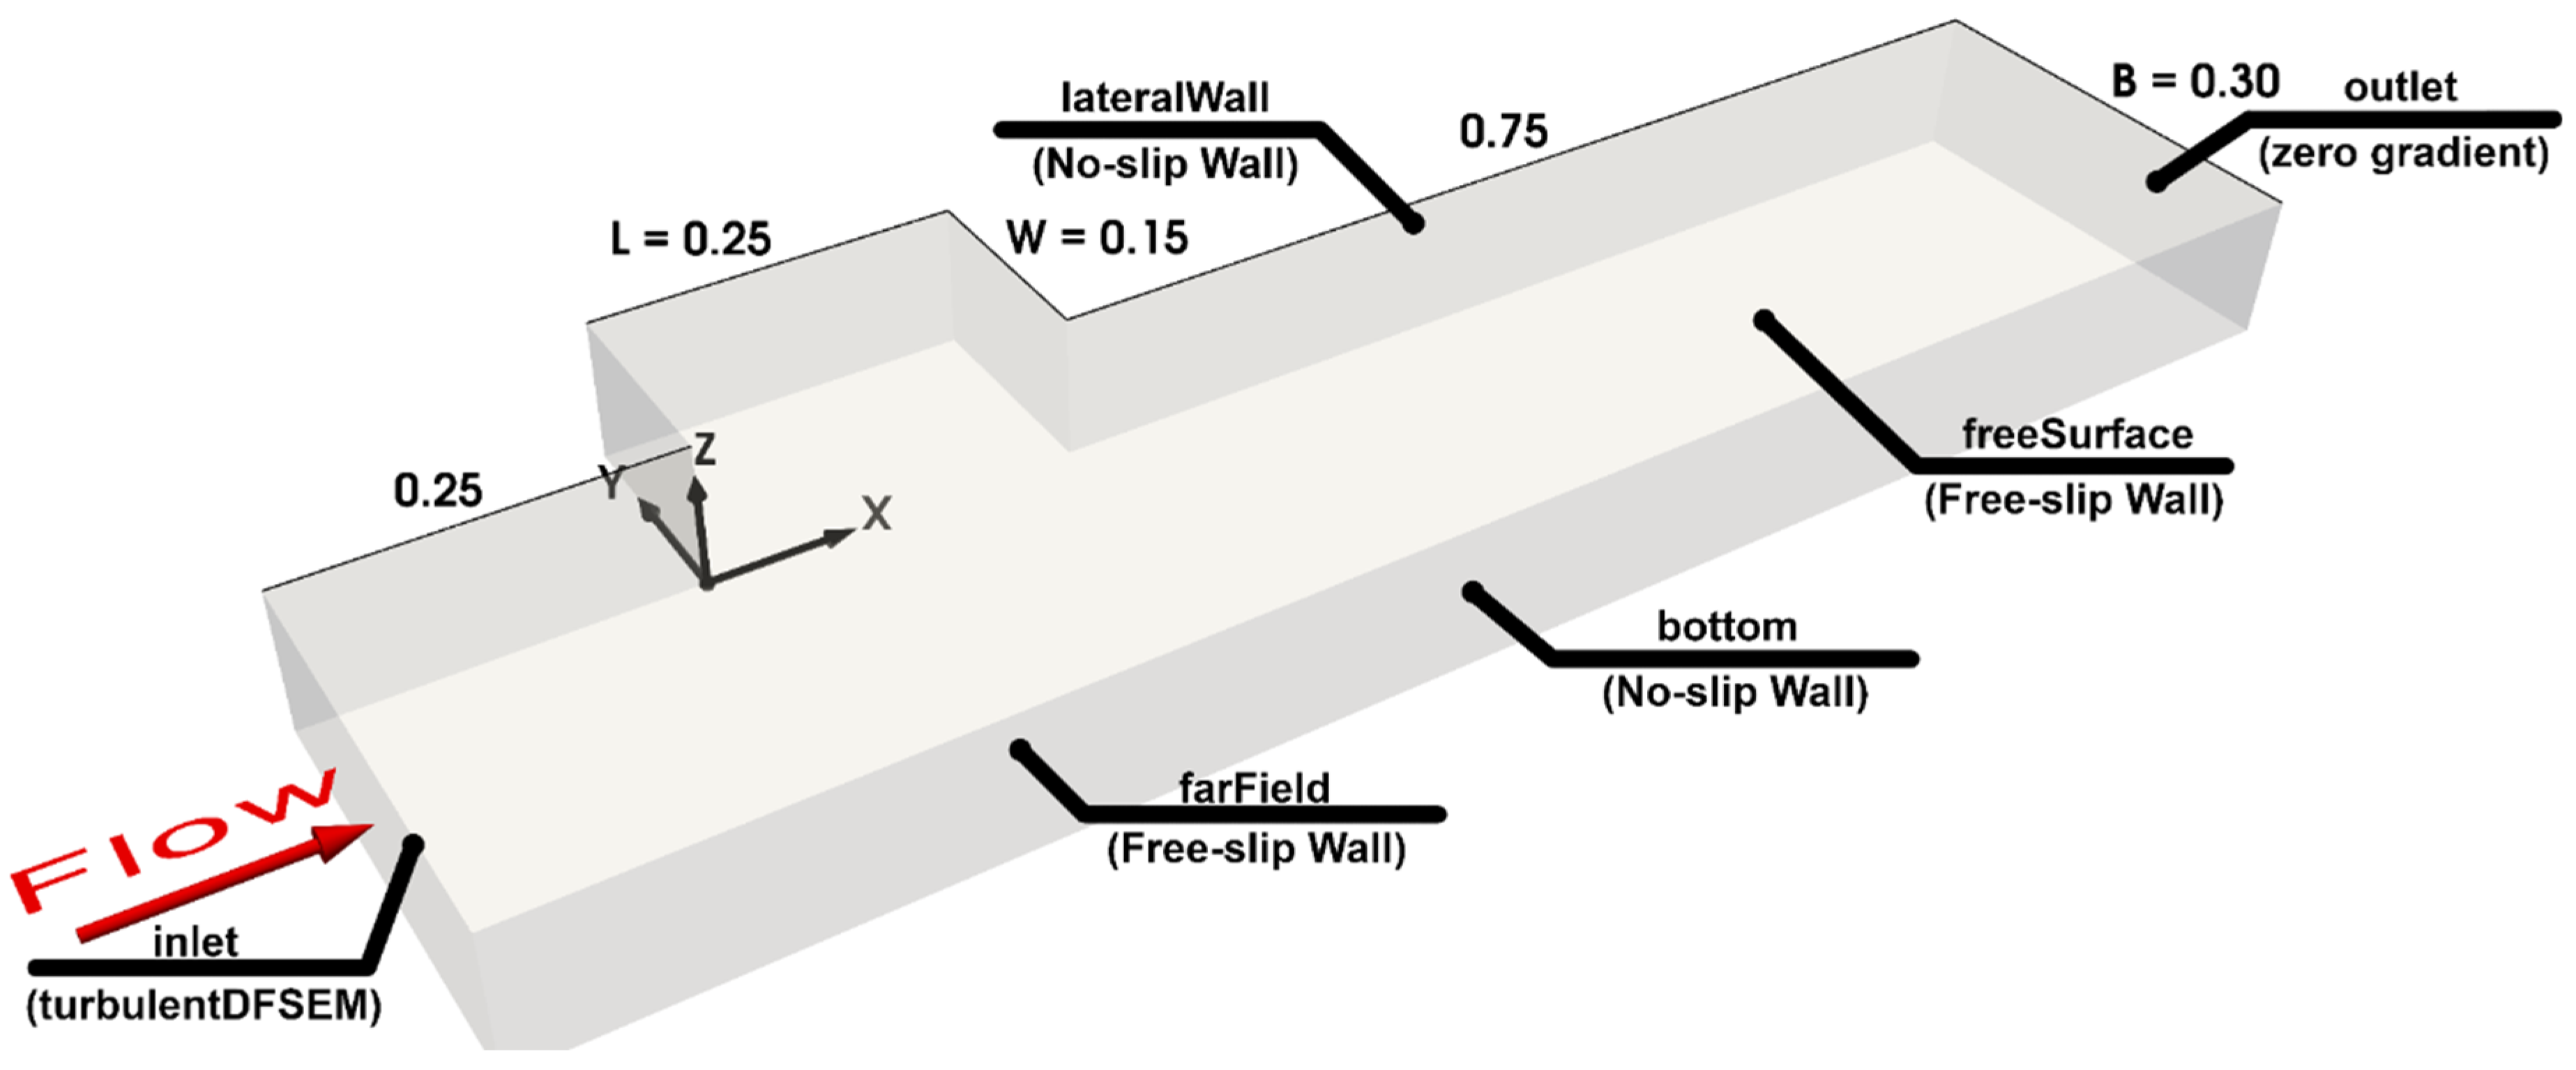
Figure 1. Computational domain with coordinates, dimensions, and main boundary conditions.
Environsciproc 21 00016 g001
Figure 2. Computational grid.
Environsciproc 21 00016 g002
Figure 3. Contours of bed shear stress and flow streamlines: (a) a = 0, (b) a = 0.13%, (c) a = 3.99%, and (d) a = 10.65%.
Environsciproc 21 00016 g003
Figure 4. Contours of the Rouse number in the cavity at the depth z = 20Φ for the values for very fine sand: (a) a = 0 and (b) a = 3.99%.
Environsciproc 21 00016 g004
Figure 5. (a) Hjulström diagram and (b) Shields diagram.
Environsciproc 21 00016 g005
Table 1. Vegetation densities and the calculated Darcy–Forchheimer coefficients.
Casea (%)Horizontal Direction (x- and y-axis)Vertical Direction (z-axis)
d (1/m2)f (1/m)dh (m)d (1/m2)f (1/m)
000.000.000.000.000.00
10.13116.533.090.76240.00040.006
23.99120,314.00105.380.0210613.127.52
310.651,061,150.94348.580.0041140,829.09126.99
where a (%) is the vegetation density, d (1/m2) is the viscosity drag coefficient, f (1/m) is the inertial coefficient, and dh (m) is the hydraulic diameter.
Table 2. Typical values of particle diameter (Φ) and settling velocity (ws) extracted from [30].
Sand GranulometryΦ [m]ws [m/s]
Very Fine0.00006250.112
Fine0.0001250.0703
Medium0.000250.036
Coarse0.00050.0128
Very Coarse0.0010.00347
Table 3. Estimated results of Rouse number (Ro) inside the lateral cavity at z = 20Φ. Values from left to right represent cases 0, 1, 2, and 3, respectively. The mean values represent a spatial averaging of the Rouse values in the XY plane.
SedimentMax (102)MeanMedian
Very Fine2.00/10.31/38.45/55.204.26/8.02/63.04/84.822.45/3.10/20.08/31.17
Fine7.63/63.03/134.87/255.4210.91/20.69/200.28/294.807.02/8.63/68.57/111.48
Medium15.61/46.07/379.28/411.3624.61/39.43/559.63/820.1017.59/21.15/188.95/311.26
Coarse54.77/68.02/814.16/1467.3148.54/78.04/1092.73/1616.8033.09/40.67/373.46/612.30
Very Coarse95.00/129.07/1562.37/1316.9678.11/125.22/1762.61/2570.1552.80/71.68/608.14/954.70
Publisher’s Note: MDPI stays neutral with regard to jurisdictional claims in published maps and institutional affiliations.