1. Introduction
Water distribution network (WDN) is conceived to provide costumers water with adequate quantity and quality. To this end, it is necessary that water networks present a good reliability level. In this context, the smart city paradigm has been increasingly widespread and the application of this concept to the urban water cycle is a recurring theme. Smart cities are urban areas that use different types of electronic sensors to collect data that are used to efficiently manage resources and assets.
Smart metering (SM) systems for urban water management could be considered an important tool for smart city planning and operation. In relation to the water systems, an intelligent meter is an electronic device that records consumption and communicates information to the water utilities for monitoring and billing. Smart meters usually record hourly (or more often) water consumption and report at least on a daily basis. They can provide accurate water use information, enable better management for peak demands, re-engineer the water supply and the design procedure, enhance water service infrastructure planning, and enable a demand-based water pricing, among other uses [
1].
March et al. [
2] concluded that water SM programs could be useful for the following: access to detailed knowledge of water use at a household scale for identifying patterns of consumption according to different variables; reduce water consumption and improve the efficiency of WDN; reduce costs (mainly at manual meter readings); promote the possibility to segment users, enabling the development of new prices policies; generate sustainable water-use thinking and behavior in costumers; and quickly detect anomalous consumption.
When we talk about SM systems and programs, one of the most important things to understand is how to extract value from the collected data [
3,
4]. According to Beal and Flynn [
5], there are a high number of solutions to manage and integrate meters’ data with existing core utility systems. Their findings suggest that it is more possible to justify SM projects according to their economic benefits than to users’ satisfaction levels. Some economic benefits of the SM that they pointed are savings in operating costs, reductions in the water supplied volume, increase in the water distribution infrastructure, increased revenues from measurement that is more accurate, improved relations between utilities and costumers, and reduced non-revenue water losses.
Davies et al. [
6] claim that when consumers have feedbacks about their energy consumption with tools that more effectively provides them knowledge, there are a behavior change. Studies on water consumption and consumer behavior are less common, and this is a new field of study. Additionally, households with an in-home display installed reduced their water consumption by an average of over 6.8% over the 5-year study period when compared to the control group. Giurco et al. [
7] consider the need for studies that relate the potential of SM to promote water conservation among consumers and utilities. However, they consider that such a system could mean an invasion of consumer privacy and therefore further discussion is needed. Black et al. [
8] suggest that behavior change strategies could be effective in reducing household energy consumption. They installed in-home display units to provide feedback on energy consumption together with some strategies that stimulated and repressed behavioral changes. The results, when comparing intervention groups and the control group, showed that the energy consumption of the intervention groups was lower. The study findings were used to adopt an SM program.
In this context, the present paper aims to evaluate the impacts of a smart metering program in the city of Brasília, Brazil, by means of comparisons between costs and benefits obtained by the implementation of the system.
2. Methodology
2.1. Study Area and Smart Metering System
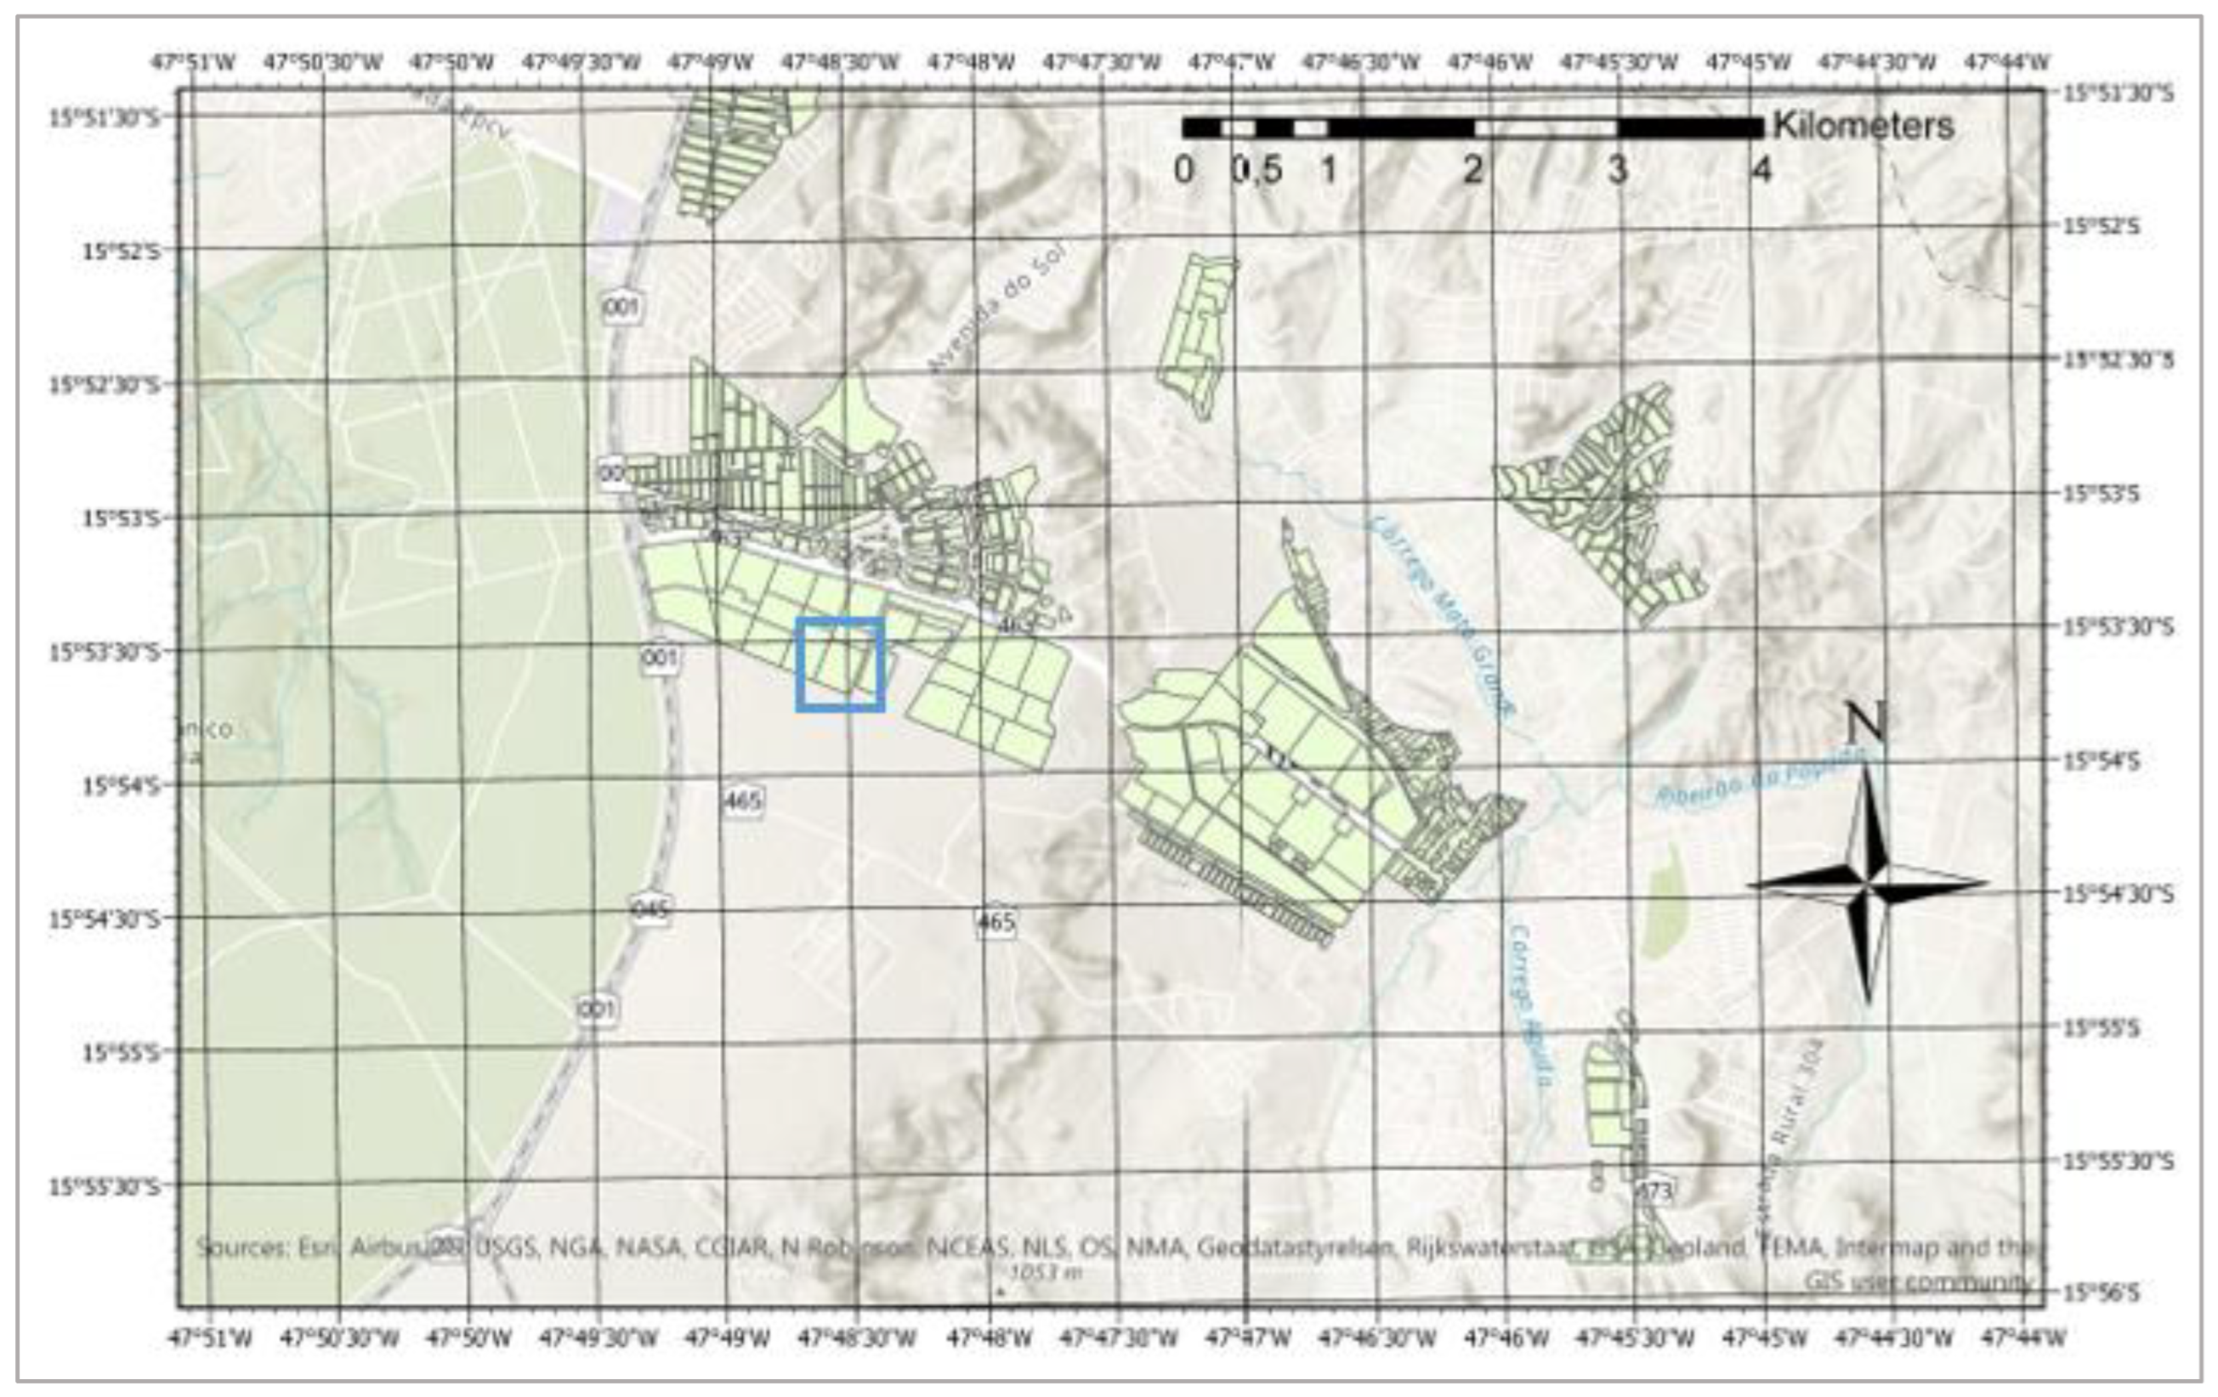
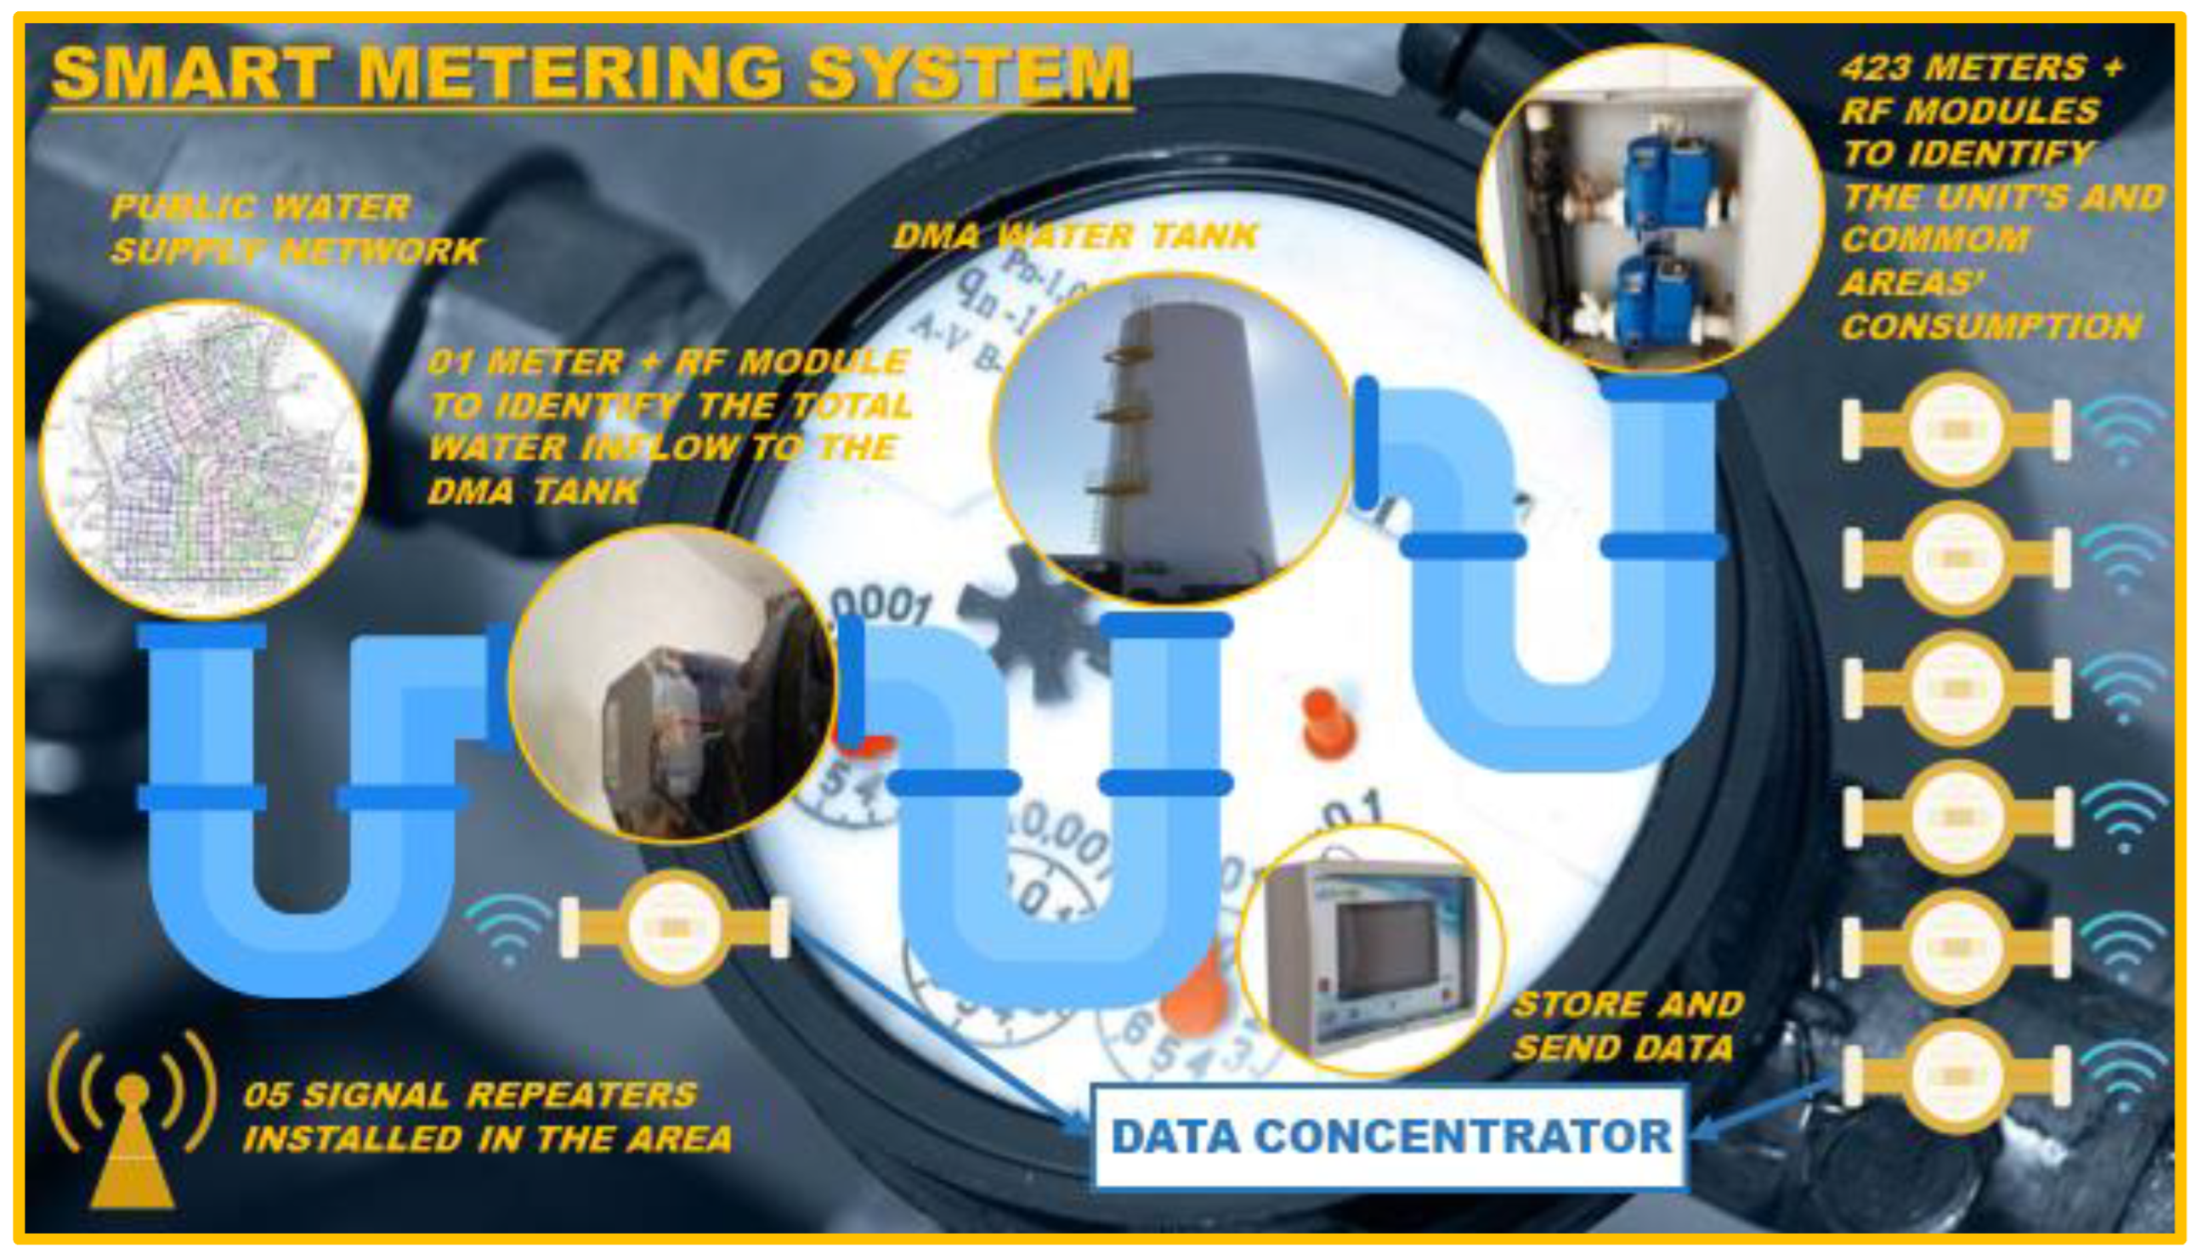
The SM system was conceived in a residential block that is part of the region of Brasília called “Jardins Mangueiral”. The District Metered Area (DMA) presents 420 residential units and the intention was to provide a real-time monitoring and processing system for water consumption at an individual user level. Thereby, to register a unit’s consumption, the Environmental Sanitation Company of Brasília (Caesb) installed 424 telemetry-equipped water meters: one for each unit, three to register the consumption of the common areas and another one to identify the total water inflow to the DMA tank. In addition, an infrastructure for radio transmission was installed and a tool for data availability via the Web was developed.
Figure 1 shows the study area location.
The WDN is supplied from a tank where water comes from the public water supply after passing the macrometer. From here, the water is consumed in the units after passing through their individual water meters. The average consumption of the condominium, before the SM structure, was approximately 4418 m
3 per month. It was not possible to determine unit consumption before the SM, since the utility did not have individual measurement. The SM system deployment scheme is shown in
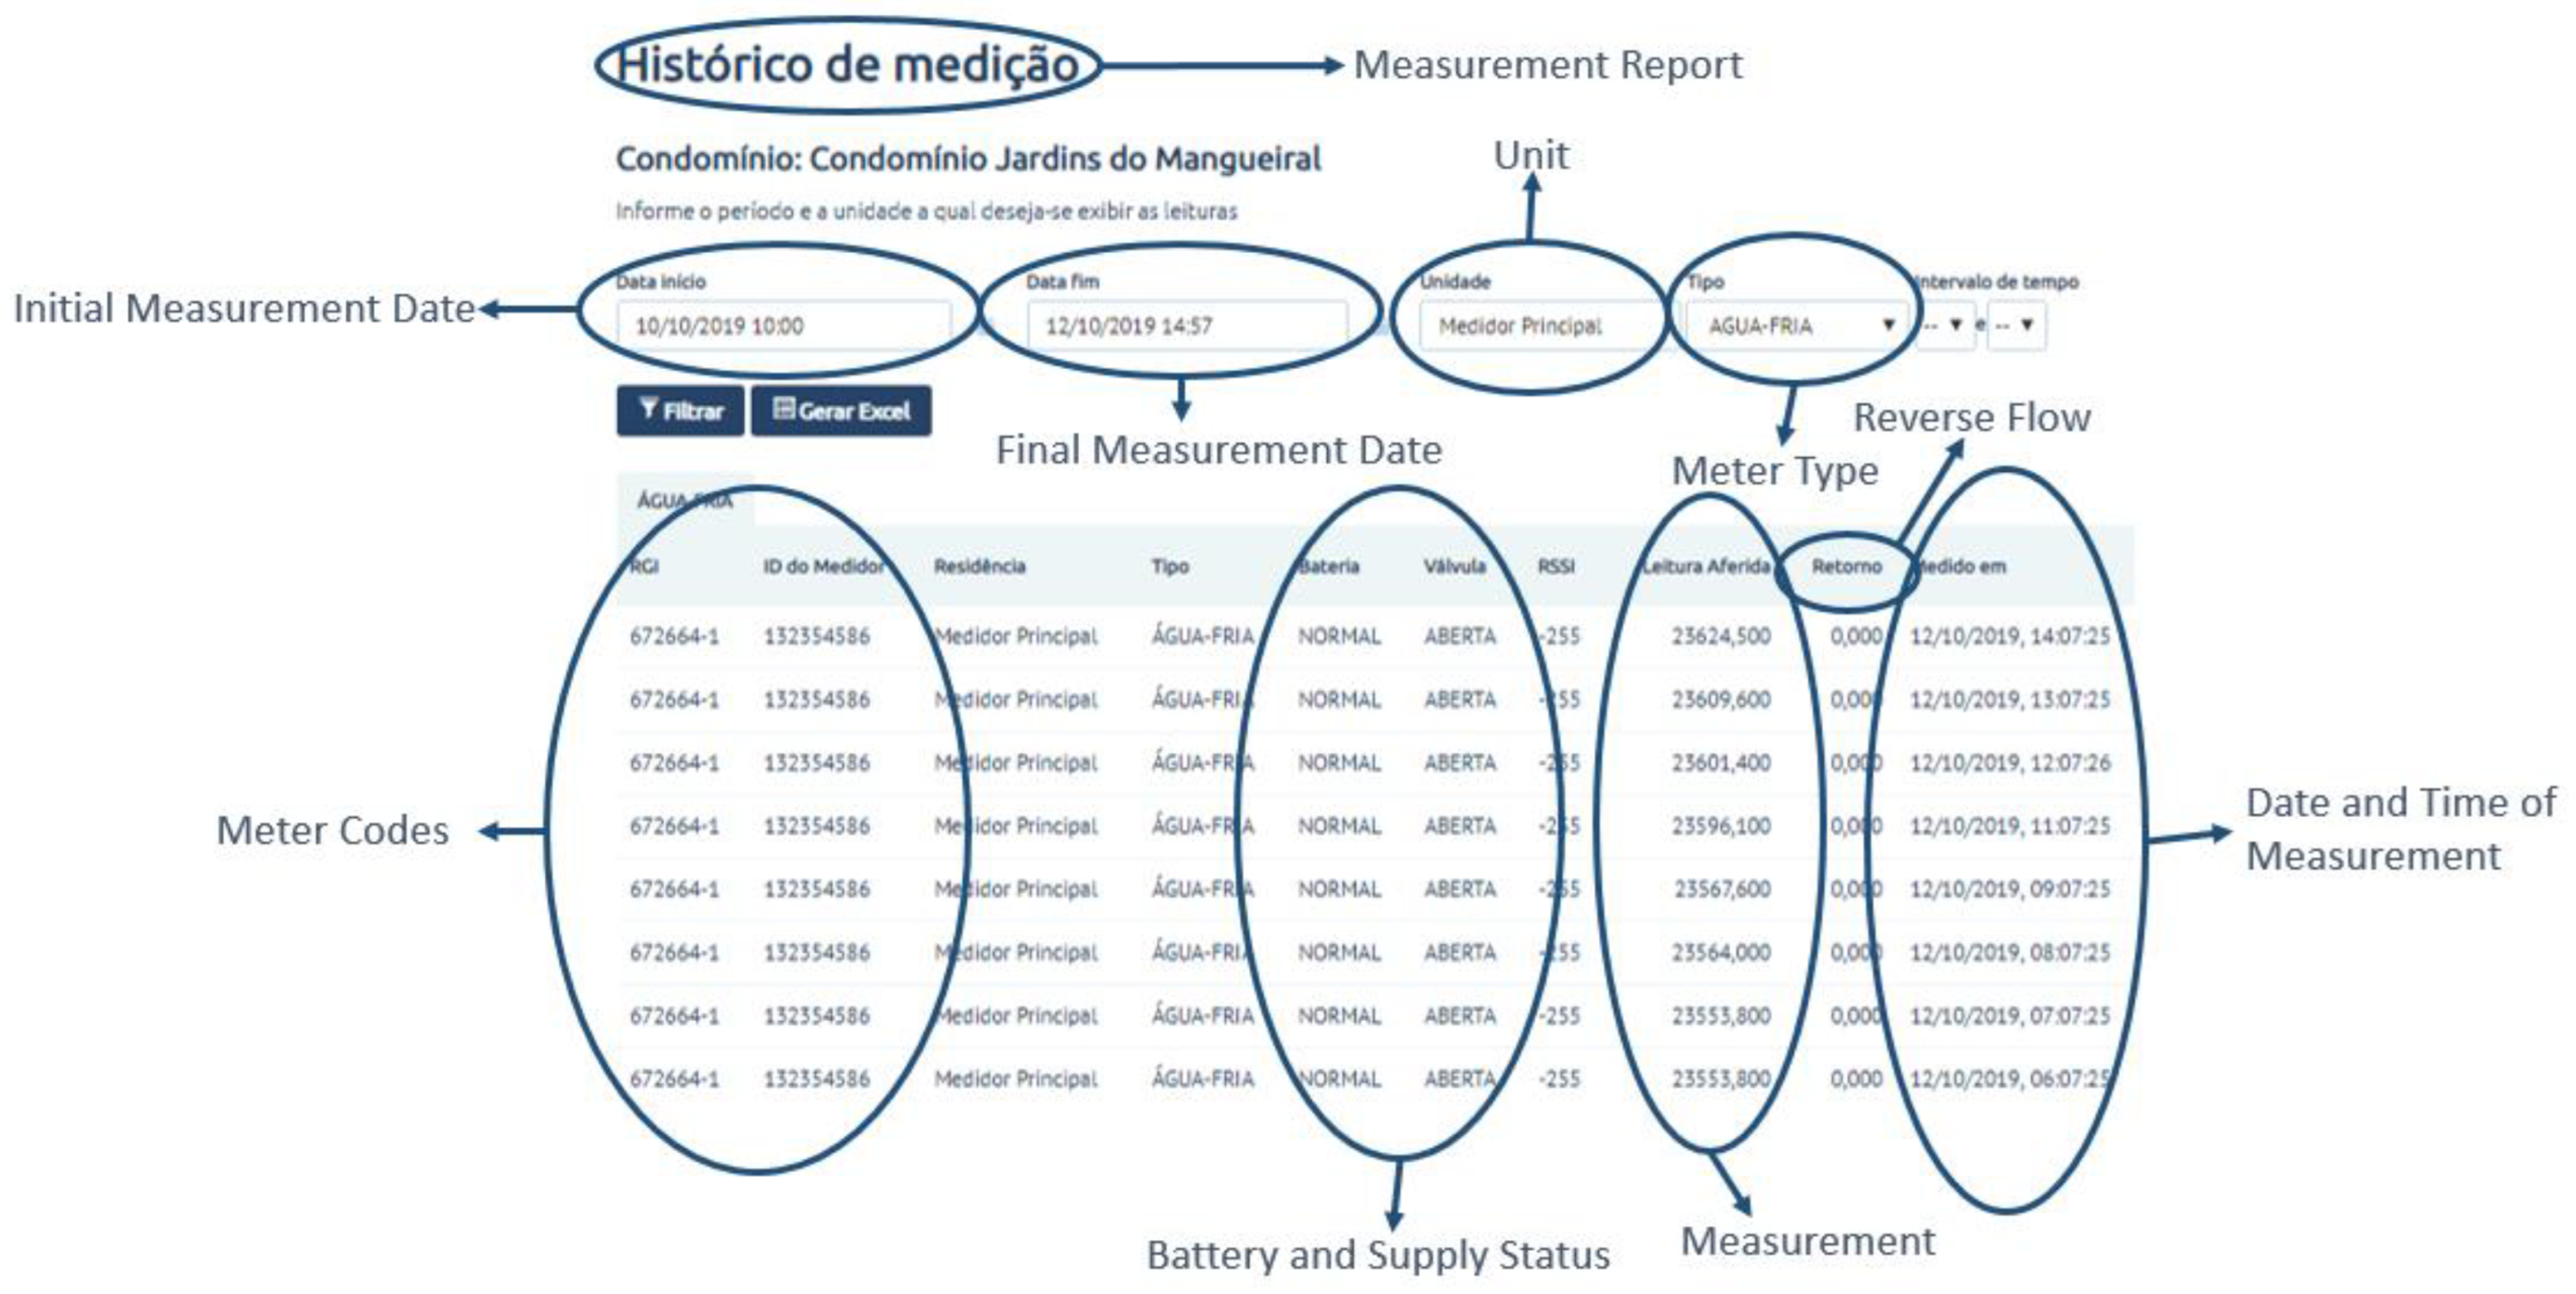
Figure 2. A software was developed to record the volumes determined by the meters. The screen that shows the measurement report is presented in
Figure 3.
2.2. Implementation Costs
To evaluate the economic viability of the project, it is fundamental to understand the implementation costs, that is, is the money spent to install the parts and equipment necessary for the system to work. The SM system’s implementation costs were obtained from a public database of the water utility and include the following equipment and services: a data concentrator; a signal repeater; water meters; a radio frequency (RF) transmitter module with a valve to suspend water supply remotely; an executive project; and installation and configuration of the equipment.
2.3. Maintenance Costs
The maintenance costs are the investments needed to keep the system working after its implementation and they are also important to evaluate the economic viability of a given project. The SM system’s maintenance costs were obtained from both interviews and internal research with managers of the water utility and include the following services: a server software availability report and services; a supervisory system availability report and services; a maintenance, update and support report and services; and a data communication report and services.
2.4. Water Demand Reduction
One of the possible positive impacts of SM systems is the water demand reduction. To understand if there were changes in the pattern, the average consumption before and after the SM implementation were calculated. At this point, it is important to highlight that the SM system started to work appropriately in September 2019, and the amount of available data are thus limited and the results presented here should be reviewed for a longer period.
2.5. Increased Revenues
Another impact of SM systems is the increase in revenue. With a more accurate measurement system, it is possible to have a fairer financial return for the services provided. In order to estimate the impact of the SM implementation in revenue variation, billing averages were calculated for the period before and after the implementation of the system. Similarly, it is important to point out that the SM system started to work properly in September 2019; thus, little data are available and further analysis should be conducted.
2.6. Visual Reading and Smart Metering Costs
Considering the fact that readings are now obtained remotely, the implementation of a SM system implies a reduction in costs. To comprehend the savings generated and to promote an economic viability analysis, the costs with the visual reading were obtained from a public database of the water utility.
2.7. Economic Viability Analysis
The economic viability analysis intends to measure costs and benefits of a given project. This article presents the SM project’s simple and discounted payback time considering costs, benefits and an interest rate. The source of funds for carrying out the project was the loan granted to Caesb by the Inter-American Development Bank (IDB). In this scenario, the interest rate used to calculate the discounted payback time was the LIBOR rate - the average interbank interest rate at which a selection of banks on the London money market are prepared to lend to one another - plus loan charges, which was the interest rate used when contracting the loan. Equations (1) and (2) determined the payback time.
where Ts is the simple payback time, I is the implementation costs, B is the annual benefit, C is the annual maintenance cost, Pv is the discounted cash flow, i is the interest rate and N is the number of years considered.
3. Results
Initially, the unitary value of each equipment or service was obtained. Annual maintenance costs were estimated based on the costs presented in the first period of the system operation.
Table 1 presents the implementation costs and
Table 2 shows the estimated annual maintenance costs of the SM system. For the calculations, the dollar values represent the September 2019 average conversion rate.
Based on the implementation and annual maintenance costs, the total costs per consumption unit were obtained, as shown in
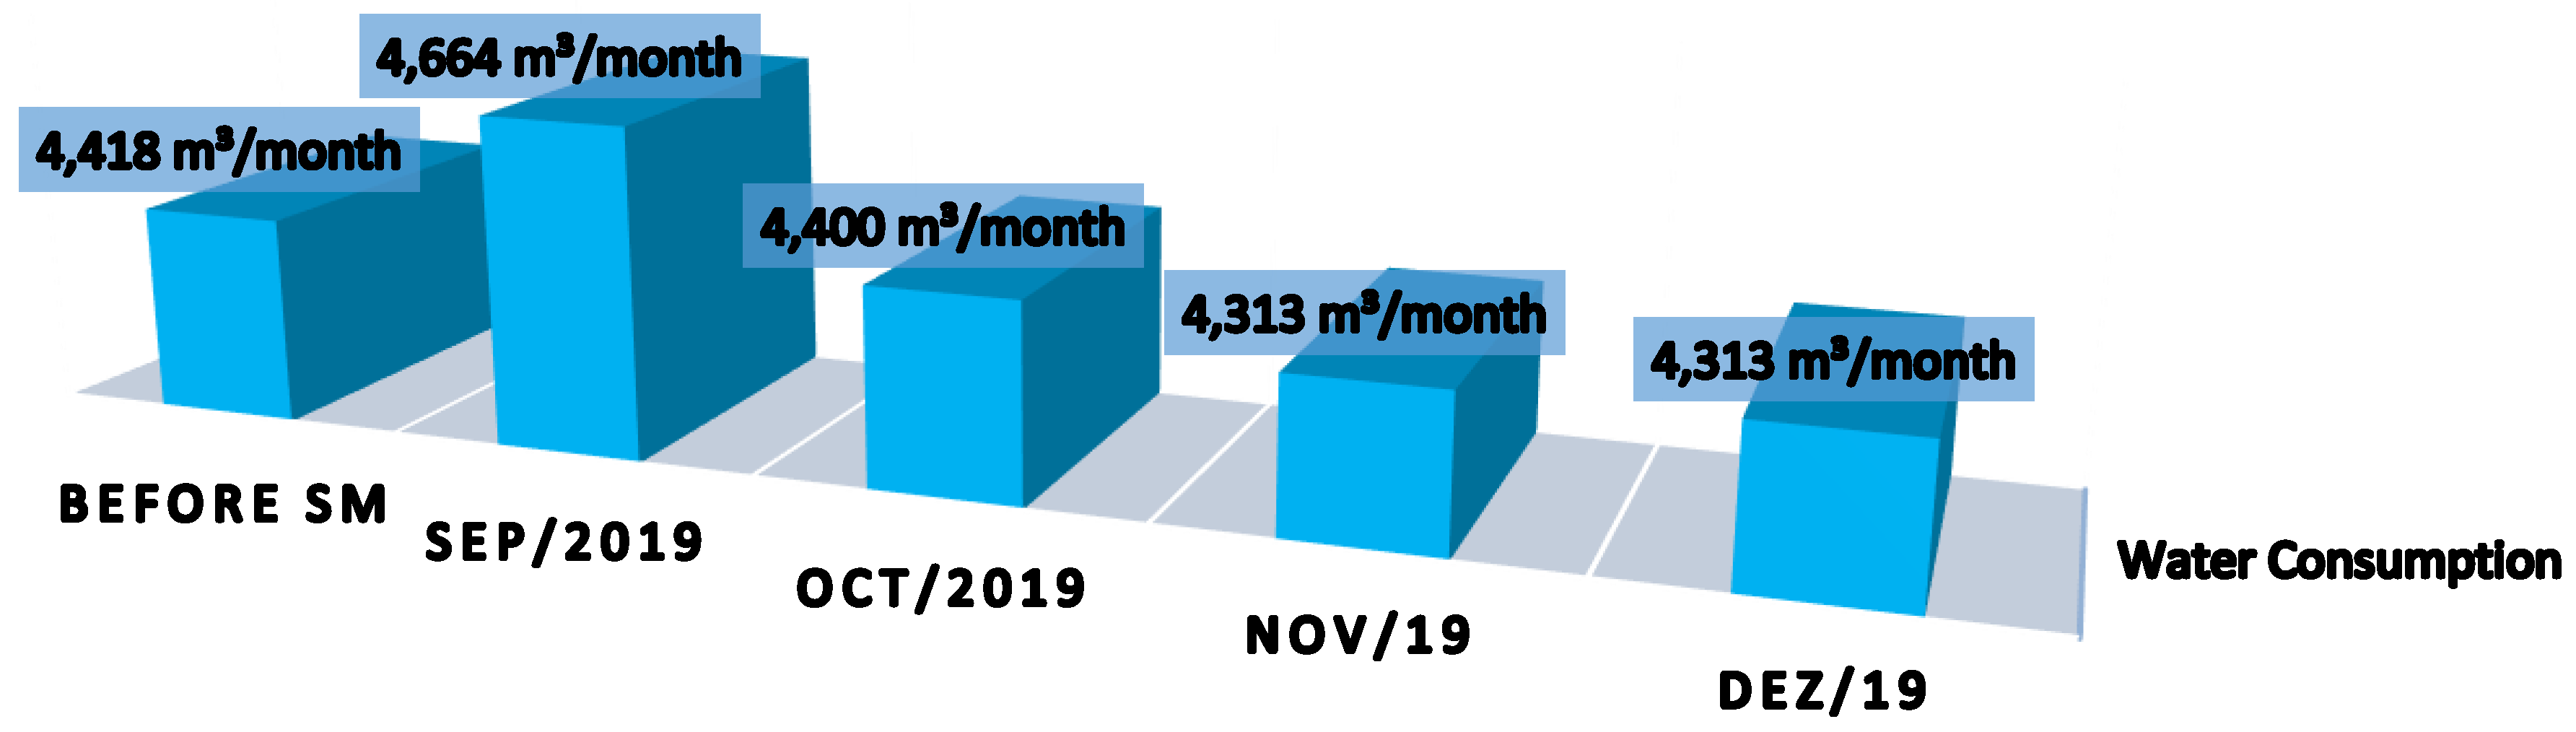
Table 3. To characterize the possible changes in the water demand pattern of the condominium,
Table 4 and the graph shown in
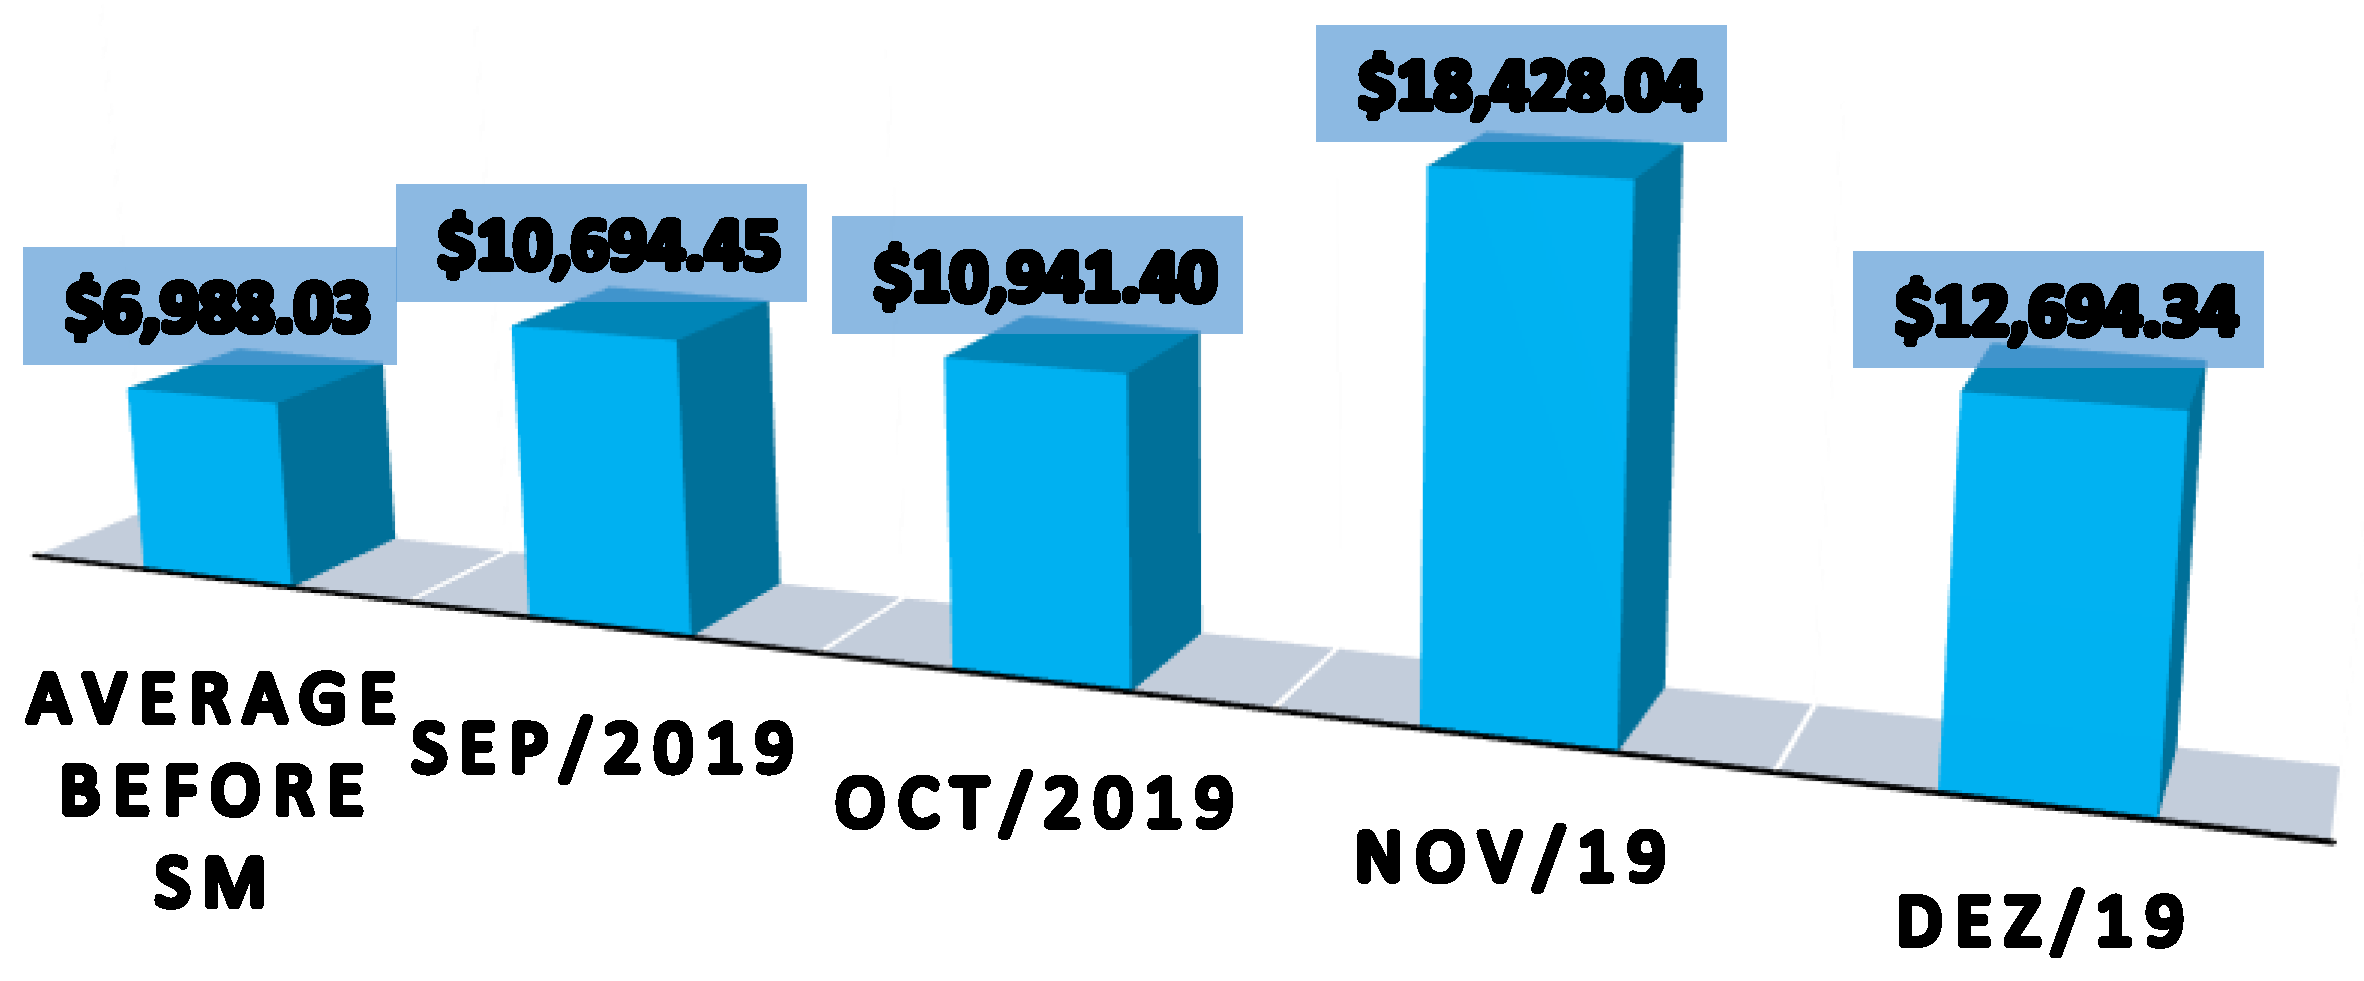
Figure 4 represent the monthly water consumption before and after the implementation of the SM system. The average water consumption of DMA was approximately constant before and after SM operation. On the other hand, the revenue increased significantly after SM initial operation, as shown in
Figure 5 and
Table 5. DMA monthly billing was USD 6988.06 before the SM program, and it increased to USD 13,189.56 after the implementation of the SM system.
The costs with visual readings of the water meters were estimated to be USD 0.19 per water meter per month. Therefore, the total monthly cost of visual reading was USD 80.56 (424 water meters).
To conduct the economic viability analysis of the project, the simple payback time was calculated to be 1.2 years and, as summarized in
Table 6, the calculated discounted payback time was 1.3 years.
4. Conclusions
This study analyzed the costs and benefits of a smart metering (SM) program over five months in a water distribution network located in Brasília, Brazil. The preliminary results show that:
In a short-term analysis, it is possible to conclude that the SM system operation did not imply a water demand reduction. However, it is important to compare the results obtained in this paper with other projects of the same configuration;
Likewise, in a short-term analysis, it is possible to state that the revenue increases significantly after the implementation of the SM system;
It is also possible to conclude that the implementation of the SM reduced the cost of reading water meters;
Considering the implementation and the annual maintenance costs, the simple and discounted payback time for the project investment is 1.2 and 1.3 years, respectively;
Further studies could take into account longer periods. It is also important to clarify that this type of project requires previous and complex studies and is often not a priority when compared to the other needs of water utilities.
Author Contributions
Conceptualization, D.F.C. and A.K.S.; methodology, D.F.C.; software, D.F.C.; validation, D.F.C. and A.K.S.; formal analysis, D.F.C.; investigation, D.F.C.; resources, D.F.C.; data curation, D.F.C.; writing—original draft preparation, D.F.C. and A.K.S.; writing—review and editing, D.F.C. and A.K.S.; visualization, D.F.C.; supervision, A.K.S.; project administration, D.F.C.; funding acquisition, D.F.C. All authors have read and agree to the published version of the manuscript.
Conflicts of Interest
The authors declare no conflict of interest.
References
- Nguyen, K.A.; Stewart, R.A.; Zhang, H.; Sahin, O.; Siriwardene, N. Re-engineering traditional urban water management practices with smart metering and informatics. Environ. Model. Softw. 2018, 101, 256–267. [Google Scholar] [CrossRef]
- March, H.; Morote, A.F.; Rico, A.M.; Saurí, D. Household Smart Water Metering in Spain: Insights from the Experience of Remote Meter Reading in Alicante. Sustainability 2017, 9, 582. [Google Scholar] [CrossRef]
- Beal, C.D.; Stewart, R.A.; Giurco, D.; Panuwatwanich, K. Intelligent metering for urban water planning and management. In Water Efficiency in Buildings: Theory and Practice; Adeyeye, K., Ed.; John Wiley & Sons Ltd.: Hoboken, NJ, USA, 2014; pp. 129–145. [Google Scholar]
- Stewart, R.A.; Willis, R.; Giurco, D.; Panuwatwanich, K.; Capati, G. Web based knowledge management system: Linking smart metering to the future of urban water planning. Aust. Plan. 2010, 47, 66–74. [Google Scholar] [CrossRef]
- Beal, C.D.; Flynn, J. Toward the digital water age: Survey and case studies of Australian Water utility smart-metering programs. Util. Policy 2015, 32, 29–37. [Google Scholar] [CrossRef]
- Davies, K.; Doolan, C.; van den Honert, R.; Shi, R. Water-saving impacts of Smart Meter technology: An empirical 5-year, whole-of-community study in Sidney, Australia. Water Resour. Res. 2014, 50, 7348–7358. [Google Scholar] [CrossRef]
- Giurco, D.; White, S.; Stewart, R.A. Smart metering and water end-use data: Conservation benefits and privacy risks. Water 2010, 2, 461. [Google Scholar] [CrossRef]
- Black, R.; Davidson, P.; Retra, K. Facilitating Energy Saving Behaviors among University Student Residents, Report 53; Institute for Land, Water and Soc., Charles Sturt University: Sidney, Australia, 2009; Available online: http://www.csu.edu.au/research/ilws/research/reports/docs/53_energy_saving_behavior.pdf (accessed on 20 December 2019).
| Publisher’s Note: MDPI stays neutral with regard to jurisdictional claims in published maps and institutional affiliations. |
© 2022 by the authors. Licensee MDPI, Basel, Switzerland. This article is an open access article distributed under the terms and conditions of the Creative Commons Attribution (CC BY) license (https://creativecommons.org/licenses/by/4.0/).


