Abstract
Analysis of climatic characteristics, Palmer Drought Severity Index, and large-scale river runoff based on observational data (CRUTEM.5, GISSTEMP v4, CRU TS4.05, CRU-scPDSI) and 20th century reanalysis (ERA20C, CERA20C) shows that the early 20th century warming period, in particular the 1930s, on the East-European Plain was marked by the strong long-lasting drought that has no analogues during the observation period. The atmospheric circulation patterns and drivers of this phenomena, as well as the associated reduction in the sea ice extent of the Kara Sea, are studied.
1. Introduction
The analysis of regional climatic anomalies recorded during the early 20th century warming (ETCW) makes it possible to study the mechanisms of internal natural climatic variability and the conditions for the occurrence of such anomalies in connection with global changes. Studies of regional manifestations of ETCW in temperate and high latitudes of Eurasia are mainly focused on the Arctic warming, sea ice loss and related atmospheric circulation patterns in the winter season [1,2]. At the same time, the unprecedented rise and decrease in the annual runoff of the Volga and the Severnaya Dvina recorded in the long-term series of hydrological observations indicate large-scale anomalies of humidification in the period of 1920–1940. The objective of the study was to analyze the climatic characteristics and circulation patterns of these events, and their links with the sea ice variability as well, considering them in the context of the ETCW.
2. Materials and Methods
The study of humidification anomalies on the East-European Plain (EEP) in 1920–1040 was based on data from a long-time series of observations of changes in the annual runoff of the Severnaya Dvina rivers, as well as the Volga and its tributaries Vyatka, Belaya, and Oka. Spatial-averaged (20–60 E;45–70 N) climatic data from archives of gridded observation were also examined: monthly surface air temperature (SAT) (HadCRUT5.0 and GISTEMP v4), precipitation (CRU TS4.05), and Palmer Drought Severity Index (PDSI) CRU-scPDSI.
To identify the circulation patterns “responsible” for the formation of heat and drought conditions on the EEP, the analysis of empirical orthogonal functions (EOF) of the atmospheric sea level pressure anomalies’ variability was obtained from observations from the HadSLP2 grid archive.
We analyzed the possible link between sea ice variability in the Barents–Kara region and warm and drought conditions in the EEP in 1920–1940 using correlation analysis (both synchronous and shift) using monthly mean sea ice area (SIA) in the Barents Sea and sea ice extent (SIE) in the Kara Sea, sea surface temperature (SST), and sea level pressure (SLP).
Data on the SIE in August for the Kara Sea spanning from 1924 was obtained from the Arctic and Antarctic Research Institute database. Since no such long series of in situ data is available for the Barents Sea, we used a new, slightly modified version of a reconstructed sea ice concentration (SIC) data set spanning the time period 1901 to 2020 for all months. For SST data, we used ERSSTv5. SLP data was obtained from HadSLP2 data set.
3. Results
3.1. Extreme Hydrological Phenomena and Droughts on the East-European Plain in 1920–1940
Abrupt fall in water discharge since 1930 led to a 9-year period of continuous deficit of annual Volga runoff (on average about 18%), which became the absolute maximum duration for the observation period; the next low-water period in 1954–1957 was 4 years (Figure 1a). The anomalies of the annual runoff of the Severnaya Dvina, Vyatka, and Belaya demonstrated a more significant amplitude, in contrast to the westerly located Oka basin, where the phenomena investigated did not manifest themselves.
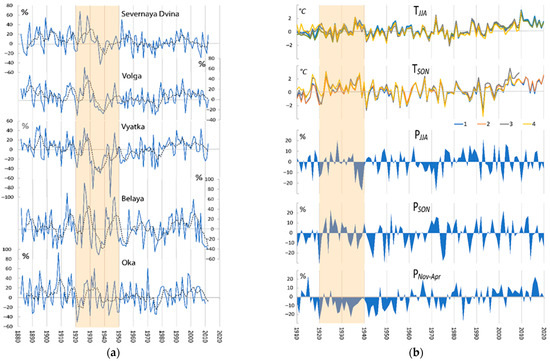
Figure 1.
(a) Annual runoff, percent as compared with 1961–1990, for the rivers Severnaya Dvina, Volga, Vyatka, Belaya, and Oka. (b) Spatially averaged (20–60 E; 45–70 N) variations of the SAT anomalies, °C, 1, GISSTEMP, 2, CRUTEM, 3, ERA20C, CERA20C, and precipitation, percent as compared with 1961–1990, for summer (JJA), autumn (SON), and cold period (November–April).
Variation in SAT and precipitation on the territory of the EEP for the period of 1910–1950 demonstrated summer extremes of both signs—cold and humid summers, in 1926 and 1928, and prolonged drought against the background of abnormal heat, in 1931, and 1936–1939. (Figure 1b). The major role belonged to the deficit of precipitation of the cold period, which lasted from the mid-1920s to the mid-1950s.
The PDSI variation show that the rates of moisture deficiency and the duration of drought in the EPP in 1934–1940 had no analogues during the observation period (Figure 2a). The spatial distribution of PDSI on average for the 4 driest years (Figure 2c) shows that in a significant part of the territory, especially in the feed areas of the Volga and Severnaya Dvina basins, the index values fell below −4, locally below −5, and indicate a severe, in places, extreme drought according to the Palmer classification. During the wet years, the PDSI anomalies did not exceed 4, and thus, did not exceed the gradation of “severely wet”.
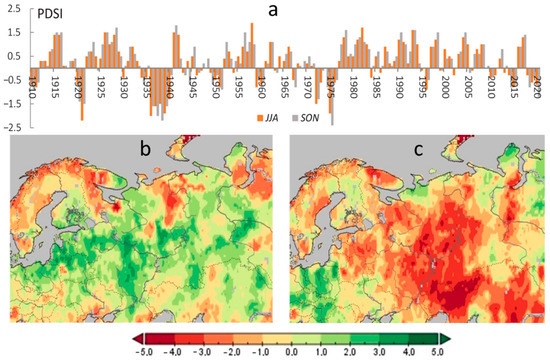
Figure 2.
(a) Spatially averaged (20–60 E; 45–70 N) PDSI for summer (JJA) and autumn (SON), and its (b,c) spatial distribution for the (b) “wet” (1923, 1926, 1927, 1928) and (c) “dry” (1936, 1938, 1939, 1940) years.
3.2. Atmospheric Circulation Conditions and Drivers of Summer Warming and Extreme Drought on the East-European Plain during the Period of the Early 20th Century Warming
The main difference in the distribution of SLP during abnormally hot summers (Figure 3a) on the EEP is associated with the subtropical high-pressure belt (Figure 3b) in particular with its significant spread to the north of the Atlantic, and to the east, beyond the Urals. The noted features are clearly manifested in the SLP difference between the patterns related to anomalies of summer SAT of different signs (Figure 3c). They can be characterized as a dipole, where the main, anticyclonic center located over the EEP in the north and northwest borders with a cyclonic anomaly, centered in the circumpolar region. Thus, the distribution of pressure anomalies creates conditions for the blocking anticyclone over the EEP and pumping of warm and dry air from the subtropics to mid- and high latitudes up to the Barents and Kara Seas.
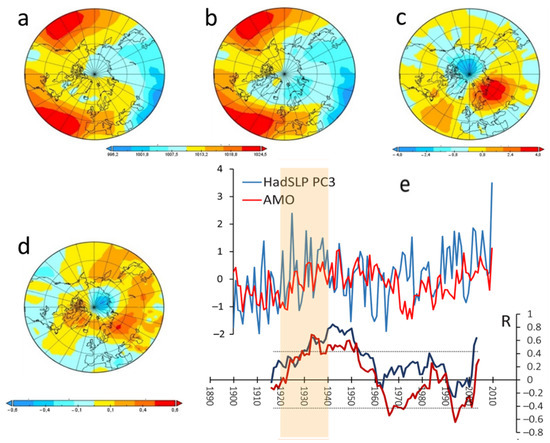
Figure 3.
Patterns of the SLP, gPa, on average for the years of (a) maxima (1931, 1936, 1938) and (b) minima (1923, 1926, 1928) summer (JJA) SAT on the EEP and (c) the difference between them; (d) EOF3 of SLP variability in summer months (JA); (e) SLP PC3 and AMO(×4) (upper panel) and correlation coefficients between (blue) PC3 and SAT, (red) AMO and SAT, calculated over 15-year running periods (bottom panel).
EOF analysis of SLP variability in the summer months (JA) for 1900–2010 shows that the anomalies of the 1930s and 2000s are described by EOF3 and corresponding PC3 (Figure 3d,e). The main features of EOF3 (Figure 3d) are an extensive anticyclonic anomaly centered on the EEP and a cyclonic anomaly in the circumpolar region of the Pacific sector. Temporal evolution of the PC3 (Figure 3e) in 1900–2010 demonstrates long-term fluctuations with two positive phases corresponding to the summer SAT anomalies during the ETCW and the late 1990s–2000s with an absolute maximum in 2010, as well.
The linear correlation between PC3 of surface pressure and summer month (JA) SAT on average for the EEP territory, calculated from 15-year running periods (Figure 3e), demonstrates statistically significant (p > 0.05) value during the period of the ETCW up to 0.6–0.8 in 1930–1950. The correlation coefficients between PC3 and Atlantic Multidecadal Oscillation (AMO) (Figure 3e) also reached statistical significance in the 1930s and the 1950s. In contrast of the interannual variations, the link between PC3 and AMO long-term fluctuations seem to be stable for the 1900–2010 period.
3.3. The Link of Summer Warming and Drought in the East-European Plain in 1920–1940 to Arctic Warming and Changes of Sea Ice Area in the Barents and Kara Seas
The SIE in August in the Barents and Kara Seas during the years of positive and negative SAT anomalies in the EEP (or low-water and high-water years of Volga river) was compared, which showed a significant decline of sea ice in August of years with positive anomaly compared to negative anomaly years.
The analysis of the spatial patterns of SIC in the years of positive and negative SAT anomalies in the EEP suggests spatial features. We analyzed May (as a month of melting process) and August (as a month of minimum SIE). In May, the sea ice extends northeastward to the Novaya Zemlya archipelago in the period of negative SAT anomaly compared to positive ones (Figure 4a). In August, a decrease of the SIC is observed in the north part of both the Barents and Kara Seas (Figure 4b). The spatial features of the differences of SIC indicates the influence of the variability of the warm Atlantic water inflow to the Barents and Kara Seas.
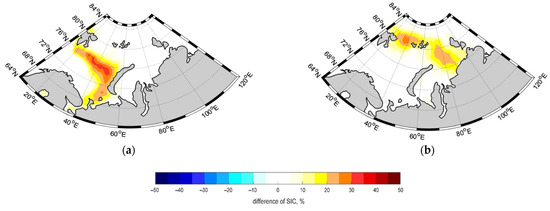
Figure 4.
Difference in SIC (%) in years of high water and low water phases of the Volga River (a) in May and (b) in August.
The AMO also can affect the SIE of the Barents and Kara Seas. Meanwhile, sea ice decline in the Barents Sea in spring can lead to a formation of cyclonic vortex over the Barents Sea (Figure 5). This atmosphere circulation response, in turn, can increase oceanic inflow of warm and salty Atlantic water masses. This positive feedback causes further sea ice loss. This warm Barents and Kara Seas region may result in atmospheric blocking conditions south of the Barents Sea and may contribute to a precipitation deficiency and a positive SAT anomaly.
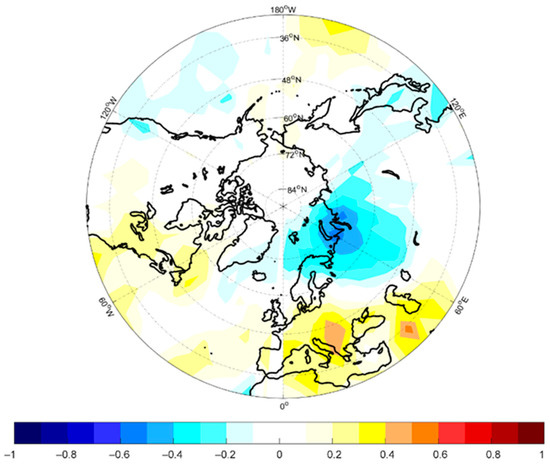
Figure 5.
Correlation coefficients between SIA in the Barents Sea in May and SLP anomalies in July for 1924–1950.
4. Discussion
The analysis of climatic characteristics and the PDSI on the territory of the EEP for 1910–2020 shows that the ETCW period was marked by a strong long-lasting drought, followed by a short period of increased humidification. In the catalog of severe droughts on the territory of the EEP, the 1930s are characterized by a high frequency of drought occurrence but were not studied in the context of the ETCW. The analysis shows that the precipitation deficit, as well as the intensity and duration of recurrent drought during 1934–1940, have no analogues during the observation period.
Analogous phenomena during the ETCW period, in particular, catastrophic droughts in the 1930s on the Great Plains, North America, were previously studied [1,3,4]. These phenomena are associated with the northward expansion of the Hadley cell and the subtropical high-pressure belt [3,5]. The patterns of atmospheric pressure anomalies, obtained for the severe drought events in 1930s on the EEP, indicate the expansion of the subtropical high-pressure belt over the Atlantic, that is able to affect planetary atmospheric waves in the mid-latitudes and became one of the factors of a stable anticyclone over the EEP. In combination with a cyclonic anomaly in the circumpolar region, it forms a dipole structure characteristic of the circulation conditions of the dry and hot summers of the 1930s and has a similarity with the previously described circulation mechanism of Arctic warming during the ETCW [6]. This atmospheric pattern can be connected to the Arctic sea ice changes, particularly in the Barents and Kara Seas region. The impact and link between sea ice variability in this region and the atmospheric circulation patterns (both for the recent and ETCW period) was described in [7,8] but still requires clarification of their connection to EEP droughts in 1930s.
The peak of the positive phase of AMO observed in the 1930s, according to the results of a number of studies, including numerical simulation [9], could cause the climatic changes diagnosed during the ETCW period. The estimates obtained [10] indicate a leading contribution, up to 80%, to the variability of the Northern Hemisphere SAT. Our analysis of the long-term EOF pattern evolution for 1900–2010, describing the mechanism of hot and dry summer circulation on the EEP, indicates a connection with AMO [1], in particular, its positive phases in the 1930s–1940s and in the 2000s.
5. Conclusions
Study of climatic characteristics and the annual runoff of the Volga and Severnaya Dvina rivers shows that, on the EEP, the ETCW manifested in a multiyear drought, 1934–1940, which has no analogues in this region in intensity and duration according to Palmer’s classification and which caused extreme hydrological events. The circulation conditions during this event are characterized by an extensive anticyclone over Eastern Europe combined with a cyclonic anomaly in the circumpolar region. The positive AMO phase and the expansion of the subtropical high-pressure belt to the north and to the east can be considered as possible drivers of this phenomenon. The AMO also impacts the sea ice cover in the Barents-Kara Sea region and, in turn, could have led to specific atmospheric circulation patterns and contributed to droughts in the EEP in the 1930s.
Author Contributions
Conceptualization, V.P.; methodology, V.P., T.M.; validation, formal analysis and investigation, V.P, T.M., D.B.; resources and data curation, V.P., T.M., D.B.; writing and editing, V.P., T.M., D.B.; visualization, V.P., T.M.; supervision and project administration, V.P. All authors have read and agreed to the published version of the manuscript.
Funding
This research was funded by Russian Science Foundation (RSF) grant number 22-27-00495.
Data Availability Statement
The study is based on the publicly archived datasets and generated during the previous investigations: SAT gridded datasets include observational data, HadCRUT5 (https://crudata.uea.ac.uk/cru/data/temperature/), GISSTEMP (v4 https://data.giss.nasa.gov/gistemp/), and 20th century reanalisys, ERA20C (https://apps.ecmwf.int/datasets/data/era20c), CERA-20C (https://apps.ecmwf.int/datasets/data/cera20c); precipitatation data and Self-calibrating Palmer Drought Severity Index – CRU TS v4.05 (https://crudata.uea.ac.uk/cru/data/hrg/cru_ts_4.05/), scPDSI (https://crudata.uea.ac.uk/cru/data/drought/); Sea Level Pressure–HadSLP2 (https://www.metoffice.gov.uk/hadobs/hadslp2); AMO–NOAA PSL1(http://www.psl.noaa.gov/data/timeseries/AMO/). Data on the SIE in August for the Kara Sea from 1924 was obtained from the Arctic and Antarctic Research Institute database (https://nsidc.org/data/g02182/versions/1, free access). For the Barents Sea, the new reconstructed SIC data set was used (data can be sent upon request to Tatiana Matveeva (matveeva.tatiana@igras.ru).
Conflicts of Interest
The authors declare no conflict of interest.
References
- Hegerl, G.C.; Brönnimann, S.; Schurer, A.; Cowan, T. The early 20th century warming: Anomalies, causes, and consequences. WIREs Clim. Chang. 2018, 9, 522. [Google Scholar] [CrossRef] [PubMed]
- Wegmann, M.; Orsolini, Y.; Zolina, O. Warm Arctic–cold Siberia: Comparing the recent and the early 20th-century Arctic warmings. Environ. Res. Lett. 2018, 13, 025009. [Google Scholar] [CrossRef]
- Cook, B.I.; Seager, R.; Miller, R.L. Atmospheric circulation anomalies during two persistent north american droughts: 1932–1939 and 1948–1957. Clim. Dyn. 2011, 36, 2339–2355. [Google Scholar] [CrossRef]
- Schubert, S.D.; Suarez, M.J.; Pegion, P.J.; Koster, R.D.; Bacmeister, J.T. Causes of long-term drought in the U.S. Great Plains. J. Clim. 2004, 17, 485–503. [Google Scholar]
- Brönnimann, S.; Stickler, A.; Griesser, T.; Ewen, T.; Grant, A.N.; Fischer, A.M.; Ross, T. Exceptional atmospheric circulation during the “Dust Bowl”. Geophys. Res. Lett. 2009, 36, 1–6. [Google Scholar] [CrossRef]
- Grant, A.; Brönnimann, S.; Ewen, T.; Griesser, T.; Stickler, A. The early twentieth century warm period in the European Arctic. Meteorol. Z. 2009, 18, 425–432. [Google Scholar] [CrossRef]
- Kumar, A.; Yadav, J.; Mohan, R. Spatio-temporal change and variability of Barents-Kara sea ice, in the Arctic: Ocean and atmospheric implications. Sci. Total Environ. 2021, 753, 142046. [Google Scholar] [CrossRef] [PubMed]
- Cai, Q.; Beletsky, D.; Wang, J.; Lei, R. Interannual and Decadal Variability of Arctic Summer Sea Ice Associated with Atmospheric Teleconnection Patterns during 1850–2017. J. Clim. 2021, 34, 9931–9955. [Google Scholar] [CrossRef]
- Chylek, P.; Klett, J.D.; Dubey, M.K.; Hengartner, N. The role of Atlantic Multi-decadal Oscillation in the global mean temperature variability. Clim. Dyn. 2016, 47, 3271–3279. [Google Scholar] [CrossRef]
- Bokuchava, D.D.; Semenov, V.A. Mechanisms of the Early 20th Century Warming in the Arctic. Earth-Sci. Rev. 2021, 222, 103820. [Google Scholar] [CrossRef]
Publisher’s Note: MDPI stays neutral with regard to jurisdictional claims in published maps and institutional affiliations. |
© 2022 by the authors. Licensee MDPI, Basel, Switzerland. This article is an open access article distributed under the terms and conditions of the Creative Commons Attribution (CC BY) license (https://creativecommons.org/licenses/by/4.0/).