Article

Selected Energy-Related Emissions and Indicative Forest Carbon Uptake: An IPCC-Based Screening Assessment


1
Department of Civil Engineering, Faculty of Engineering, Munzur University, 62000 Tunceli, Türkiye
2
Civil Engineering Department, University for Business and Technology (UBT), 10000 Pristina, Kosovo
*
Author to whom correspondence should be addressed.
These authors contributed equally to this work.
Earth 2026, 7(5), 154; https://doi.org/10.3390/earth7050154 (registering DOI)
Submission received: 1 August 2026 / Revised: 14 September 2026 / Accepted: 14 September 2026 / Published: 17 September 2026
(This article belongs to the Special Issue Climate-Sensitive Urban Design for Heatwave Mitigation)

Abstract

Carbon-accounting studies of small, lightly industrialized provinces remain underrepresented despite their relevance to regional climate policy. This study quantifies energy-related CO2 emissions from selected sources in Tunceli Province, Eastern Türkiye, for 2022 using the IPCC Tier 1 methodology, with an activity-based bottom-up road-transport estimate as a sensitivity analysis. Because the official grid factor is published on a CO2-equivalent basis, we report the aggregate in Gg CO2-eq yr−1. Under the adopted activity-data assumptions, the selected sources were estimated to produce 288.47 Gg CO2-eq yr−1. The fuel-based road-transport series reaches a minimum in 2020, although observed vehicle-activity data are lacking. As an illustrative scenario conditional on the assumed coefficients, applying a literature-derived gross-uptake coefficient range of 2–5 t CO2 ha−1 yr−1, whose local applicability could not be established, to 137,718 ha of productive closed-canopy forest gives an indicative gross sequestration potential of 275.44–688.59 Gg CO2 yr−1; the upper bound exceeds the compiled emissions, and the lower bound does not. So the comparison shows only that forest uptake capacity is of the same order of magnitude as emissions, not an observed net balance or an operating sink. Under ceteris paribus assumptions, a 75% reduction in residential coal use would avoid about 97.85 Gg CO2 yr−1 (33.9% of the baseline), roughly 42% of which would be reintroduced by natural-gas substitution. Residential heating decarbonization, building efficiency, and forest conservation emerge as mitigation priorities for small forest-rich provinces.

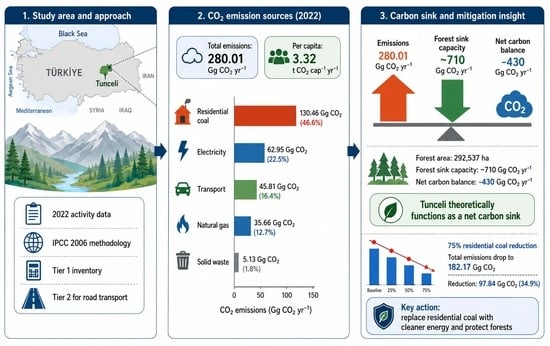
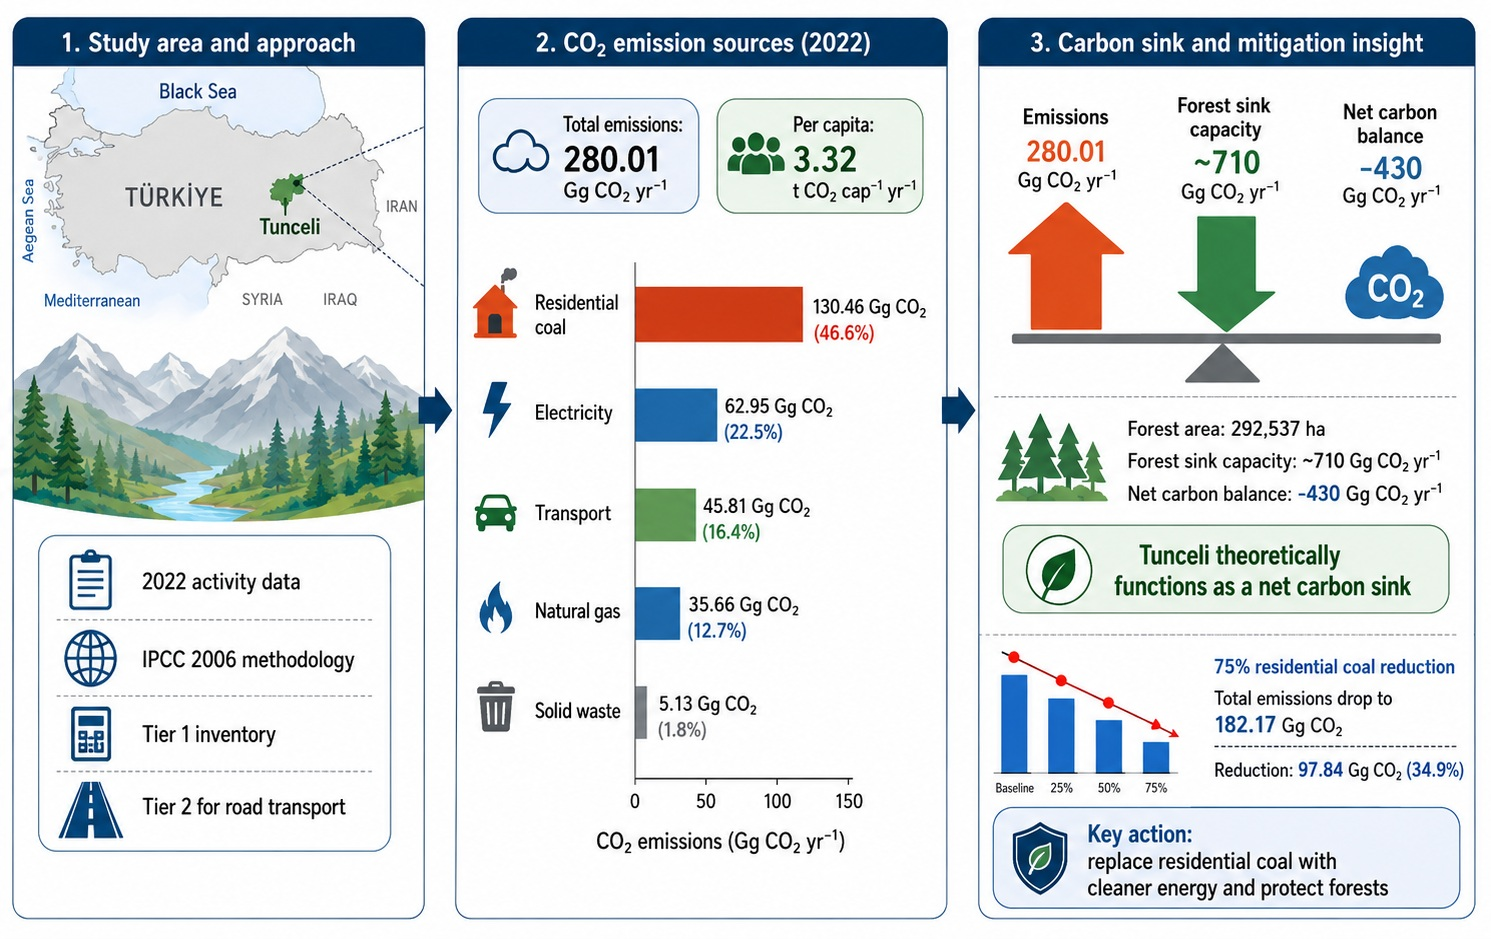
Graphical Abstract

1. Introduction

Climate change and global warming are among the most pressing environmental challenges of the twenty-first century, primarily driven by anthropogenic greenhouse gas (GHG) emissions from fossil fuel combustion, land-use change, industrial production, and consumption patterns [1,2]. Rising atmospheric concentrations of carbon dioxide (CO2), methane (CH4), and nitrous oxide (N2O) have intensified the greenhouse effect, causing long-term changes in temperature regimes, altered precipitation patterns, and more frequent extreme climatic events [3,4]. These changes cascade through water resources, ecosystem stability, agricultural productivity, and public health systems worldwide [5,6]. Effective climate mitigation, therefore, requires systemic transitions in energy production and consumption, as well as reliable local-scale emission inventories, since many emission sources are spatially concentrated and often governed at subnational levels [7,8].
Urban areas house 57% of the world’s population and are responsible for over 70% of global consumption-related carbon emissions, making cities central to both the causes and solutions of climate change [9,10]. By 2020, urban GHG emissions were estimated at 29 Gt CO2-eq, accounting for 67–72% of the global total [11]. Quantifying urban carbon footprints provides a scientific basis for policy development and supports targeted emission-reduction strategies [12]. Carbon footprint assessments, typically expressed in CO2-equivalent emissions, serve as practical tools for identifying emission-intensive sectors, comparing cities on a per-capita basis, and monitoring the effectiveness of mitigation measures over time [13]. Methodologically, the Intergovernmental Panel on Climate Change (IPCC) proposes tiered approaches for greenhouse gas inventories: Tier 1 methods use default emission factors and aggregated activity data to ensure comparability. In contrast, higher-tier methods incorporate detailed local data to improve accuracy [14].
In Türkiye, a growing number of urban and provincial carbon footprint studies have revealed notable sectoral differences linked to settlement characteristics and economic structures [15,16,17]. Previous research shows that transport and residential energy consumption dominate emissions in some provinces, while industrial activity is the main contributor in heavily industrialized cities [18]. For example, the Diyarbakır inventory identified road transportation as a major source of urban CO2 emissions [19,20]. In contrast, the Selçuklu district of Konya showed that residential energy use predominated and highlighted the compensatory effect of afforestation activities [21,22]. Similarly, studies in Burdur Province demonstrated the substantial role of forest carbon sequestration in balancing overall emissions [23,24].
In contrast, the industrial city of Karabük had substantially higher fossil-fuel-based emissions, illustrating how industrial intensity can raise carbon outputs well above national averages [25,26]. Kazar [27] used an asymmetric analytical approach to show that sectoral CO2 emissions in Türkiye display heterogeneous dynamics, emphasizing the need for sector-specific mitigation policies. Collectively, these studies indicate that emission mitigation policies must be tailored to local emission structures, land-cover characteristics, and socio-economic conditions [18,28].
Despite the increasing number of regional carbon accounting studies, research has primarily focused on metropolitan or industrialized areas. Meanwhile, smaller settlements with low industrial activity and extensive forest cover remain comparatively underrepresented [29]. Addressing this gap matters because forests are a globally important terrestrial carbon sink [30,31]. Afforestation and reforestation can substantially increase ecosystem net productivity, underscoring the importance of forest age and cover in shaping regional carbon balances [32]. Additionally, smaller cities often undergo early-stage urban development, offering an opportunity to avoid carbon-intensive infrastructure lock-in through proactive planning, energy-efficiency improvements, and nature-based strategies [18].
The COVID-19 pandemic demonstrated globally how emission trajectories respond to changes in mobility patterns and energy consumption. During the first lockdown in April 2020, CO2 emissions from surface passenger transport in Europe declined by about 50%, reducing total CO2 emissions by 7.1%. However, emissions quickly rebounded as restrictions were lifted, with transport emissions eventually surpassing pre-pandemic levels in several cities [33]. This “rebound effect” highlights how sensitive urban emission dynamics are to behavioral and policy-driven changes, especially in the transport and residential energy sectors [34].
Within this context, Tunceli Province serves as an illustrative case for provincial carbon accounting, combining low population density and limited industrial activity with an extensive forest estate whose biophysical uptake capacity is large relative to provincial emissions. Ongoing development and potential expansion of built-up areas could increase emissions and disturb this balance if not carefully managed. Maintaining the province’s natural equilibrium therefore requires provincial planning approaches that connect new construction with afforestation and forest restoration practices, strengthening carbon sinks while safeguarding ecosystem services and long-term community livability [31].
Accordingly, this study aims to estimate provincial CO2 emissions in Tunceli Province using IPCC-based inventory methodologies, primarily relying on Tier 1 approaches, with sectoral disaggregation where possible. The study also seeks to identify dominant emission sectors, particularly residential heating and road transport, and to evaluate mitigation priorities along with the contribution of forest carbon sinks in supporting sustainable provincial development.
This study differs from previous provincial carbon-footprint assessments in Türkiye in three key ways. First, it integrates an inventory of selected anthropogenic CO2 sources with an indicative estimate of forest sequestration potential, enabling a cautious comparison between sources and sinks. Second, it contrasts fuel-based and activity-based estimates of road-transport emissions and quantifies the results’ sensitivity to the chosen estimation method. Third, it examines a low-population, lightly industrialized mountainous province, a settlement type prevalent in Eastern Anatolia but underrepresented in the existing literature. Consequently, the analysis identifies mitigation priorities relevant to provinces where residential coal combustion constitutes the largest category among the sources included in this assessment.

2. Materials and Methods

2.1. Study Area

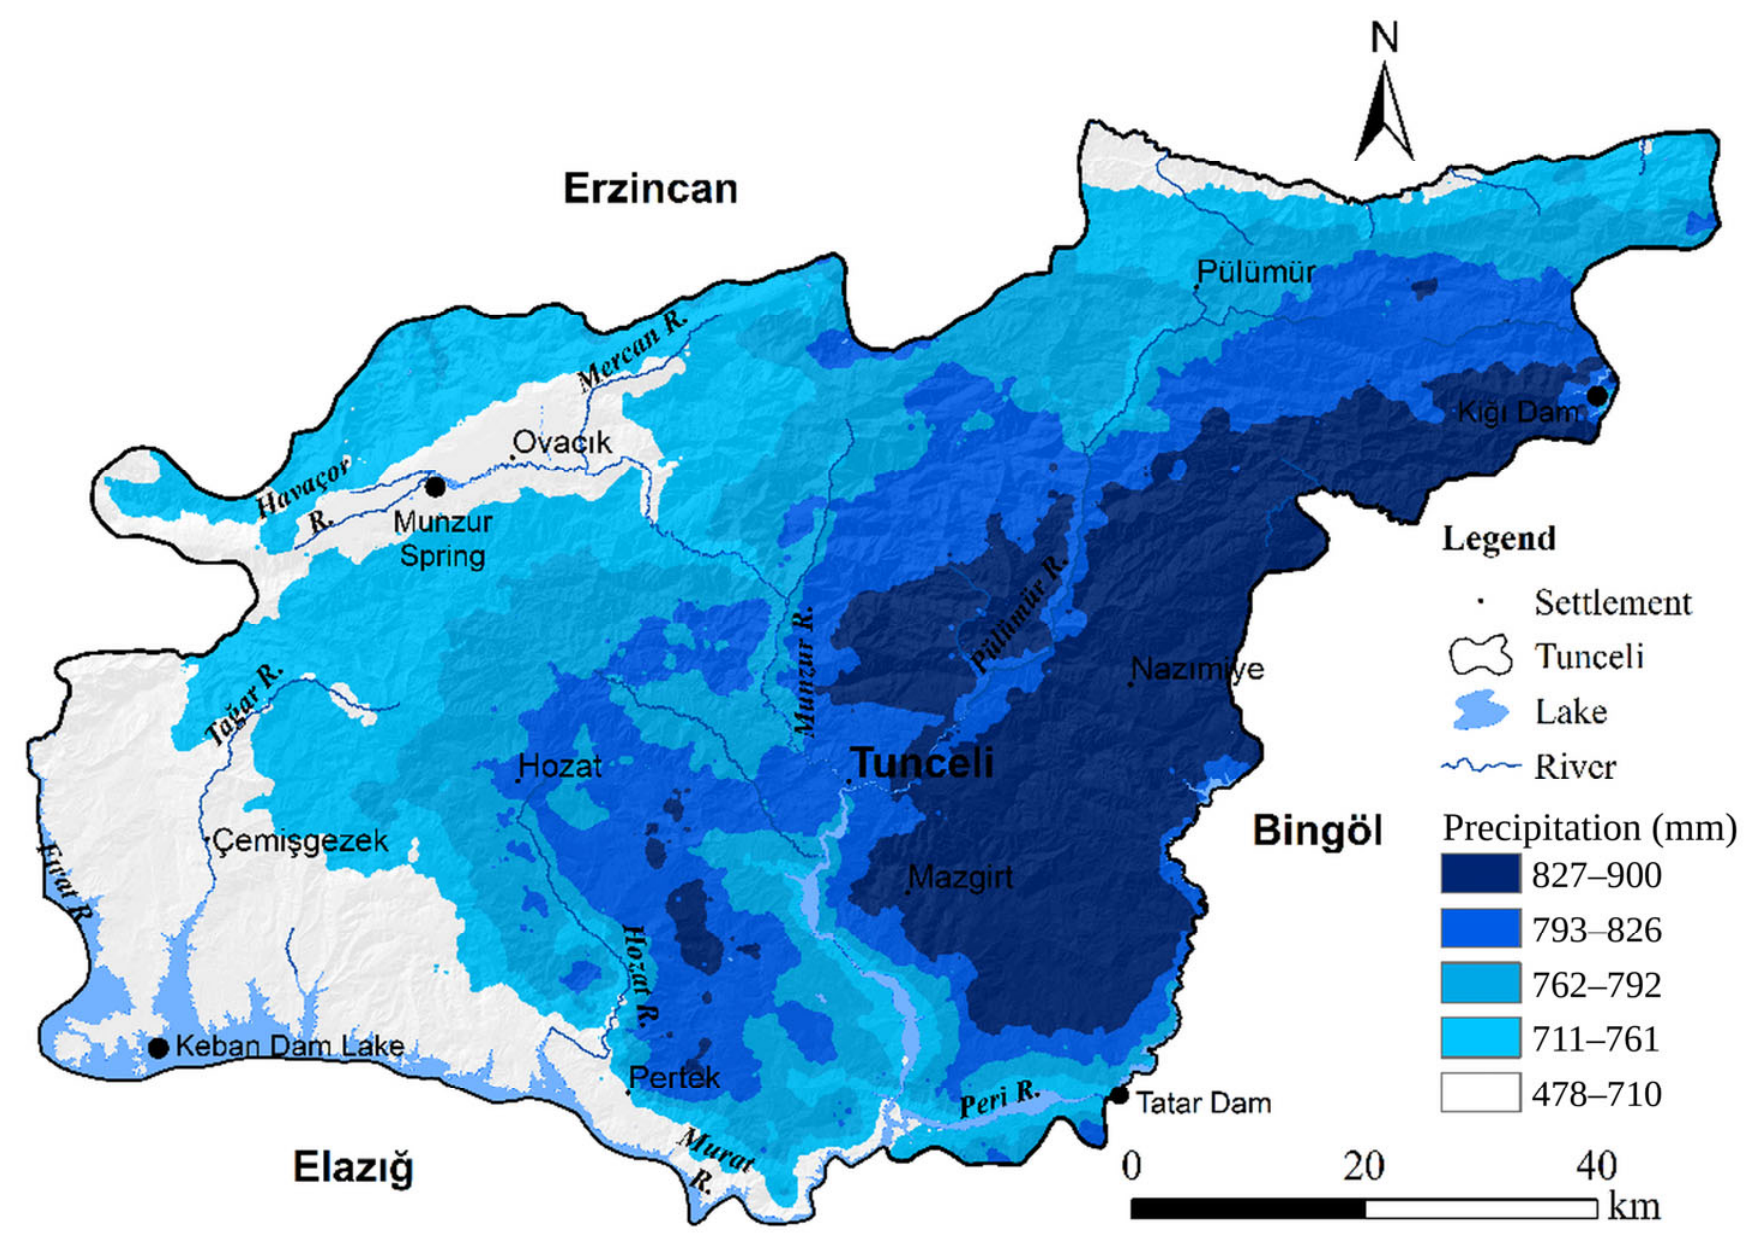
This study was conducted within the provincial boundaries of Tunceli Province, located in the Fırat Basin in the Eastern Anatolia Region of Türkiye (Figure 1). The province covers 7774 km2, approximately 1% of Türkiye’s total surface area. Figure 1 and Figure 2 were produced in ArcGIS 10.8 (Esri, Redlands, CA, USA). According to official statistics, Tunceli Province had a population of 84,366 in 2022, the reference year used for the emission inventory, and 84,179 in 2023 [35]. The 2022 population corresponds to a density of approximately 11 inhabitants km−2.
Tunceli is predominantly mountainous and rugged [36]. Elevations reach nearly 3000 m in the north, while the south descends to around 800 m above sea level. These pronounced topographic variations directly affect the local climate, settlement patterns, accessibility, and seasonal energy consumption throughout the province.

2.1.1. Climatic Characteristics and Energy-Related Setting

Tunceli Province has a continental climate with short, hot, dry summers and long, cold, relatively wet winters. Annual precipitation generally ranges from 550 to 1080 mm, with marked spatial variability, as shown in Figure 2. Precipitation is higher in the eastern and northeastern mountainous areas, while amounts are lower in the western and southwestern regions. Precipitation is mainly concentrated in winter and autumn, with a pronounced dry period in summer [37]. The annual average temperature in the provincial center is approximately 10 °C. Long-term measurements show seasonal and interannual fluctuations in temperature patterns typical of continental climatic conditions. We calculated heating degree days (HDD) for Tunceli using the daily mean air temperature data from 1991 to 2020, with a base temperature of 18 °C. We calculated the daily HDD as in Equation (1) [38]:
HDDd = max(0, Tb − Td)
where HDDd is the heating degree days on day d (°C·day), Tb is the base temperature (18 °C), and Td is the daily mean air temperature (°C) on day d. Data were obtained from the Turkish State Meteorological Service (MGM) (https://www.mgm.gov.tr/veridegerlendirme/gun-derece.aspx, accessed on 1 February 2025). We set HDD to zero on days when the daily mean temperature was 18 °C or higher. Monthly HDD values were obtained by summing daily HDD values within each calendar month, and annual HDD values were calculated by summing all daily values within each year. We derived mean monthly HDD values by averaging the monthly totals over the 1991–2020 period. We report all HDD results in degree-days (°C·day). This metric reflects climate-related space-heating demand, rather than actual energy consumption, which is also influenced by building characteristics, appliance efficiency, occupancy, and user behavior.
Tunceli Province is located within the Euphrates Basin and has substantial surface water resources, as shown in Figure 2 alongside precipitation patterns. Among these, Munzur Stream and Peri River play strategic roles in hydroelectric energy production [39].
Continental climates substantially increase residential heating fossil fuel consumption during winter, a major component of provincial CO2 emissions. Therefore, climatic characteristics and related water resource dynamics are key factors influencing the energy consumption patterns and carbon emission estimates evaluated in this study.

2.1.2. Air Quality and Emission Dynamics

Tunceli Province has limited industrial activity and no heavy industrial production. As a result, carbon emissions mainly come from residential heating and transportation. Sulfur dioxide (SO2), particulate matter (PM), nitrogen oxides (NO and NO2), and carbon monoxide (CO) serve as key indicators of local air pollution. In Tunceli, fossil-fuel combustion for residential heating and road transport is the primary source of these pollutants [6].
According to data from the National Air Quality Monitoring Network for 2022, the monthly average PM10 concentrations ranged from 28.66 to 56.59 µg/m3, while the SO2 concentrations varied from 10.85 to 39.22 µg/m3 [40]. Table 1 summarizes the monthly distribution patterns of PM10 and SO2 concentrations. PM10 concentrations were highest in April, while SO2 concentrations peaked in January.
The winter increase in SO2 is consistent with higher heating-related combustion, although it does not independently validate the annual CO2 inventory. This seasonal pattern is consistent with the Tier 1 fuel consumption-based CO2 emission estimates calculated in this study.

2.2. Energy-Based CO2 Emission Calculation

We compiled a provincial inventory of CO2 emissions for Tunceli Province for the reference year 2022 within the administrative provincial boundary. The accounting framework is hybrid rather than strictly territorial. Residential coal combustion, natural gas consumption, and road and ferry transport are direct territorial (production-based) emissions released inside the provincial boundary. In contrast, electricity-related emissions are indirect and estimated on a consumption basis by applying the national grid emission factor to provincial electricity use, because the province has no utility-scale fossil-fuel generation. The sectoral inventory in Section 3.1 identifies direct territorial emissions and electricity-related emissions separately and aggregates them only to produce a single headline indicator. Because the official national grid factor is published on a CO2-equivalent basis (Section 2.3), we report the aggregated inventory and every indicator derived from it in Gg CO2-eq yr−1. The four fuel-combustion categories are CO2-only; so, their CO2 and CO2-eq values are identical by construction. We exclude aviation and rail transport because the province has no operational commercial airport and negligible railway activity. Industrial-process emissions, agriculture, land-use emissions, municipal solid waste (Section 2.2.2), CH4 and N2O are also excluded from the scope of this study. Consequently, all reported totals are described as “emissions from the included sources” and must not be interpreted as a comprehensive provincial greenhouse-gas inventory.
Emission calculations followed IPCC methodology, primarily using the Tier 1 approach because locally specific activity data and emission factors were unavailable [14]. Tier 1 uses default emission factors, while Tier 2 and Tier 3 approaches rely on country-specific data and detailed measurement or model-based methods. In this study, we calculated CO2 emissions from fuel combustion using the Tier 1 methodology described in the 2006 Guidelines for National Greenhouse Gas Inventories. The Tier 1 approach uses aggregated fuel consumption data and applies default net calorific values (NCV) and carbon emission factors (EF; tC/TJ) recommended by the IPCC [14]. The calculation procedure was conducted in three sequential steps:
(i)
conversion of fuel consumption into energy units,
(ii)
estimation of the carbon content of the fuel,
(iii)
conversion of carbon to CO2.
In Equation (1), fuel consumption expressed in tons (t) was converted into energy consumption (TJ) using the IPCC default NCV values (TJ/kt), as in Equation (2):
E i = F C i × 10 3 × N C V i
where
  • E i   represents the energy consumption of fuel type i (TJ),
  • F C i   denotes the fuel consumption of type i (ton),
  • N C V i   is the net calorific value of fuel type i (TJ/kt).
The factor 10 3 converts tons to kilotons (kt). We obtained net calorific values from [14]. In Equation (2), the carbon content of the fuel (tC) was calculated by multiplying energy consumption by the default carbon emission factor, Equation (3):
C i = E i × E F i
where
  • C i   is the carbon content (tC or Gg C),
E F i   represents the default carbon emission factor (tC/TJ) for fuel type i. We used the IPCC default emission factors [14]. Following the IPCC Tier 1 methodology for stationary combustion, we assumed complete oxidation of the fuel carbon. The default IPCC CO2 emission factors reflect this assumption; therefore, we applied no additional oxidation factor and calculated emissions using Equation (4):
C O 2 , i = E i × E F i × 44 12
The ratio 44/12 represents the molecular weight ratio of CO2 (44) to carbon (12) [14].
Total CO2 emissions were obtained by summing the emissions from all fuel types, as shown in Equation (5):
C O 2 , total = i = 1 n C O 2 , i
This approach was preferred because it is applicable and comparable in small-scale settlements with limited data availability [14].

2.2.1. Residential Coal

Because provincial coal-delivery data were unavailable, we estimated residential coal use from dwelling statistics. The number of dwellings in Tunceli Province in 2022 (29,606) was taken from the TÜİK Address-Based Population Registration System household statistics [35], and the number of dwellings supplied with natural gas (11,310 residential subscribers of the Tunceli distribution licensee) was taken from the EPDK Natural Gas Market Development Report for 2022 [41]. The remaining 18,296 dwellings were provisionally assumed to rely on coal as their primary heating fuel. The average coal consumption was set at 2.5 t dwelling−1 yr−1, following Argun et al. [21] for Selçuklu, Konya, which lies in the same national heating-degree-day zone (Zone 3) as Tunceli. The estimated provincial coal consumption was calculated as follows:
18,296 × 2.5 = 45,740   t   y r 1
The application of an emission factor of 2.8519 t CO2 per ton of coal [19] gives an estimated 130.46 Gg CO2 yr−1. Read together with the IPCC default CO2 emission factor for other bituminous coal (94.6 t CO2 TJ−1) [14], this factor implies a net calorific value of approximately 30.1 GJ t−1, which is consistent with the imported hard coal distributed through the national household coal-aid program rather than with domestic lignite. Two systematic uncertainties attach to the dwelling-based approach, and a symmetric activity-data range does not fully capture them. First, assuming that every dwelling without a natural-gas connection burns coal is an upper bound: fuelwood and other biomass, LPG cylinders, electric heating, and—in a province with pronounced seasonal and out-migration—unoccupied or seasonally occupied dwellings all displace part of the assumed coal demand, and no provincial household energy-use survey is available to quantify their share. Second, and acting in the opposite direction, natural-gas-connected dwellings may burn coal as supplementary fuel. To reflect the expected dominance of the first effect, we set the activity-data uncertainty for residential coal at ±30% (Section 2.10), giving a combined sectoral uncertainty of ±31.6%. Because these assumptions cannot be validated against provincial coal-delivery or household-survey data, residential coal remains, by a wide margin, the most uncertain major category in the inventory, and its estimate should be read as a central value that leans toward an upper bound.

2.2.2. Municipal Solid Waste

In 2022, Tunceli Province generated approximately 27,000 tons of municipal solid waste, disposed of primarily through uncontrolled dumping. Waste disposal at unmanaged sites releases mainly methane (CH4), not fossil carbon dioxide (CO2). Because this study is restricted to CO2, and no data are available on waste composition, degradable organic carbon content, oxidation conditions, or methane-recovery characteristics, the waste sector is excluded in full from the quantitative inventory: no waste-sector value enters the sectoral inventory (Section 3.1), the reported totals, the per-capita indicator, or the scenario analysis. Future comprehensive greenhouse-gas inventories should estimate CH4 emissions from solid-waste disposal using the IPCC First-Order Decay method and report them on a CO2-equivalent basis.

2.3. Electricity Consumption-Based CO2-eq Emissions

We obtained 2022 electricity consumption data from the EPDK Electricity Market Development Report [42], which reports provincial consumption by consumer category. Because the province has no utility-scale fossil-fuel generation, electricity-related emissions are indirect and were calculated by multiplying the provincial consumption by the national grid emission factor of 0.478 kg CO2-eq kWh−1 (0.478 t CO2-eq MWh−1) published for 2022 by the Ministry of Energy and Natural Resources [43], Equation (6):
131,703 MWh × 0.478 t CO2-eq MWh−1 = 62,954 t CO2-eq
Because the official grid factor is published on a CO2-equivalent basis, this quantity is not a CO2-only estimate and is not directly comparable with the CO2-only fuel-combustion categories. Two options were available: apply an assumed CO2-only share of the grid factor or redefine the accounting framework and report the aggregate on a CO2-equivalent basis. No official CO2-only grid factor is published for Türkiye for 2022 at either the national or the provincial level, and any assumed split would be unsourced; the second option was therefore adopted. The inventory total and every derived indicator—per-capita emissions, sectoral shares, and the coal-reduction scenarios—are consequently expressed in Gg CO2-eq yr−1, with electricity as the only CO2-eq component and the four fuel-combustion categories being CO2-only by construction. The sectoral inventory (Section 3.1) identifies each category accordingly; so, the two accounting bases remain distinguishable throughout.

2.4. Natural Gas-Based CO2 Emissions

According to the EPDK Natural Gas Market Development Report for 2022 [41], total natural gas consumption in Tunceli Province reached 16,595,024 Sm3. We calculated emissions using the IPCC Tier 1 methodology with default net calorific values and carbon emission factors [14]. The natural gas volume was first converted to mass using a density value of 0.798 kg m−3, where the factor 10−6 converts kilograms to kilotons (Equation (7)):
16,595,024 × 0.798 × 10 6 = 13.24   kt
The total energy content was then calculated as
13.24 × 48 = 635.66   TJ
The carbon content was determined by applying the IPCC default carbon emission factor (Equation (2)):
635.66 × 15.3 = 9725.5   t   C
Finally, carbon emissions were converted into CO2 using the molecular weight ratio (44/12):
9.73   Gg   C × 44 12 = 35.66   Gg   CO 2

2.5. Calculation of Road-Transport CO2 Emissions

Road-transport emissions were estimated using two distinct approaches. The first is a fuel-based Tier 1 estimate derived from provincial road-fuel sales: gasoline and diesel quantities were taken from the EPDK Petroleum Market Development Report for 2022 [44] and autogas quantities from the EPDK LPG Market Development Report for 2022 [45], giving 1786 t gasoline, 14,505 t diesel, and 2261 t LPG for the reference year. The second is an activity-based bottom-up estimate combining the number of registered vehicles, assumed annual distance traveled, fuel economy, and fuel type. Following IPCC guidance for road-transport CO2, the fuel-based estimate is the primary estimate used in the inventory (Section 3.1), and the activity-based estimate is reported throughout as a sensitivity analysis; the two are never combined. Vehicle-registration data were sourced from the TÜİK Road Motor Vehicle Statistics [46], while category-specific fuel-consumption values were transferred from a Turkish provincial road-transport inventory [47]. The total annual fuel consumption for vehicle category i was calculated using Equation (8):
FCi = Ni × Di × fi/100
where F C i is the total annual fuel consumption of vehicle category i (L yr−1), N i is the number of registered vehicles in category i , D i is the annual distance travelled (km vehicle−1 yr−1), and f i is the average fuel consumption (L 100 km−1). Because fuel consumption was initially expressed in liters, it was converted to fuel mass using Equation (9):
M i = F C i × ρ i
where M i is the fuel mass (kg yr−1), and ρ i is the fuel density (kg L−1). The obtained mass value was converted into gigagrams (Gg) and multiplied by the IPCC default net calorific value (NCV) [14] to calculate energy consumption, Equation (10):
E i = M i × 10 6 × N C V i
where EiNCVi represents energy consumption (TJ) and is the net calorific value (TJ Gg−1). The CO2 emissions were subsequently calculated using the IPCC 2006 default factors, which assume complete oxidation; therefore, no additional oxidation factor was applied. Emissions were obtained with Equation (4) of Section 2.2, applied to each vehicle category.
Total transport-sector emissions were then obtained by summing emissions across all vehicle categories, as in Equation (5).
The vehicle-based estimate is best described as an activity-based bottom-up approach rather than an IPCC tier: according to the IPCC guidelines [14] (Vol. 2, Ch. 3), the higher-tier methods for road-transport CO2 remain fuel-based, with vehicle-kilometer data recommended primarily for validation and for CH4 and N2O. For this reason, we adopt the fuel-based estimate as the principal transport figure and present the bottom-up estimate as a complementary sensitivity check. Vehicle counts are the full registered fleet from the TÜİK Road Motor Vehicle Statistics [46]. The fuel-type split of passenger cars follows the national fleet shares published in the same dataset (26.8% gasoline, 36.9% diesel, 35.1% LPG) [46], as province-level fuel-type data are not released; these three shares sum to 98.8%, and the remaining 1.2% of the national fleet (hybrid, electric and unspecified fuel types) was excluded rather than redistributed, so that 3937 of the 3985 passenger cars registered in 2022 are assigned a fuel type. We transfer category fuel-consumption rates (L 100 km−1) from a provincial inventory for Çanakkale [47], which adapted IPCC guideline values to the Turkish fleet. Annual mileages are the national average vehicle-kilometer indicators published by TÜİK from periodic-inspection (TÜVTÜRK) odometer records [48] and are available for 2020–2021; therefore, we applied the 2021 values to the 2022 fleet. The registered fleet is assumed to operate within the provincial boundary; through-traffic, out-of-province trips, and inactive vehicles are not resolved (Section 3.10). Table 2 lists all inputs to the activity-based calculation, their sources, and their spatial scope.
Sources and scope: vehicle numbers—registered fleet at 31 December 2022, TÜİK Road Motor Vehicle Statistics, provincial [46]; passenger-car fuel-type split—national fleet shares for 2022 (26.8% gasoline, 36.9% diesel, 35.1% LPG), TÜİK [46]; annual distance—national average distance traveled per vehicle category in 2021, TÜİK statistics compiled from TÜVTÜRK odometer records [48]; fuel-consumption rates—transferred from a Turkish provincial road-transport inventory (Çanakkale) [47], which adapted IPCC guideline values to the national fleet; fuel densities—assumed representative values for automotive gasoline, diesel and LPG, not measured provincially; NCV and EF—IPCC 2006 default values, international [14]. The fuel-based (Tier 1) estimate uses the same NCV and EF values, along with the provincial fuel sales in Section 2.
Multi-year series (2018–2022). For the trend analysis in Section 3.6 and Section 3.8, we extended both road-transport estimates to 2018–2021 using the same procedure as for 2022. The fuel-based series uses the annual provincial gasoline, diesel and LPG sales reported by EPDK in the Petroleum and LPG Market Development Reports of each year [44,45]: gasoline 1167/1204/1350/1706/1786 t, diesel 14,688/13,513/13,190/13,245/14,505 t and LPG 2782/2950/2696/2550/2261 t for 2018, 2019, 2020, 2021 and 2022, respectively. The activity-based series uses the registered fleet of each year from the TÜİK Road Motor Vehicle Statistics [46] (passenger cars 3447/3538/3726/3938/3985; minibuses 655/610/574/557/538; buses 89/97/100/112/107; vans 1800/1801/1849/1927/1991; trucks 459/446/446/456/448; motorcycles 546/565/593/628/745), the national passenger-car fuel-type shares of 2022 applied to every year, the 2021 national average distances of Table 2 held constant for all five years because TÜVTÜRK-based mileage statistics exist only for 2020 and 2021, and constant fuel-consumption rates, densities and emission factors. The activity-based series therefore varies only with the size and composition of the registered fleet and cannot, by construction, reflect year-to-year changes in vehicle use; Section 3.8 accounts for this limitation when interpreting the two series.

2.6. Ferry Transport-Related CO2 Emissions

Ferry operations in Tunceli Province represent a minor but distinct source of transport-related emissions. Because no metered records are kept, we collected operational data directly from the ferry operators serving the Pertek crossing through face-to-face interviews conducted in May 2024. The 2022 estimate assumes that the operating conditions reported in May 2024 are representative of the 2022 reference year; this temporal transfer is included in the assigned activity-data uncertainty. Three ferries operate at the Pertek terminal; individual daily consumption was reported as about 400 L, and, accounting for variation in sailing frequency with demand, a combined average of 1000 L of diesel per operating day was assumed. Assuming year-round operation (365 days), the annual consumption is 365,000 L, which at a diesel density of 0.835 kg L−1 corresponds to 304.8 t of fuel. Applying an emission factor of 3.2 t CO2 per ton of fuel gives annual ferry emissions of 0.98 Gg CO2 yr−1. Because the operating-day count and daily fuel use are operator-reported rather than metered, this category is assigned an uncertainty of ±35% (Section 2.10). Because Tunceli lacks an operational commercial airport and has negligible railway activity, the analysis excluded aviation and railway emissions.

2.7. Per Capita Emission Calculation

To evaluate provincial per-capita emissions, annual per capita emissions were calculated by dividing the compiled annual provincial total by the total population for the corresponding year, Equation (11):
C E p e r   c a p i t a = C O 2 , t o t a l P o p u l a t i o n
where
CO2, total is the compiled total annual emission from the included sources (t CO2-eq yr−1), and CE_per capita is expressed in t CO2-eq cap−1 yr−1. Population denotes the total population of the respective year (inhabitants). Because electricity is reported on a CO2-equivalent basis (Section 2.3), the per capita indicator is likewise a CO2-equivalent quantity and is not a CO2-only figure. This indicator enables assessment of provincial per-capita emissions and comparison across provinces and with national averages, provided the accounting boundary and gas coverage of the compared studies are equivalent [6].

2.8. Estimation of Forest-Based Carbon Sequestration Potential

To put the provincial emission estimate in context, we treated forest areas as natural carbon sinks. We estimated forests’ annual sequestration potential using an area-based uptake coefficient from the literature [26]. We obtained total forest area data from official institutional records [49]. The potential was calculated as in Equation (12):
C O 2 , s i n k = A f o r e s t × C F
where
  • A f o r e s t denotes the productive (closed canopy) forest area (ha),
  • C O 2 , s i n k is the indicative annual CO2 sequestration potential (t CO2 yr−1).
CF is the annual CO2 uptake coefficient (t CO2 ha−1 yr−1). A range of approximately 2–5 t CO2 ha−1 yr−1 is implied by [26]; both bounds are carried through the analysis. The coefficient represents gross CO2 uptake by photosynthesis allocated to living tree biomass (above- and below-ground woody growth); it is not a net ecosystem carbon-stock change.
The sequestration estimate covers only the productive closed-canopy forest area of 137,718 ha (canopy cover 11–100%); the remaining 154,819 ha of open-canopy (degraded) forest within the 292,537 ha total were excluded as unproductive. The uptake coefficient comes from the literature statement that a mature tree absorbs approximately 12 kg CO2 yr−1 and that removing 1000 t CO2 yr−1 requires roughly 200–500 ha of forest [26]. This corresponds to a coefficient range of about 2 t CO2 ha−1 yr−1 (1000 t per 500 ha) to 5 t CO2 ha−1 yr−1 (1000 t per 200 ha). Applying the full range to the productive area gives 275.44–688.59 Gg CO2 yr−1; the upper bound alone gives the maximum potential of 688.59 Gg CO2 yr−1. We report both bounds, but we do not adopt the upper bound as the central estimate. The coefficient represents the gross CO2 uptake by living tree biomass only: soil, litter, deadwood and harvested wood products are not represented, and losses from mortality, harvesting, fire and land-use change are not deducted.
Applying a single spatially uniform coefficient to 137,718 ha also does not resolve the variation in forest type, stand age, canopy density, site productivity, degradation or disturbance history. The province’s forests in the Eastern Anatolian forest belt consist predominantly of stunted oak communities, with juniper stands on southern slopes below 1800 m [49], and such stands are unlikely to sustain the upper-bound coefficient across the whole productive area. Reference [26] states this rule of thumb for forests in general, in the context of an industrial province in northern Türkiye and not for the Eastern Anatolian oak–juniper stands considered here; no stand-level growth or carbon-stock measurements are available for Tunceli against which the coefficients could be checked. The local applicability of the range therefore cannot be established, and the resulting figures are an illustrative scenario conditional on the assumed coefficients. The 2–5 t CO2 ha−1 yr−1 range is thus an illustrative scenario for gross uptake, not a measured forest sink or net provincial carbon balance, since province-specific annual carbon-stock-change data are not available. We do not treat it as a measured or currently operating forest sink. We compare it with the emission inventory as an independent quantity: we do not subtract the two, and this study computes no net provincial carbon balance.

2.9. Residential Coal-Reduction Scenarios

We evaluated three reduction scenarios (25%, 50%, and 75% reductions in residential coal use) against the 2022 baseline of 288.47 Gg CO2-eq yr−1. These are simplified, ceteris paribus sensitivity analyses: emissions from all other sectors are held constant, and the gross scenario results (Section 3.9) model no emissions from substitute energy carriers; so, they represent gross avoided emissions rather than net system-wide reductions. The illustrative natural-gas substitution column was derived as follows. The residential coal emission factor is 2.8519 t CO2 per ton of coal (Section 2.2.1), equivalent to 94.6 t CO2 TJ−1 of fuel energy at the implied net calorific value of 30.1 GJ t−1; the IPCC default CO2 emission factor for natural gas is 56.1 t CO2 TJ−1 (15.3 t C TJ−1 × 44/12) [14]. In the comparative scenario analysis, we set seasonal appliance efficiencies at 65% for existing coal-fired heating appliances and 92% for modern condensing natural-gas boilers. The coal efficiency value reflects an intermediate scenario within the broad performance range of household coal appliances, while efficiencies above 90% are typical of modern condensing gas boilers [50,51]. On a delivered heat basis, the substitution ratio is therefore (56.1/0.92)/(94.6/0.65) = 60.98/145.54 = 0.419; so, approximately 42% of the avoided coal emissions are reintroduced by the substitute fuel, and about 58% of the gross saving is retained. Electrification with heat pumps supplied by low-carbon electricity or efficient district-energy systems would retain a larger share (Section 3.9).

2.10. Uncertainty Assessment

The Tier 1 methodology used in this study relies on default emission factors and aggregated fuel consumption data, which inherently introduces some uncertainty. According to IPCC guidelines, uncertainties in CO2 emission estimates mainly stem from three sources: (i) activity data (fuel consumption quantities), (ii) net calorific values (NCV), and (iii) emission factors (EF) [14]. In the Tier 1 approach, the IPCC uses default emission factors instead of country-specific values. This can cause deviations in emission estimates because of differences in fuel quality, carbon content, combustion technologies, and local operating conditions [14].
Uncertainty was quantified using the error-propagation approach of the IPCC guidelines [14] (Vol. 1, Ch. 3). For each sector, uncertainties were assigned separately to activity data (U_AD) and emission factors (U_EF) and combined in quadrature. The assigned values and their basis are as follows. Residential coal: U_AD = ±30%, because provincial consumption is inferred from dwelling counts and a per-dwelling consumption rate transferred from another province rather than measured (Section 2.2.1), and U_EF = ±10%, covering the spread in carbon content and net calorific value between imported hard coal and domestic lignite; combined ±31.6%. Electricity: U_AD = ±3%, because provincial consumption is metered and reported by the regulator, and U_EF = ±5%, the interannual variation in the published national grid factor; combined ±5.8%. Transport: U_AD = ±10% for road transport, because provincial fuel sales are metered at the point of sale but need not coincide with the point of combustion owing to through-traffic and refueling by non-residents, and U_EF = ±5%, the IPCC default range for liquid-fuel CO2 emission factors; ferry transport, which is operator-reported rather than metered, is assigned ±35% overall, and the two are combined by weight to give ±11.0% for the sector. Natural gas: U_AD = ±3% and U_EF = ±3%, reflecting metered billing volumes and the narrow compositional range of pipeline gas; combined ±4.2%. The basis of these values differs and should be distinguished. The ranges for natural gas (activity data and emission factor), for road-transport fuel sales and the liquid-fuel emission factor, and for metered electricity consumption follow the default ranges given by the IPCC guidelines [14] (Vol. 1, Ch. 3; Vol. 2, Ch. 2 and Ch. 3) for national inventories and are therefore literature-supported; the authors derive the ±5% grid-factor range from the interannual variation of the published national factor. The residential-coal ranges (U_AD = ±30%, U_EF = ±10%) and the ±35% ferry range are assumptions adopted by the authors based on expert judgment, because no provincial coal-delivery, household-survey, or ferry-fuel records exist against which they could be calibrated. In particular, the ±30% coal activity-data range is an assumed symmetric bound on the dwelling-based estimate; it does not necessarily capture the systematic uncertainty of the household-heating assumptions described in Section 2.2.1 (that every dwelling without a natural-gas connection burns 2.5 t of coal per year), which may bias the estimate in one direction rather than scatter it symmetrically. For each sector, the two components were combined as in Equation (13):
U i =   U A D , i 2 +   U E F , i 2
The combined sectoral uncertainties were subsequently propagated to the total inventory as in Equation (14):
U t o t a l =   i = 1 n U i · E i 2 i = 1 n E i  
where Ui is expressed as a percentage, category uncertainties are assumed independent, and Ei is its emission estimate (Gg CO2-eq yr−1). This yields ±14.5% for the inventory total (288.47 ± 41.93 Gg CO2-eq yr−1; range 246.5–330.4). Because the sectoral inputs combine IPCC default ranges with author-assigned assumptions, the ranges reported here are illustrative uncertainty bounds from error propagation, not statistical confidence intervals from sampled data. We treat the forest sequestration estimate separately and do not propagate it into the emission total because it is a potential, not an observed, flux. Independently of that range, the full published coefficient range of approximately 2–5 t CO2 ha−1 yr−1 is carried through the analysis as a sensitivity test (Section 2.8 and Section 3.7); it spans 275.44–688.59 Gg CO2 yr−1 and therefore brackets the compiled emission total; so, no claim is made about the sign of any emissions–uptake comparison. All calculations were performed in a spreadsheet (Microsoft Excel, Office Home 2024, version 2608; Microsoft Corporation, Redmond, WA, USA) and were independently re-checked.

3. Results and Discussion

3.1. Climatic Heating Demand

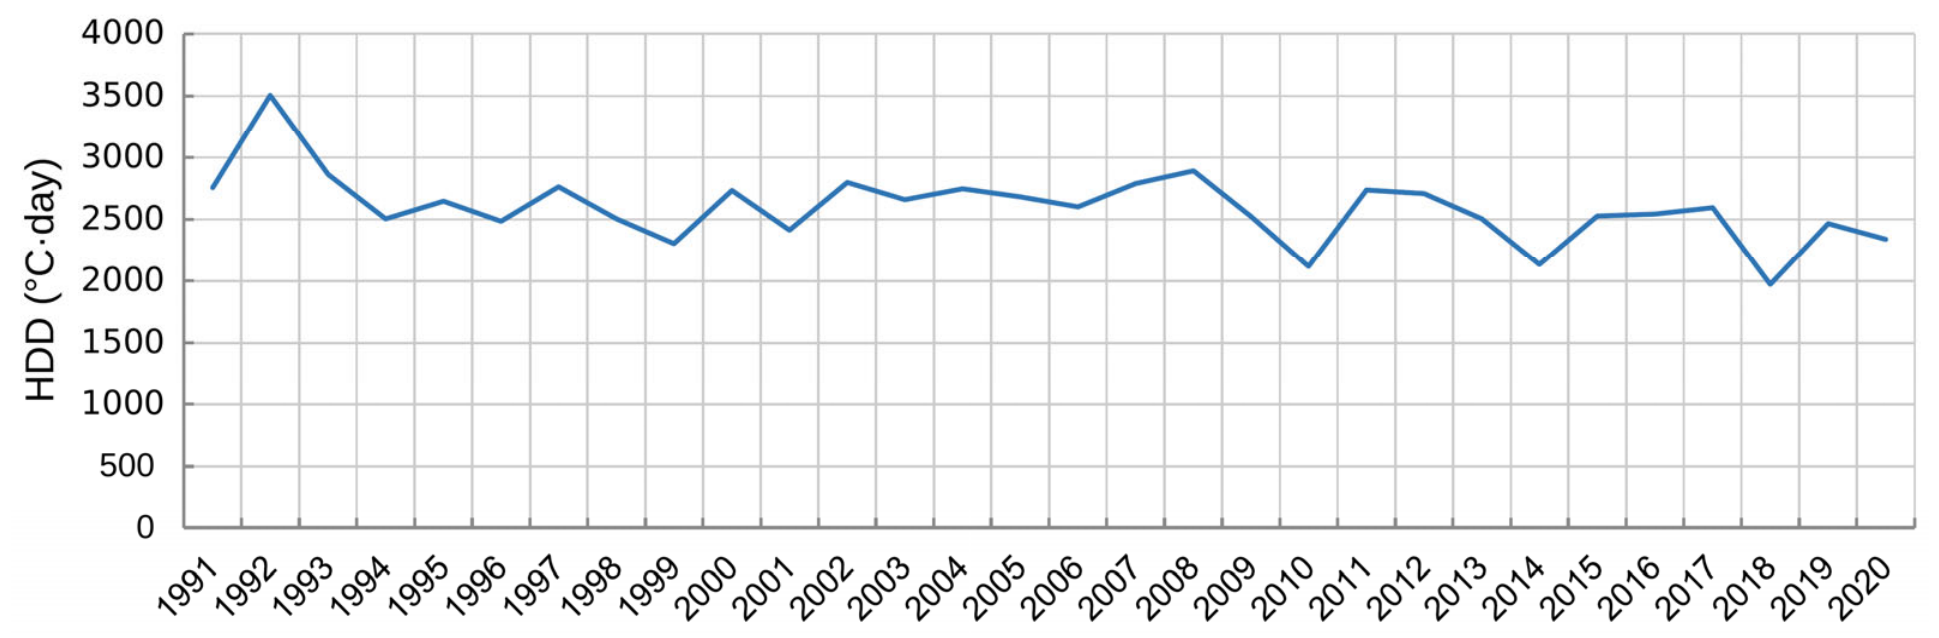
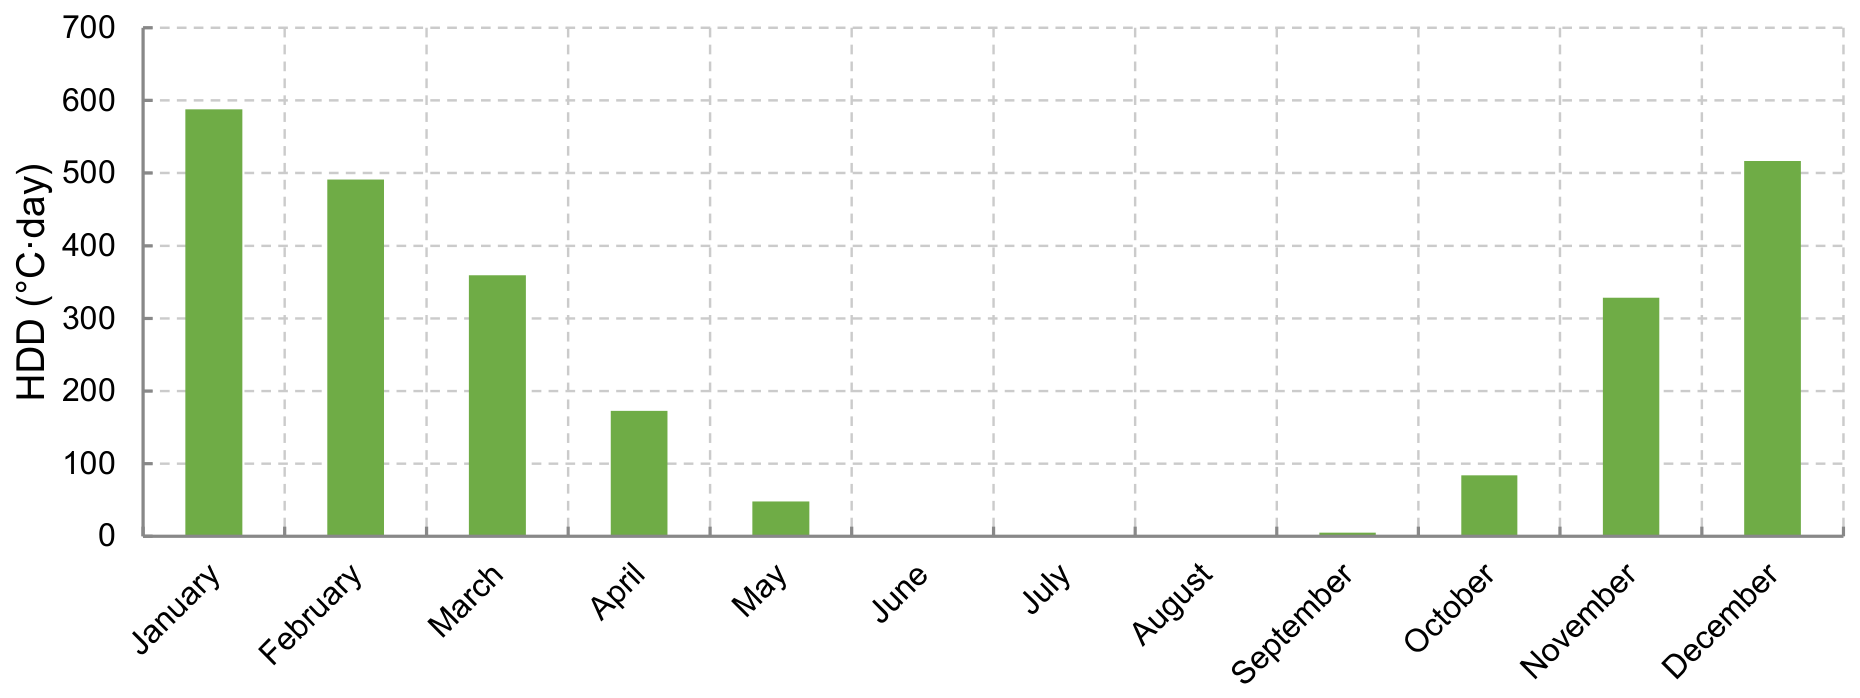
Analysis of annual (Figure 3) and monthly (Figure 4) heating degree day (HDD) patterns provides complementary evidence regarding Tunceli’s heating requirements. Annual HDD values ranged from approximately 1950 to 3500 °C·day between 1991 and 2020, demonstrating considerable interannual variability in winter severity.
The monthly distribution shows that heating demand is strongly seasonal, with HDD values peaking in January, December, and February and minimal heating requirements from June to September. Consequently, differences in the annual HDD primarily reflect variations in the intensity and duration of cold conditions during the November to March heating season. These long-term HDD patterns provide climatic context for residential heating demand. However, because the HDD series ends in 2020, it cannot directly explain fuel consumption during the 2022 inventory year.

3.2. Carbon Emission Profile of Tunceli Province

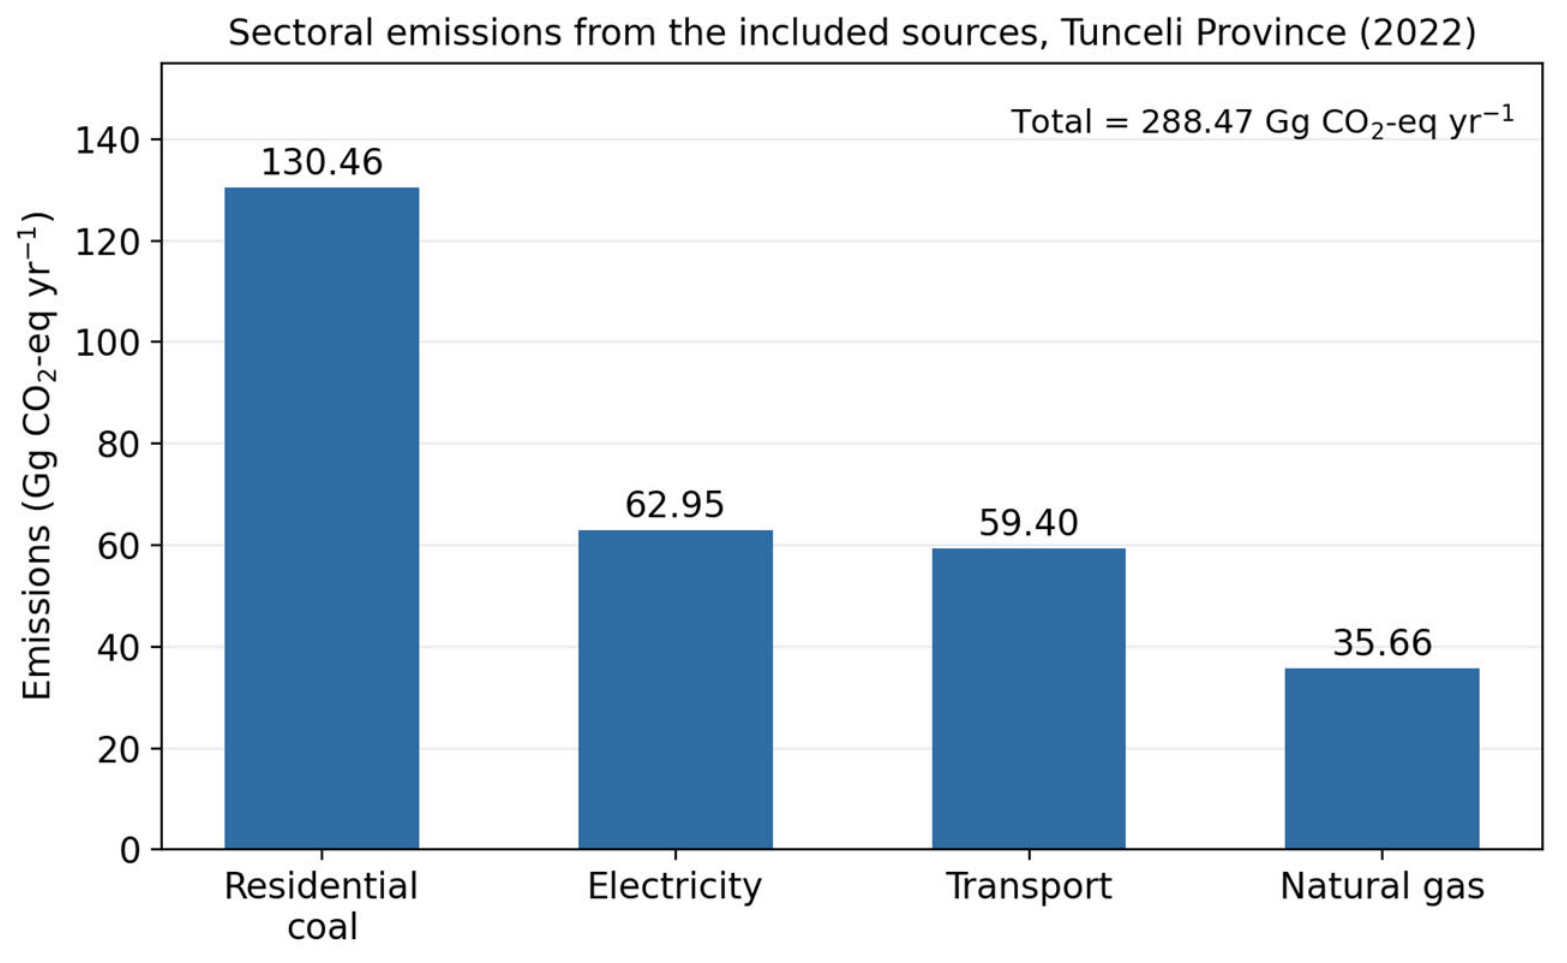
We estimated emissions from the included sources in Tunceli Province for 2022 using the IPCC Tier 1 methodology [14], with an activity-based (bottom-up) reconstruction of the transport sector reported separately as a sensitivity analysis. The compiled annual total is 288.47 Gg CO2-eq yr−1. With a 2022 population of 84,366 [35], per capita emissions are approximately 3.42 t CO2-eq cap−1 yr−1 [25]. This is a partial per-capita indicator for the included sources and should not be compared with comprehensive inventories unless their source, gases, and accounting boundaries are harmonized. As summarized in Table 3 and shown in Figure 5, residential coal for heating is the largest category at 130.46 Gg CO2 yr−1 (45.2% of the total), followed by electricity consumption at 62.95 Gg CO2-eq yr−1 (21.8%), transport at 59.40 Gg CO2 yr−1 (20.6%; 58.42 from road transport and 0.98 from ferry operations) and natural gas at 35.66 Gg CO2 yr−1 (12.4%).
The activity-based bottom-up road estimate of 45.28 Gg CO2 yr−1 is a sensitivity analysis and does not enter the inventory total. Municipal solid waste is excluded in full (Section 2.2.2) and contributes no value to any row of this table.
Residential coal contributes about 97% of the variance of that total; so, the precision of the inventory is governed almost entirely by the household-heating assumption described in Section 2.2.1. The range reflects the combined uncertainty in activity data and emission factors, propagated as in the IPCC guidance for Tier 1 inventories [14]; it is an illustrative uncertainty bound rather than a confidence interval, and because the ±30% coal activity-data range is an author-assigned assumption, it does not necessarily capture the systematic uncertainty of the household-heating assumptions (Section 2.2.1 and Section 2.10). Although this study does not use Monte Carlo simulation or higher-tier methods, the reported range provides a clear basis for interpreting the results and comparing them with other provincial-scale studies [14].
To reduce uncertainty in future assessments, the following measures are recommended: (i) development of fuel-specific local emission factors, (ii) direct measurement of provincial coal deliveries and household heating fuel use, and (iii) reconciliation of the fuel-sales and vehicle-activity transport estimates with observed provincial vehicle activity, followed by transition to higher-tier methodologies where data permit. Within the stated uncertainty range, the emission values presented here provide a defined reference for comparative analysis and policy development.
The provincial results can be contextualized with comparable Turkish studies. In Burdur, a province of similar scale, total emissions were estimated at 1098 kt CO2 yr−1 against a forest and vegetation uptake of roughly 559 kt CO2 yr−1, leaving the province a net emitter of approximately 538 kt CO2 yr−1 [23]; Tunceli, by contrast, combines a much smaller emission base (288 Gg CO2-eq yr−1) with an indicative sequestration potential of comparable or larger magnitude, reflecting its low industrialization and exceptionally high forest share. That comparison is indicative only, because the Burdur study reports an uptake estimate rather than the coefficient range adopted here. In the industrial province of Karabük, fossil-fuel emissions of 2.3–2.8 Mt CO2 yr−1 were reported, with per capita values several times the national average [26], illustrating how industrial intensity dominates provincial budgets. In Diyarbakır, road transport was identified as the leading source [19]. In Tunceli, by contrast, residential coal (45.2%) outweighs transport (20.6%), a pattern attributable to the colder continental climate and the absence of large-scale industry. Because the source coverage, gases, and accounting boundaries vary across the cited studies, direct ranking of per-capita estimates is not appropriate. However, the sectoral comparison shows that heating is more important in Tunceli than in highly industrialized provinces.
Within the categories included in this assessment, residential heating and transport contributed the largest direct emissions. Industrial electricity use was limited, but industrial-process emissions were not quantified. Similar patterns have been reported in provincial-scale carbon footprint assessments conducted in Türkiye [16,19].

3.3. Electricity Use and Related CO2-eq Emissions by Consumer Category

The total electricity consumption in Tunceli Province in 2022 was 131,703 MWh [42]; commercial activities account for the largest share of demand, followed by residential consumption. Applying the grid factor of Section 2.3 (Equation (6)) gives electricity-related emissions of 62.95 Gg CO2-eq for 2022. Table 4 presents the electricity consumption and associated emissions by consumer category.
As shown in Table 4, the commercial sector accounts for nearly half (49.2%) of electricity-related emissions, reflecting the province’s service-oriented structure. Residential consumption represents 34.5% of total electricity-based emissions, while industrial and agricultural uses remain comparatively limited. Based on the 2022 population [35], per capita electricity-related emissions were calculated as 0.75 t CO2-eq cap−1 yr−1. Enhancing energy efficiency and implementing demand-side management strategies may reduce electricity-related emissions at the provincial level.

3.4. Natural Gas Consumption and Related CO2 Emissions, 2021–2022

Applying the procedure of Section 2.4 to the 2022 consumption of 16,595,024 Sm3 [41] gives natural gas-based emissions of 35.66 Gg CO2 (Table 5). For comparison, 2021 natural gas consumption resulted in 24.83 Gg CO2, indicating a marked increase in absolute emissions driven by rising consumption.
Table 5 indicates that natural-gas consumption and associated CO2 emissions increased by 43.6% between 2021 and 2022. This increase has likely resulted from higher heating demand, expansion of the distribution network, increased household connections, or a combination of these factors. However, the available data do not permit separating their individual contributions. Although natural gas has a lower carbon intensity than coal, rising consumption can substantially increase total emissions at the provincial scale.
Despite its lower carbon intensity than coal, natural gas accounted for about 12.4% of the compiled provincial total in 2022. The observed increase shows that even relatively low-carbon fossil fuels can contribute substantially to emission growth when consumption expands rapidly [14]. Therefore, while natural gas may serve as a transitional fuel in decarbonization pathways, demand-side management and building-efficiency improvements remain critical for limiting absolute emission increases at the provincial scale.

3.5. Road Transport Emissions: Comparison of Tier 1 and Activity-Based (Bottom-Up) Estimates

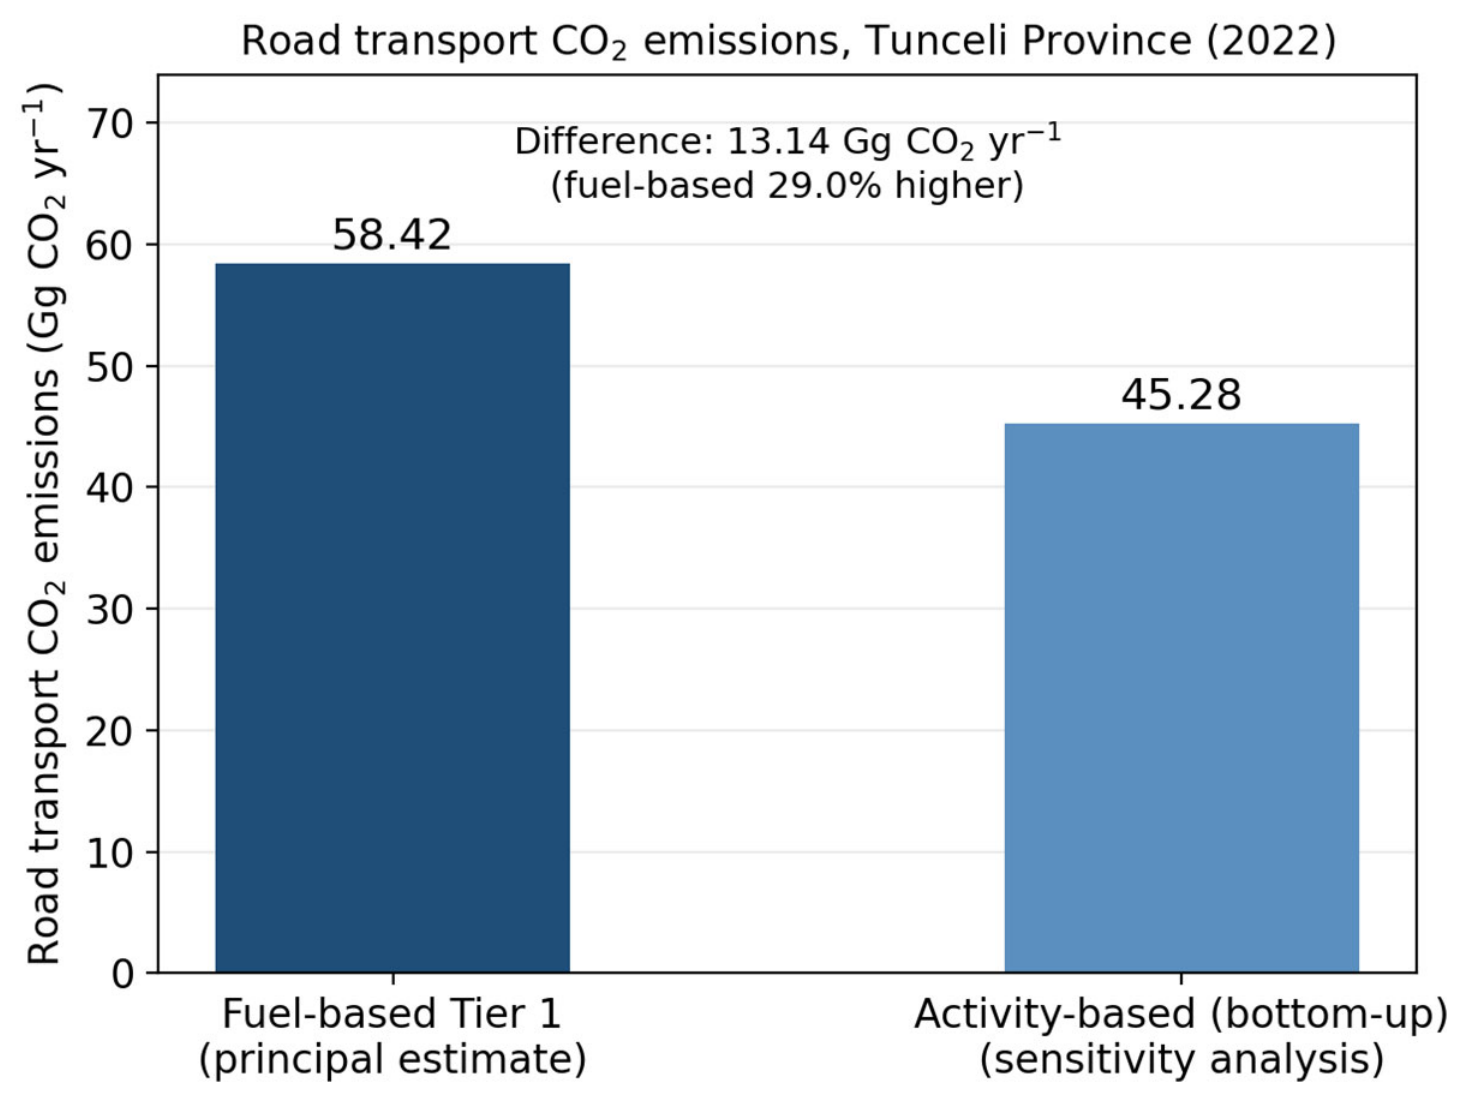
The fuel-based Tier 1 method yielded an estimated 58.42 Gg CO2 yr−1, while the activity-based bottom-up method yielded 45.28 Gg CO2 yr−1. The bottom-up estimate is therefore 22.5% lower than the fuel-based value; equivalently, the fuel-based value is 29.0% higher. The discrepancy arises from uncertainties in annual vehicle-kilometers, vehicle fuel economy, fleet activity, and the spatial allocation of fuel sales. Following the IPCC guidance for road-transport CO2 accounting [14], we use the fuel-based estimate as the single principal transport estimate throughout this study: it is the value entered in Table 3 and Figure 5 and the value underlying the per-capita indicator and the scenario baseline. The activity-based estimate is used only for sensitivity and fleet-composition analysis (Table 6 and Figure 6; see also Section 3.8) and is never added to the inventory total. A comparable divergence between fuel-based and vehicle-activity-based road inventories has been reported for Türkiye at the national scale [52].
As shown in Figure 6, the fuel-based Tier 1 estimate is 29.0% higher than the activity-based (bottom-up) result. This difference shows how sensitive transport emission estimates are to activity assumptions. The Tier 1 approach uses aggregated fuel-sales data, whereas the activity-based approach uses vehicle category, fuel type, and annual mileage, producing a more disaggregated but more assumption-dependent picture.
The observed difference indicates that fuel-based aggregation produces a higher estimate than the registered-fleet reconstruction under the adopted assumptions, consistent with provincial fuel sales capturing through-traffic and refueling by non-residents that a registered-fleet reconstruction cannot represent [19]. Using the principal fuel-based estimate, road transport accounted for 20.3% of the compiled provincial total in 2022, and road and ferry transport together for 20.6%, making transport the third largest category after residential coal and electricity; under the activity-based sensitivity estimate, the road share of the same total would instead be 15.7%. As shown in Table 6, which reports the activity-based sensitivity results, diesel-powered heavy-duty trucks are the largest contributors within that reconstruction (36.7%), followed by light commercial vehicles (21.9%). Passenger cars collectively account for about 21.6%, while motorcycles contribute less than 1%. This distribution highlights the role of freight-related mobility in shaping the provincial transport emission structure.
These findings show that even in low-population provinces, transport emissions are structurally shaped by freight-oriented diesel activity rather than private passenger mobility, highlighting the importance of freight-focused mitigation strategies. Ferry operations at the Pertek crossing add 0.98 Gg CO2 yr−1 (Section 2.6), or 0.3% of the compiled total, and are assigned an uncertainty of ±35% in Table 3; they do not materially affect the inventory.

3.6. Vehicle Fleet Structure and Emission Composition (2018–2022)

The number of registered vehicles increased from 6996 in 2018 to 7814 in 2022, representing growth of approximately 11.7%. Throughout the study period, passenger cars constituted the largest category, followed by vans. As shown in Figure 7, passenger cars consistently make up the largest share of the vehicle fleet during the study period. Vans (light commercial vehicles) are the second-largest category, while heavy-duty trucks and buses represent a much smaller share of total registered vehicles. However, the emission composition displays a distinctly different pattern (Table 6).
This discrepancy highlights the structural importance of heavy-duty diesel vehicles in provincial emission inventories. Although passenger cars are more numerous, freight vehicles have substantially higher emission intensity per vehicle because of higher fuel consumption and longer operating distances. Because annual mileage and fuel-consumption rates were held constant, the activity-based series reflects changes in registered fleet size and composition rather than observed changes in vehicle use. These findings suggest that emission mitigation strategies in small-scale provinces should prioritize improving heavy-duty diesel engine efficiency, electrifying light-duty vehicles, and shifting freight transport modes [9,19]. Fleet structure is shown by vehicle category (Figure 7), while emission composition is broken down by fuel type using the activity-based (bottom-up) methodology (Table 6). This distinction reflects the activity-based approach of emission calculations.

3.7. Indicative Forest Sequestration Potential

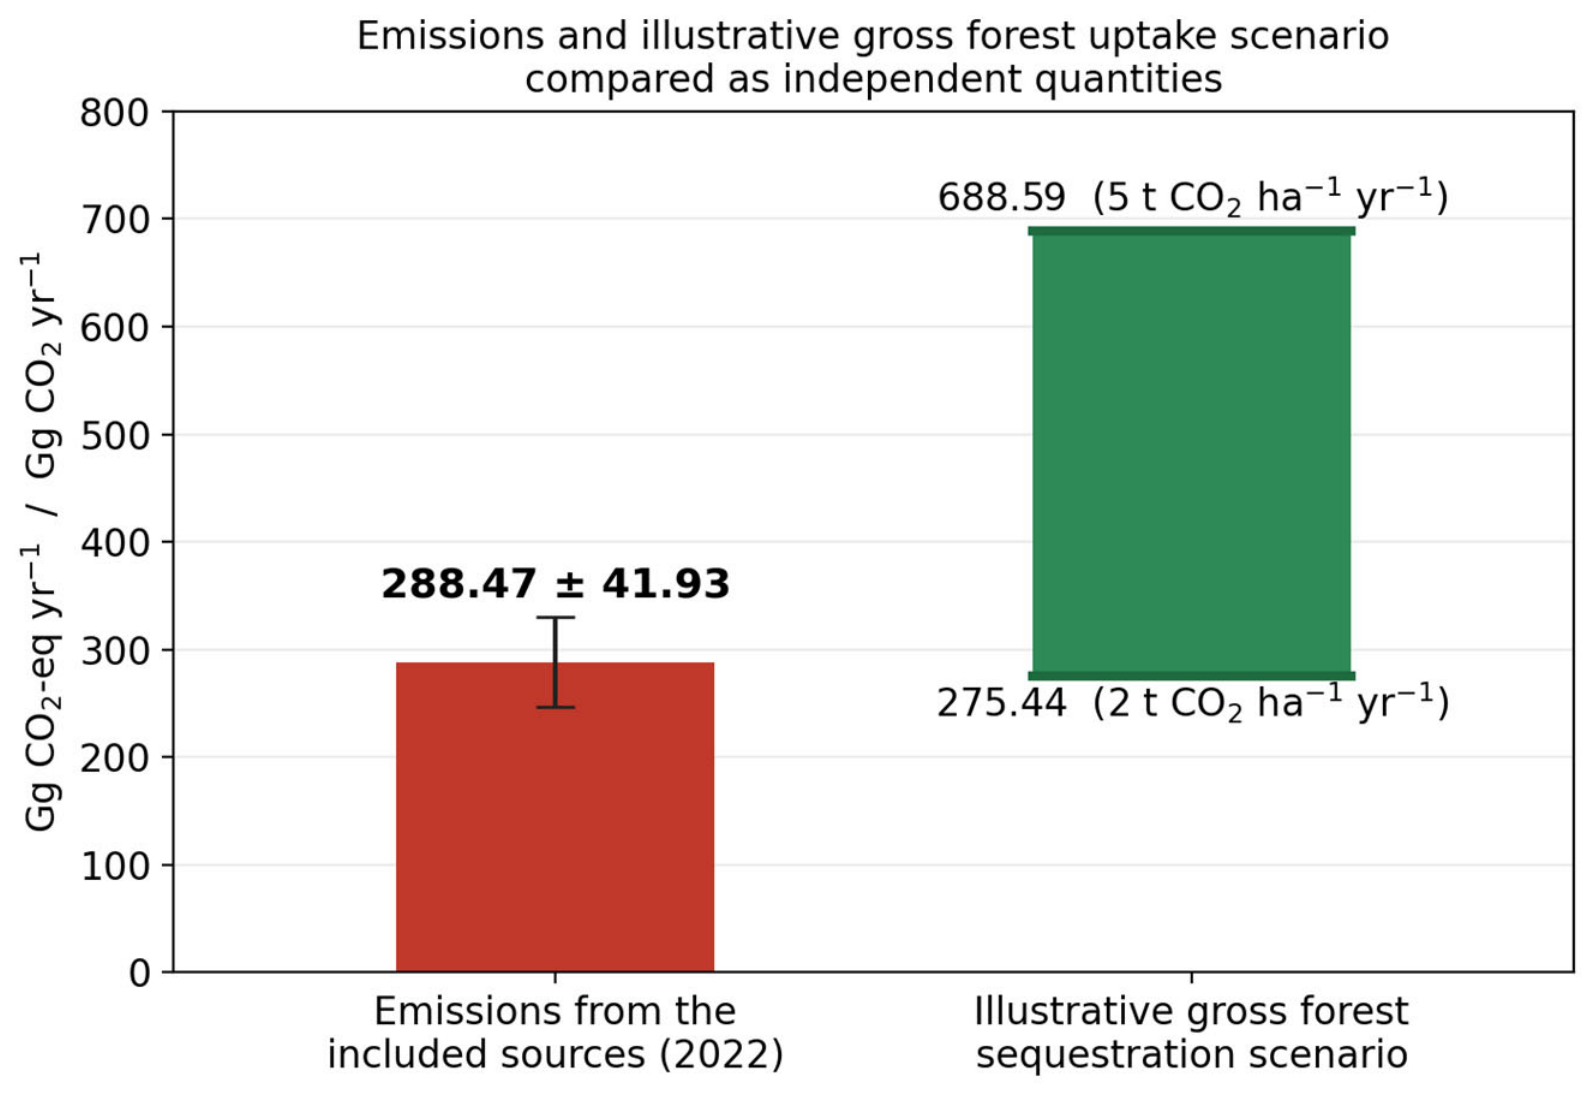
Tunceli Province contains 292,537 ha of forest, of which 137,718 ha is classified as productive closed-canopy forest [49]. Applying the literature-derived uptake-coefficient range described in Section 2.8 to the productive area gives, as an illustrative scenario conditional on the assumed coefficients, an indicative gross sequestration potential of 275.44–688.59 Gg CO2 yr−1. These figures are potentials derived from an area-based coefficient; they are not observed annual carbon-stock changes, and no stand-level inventory data were available to constrain them.
Emissions from the included sources (288.47 Gg CO2-eq yr−1) and the indicative gross uptake potential (275.44–688.59 Gg CO2 yr−1) are compared in Figure 8 as two independent quantities. We do not subtract them, and we do not report a net provincial carbon balance. The upper bound of the potential is about 2.4 times the compiled emissions, whereas the lower bound is slightly below them (0.95 times); the sign of any hypothetical comparison therefore depends entirely on the choice of uptake coefficient, and the available evidence does not support a conclusion in either direction. Because the potential is gross, derives from a single spatially uniform coefficient, and deducts no losses from harvesting, mortality, fire, or land-use change, it cannot be read as evidence that the province currently operates as a net carbon sink, nor as an offset against local emissions: sequestration by forests is part of the global carbon cycle, and attributing it to a provincial ledger would require carbon-accounting rules, land-use dynamics and leakage considerations that lie outside the scope of this study.
Under the assumed coefficients, the comparison indicates that the biophysical uptake capacity of the productive forest estate is of the same order of magnitude as the compiled provincial emissions. This supports a role for forest protection and management in provincial climate planning, while the width of the potential range shows how sensitive that role is to the assumed uptake rate. The long-term persistence of the estate’s capacity depends on forest health, disturbance regimes and land-use dynamics [53], and reliance on natural sinks cannot substitute for continued emission reductions [54]. Constraining the estimate would require stand-level inventory data and repeated carbon-stock measurements, which Section 3.10 identifies as a priority for future work.

3.8. Road-Transport Emission Trends During 2018–2022

The fuel-based road-transport series for 2018–2022 shows a decline in 2020, coinciding with travel restrictions and reduced mobility during the COVID-19 pandemic [33,34] (Figure 9). Similarly, Türkiye reported temporary reductions in transport and energy-related emissions during the pandemic period [55].
The fuel-based Tier 1 series derived from provincial fuel sales [44,45] gives 58.66 Gg CO2 yr−1 in 2018, 55.53 in 2019, 54.20 in 2020, 55.03 in 2021 and 58.42 in 2022: the minimum falls in 2020, 4.5 Gg (7.6%) below 2018, and is followed by a return to near-2018 levels by 2022. The activity-based series calculated using the inputs in Table 2 and the annual fleet data in Section 2.5 gives 43.57, 43.28, 43.82, 45.46 and 45.28 Gg CO2 yr−1 for the same years. Because the annual distance and fuel-consumption rates are held constant, this series follows the size and composition of the registered fleet and shows no 2020 minimum; the gap between the two series in 2020 (10.4 Gg) is the part of the fuel-sales signal that a fleet-based reconstruction cannot capture. The 2020 decline in the fuel-based series is consistent with reduced mobility during the pandemic. However, its attribution remains indicative: annual vehicle-activity data are not available for the province, and provincial fuel sales also reflect through-traffic. The subsequent recovery is consistent with the rebound effect documented in the international literature [33,34]. Policies promoting modal shift, electrification, fuel efficiency and digital mobility management could reproduce part of this reduction without socio-economic disruption.

3.9. Scenario Analysis for Residential Coal Reduction

Table 7 reports the three coal-reduction scenarios defined in Section 2.9 (25%, 50% and 75% reductions in residential coal use against the 2022 baseline of 288.47 Gg CO2-eq yr−1), both on a gross ceteris paribus basis and with the illustrative natural-gas substitution.
Replacing coal with cleaner alternatives such as natural gas, biomass, heat pumps, or district heating systems could substantially reduce emissions [56]. Combining fuel switching with building energy-efficiency improvements would further reduce emissions and support long-term sustainability goals [29]. Each 25% reduction in residential coal use lowers the compiled provincial total by approximately 11.3% on a gross ceteris paribus basis, or by approximately 6.6% once fossil-fuel substitution is accounted for (Table 7). Under the most ambitious scenario (75% coal reduction), the gross total falls to 190.62 Gg CO2-eq yr−1, a 33.9% reduction relative to the 2022 baseline and to 231.62 Gg CO2-eq yr−1 (19.7%) if the avoided heat is supplied entirely by natural gas. These results identify residential heating as the largest estimated mitigation opportunity in the province’s emission profile, under the household-heating assumptions set out in Section 2.2.1.

3.10. Limitations

Several limitations should be considered when interpreting these results. First, the inventory relies on default and literature-based emission factors and aggregated activity data; fuel quality and combustion conditions specific to the province may differ from these values, and residential coal consumption is inferred from dwelling statistics rather than measured deliveries, making it both the largest and most uncertain category. The ±30% activity-data range assigned to it is an author-adopted assumption; therefore, the reported uncertainty ranges are illustrative bounds rather than confidence intervals and may not capture systematic bias in the household-heating assumptions. Second, the inventory covers only the source categories listed in Section 2.2; municipal solid waste is excluded in full because its emissions are predominantly CH4 (Section 2.2.2), CH4 and N2O are not accounted for anywhere, and completeness across all provincial sources cannot be guaranteed. Third, the accounting framework is hybrid: three categories are direct and territorial, while electricity is indirect and consumption-based, and because the official grid factor is CO2-eq, the aggregate is reported in Gg CO2-eq yr−1 rather than as a pure CO2 total. Fourth, the principal transport estimate is fuel-based and assumes that provincial fuel sales approximate provincial combustion; the activity-based reconstruction assumes instead that the registered fleet operates within the provincial boundary at national-average mileages. Neither assumption is verifiable with available data; the two differ by 22.5%, and reconciling them remains a future QA/QC step. Fifth, and most importantly for interpretation, the forest sequestration estimate applies a single average uptake coefficient to the productive forest area without stratification by forest type, age, or site condition and without deducting carbon losses from harvesting, mortality, fire, or land-use change; the local applicability of the literature-derived coefficients could not be established, so the result is an illustrative scenario conditional on those coefficients; it represents an indicative gross potential rather than a net annual carbon-stock change, spans a factor of 2.5 across the published coefficient range, and is not comparable in reliability to the emission inventory. Finally, the coal-reduction scenarios are ceteris paribus sensitivity analyses whose substitution column depends on assumed appliance efficiencies. These limitations define a clear agenda for future work: locally derived emission factors, measured provincial coal deliveries and household heating surveys, a full multi-gas inventory including waste-sector CH4, stratified forest-inventory and carbon-stock-change data, and substitution-explicit scenario modeling.

4. Conclusions

Emissions from selected sources in Tunceli Province for 2022 were estimated at 288.47 Gg CO2-eq yr−1 (±14.5%), equivalent to 3.42 t CO2-eq cap−1 yr−1, and were compared with an illustrative gross forest-sequestration scenario. Residential coal combustion was the largest estimated source (45.2%), followed by electricity consumption (21.8%), transport (20.6%) and natural gas (12.4%). Residential coal therefore represents the largest estimated mitigation opportunity under the household-heating assumptions adopted here, in which every dwelling without a natural-gas connection is assumed to burn 2.5 t of coal annually. It is not an unequivocal primary mitigation strategy: the same category carries the largest uncertainty in the inventory, and its priority would need to be confirmed against measured coal deliveries or a household heating survey.
As an illustrative scenario conditional on the assumed coefficients, applying the literature-derived gross-uptake coefficient range of 2–5 t CO2 ha−1 yr−1, whose applicability to the province’s oak- and juniper-dominated stands could not be established, to the 137,718 ha of productive closed-canopy forest gives an indicative gross sequestration potential of 275.44–688.59 Gg CO2 yr−1. The upper bound exceeds the compiled emissions, while the lower bound does not; so, this comparison establishes only that the biophysical uptake capacity of the provincial forest estate is of the same order of magnitude as its energy-related emissions. It is not evidence that Tunceli currently functions as a net carbon sink; it does not represent observed annual carbon-stock changes, and it excludes harvesting, mortality, wildfire, soil-carbon dynamics, and land-use change; accordingly, this study claims no net provincial carbon balance. A 75% reduction in residential coal consumption would avoid approximately 97.85 Gg CO2 yr−1, or 33.9% of the baseline, under ceteris paribus assumptions; substitution by natural gas would reintroduce approximately 42% of that saving, whereas building-efficiency improvements, heat pumps supplied by low-carbon electricity and efficient district-energy systems would retain more of it.
These results provide a preliminary foundation for provincial climate-mitigation planning, and all numerical conclusions depend on the assumptions and uncertainty ranges reported above. The inventory should be strengthened by incorporating measured provincial fuel consumption, locally representative household-heating data, observed vehicle activity, a comprehensive multi-gas assessment of the waste sector, and forest carbon-stock-change data differentiated by forest type, age, condition and disturbance regime.

Author Contributions

Conceptualization, M.E. and M.K.; methodology, M.E.; data curation, M.E.; formal analysis, M.E.; writing—original draft preparation, M.E.; writing—review and editing, M.K. and A.K.; supervision, M.K. and A.K. All authors have read and agreed to the published version of the manuscript.

Funding

This research received no external funding.

Institutional Review Board Statement

Not applicable.

Informed Consent Statement

Not applicable.

Data Availability Statement

Most activity data used in this study are publicly available from the cited institutional sources. Population and household counts are from the TÜİK Address-Based Population Registration System [35]; registered vehicle numbers and national fuel-type shares are from the TÜİK Road Motor Vehicle Statistics [46]; average annual distance travelled per vehicle are from the TÜİK statistics derived from TÜVTÜRK periodic-inspection odometer records [48]; provincial road-fuel sales are from the EPDK Petroleum Market [44] and LPG Market [45] Development Reports; natural-gas consumption and residential subscriber numbers and from the EPDK Natural Gas Market Development Report [41]; electricity consumption by consumer category is from the EPDK Electricity Market Development Report [42]; the national grid emission factor is from the Ministry of Energy and Natural Resources [43]; air-quality concentrations are from the National Air Quality Monitoring Network [40]; and forest area statistics are from the General Directorate of Forestry [49]. We obtained ferry operational data through interviews with the Pertek ferry operators (Section 2.6) and report them in full in the text.

Acknowledgments

During the preparation of this manuscript, the authors used ChatGPT 5.2 (OpenAI) for language editing and formatting purposes. The authors have reviewed and edited the output and take full responsibility for the content of this publication.

Conflicts of Interest

The authors declare no conflicts of interest.

Abbreviations

Aforest productive (closed-canopy) forest area (ha)
CE per capitaper capita emissions from the included sources (t CO2-eq cap−1 yr−1)
CFannual gross CO2 uptake coefficient of forest area (t CO2 ha−1 yr−1; range 2–5 applied)
CH4methane
Cicarbon content of fuel type i (t C; 1 Gg C = 103 t C)
CO2carbon dioxide
CO2,iCO2 emissions from fuel type i (t CO2 or Gg CO2)
CO2,sinkindicative annual gross CO2 sequestration potential of the productive forest area (t CO2 yr−1 or Gg CO2 yr−1)
CO2,totalcompiled total annual emissions from the included sources (t CO2-eq yr−1 or Gg CO2-eq yr−1)
D i annual distance travelled by vehicle category i (km vehicle−1 yr−1)
EFidefault carbon emission factor for fuel type i (tC TJ−1)
Eienergy consumption of fuel type i (TJ)
EPDKEnergy Market Regulatory Authority (Enerji Piyasası Düzenleme Kurumu)
f i average fuel consumption of vehicle category i (L 100 km−1)
FCifuel consumption of type i (ton or L yr−1)
GHGgreenhouse gas
IPCCIntergovernmental Panel on Climate Change
LPGliquefied petroleum gas
Mifuel mass for vehicle type i (kg yr−1)
N2Onitrous oxide
NCVinet calorific value of fuel type i (TJ kt−1 or TJ Gg−1)
Nitotal number of registered vehicles of type i
PM10particulate matter with aerodynamic diameter ≤10 μm
SO2sulfur dioxide
TÜİKTurkish Statistical Institute (Türkiye İstatistik Kurumu)
ρifuel density for vehicle type i (kg L−1)

References

  1. Mariappan, S.; David Raj, A.; Kumar, S.; Chatterjee, U. Global Warming Impacts on the Environment in the Last Century. In Ecological Footprints of Climate Change: Adaptive Approaches and Sustainability; Chatterjee, U., Akanwa, A.O., Kumar, S., Singh, S.K., Dutta Roy, A., Eds.; Springer International Publishing: Cham, Switzerland, 2022; pp. 63–93. [Google Scholar]
  2. Dilmore, R.; Zhang, L. Greenhouse Gases and Their Role in Climate Change. In Greenhouse Gases and Clay Minerals: Enlightening Down-to-Earth Road Map to Basic Science of Clay-Greenhouse Gas Interfaces; Romanov, V., Ed.; Springer International Publishing: Cham, Switzerland, 2018; pp. 15–32. [Google Scholar]
  3. Rafique, R.; Kumar, S.; Luo, Y.; Xu, X.; Li, D.; Zhang, W.; Asam, Z.-u.-Z. Estimation of greenhouse gases (N2O, CH4 and CO2) from no-till cropland under increased temperature and altered precipitation regime: A DAYCENT model approach. Glob. Planet. Change 2014, 118, 106–114. [Google Scholar] [CrossRef] [Scilit]
  4. Chen, W.; Zheng, X.; Chen, Q.; Wolf, B.; Butterbach-Bahl, K.; Brüggemann, N.; Lin, S. Effects of increasing precipitation and nitrogen deposition on CH4 and N2O fluxes and ecosystem respiration in a degraded steppe in Inner Mongolia, China. Geoderma 2013, 192, 335–340. [Google Scholar] [CrossRef] [Scilit]
  5. Tian, H.; Chen, G.; Lu, C.; Xu, X.; Ren, W.; Zhang, B.; Banger, K.; Tao, B.; Pan, S.; Liu, M.; et al. Global methane and nitrous oxide emissions from terrestrial ecosystems due to multiple environmental changes. Ecosyst. Health Sustain. 2015, 1, 1–20. [Google Scholar] [CrossRef] [Scilit]
  6. Dong, Y.; Xia, B.; Chen, W. Carbon footprint of urban areas: An analysis based on emission sources account model. Environ. Sci. Policy 2014, 44, 181–189. [Google Scholar] [CrossRef] [Scilit]
  7. Hillmer-Pegram, K.C.; Howe, P.D.; Greenberg, H.; Yarnal, B. A geographic approach to facilitating local climate governance: From emissions inventories to mitigation planning. Appl. Geogr. 2012, 34, 76–85. [Google Scholar] [CrossRef] [Scilit]
  8. Abart-Heriszt, L.; Erker, S.; Stoeglehner, G. The Energy Mosaic Austria—A Nationwide Energy and Greenhouse Gas Inventory on Municipal Level as Action Field of Integrated Spatial and Energy Planning. Energies 2019, 12, 3065. [Google Scholar] [CrossRef] [Scilit]
  9. Popartan, L.A.; Morata, F. Energy Consumption and Emissions Assessment in Cities: An Overview. In Creating Low Carbon Cities; Dhakal, S., Ruth, M., Eds.; Springer International Publishing: Cham, Switzerland, 2017; pp. 63–74. [Google Scholar]
  10. Rahmani, O.; Rezania, S.; Beiranvand Pour, A.; Aminpour, S.M.; Soltani, M.; Ghaderpour, Y.; Oryani, B. An Overview of Household Energy Consumption and Carbon Dioxide Emissions in Iran. Processes 2020, 8, 994. [Google Scholar] [CrossRef] [Scilit]
  11. Lwasa, S.; Seto, K.C.; Bai, X.; Blanco, H.; Gurney, K.R.; Kılkış, Ş.; Lucon, O.; Murakami, J.; Pan, J.; Sharifi, A.; et al. Urban Systems and Other Settlements. In Climate Change 2022: Mitigation of Climate Change. Contribution of Working Group III to the Sixth Assessment Report of the Intergovernmental Panel on Climate Change; Cambridge University Press: Cambridge, UK, 2022; pp. 861–952. [Google Scholar]
  12. Chen, K.; Yang, M.; Zhou, X.; Liu, Z.; Li, P.; Tang, J.; Peng, C. Recent advances in carbon footprint studies of urban ecosystems: Overview, application, and future challenges. Environ. Rev. 2022, 30, 342–356. [Google Scholar] [CrossRef] [Scilit]
  13. Heinonen, J.; Ottelin, J.; Ala-Mantila, S.; Wiedmann, T.; Clarke, J.; Junnila, S. Spatial consumption-based carbon footprint assessments—A review of recent developments in the field. J. Clean. Prod. 2020, 256, 120335. [Google Scholar] [CrossRef] [Scilit]
  14. IPCC. 2006 IPCC Guidelines for National Greenhouse Gas Inventories; Eggleston, H.S., Buendia, L., Miwa, K., Ngara, T., Tanabe, K., Eds.; IGES: Hayama, Japan, 2006. [Google Scholar]
  15. Yakut Şevik, S.E.; Şahin, A.D. Quantifying Sectoral Carbon Footprints in Türkiye’s Largest Metropolitan Cities: A Monte Carlo Simulation Approach. Sustainability 2024, 16, 1730. [Google Scholar] [CrossRef] [Scilit]
  16. Can, Z.G. Distributional Drivers of Carbon Emissions in Türkiye. Sustainability 2025, 17, 4023. [Google Scholar] [CrossRef] [Scilit]
  17. Acar, S.; Yeldan, A.E. Investigating patterns of carbon convergence in an uneven economy: The case of Turkey. Struct. Change Econ. Dyn. 2018, 46, 96–106. [Google Scholar] [CrossRef] [Scilit]
  18. Kucuker, D.M. Analyzing the effects of various forest management strategies and carbon prices on carbon dynamics in western Turkey. J. Environ. Manag. 2019, 249, 109356. [Google Scholar] [CrossRef] [Scilit] [PubMed]
  19. Atabey, T. Karbon Ayak Izinin Hesaplanması: Diyarbakır Örneği. Master’s Thesis, Fırat Üniversitesi, Elazığ, Turkey, 2013. [Google Scholar]
  20. Şenel, G.U.; Atabey, T. Diyarbakir Ilinde Farkli Sektörlerden Kaynaklanan Karbondioksit Saliniminin Hesaplanmasi. Kahramanmaraş Sütçü İmam Üniversitesi Mühendis. Bilim. Derg. 2020, 23, 37–47. [Google Scholar] [CrossRef] [Scilit]
  21. Argun, M.E.; Ergüç, R.; Sarı, Y. Konya/Selçuklu ilçesi karbon ayak izinin belirlenmesi. Selçuk. Üniversitesi Mühendis. Bilim Teknol. Derg. 2019, 7, 287–297. [Google Scholar] [CrossRef] [Scilit]
  22. Özgür, B. The Assessment of Socio-Economic Impacts of Climate Change in Rural Areas: The Case of Konya. Master’s Thesis, Department of City and Regional Planning, Graduate School of Natural and Applied Sciences, Middle East Technical University, Ankara, Türkiye, 2019. [Google Scholar]
  23. Kırbaş, İ.; Kocakulak, T. Burdur ili karbon ayak izinin belirlenmesi. Dokuz Eylül Üniversitesi Mühendis. Fakültesi Fen Mühendis. Derg. 2022, 24, 317–327. [Google Scholar] [CrossRef] [Scilit]
  24. Uygur, B.; Serengil, Y. Carbon sequestration potential of forest biomass in Turkey. In Biochar: A Regional Supply Chain Approach in View of Climate Change Mitigation; Cambridge University Press: Cambridge, UK, 2016; pp. 184–195. [Google Scholar]
  25. Raihan, A.; Tuspekova, A. Dynamic impacts of economic growth, renewable energy use, urbanization, industrialization, tourism, agriculture, and forests on carbon emissions in Turkey. Carbon Res. 2022, 1, 20. [Google Scholar] [CrossRef] [Scilit]
  26. Kocaman, A. Sanayi şehri karabük ilindeki fosil yakıt kaynaklı karbon ayak izinin belirlenmesi ve orman varlıklarının emisyonu azaltmadaki etkisi. İzlek Akad. Dergi 2020, 3, 44–55. [Google Scholar]
  27. Kazar, G. An Asymmetric Approach to Evaluate Sectoral CO2 Emissions in Turkey. Futur. Econ. Law 2024, 4, 48–64. [Google Scholar] [CrossRef] [Scilit]
  28. Houghton, R.A.; House, J.I.; Pongratz, J.; van der Werf, G.R.; DeFries, R.S.; Hansen, M.C.; Le Quéré, C.; Ramankutty, N. Carbon emissions from land use and land-cover change. Biogeosciences 2012, 9, 5125–5142. [Google Scholar] [CrossRef] [Scilit]
  29. IPCC. Climate Change 2023: Synthesis Report. Contribution of Working Groups I, II and III to the Sixth Assessment Report of the Intergovernmental Panel on Climate Change; Lee, H., Romero, J., Eds.; IPCC: Geneva, Switzerland, 2023. [Google Scholar] [CrossRef] [Scilit]
  30. Ameray, A.; Bergeron, Y.; Valeria, O.; Montoro Girona, M.; Cavard, X. Forest Carbon Management: A Review of Silvicultural Practices and Management Strategies Across Boreal, Temperate and Tropical Forests. Curr. For. Rep. 2021, 7, 245–266. [Google Scholar] [CrossRef] [Scilit]
  31. Pan, Y.; Birdsey, R.A.; Phillips, O.L.; Houghton, R.A.; Fang, J.; Kauppi, P.E.; Keith, H.; Kurz, W.A.; Ito, A.; Lewis, S.L.; et al. The enduring world forest carbon sink. Nature 2024, 631, 563–569. [Google Scholar] [CrossRef] [Scilit] [PubMed]
  32. Peng, D.; Zhang, B.; Zheng, S.; Ju, W.; Chen, J.M.; Ciais, P.; Guo, H.; Pan, Y.; Yu, L.; Xu, Y.; et al. Newly established forests dominated global carbon sequestration change induced by land cover conversions. Nat. Commun. 2025, 16, 6570. [Google Scholar] [CrossRef] [Scilit] [PubMed]
  33. Schulte-Fischedick, M.; Shan, Y.; Hubacek, K. Implications of COVID-19 lockdowns on surface passenger mobility and related CO2 emission changes in Europe. Appl. Energy 2021, 300, 117396. [Google Scholar] [CrossRef] [Scilit] [PubMed]
  34. Rojas, C.; Muñiz, I.; Quintana, M.; Simon, F.; Castillo, B.; de la Fuente, H.; Rivera, J.; Widener, M. Short run “rebound effect” of COVID on the transport carbon footprint. Cities 2022, 131, 104039. [Google Scholar] [CrossRef] [Scilit] [PubMed]
  35. TÜİK. Address-Based Population Registration System (ABPRS) Results, 2022 and 2023 (Adrese Dayalı Nüfus Kayıt Sistemi Sonuçları); Used for Provincial Population and Household (Dwelling) Counts; Turkish Statistical Institute: Ankara, Türkiye, 2023. Available online: https://data.tuik.gov.tr (accessed on 1 February 2025).
  36. Republic of Türkiye, Tunceli Governorship. Tunceli Province General Information Report. Available online: https://tunceli.gov.tr (accessed on 1 February 2025).
  37. Korkmaz, M.; Kuriqi, A. Regional Climate Change and Drought Dynamics in Tunceli, Turkey: Insights from Drought Indices. Water Conserv. Sci. Eng. 2024, 9, 49. [Google Scholar] [CrossRef] [Scilit]
  38. Spinoni, J.; Vogt, J.; Barbosa, P. European degree-day climatologies and trends for the period 1951–2011. Int. J. Climatol. 2015, 35, 25–36. [Google Scholar] [CrossRef] [Scilit]
  39. Korkmaz, M. Geospatial evaluation of river basin small hydropower potential using AHP. Front. Environ. Sci. 2026, 14, 1749841. [Google Scholar] [CrossRef] [Scilit]
  40. Murzaeva, S. Estimation of PM10 Variations in the Southeastern and Eastern Anatolia Regions of Türkiye Using Remote Sensing and Statistical Models. Master’s Thesis, Earth System Science Programme, Department of Climate and Marine Sciences, Graduate School, Istanbul Technical University, Istanbul, Türkiye, 2024. [Google Scholar]
  41. EPDK. Natural Gas Market Development Report 2022 (Doğal Gaz Piyasası Gelişim Raporu 2022); Used for Provincial Natural-Gas Consumption and Residential Subscriber Numbers; Energy Market Regulatory Authority, Department of Strategy Development: Ankara, Türkiye, 2023. Available online: https://www.epdk.gov.tr (accessed on 1 February 2025).
  42. EPDK. Electricity Market Development Report 2022 (Elektrik Piyasası Gelişim Raporu 2022); Used for Provincial Electricity Consumption by Consumer Category; Energy Market Regulatory Authority, Department of Strategy Development: Ankara, Türkiye, 2023. Available online: https://www.epdk.gov.tr (accessed on 1 February 2025).
  43. Republic of Türkiye Ministry of Energy and Natural Resources. Electricity Consumption and Production Point Emission Factors for 2022; Ministry of Energy and Natural Resources: Ankara, Türkiye, 2023. Available online: https://enerji.gov.tr (accessed on 1 February 2025).
  44. EPDK. Petroleum Market Development Report 2022 (Petrol Piyasası Gelişim Raporu 2022); Used for Provincial Gasoline and Diesel Sales; Energy Market Regulatory Authority, Department of Strategy Development: Ankara, Türkiye, 2023. Available online: https://www.epdk.gov.tr (accessed on 1 February 2025).
  45. EPDK. LPG Market Development Report 2022 (LPG Piyasası Gelişim Raporu 2022); Used for Provincial Autogas (LPG) Sales; Energy Market Regulatory Authority, Department of Strategy Development: Ankara, Türkiye, 2023. Available online: https://www.epdk.gov.tr (accessed on 1 February 2025).
  46. TÜİK. Road Motor Vehicle Statistics, December 2022 (Motorlu Kara Taşıtları İstatistikleri); Used for Registered Vehicle Counts by Category and National Fuel-Type Shares of Passenger Cars; Turkish Statistical Institute: Ankara, Türkiye, 2023. Available online: https://data.tuik.gov.tr (accessed on 1 February 2025).
  47. Yalılı Kılıç, M.; Dönmez, T.; Adalı, S. Karayolu ulaşımında yakıt tüketimine bağlı karbon ayak izi değişimi: Çanakkale örneği (Carbon footprint change due to fuel consumption in road transport: The case of Çanakkale). Gümüşhane Üniversitesi Fen Bilim. Derg. 2021, 11, 943–955. [Google Scholar] [CrossRef] [Scilit]
  48. TÜİK. Distance Travelled by Road Motor Vehicles, 2021 (Motorlu Kara Taşıtlarının Kat Ettiği Mesafe İstatistikleri); Compiled from TÜVTÜRK Periodic Vehicle Inspection Odometer Records; Used for Average Annual Distance Travelled per Vehicle Category; Turkish Statistical Institute: Ankara, Türkiye, 2022. Available online: https://data.tuik.gov.tr (accessed on 1 February 2025).
  49. General Directorate of Forestry (GDF). Forest Resources Statistics of Tunceli Province, 2022 (Tunceli İli Orman Varlığı); Used for Total, Productive Closed-Canopy and Open-Canopy Forest Areas and for Forest Composition; Ministry of Agriculture and Forestry, General Directorate of Forestry: Ankara, Türkiye, 2022.
  50. Wang, J.; Lou, H.H.; Yang, F.; Cheng, F. Development and performance evaluation of a clean-burning stove. J. Clean. Prod. 2016, 134, 447–455. [Google Scholar] [CrossRef] [Scilit]
  51. Brkić, D. European Efficiency Schemes for Domestic Gas Boilers: Estimation of Savings in Heating of Settlements. Algorithms 2025, 18, 416. [Google Scholar] [CrossRef] [Scilit]
  52. Çetin Doğruparmak, Ş.; Demirarslan, K.O.; Çavuşoğlu, S.V. Evaluation of Turkey’s Road-Based Greenhouse Gas Inventory and Future Projections. Appl. Sci. 2025, 15, 7007. [Google Scholar] [CrossRef] [Scilit]
  53. De-Miguel, S.; Birhanu, A.; Oliveras Menor, I.; Ascoli, D.; Spadoni, G.L.; Erdozain, M. Carbon Emissions from Forest Disturbances Under Global Change. Curr. For. Rep. 2025, 11, 29. [Google Scholar] [CrossRef] [Scilit]
  54. Walsh, B.; Ciais, P.; Janssens, I.A.; Peñuelas, J.; Riahi, K.; Rydzak, F.; van Vuuren, D.P.; Obersteiner, M. Pathways for balancing CO2 emissions and sinks. Nat. Commun. 2017, 8, 14856. [Google Scholar] [CrossRef] [Scilit] [PubMed]
  55. Gürbüz, H.; Şöhret, Y.; Ekici, S. Evaluating effects of the COVID-19 pandemic period on energy consumption and enviro-economic indicators of Turkish road transportation. Energy Sources Part A Recovery Util. Environ. Eff. 2025, 47, 1889077. [Google Scholar] [CrossRef] [Scilit]
  56. Lake, A.; Rezaie, B.; Beyerlein, S. Review of district heating and cooling systems for a sustainable future. Renew. Sustain. Energy Rev. 2017, 67, 417–425. [Google Scholar] [CrossRef] [Scilit]
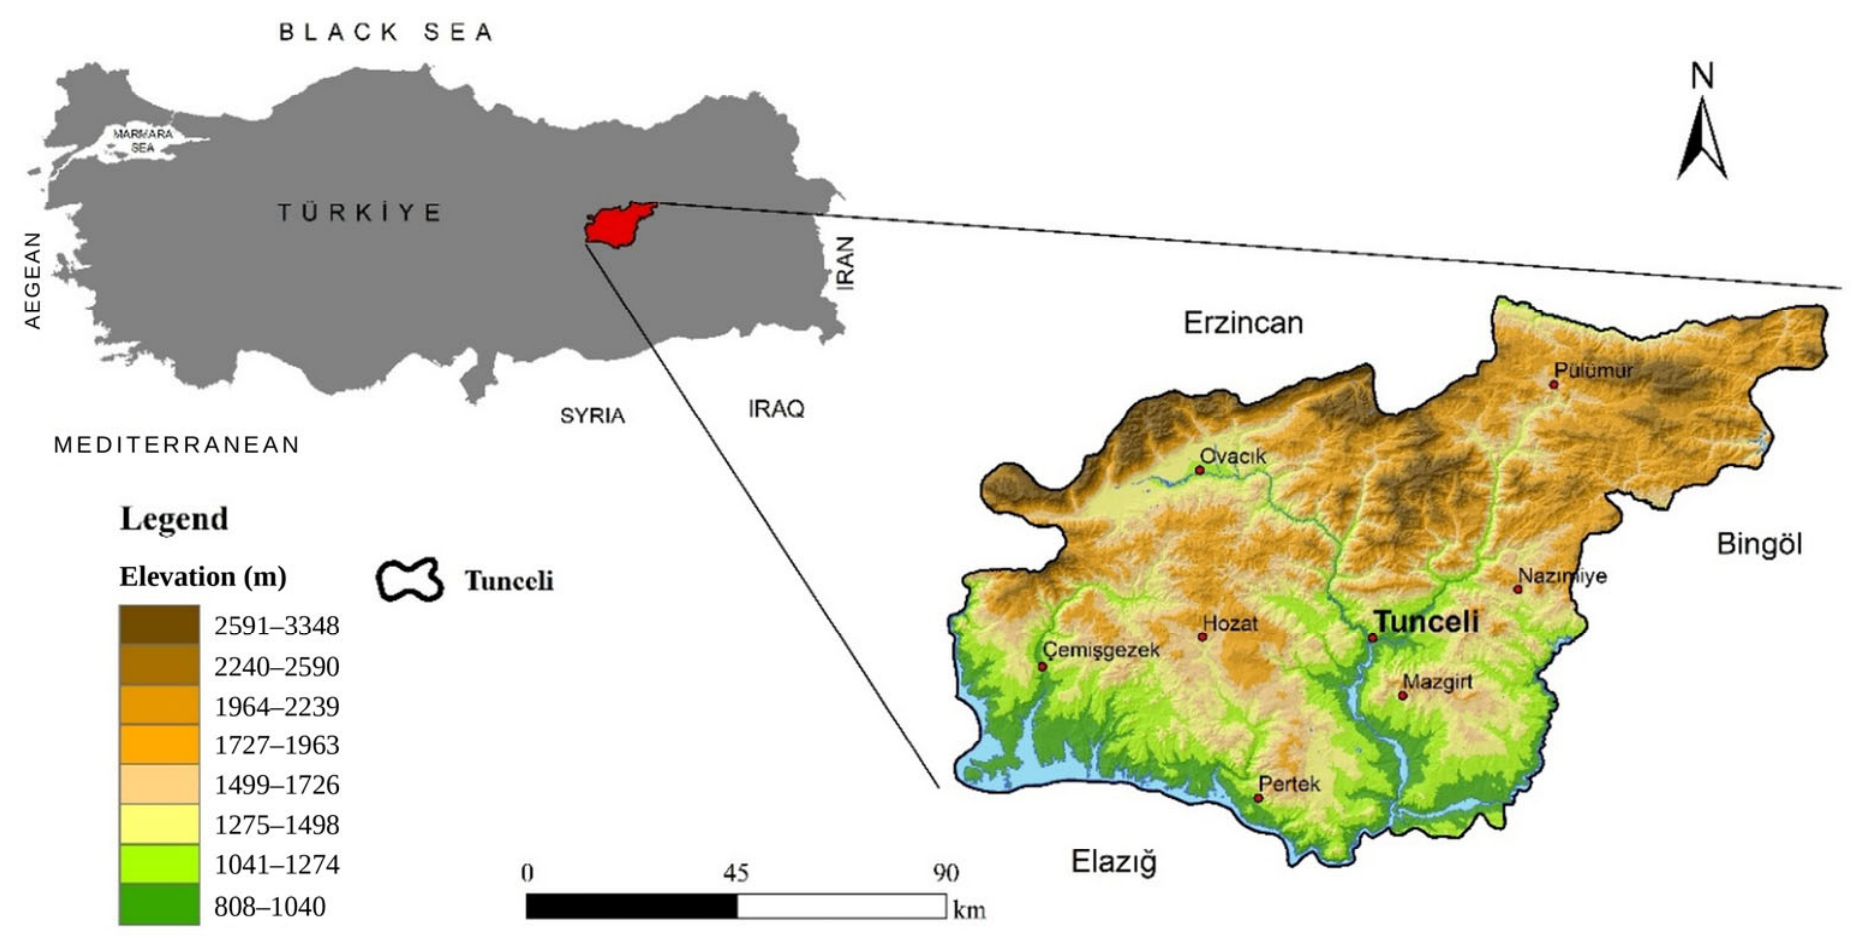
Figure 1. Location and elevation distribution of Tunceli Province, Türkiye. Elevations are in meters above sea level; the map labels are official Turkish place names.
Earth 07 00154 g001
Figure 2. Spatial distribution of long-term mean annual precipitation (mm) and major water resources in Tunceli Province, Türkiye. The map labels are official Turkish place names.
Earth 07 00154 g002
Figure 3. Annual heating degree days (HDD; °C·day) for Tunceli, Türkiye, during 1991–2020. Higher HDD values represent colder conditions and higher climatic demand for space heating.
Earth 07 00154 g003
Figure 4. Mean monthly heating degree days (HDD; °C·day) for Tunceli, Türkiye, during 1991–2020. Higher HDD values indicate higher climatic demand for space heating.
Earth 07 00154 g004
Figure 5. Sectoral distribution of emissions from the included sources in Tunceli Province, 2022 (Gg CO2-eq yr−1). Total 288.47 Gg CO2-eq yr−1. Transport is the principal fuel-based estimate (58.42 road + 0.98 ferry).
Earth 07 00154 g005
Figure 6. Comparison of the fuel-based Tier 1 estimate (58.42 Gg CO2 yr−1, the principal inventory value) and the activity-based (bottom-up) estimate (45.28 Gg CO2 yr−1, a sensitivity analysis) of road transport CO2 emissions in Tunceli Province, 2022.
Earth 07 00154 g006
Figure 7. Road transport fleet and emissions in Tunceli Province, by registered vehicle category, 2018–2022.
Earth 07 00154 g007
Figure 8. Emissions from the included sources in Tunceli Province in 2022 (288.47 ± 41.93 Gg CO2-eq yr−1) compared with the illustrative gross forest sequestration scenario for the productive closed-canopy forest area (275.44–688.59 Gg CO2 yr−1, spanning uptake coefficients of 2–5 t CO2 ha−1 yr−1). The two quantities are plotted as independent magnitudes; no net balance is shown. The units differ deliberately: the emission total is CO2-equivalent because it includes the CO2-eq electricity component (Section 2.3), whereas forest uptake is a CO2-only flux.
Earth 07 00154 g008
Figure 9. Road transport CO2 emissions in Tunceli Province, 2018–2022 (Gg CO2 yr−1), by both estimation methods. The fuel-based Tier 1 series (solid line) is the principal estimate and is derived from provincial fuel-sales statistics [44,45]; the activity-based bottom-up series (dashed line) is the sensitivity analysis derived from registered vehicles and assumed activity and should not be interpreted as observed annual emissions. The red marker denotes the 2020 minimum of the fuel-based series. The activity-based series holds annual distance, fuel-consumption rates and emission factors constant (Section 2.5) and therefore varies only with the size and composition of the registered fleet; it cannot register changes in vehicle use.
Earth 07 00154 g009
Table 1. Monthly average PM10 and SO2 concentrations for Tunceli Province in 2022 (µg/m3).
ParameterJanFebMarAprMayJunJulAugSepOctNovDec
PM1044.546.7139.9256.5928.6631.3832.2249.7645.5044.3048.2955.39
SO239.2232.1525.9715.3911.8711.6511.8012.0010.8512.4823.0826.13
Table 2. Inputs of the activity-based (bottom-up) road-transport calculation for 2022, with the source and spatial scope of each input.
Vehicle CategoryFuelVehicles
2022 (n)
Annual Distance
(km veh−1 yr−1)
Fuel Use
(L 100 km−1)
Density
(kg L−1)
NCV
(TJ Gg−1)
EF
(t C TJ−1)
Passenger carGasoline106797908.500.7444.318.9
Passenger carDiesel147116,9007.300.83543.020.2
Passenger carLPG139911,22311.200.5547.317.2
MinibusDiesel53828,14210.900.83543.020.2
BusDiesel10751,45929.900.83543.020.2
TruckDiesel44846,64329.900.83543.020.2
Van (light truck)Diesel199117,16110.900.83543.020.2
MotorcycleGasoline74538474.000.7444.318.9
Table 3. Sectoral emission estimates for 2022 with activity data (U_AD), emission factor (U_EF), and combined uncertainties. All values are annual.
SectorEmissions
(Gg CO2-eq yr−1)
U_ADU_EFCombined URange
(Gg CO2-eq yr−1)
Residential coal (direct)130.46±30%±10%±31.6%89.2–171.7
Electricity (indirect) a62.95±3%±5%±5.8%59.3–66.6
Transport (direct) b59.40±10%±5%±11.0%52.9–65.9
Natural gas (direct)35.66±3%±3%±4.2%34.2–37.2
Total288.47 ±14.5%246.5–330.4
a Indirect (consumption-based) emissions from electricity supplied by the national grid, reported on a CO2-equivalent basis because the official grid emission factor is published as CO2-eq (Section 2.3). The three direct territorial categories are CO2-only and sum to 225.52 Gg CO2 yr−1. b Road transport 58.42 Gg CO2 yr−1 (fuel-based Tier 1, the principal estimate; Section 3.4) plus ferry transport 0.98 Gg CO2 yr−1 (Section 2.6); the combined uncertainty weights road transport at ±11.2% and ferry transport at ±35%.
Table 4. Electricity consumption, associated CO2-eq emissions and sectoral shares in Tunceli Province (2022).
Consumer TypeConsumption (MWh)Emissions (t CO2-eq)Share (%)
Residential45,45921,72934.5
Commercial64,79630,97249.2
Industrial841240206.4
Agricultural irrigation18148671.4
Public lighting11,22253648.5
Total131,70362,954100.0
Table 5. Natural gas consumption and calculated CO2 emissions in Tunceli Province (2021–2022). Consumption is annual, measured at standard conditions; energy content was calculated using a gas density of 0.798 kg m−3 and the IPCC default net calorific value, and emissions were calculated using the IPCC default carbon emission factor of 15.3 t C TJ−1 with complete oxidation [14].
YearConsumption (Sm3 yr−1)Energy
(TJ yr−1)
CO2 Emissions
(Gg CO2 yr−1)
Change
(%)
202111,553,595442.5524.83
202216,595,024635.6635.66+43.6
Table 6. Activity-based (bottom-up) road transport CO2 emissions by vehicle category in Tunceli Province, 2022. These results are a sensitivity analysis and are not included in the inventory total. Vehicle numbers are registered vehicles on 31 December 2022 [46]; annual distance is the national average distance traveled per vehicle in 2021 from TÜVTÜRK odometer records [48]; category fuel-consumption rates follow [47]; all inputs and their sources are listed in Table 2; shares are percentages of the activity-based road total of 45.28 Gg CO2 yr−1; values and shares may not sum exactly to the totals because of rounding.
Vehicle CategoryFuel TypeVehicles (n)Annual Distance
(km Vehicle−1 yr−1)
CO2 Emissions
(Gg CO2 yr−1)
Share of Road Total (%)
Passenger carGasoline106797902.024.5
Passenger carDiesel147116,9004.8310.7
Passenger carLPG139911,2232.896.4
MinibusDiesel53828,1424.399.7
BusDiesel10751,4594.389.7
TruckDiesel44846,64316.6236.7
Van (Light truck)Diesel199117,1619.9021.9
MotorcycleGasoline74538470.260.6
Total45.28100
Table 7. Coal-reduction scenarios: gross (ceteris paribus) results and illustrative natural-gas substitution.
ScenarioCoal Avoided (Gg CO2 yr−1)Gross Total
(Gg CO2-eq yr−1)
Gas Added ᵃ
(Gg CO2 yr−1)
Net Total
(Gg CO2-eq yr−1)
Net Reduction (%)
Baseline (2022)288.47288.47
25% coal reduction32.62255.8513.67269.526.6
50% coal reduction65.23223.2427.33250.5713.1
75% coal reduction97.85190.6241.00231.6219.7
ᵃ Illustrative: assuming that the avoided coal heat is supplied entirely by natural gas. Derivation: EF_coal = 94.6 t CO2 TJ−1 (equivalent to 2.8519 t CO2 t−1 at an implied NCV of 30.1 GJ t−1, Section 2.2.1); EF_gas = 56.1 t CO2 TJ−1 [14]; assumed seasonal efficiencies η_coal = 0.65 and η_gas = 0.92; reintroduction ratio = (EF_gas/η_gas)/(EF_coal/η_coal) = 60.98/145.54 = 0.419. Electrification with low-carbon supply would retain a larger share of the gross reduction.
Disclaimer/Publisher’s Note: The statements, opinions and data contained in all publications are solely those of the individual author(s) and contributor(s) and not of MDPI and/or the editor(s). MDPI and/or the editor(s) disclaim responsibility for any injury to people or property resulting from any ideas, methods, instructions or products referred to in the content.