1. Introduction
Understanding how, when, and where precipitation occurs is fundamental for monitoring drought, anticipating extreme-rainfall flood disasters, managing freshwater supplies, and diagnosing the long-term response of the global water cycle to climate change. While gauges and radars remain critical, they leave large observational gaps over oceans, high mountains, and sparsely populated regions that nevertheless influence billions downstream [
1]. The Global Precipitation Measurement (GPM) mission, a joint NASA-JAXA effort, was designed to address these challenges by deploying a constellation of sensors anchored by the Dual-frequency Precipitation Radar (DPR) and a 13-channel GPM Microwave Imager on the Core Observatory [
1,
2]. By extending the Tropical Rainfall Measuring Mission (TRMM) reach to ~65° N/S and improving sensitivity to light rain and snow, GPM delivers global coverage at 0.1° and 30 min intervals that supports both hazard monitoring and climate research. Biases are now below 10% at moderate intensities, allowing Integrated Multi-satellite Retrievals for GPM (IMERG) products to feed into flood and landslide models with short lead times. Ground-validation networks and coordinated field campaigns further strengthen retrievals [
3]. Collectively, GPM’s systematic calibration and extended record provide a foundation for detecting subtle precipitation changes, especially in high-latitude and data-sparse regions [
4].
Since its launch in 2014, GPM’s Core Observatory and constellation have supplied global precipitation fields at half-hourly and 0.1° resolution, establishing a backbone for both scientific research and disaster response [
5]. IMERG merges multi-satellite microwave and infrared observations, producing near-real-time precipitation estimates with research-quality accuracy. Addressing precipitation mapping requires fine spatial resolution, diverse spectral channels, high-frequency sampling, and calibration through low-inclination orbits, as demonstrated by TRMM and GPM [
6]. IMERG has been instrumental in mapping global extreme rainfall, showing that the most intense storms contribute more than 80% of total precipitation [
6,
7]. It has also been integrated into early-warning systems such as ITHACA’s Extreme Rainfall Detection System, where inclusion of IMERG data improved detection rates of hazardous events by 13% [
8]. These advances underscore the indispensable role of IMERG in climatological studies, operational hazard forecasting, and the advancement of sub-hourly monitoring capabilities that extend the legacy of TRMM into a new era of global hydrometeorological applications.
Several studies have employed IMERG products to analyze precipitation trends, yielding both regional and global insights. Extreme rainfall events have been shown to contribute disproportionately to global precipitation totals, with distinct seasonal and regional variations [
6]. IMERG data have been found to enhance detection systems for extreme rainfall, underscoring its usefulness for operational monitoring [
7]. Its performance has been evaluated in Iran and Brazil, confirming its capacity to capture spatial and temporal variability while also noting regional limitations [
9,
10]. Rainfall variability over Kalimantan has been examined with IMERG, linking observed shifts to large-scale climate modes [
11]. Emerging shifts in tropical precipitation intensity–frequency distributions have been revealed through the combination of TRMM, GPM and IMERG, pointing to a growing intensification of extremes [
12]. Statistically significant precipitation trends have also been identified using IMERG alongside Mann–Kendall and Sen’s slope tests across multiple regions, confirming its suitability for long-term trend analysis [
13]. Collectively, these studies establish IMERG as a robust tool for detecting precipitation variability and emerging hydroclimatic trends.
However, it is important to note that several studies have also detected limitations in the use of IMERG data, especially in high latitude areas. At high latitudes, IMERG’s performance degrades because snow/ice surfaces and sea ice introduce large passive-microwave emissivity uncertainties and current sensor/channel limitations lead to systematic snowfall underestimation; moreover, the DPR calibration reference has limited sensitivity there, so the algorithm’s quality index is explicitly reduced over frozen surfaces [
14]. Consistent evaluations show that IMERG (V06/V07) tends to underestimate snowfall and can perform worse than reanalyses over snow-ice regions, with additional low biases reported over high-latitude oceans relative to Cloud Sat/GPCP benchmarks [
15].
The objective of this study is to construct a pixel-scale atlas of rainfall change spanning monthly, seasonal, and annual timeframes, allowing us to assess where and when precipitation has shifted globally. Our central research question is as follows: does the 27-year IMERG record (1998–2024) provide sufficient temporal depth to detect statistically significant precipitation trends, and how do these vary across regions and seasons? To address this, 324 monthly GPM-IMERG V07 files were processed into continuous Mann–Kendall Tau coefficient maps, aggregated into annual, seasonal and monthly composites. Then, Sen’s slopes were calculated for areas that experienced statistically significant trends in order to quantify the magnitude of change in precipitation for the 1998–2024 period.
2. Data and Methods
The precipitation data used in this study was obtained from the Integrated Multi-satellite Retrievals for GPM (IMERG), which merges microwave overpasses, geostationary infrared imagery, and gauge analyses to produce global half-hourly precipitation estimates at 0.1° resolution [
2]. For this analysis, we used the IMERG Version 7 Final Run, which spans from January 1998 through December 2024, thus uniting the TRMM and GPM eras into a continuous 27-year record [
4]. To address potential artifacts arising from the TRMM-to-GPM transition in 2014, we note that IMERG incorporates homogenization procedures within its algorithm to ensure continuity between the TRMM and GPM eras, minimizing sensor-related biases and maintaining consistency across the full precipitation record [
14]. The full archive was accessed through NASA’s Giovanni web portal, which allows users to subset, visualize, and download precipitation data in user-friendly formats. Monthly IMERG rasters were downloaded and converted into GeoTIFF files using the R package (R version 4.5.1) raster, where they were validated against Giovanni’s inter-annual time-series graphs to ensure consistency. This dataset provides the temporal continuity and spatial resolution necessary for detecting long-term rainfall trends globally.
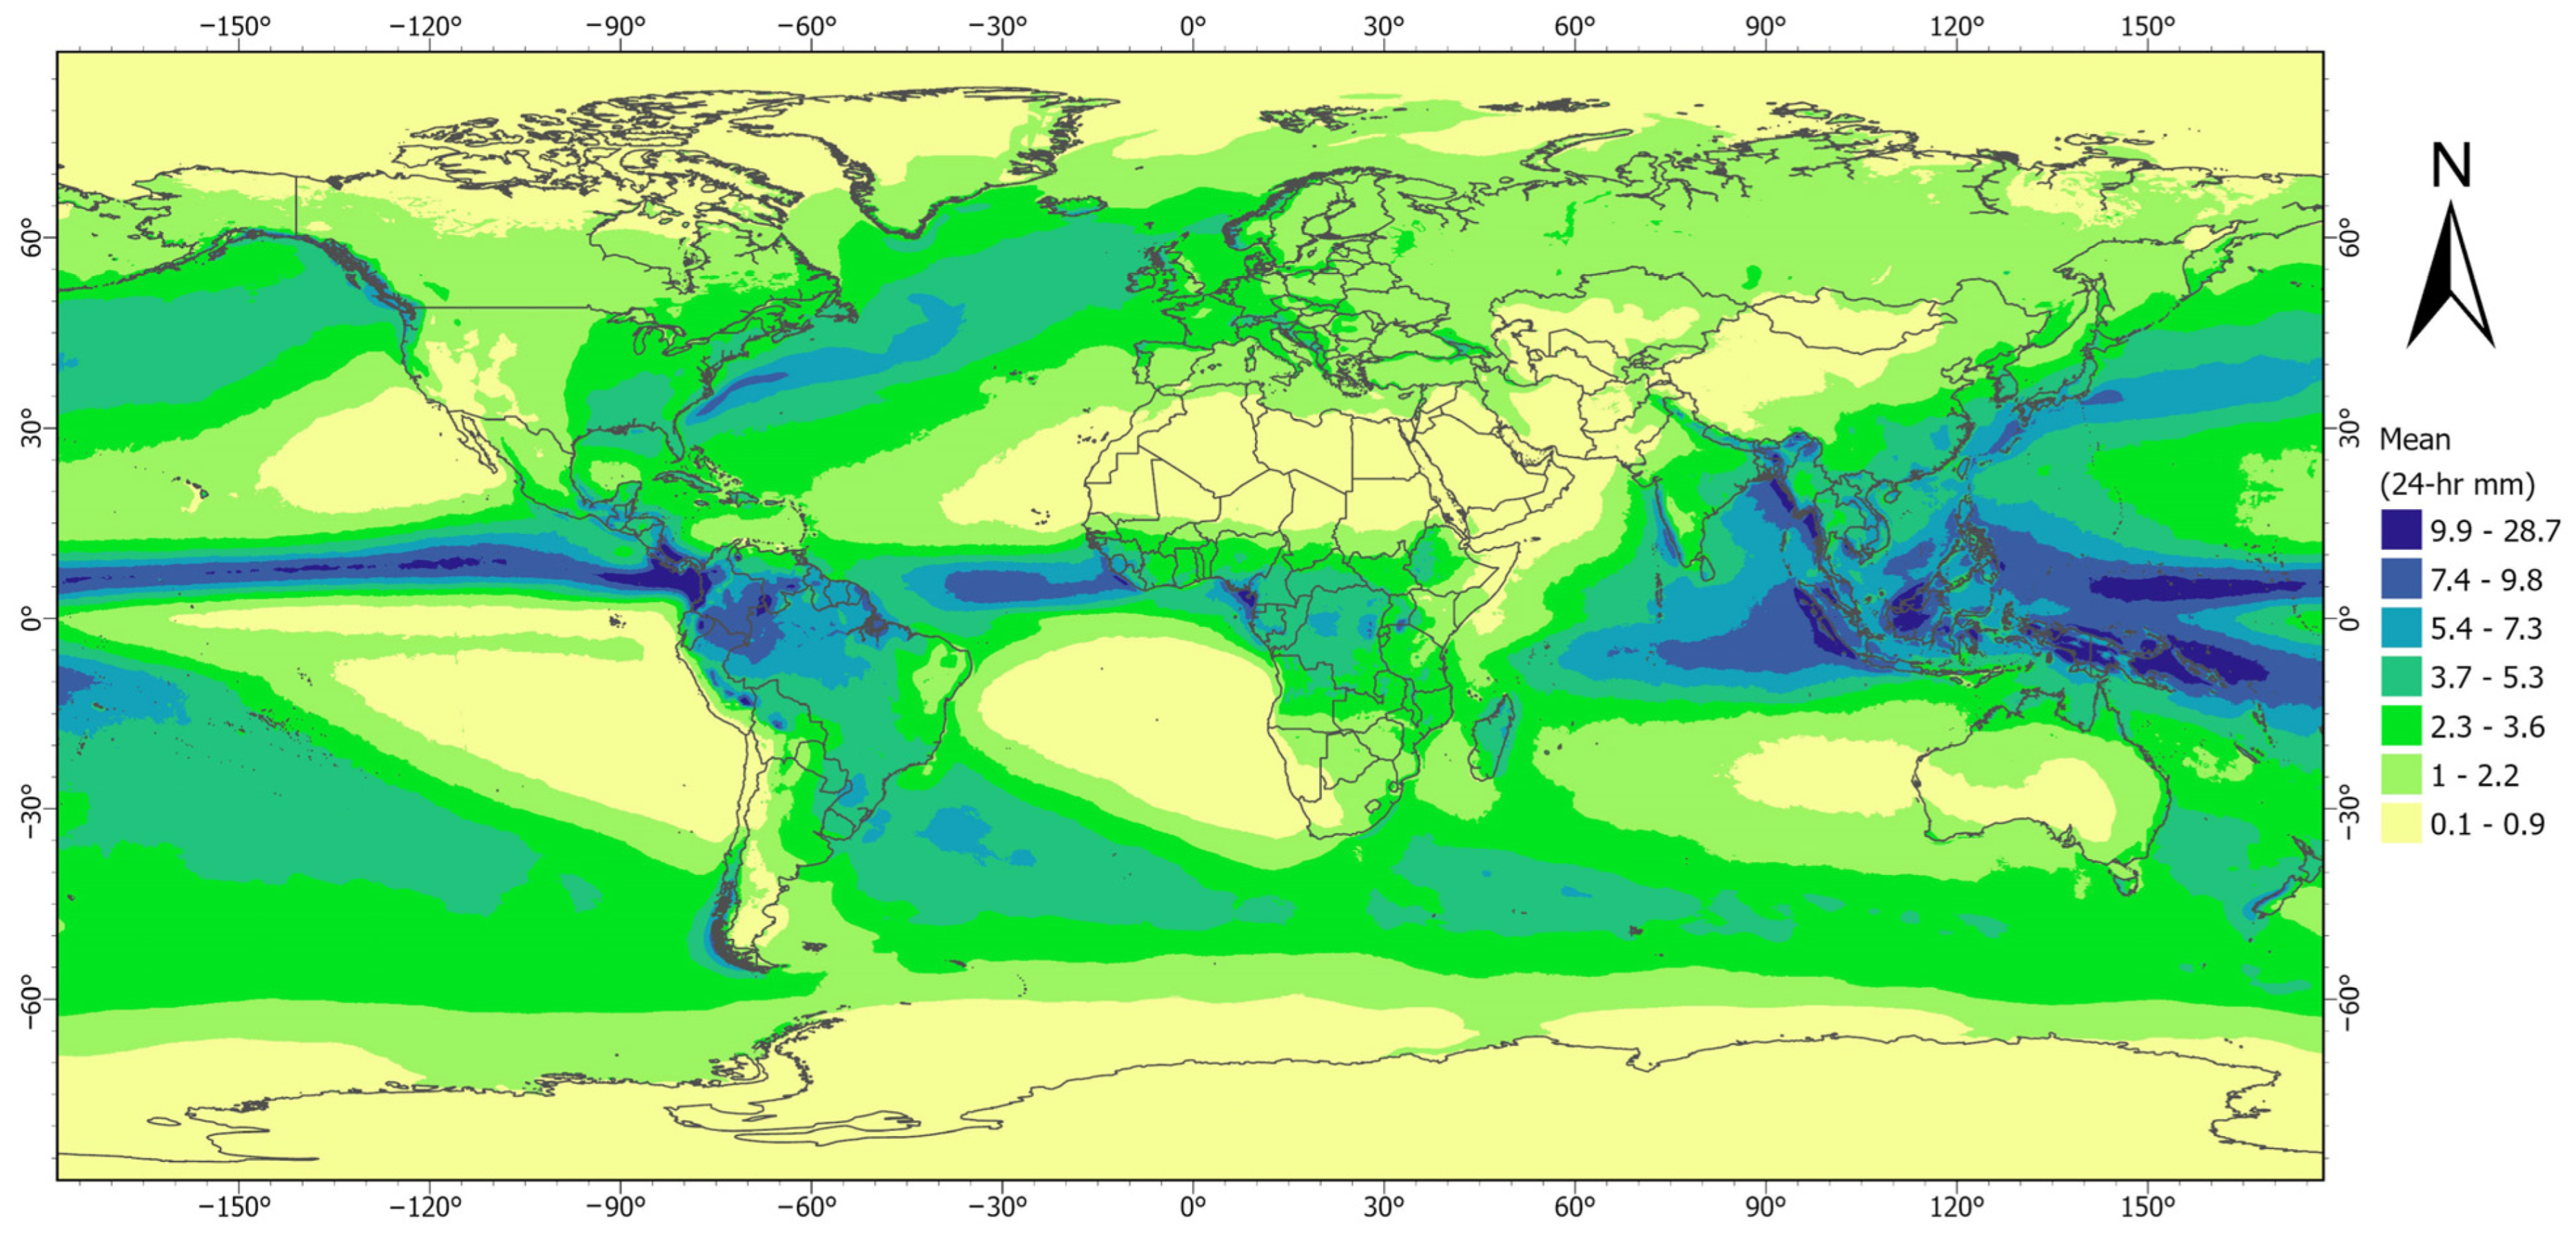
After acquisition, the IMERG V07 monthly precipitation datasets were processed into multiple temporal aggregates to enable trend detection. First, the 324 monthly GeoTIFF (1998–2024) were averaged to calculate 27 annual precipitation grids. From the annual mean maps, an average precipitation map for the full 1998–2024 period was produced, highlighting the high spatial resolution of the IMERG dataset that precisely captures high rainfall areas around the equator and tropics, while lower values are shown in the drier areas of the planet (
Figure 1). These annual grids were then composited into the four climatological seasons: December–February (DJF), March–May (MAM), June–August (JJA), and September–November (SON). In addition, a global mean-annual precipitation raster was produced to capture long-term spatial patterns. To assess variability, we also calculated a coefficient-of-variation (CV) map from the stack of annual precipitation rasters. This multi-temporal dataset, monthly, seasonal, and annual, allowed us to evaluate precipitation changes across different scales. Like earlier studies applying IMERG in climatological analyses [
10,
16], this hierarchical structure ensures that both intra-annual and inter-annual variations can be captured and compared consistently, forming the basis for subsequent non-parametric statistical testing.
To assess precipitation trends, we applied the non-parametric Mann–Kendall (MK) test, which has been widely used in climatology for detecting monotonic trends in hydroclimatic time series [
17,
18,
19]. The MK test was implemented on every grid cell in the monthly, seasonal, and annual IMERG datasets using the Kendall package in R.(R version 4.5.1) For each pixel, we calculated Kendall’s tau coefficient, which measures both the direction and strength of the trend. The resulting tau rasters were exported as continuous maps and further classified to distinguish between positive and negative changes. Statistical significance was tested at the 95% confidence level, and only pixels with
p-values ≤ 0.05 were retained for further interpretation. Aggregating the monthly tau layers into seasonal composites produced a pixel-scale atlas of rainfall trends, enabling comparison of trend behavior across temporal resolutions and providing a robust foundation for evaluating regional precipitation shifts.
To quantify the magnitude of detected changes, we implemented Sen’s slope estimator, a robust, non-parametric technique that complements the Mann–Kendall test by calculating the median rate of increase or decrease in a time series. This method was applied to all grid cells where the MK test identified statistically significant trends at the annual, seasonal, or monthly level. The resulting Sen’s slope plots provide a measure of rainfall change expressed in millimeters per year, allowing spatial comparison of intensifying and declining precipitation regimes. To further illustrate these results, scatterplots of Sen’s slopes were generated for regions showing significant positive and negative tau values in both the annual and seasonal analyses. This dual approach, MK for detection and Sen’s slope for magnitude quantification, has been widely applied in precipitation studies [
20,
21] and ensures that both the direction and magnitude of global rainfall changes are systematically captured.
3. Results and Discussion
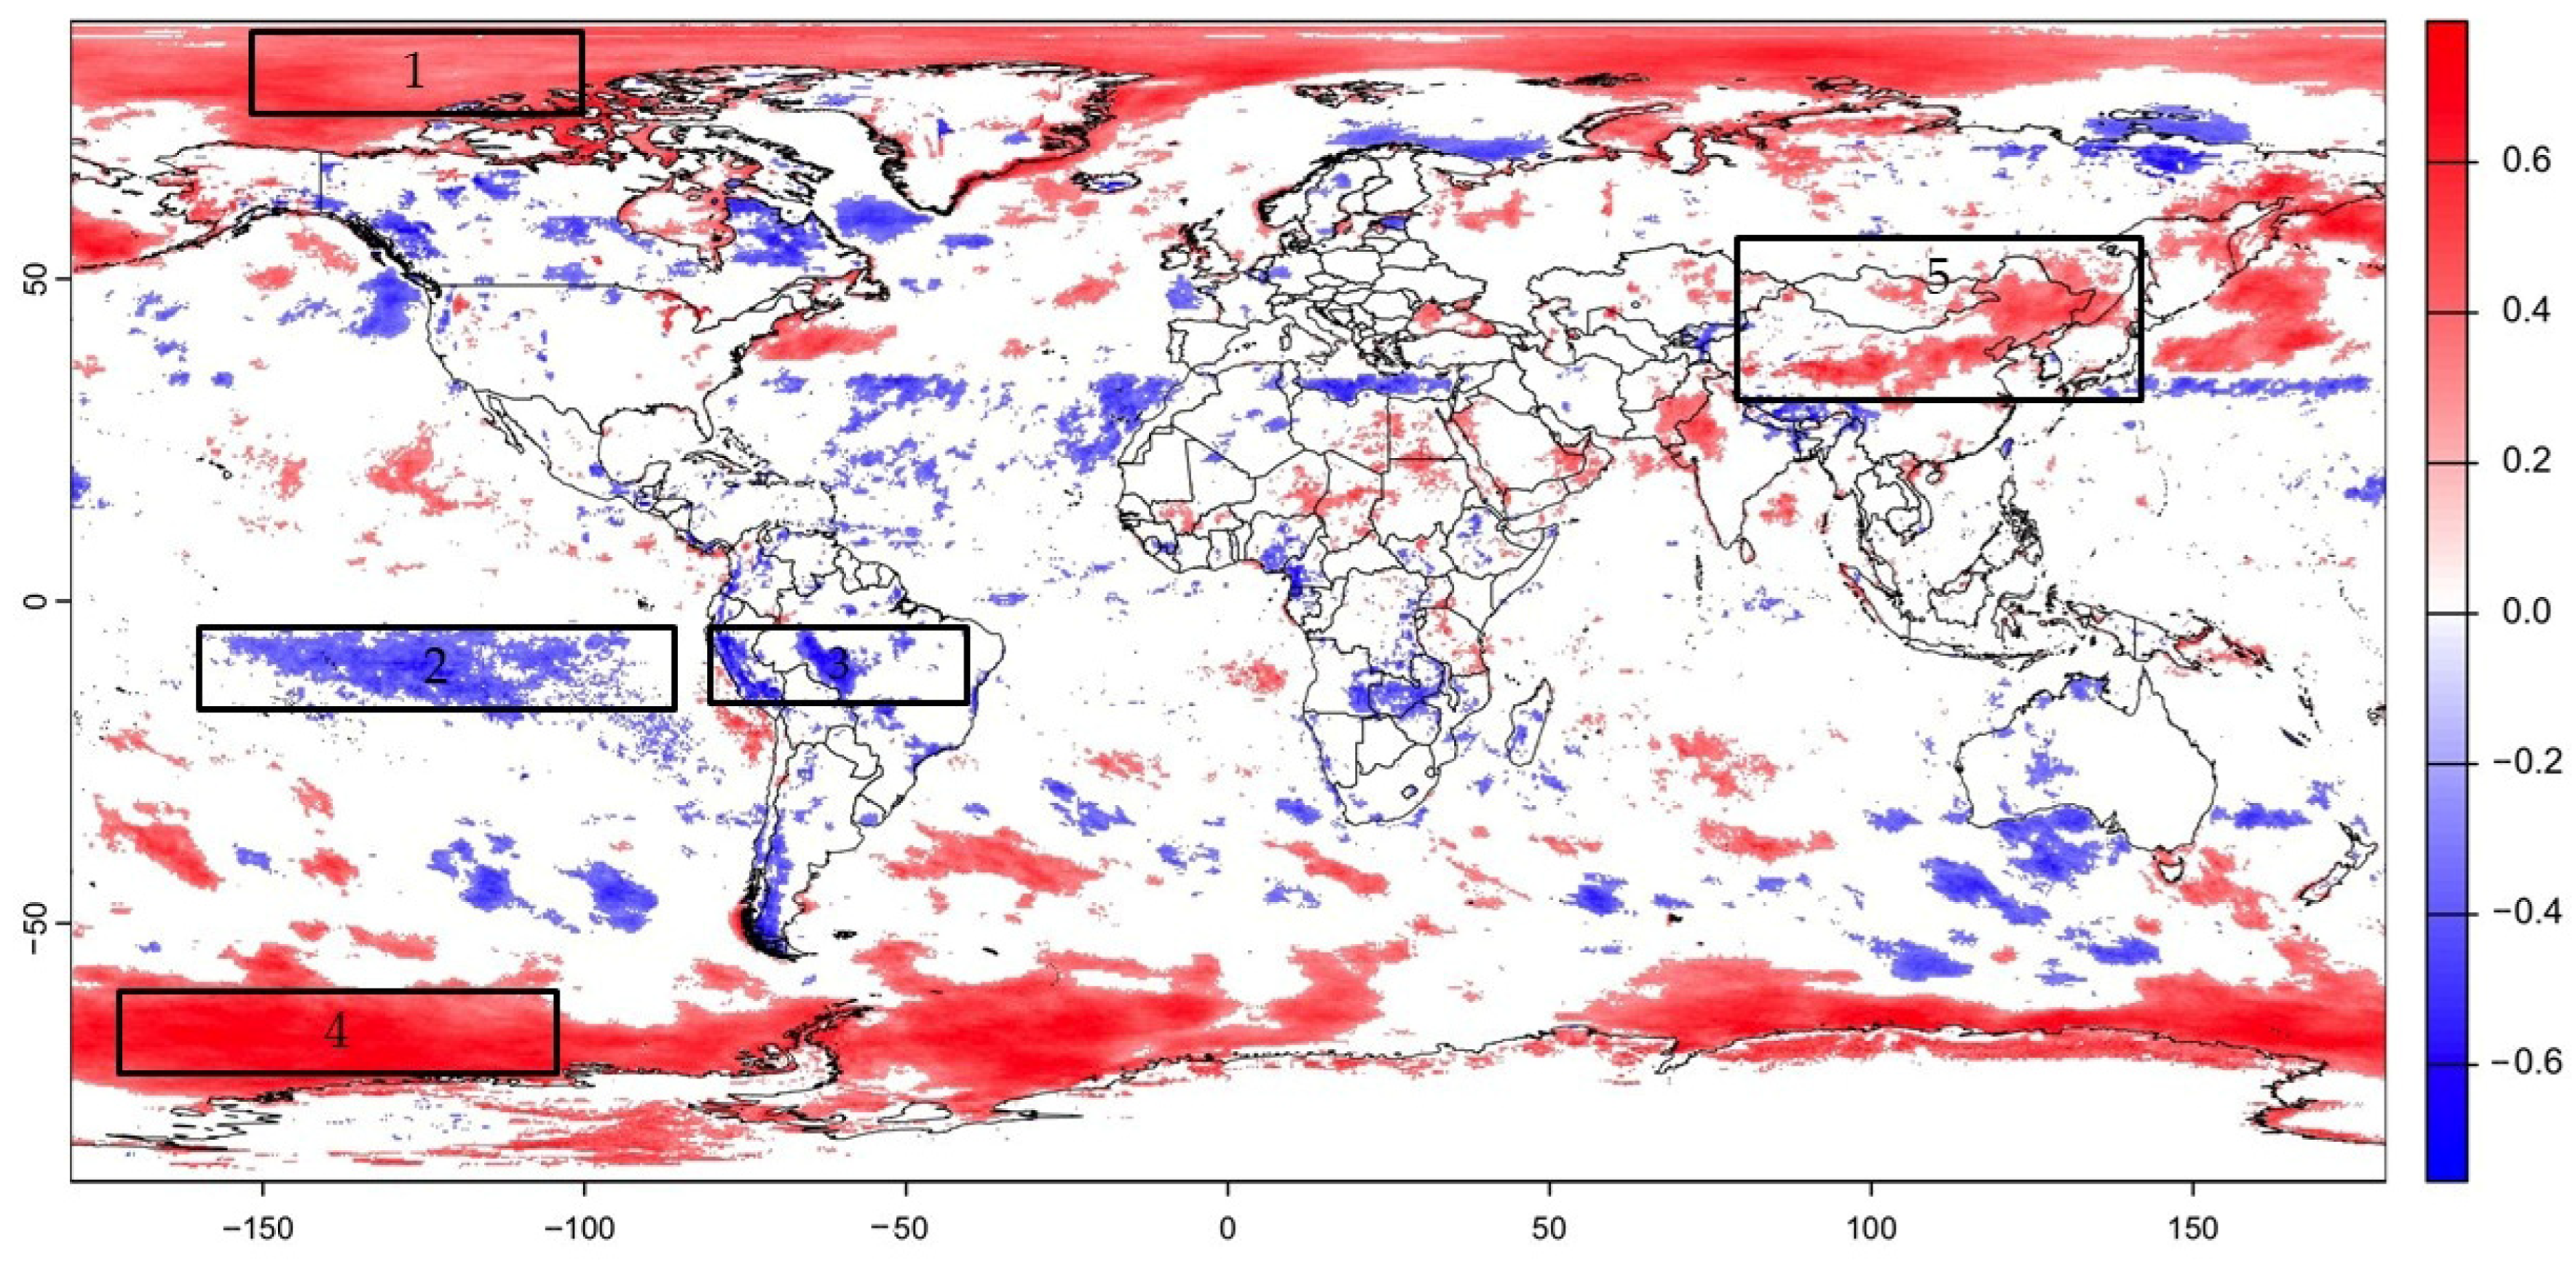
The annual trends map highlights six regional clusters of statistically significant changes in global precipitation for the 1998–2024 period; the Arctic Ocean, the Southern Ocean, the tropical East Pacific, tropical South America, and Northern China (
Figure 2). The areas that showed the most statistically significant increasing trends (Tau coefficients of >0.4) at the annual level were the Arctic and Southern Oceans (
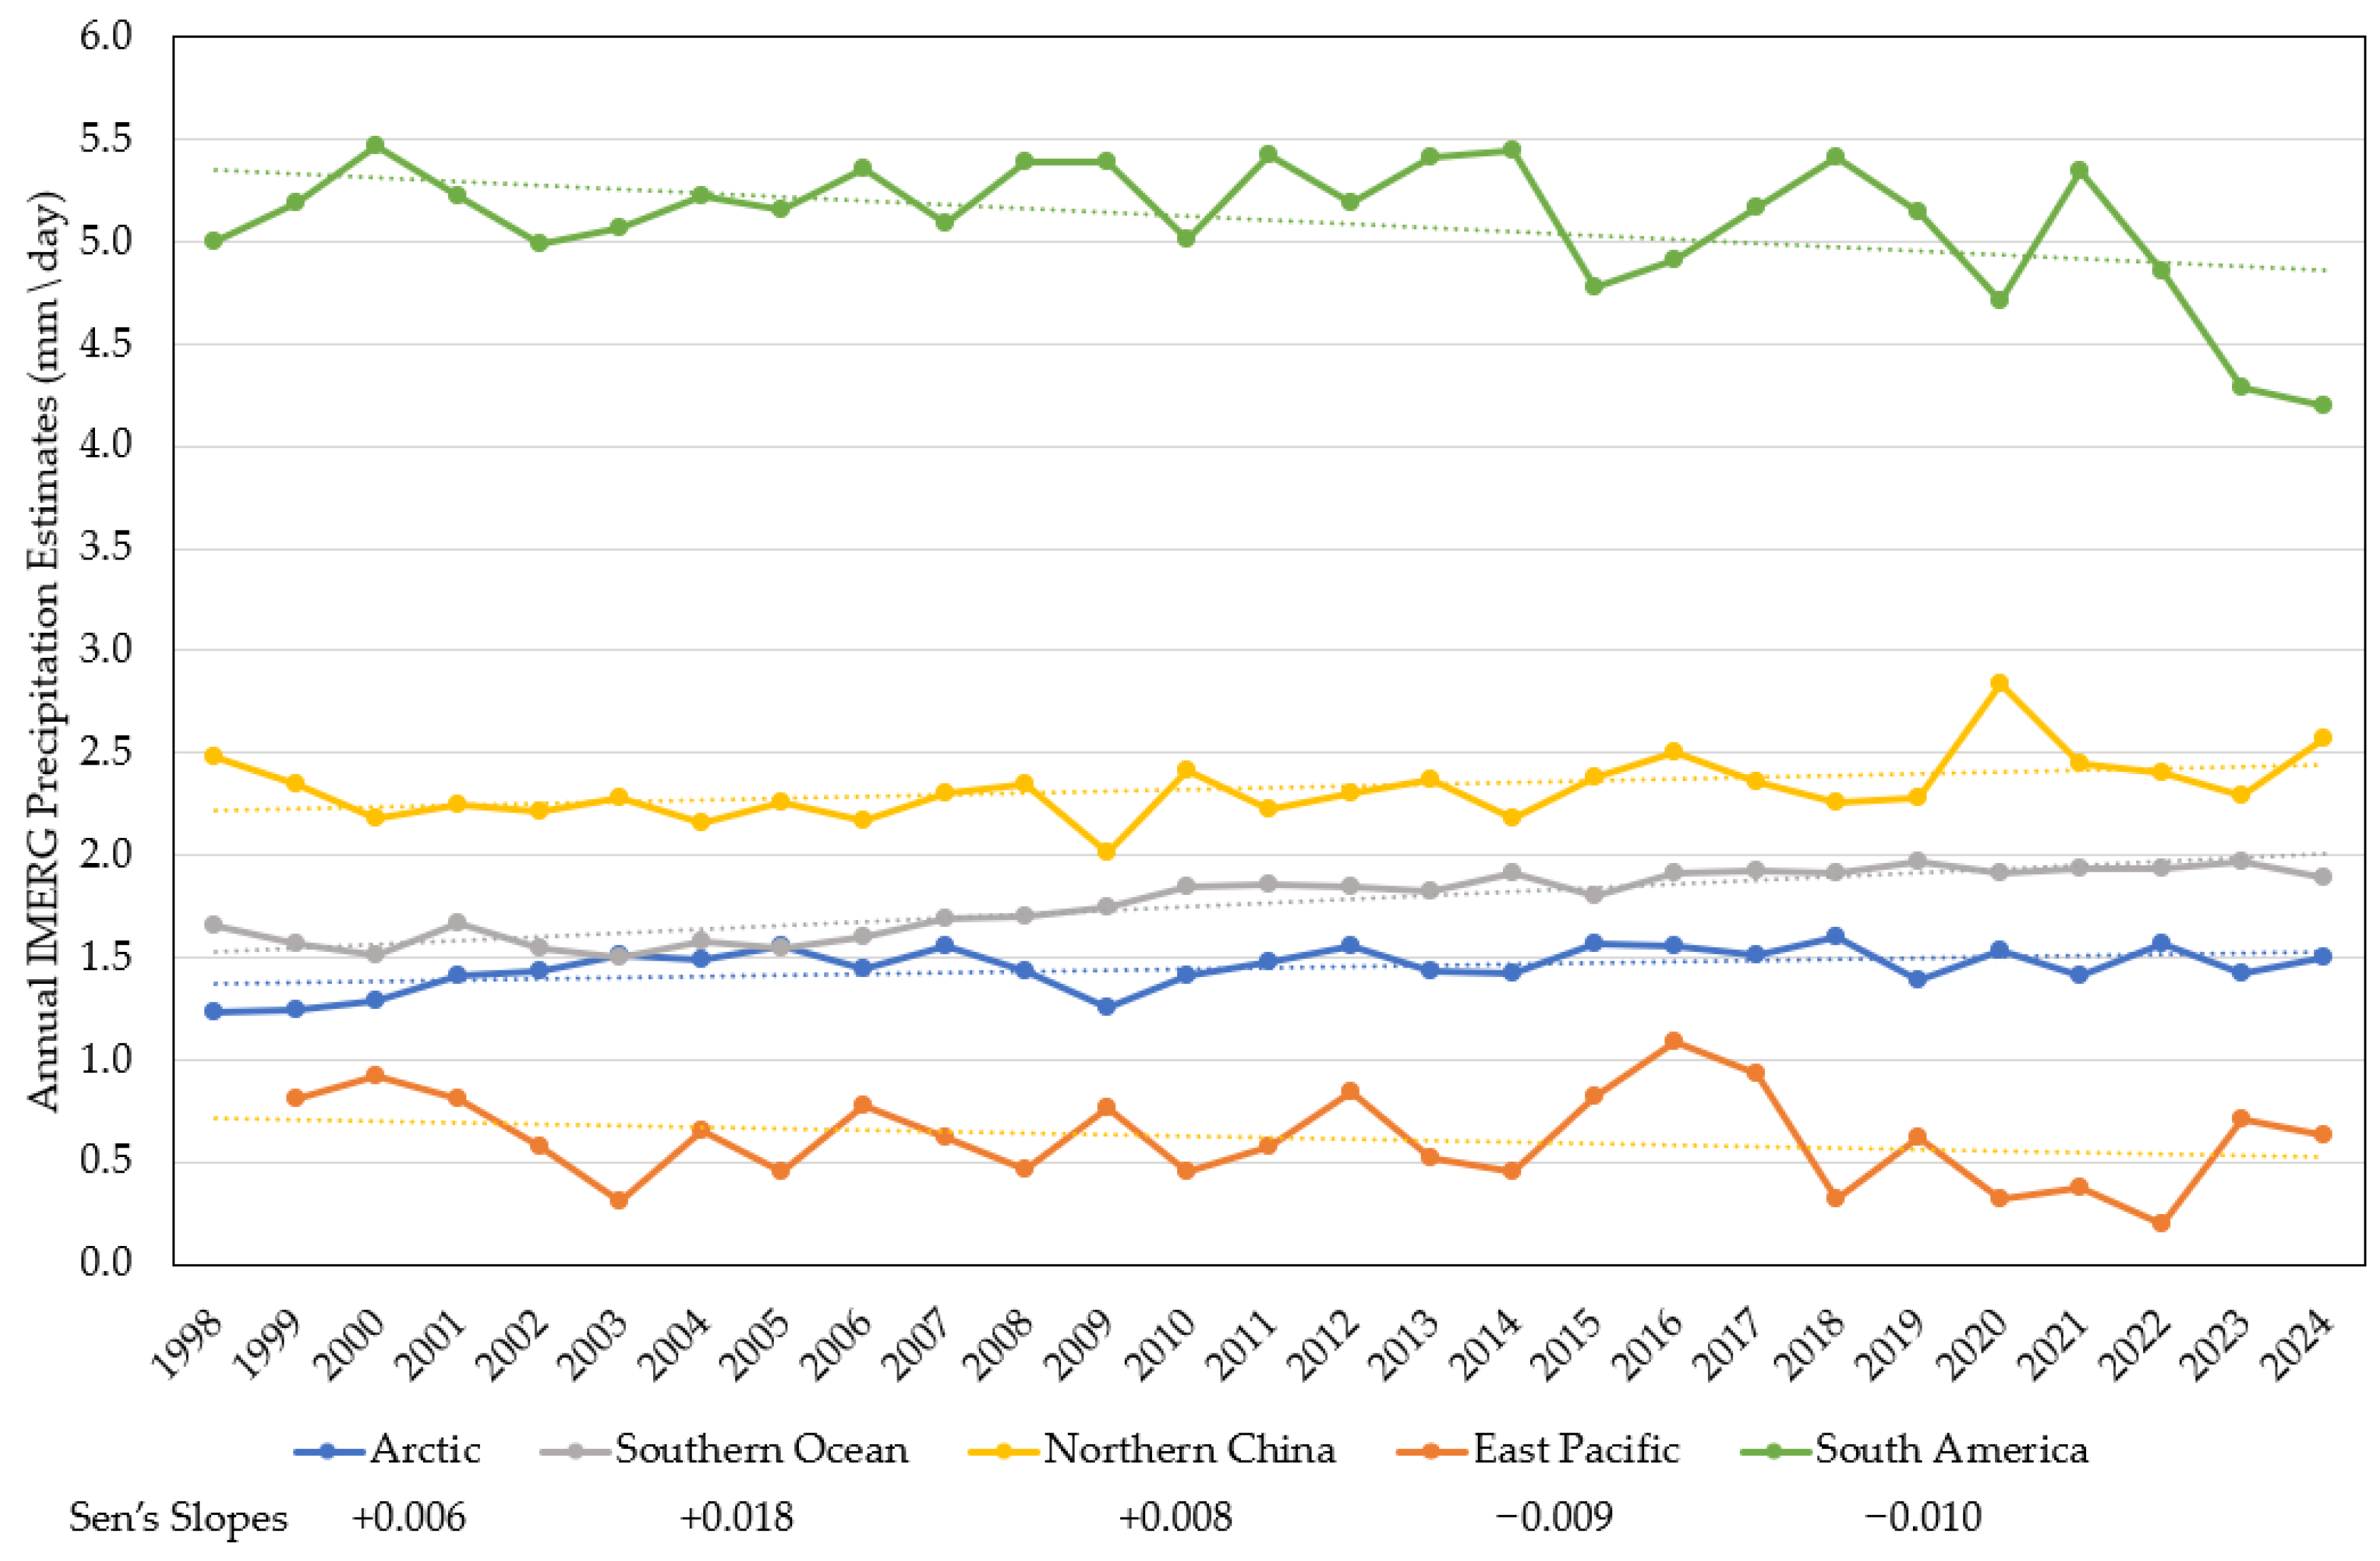
Figure 2), with annual precipitation increases by +0.007 mm/day and by +0.02 mm/day, respectively (
Figure 3). These findings coincide with recent studies that suggest that a warming of the Arctic Ocean is causing an increase in the number of rainy days and a decline in snow days [
22], and that the transition from a snow- to rain-dominated regime is projected to occur decades earlier and at a lower level of global warming than shown in climate models [
23,
24].
Northern China shows increases of +0.008 mm/day. These results agree with recent research that shows that extreme precipitation has intensified across Northern China, particularly after 2010 [
25,
26]. The tropical East Pacific and northern-central South America show annual declines of −0.01 mm/day. These results agree with research that has found drying trends over the tropical east Pacific linked to SST anomalies [
27], persistent declines and severe drought episodes in central South America [
28], and decreasing precipitation across much of central-southern Africa [
29].
In the Northern Hemisphere winter (DJF), five main clusters dominate the precipitation trends for the 1998–2024 period (
Figure 4a). The main clusters of statistically significant increasing trends of precipitation are found over the northwest Pacific Ocean and over the Arctic Ocean (
Figure 4a), especially during the months of January and February (
Figure 4c,d) reinforcing the annual patterns and suggesting that warmer higher latitudes could cause an increase in the number of rainy days [
22,
23]. The strongest increase in precipitation in terms of magnitude is found in the northwest Pacific Ocean, with a Sen’s slope of +0.05 mm/day (
Figure 5). The Southern Ocean also shows strongly positive trends (
Figure 4a) and the Sen’s slope indicates clear wetting of +0.01 mm/day, especially during the months of December and January (
Figure 4b,c). In the Eastern Tropical Pacific Ocean west of Peru, a broad declining trends band aligns with the subsiding flanks of the ITCZ (
Figure 4a), with a Sen’s slope of −0.009 mm/day (
Figure 5), showing that decreases in precipitation in the area have occurred during all months of the DJF season (
Figure 4b–d). As with all cold-season oceans, interpretation should account for known high-latitude limitations and seasonal biases, particularly snowfall/rain partitioning and sparse gauge anchors, which remain among the least mature parts of the observing system [
30].
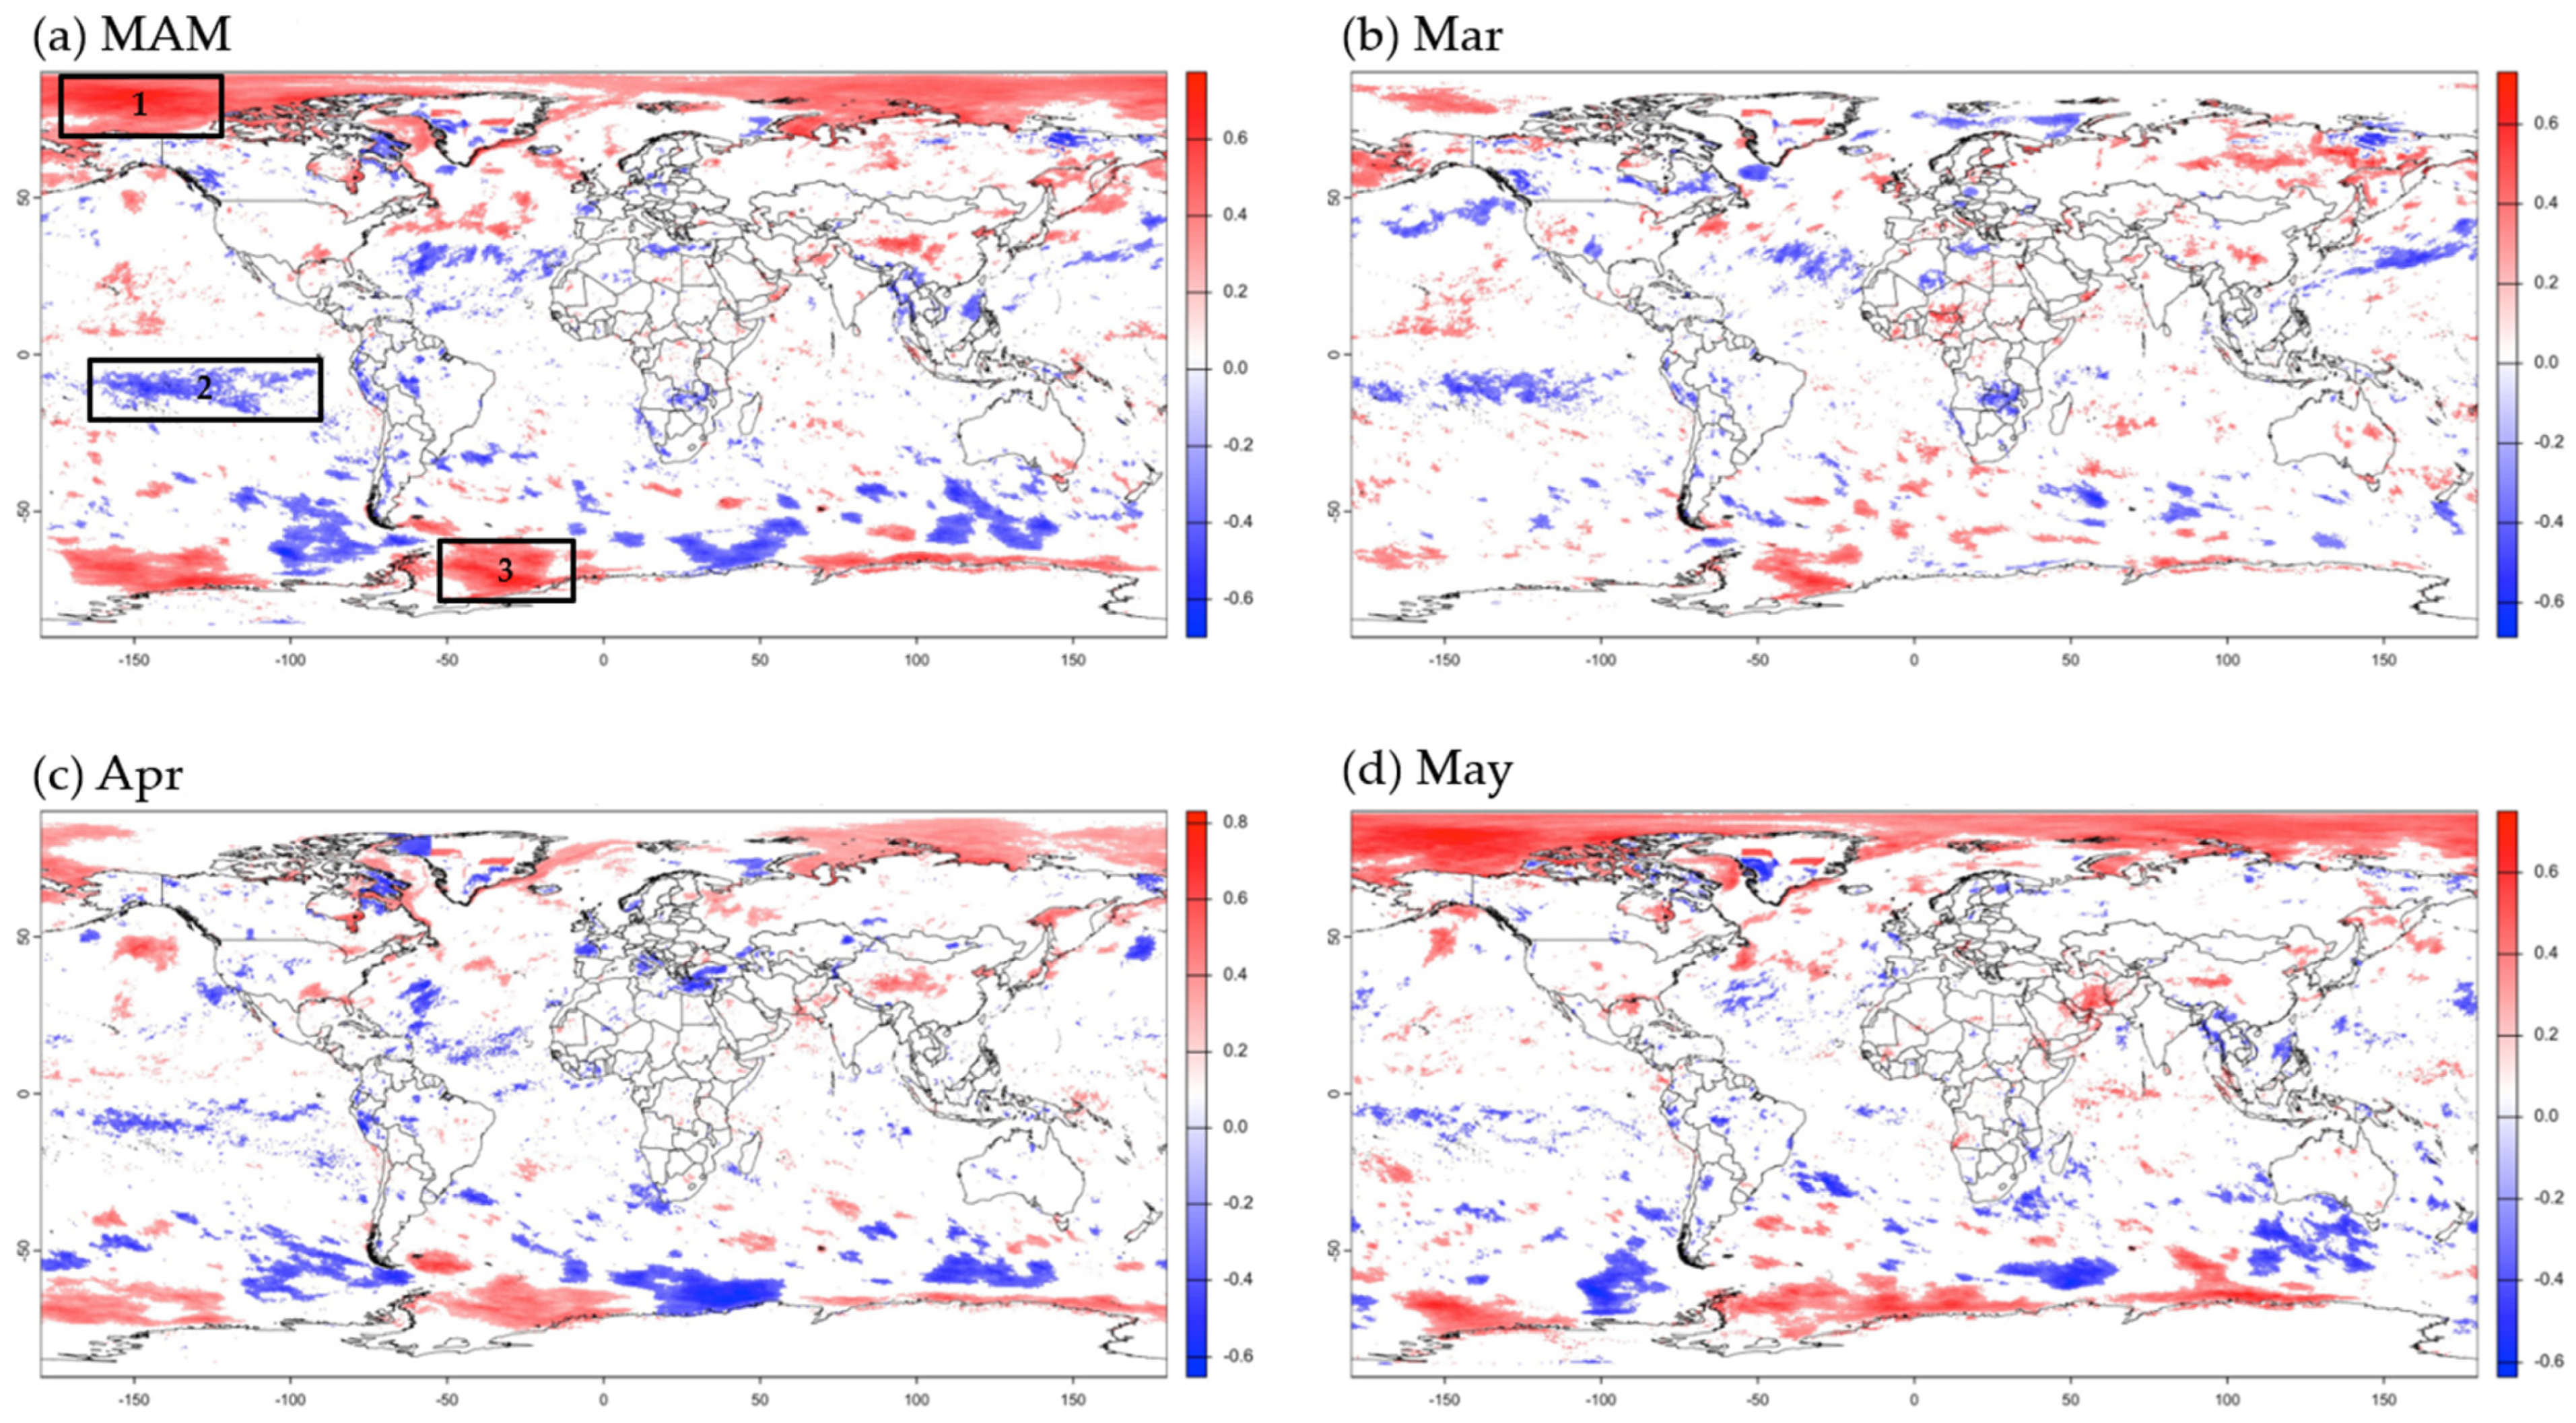
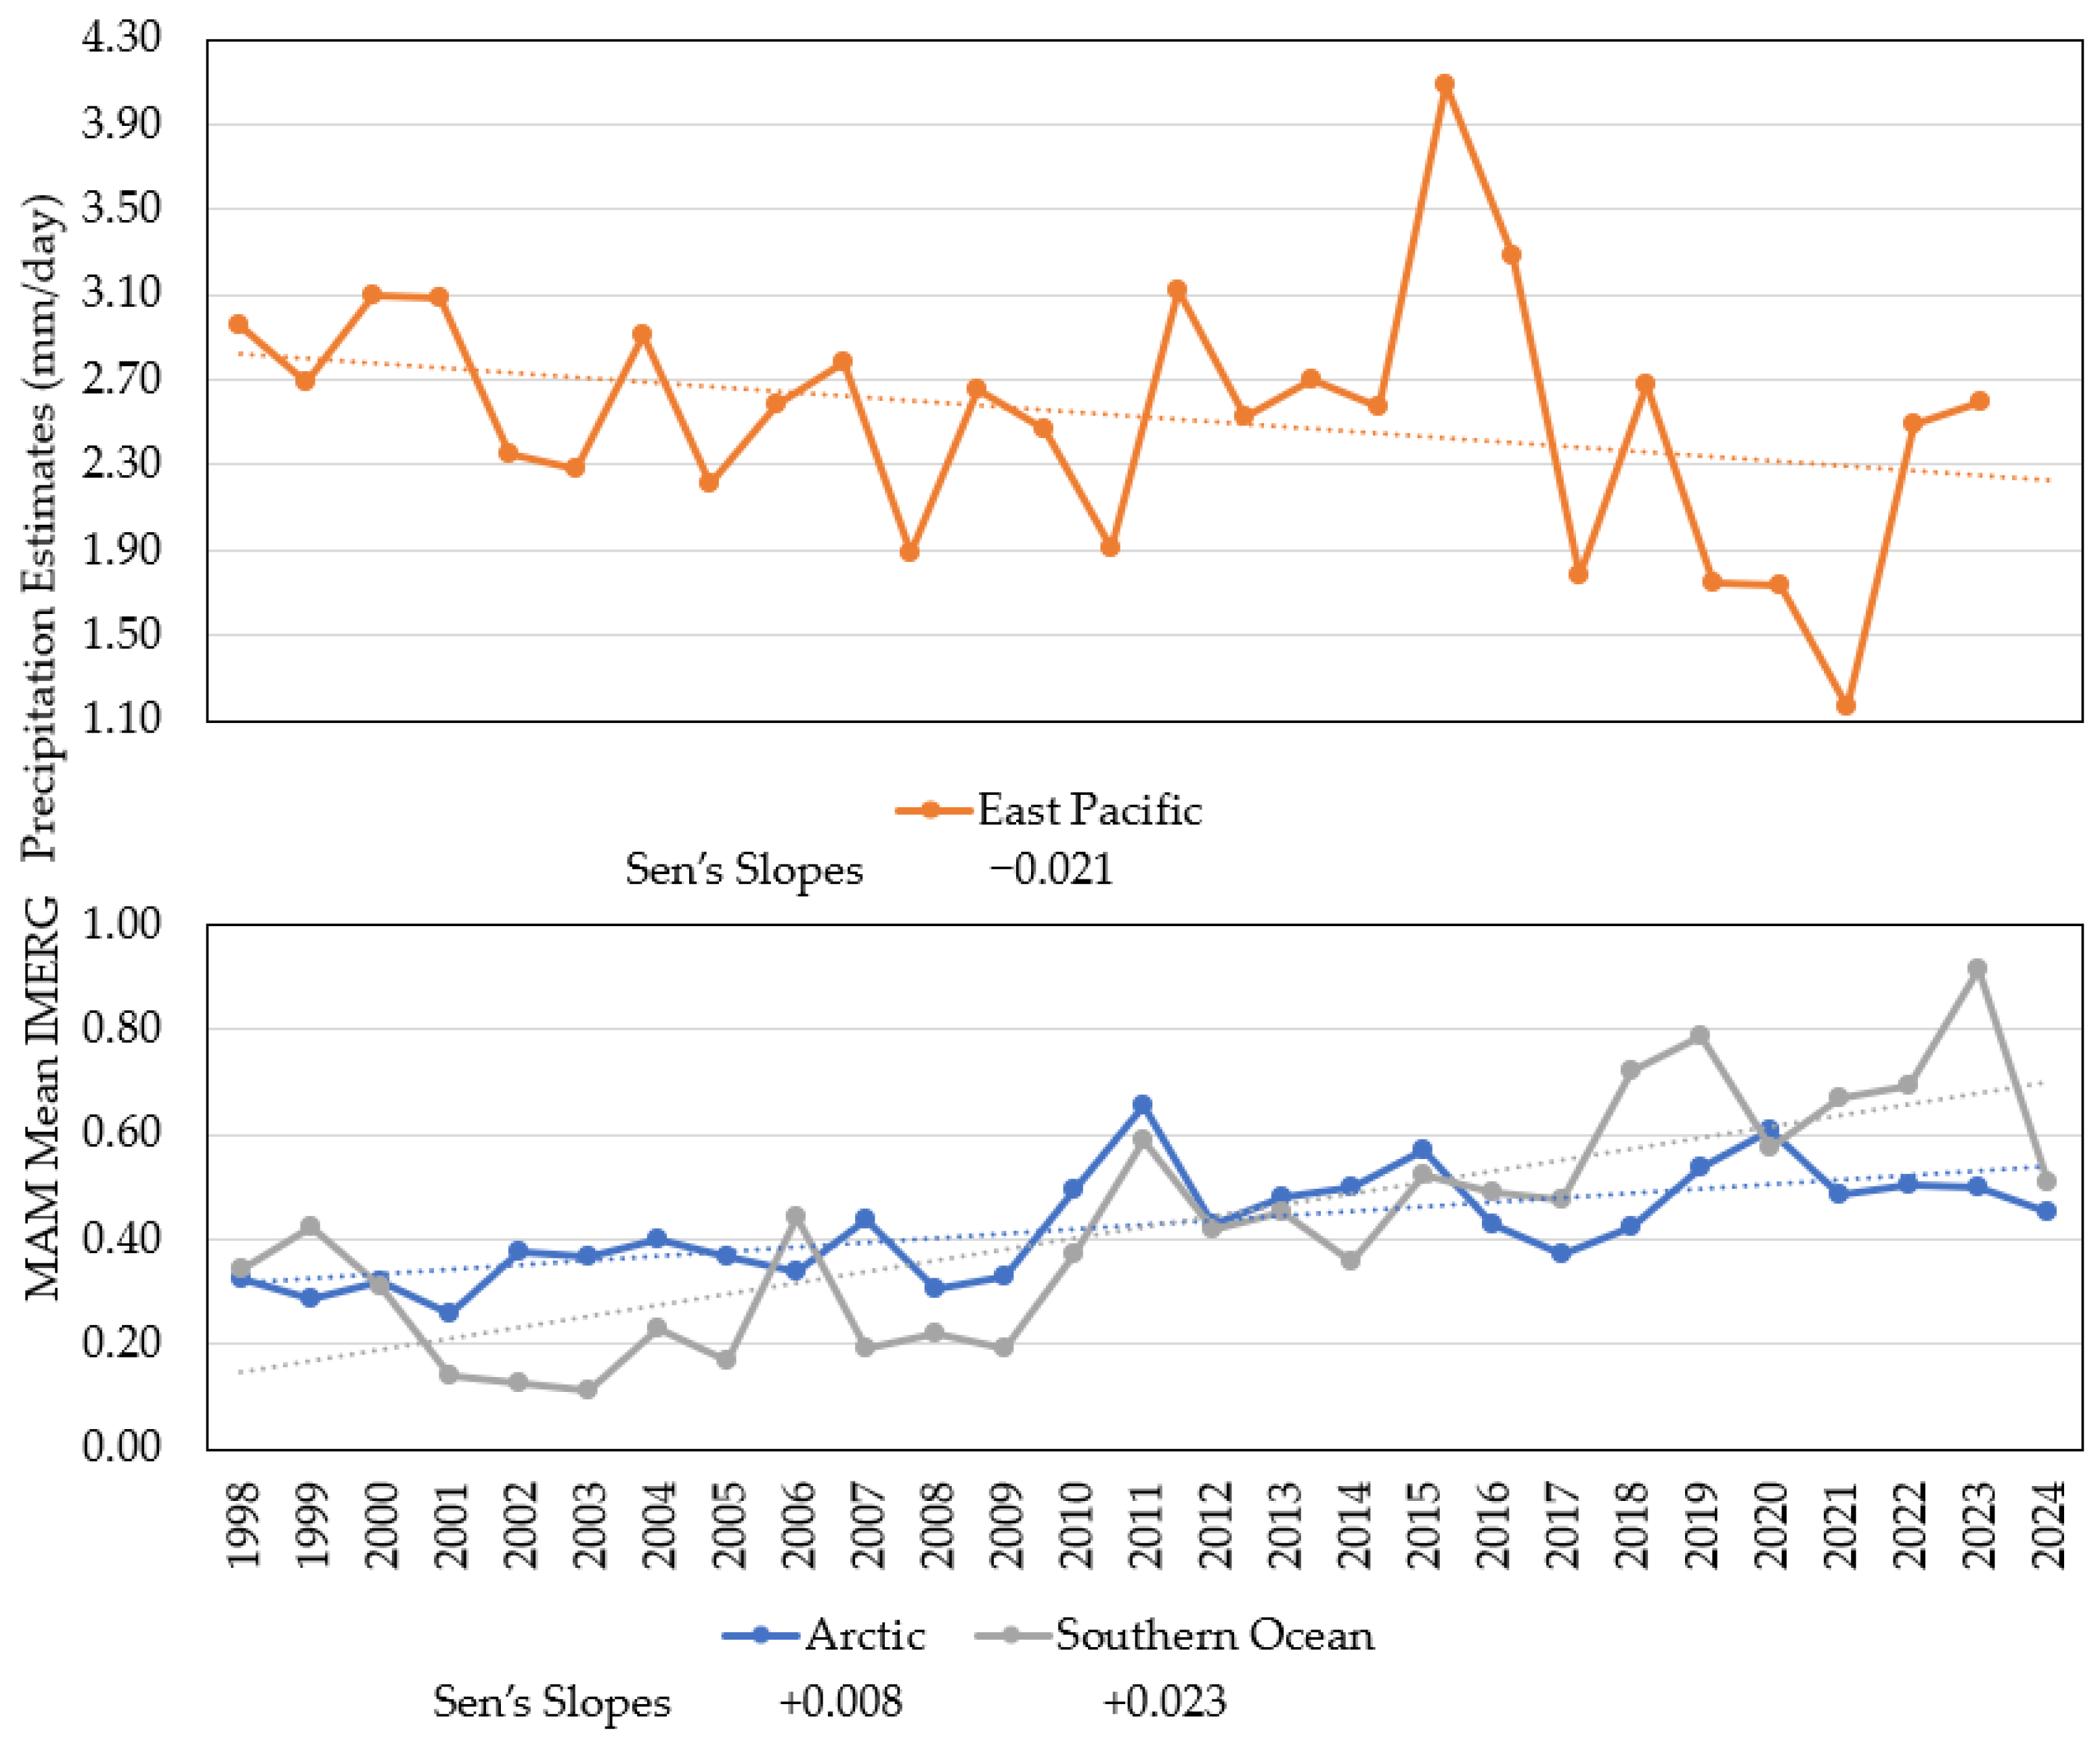
The results for spring/autumn (MAM) show three main regions with significant trends in global precipitation (
Figure 6). As in with the annual and DJF results, the Arctic Ocean also exhibits significant increasing trends in precipitation for the season and especially during the month of May (
Figure 6a,d). The Arctic Ocean has a Sen’s slope of +0.009 mm/day (
Figure 7), which is consistent with studies that link a warmer, moister atmosphere to intensified high-latitude precipitation [
22,
23,
24]. The Southern Ocean surrounding Antarctica also shows significant increasing trends for the season and particularly for the months of April and May (
Figure 6a,c,d), with a Sen’s slope of +0.02 mm/day, higher than the one found in the Arctic Ocean. Significant drying patches were also found in the tropical East Pacific, in the North Atlantic, and in multiple smaller areas in the Southern Ocean (
Figure 6a–d). The area with the most consistent decline was the tropical East Pacific with Sen’s slopes of −0.02 mm/day, especially for the month of March (
Figure 6b). It is important to note that these findings coincide with recent work that has shown a decline in precipitation in the tropical East Pacific [
26,
27].
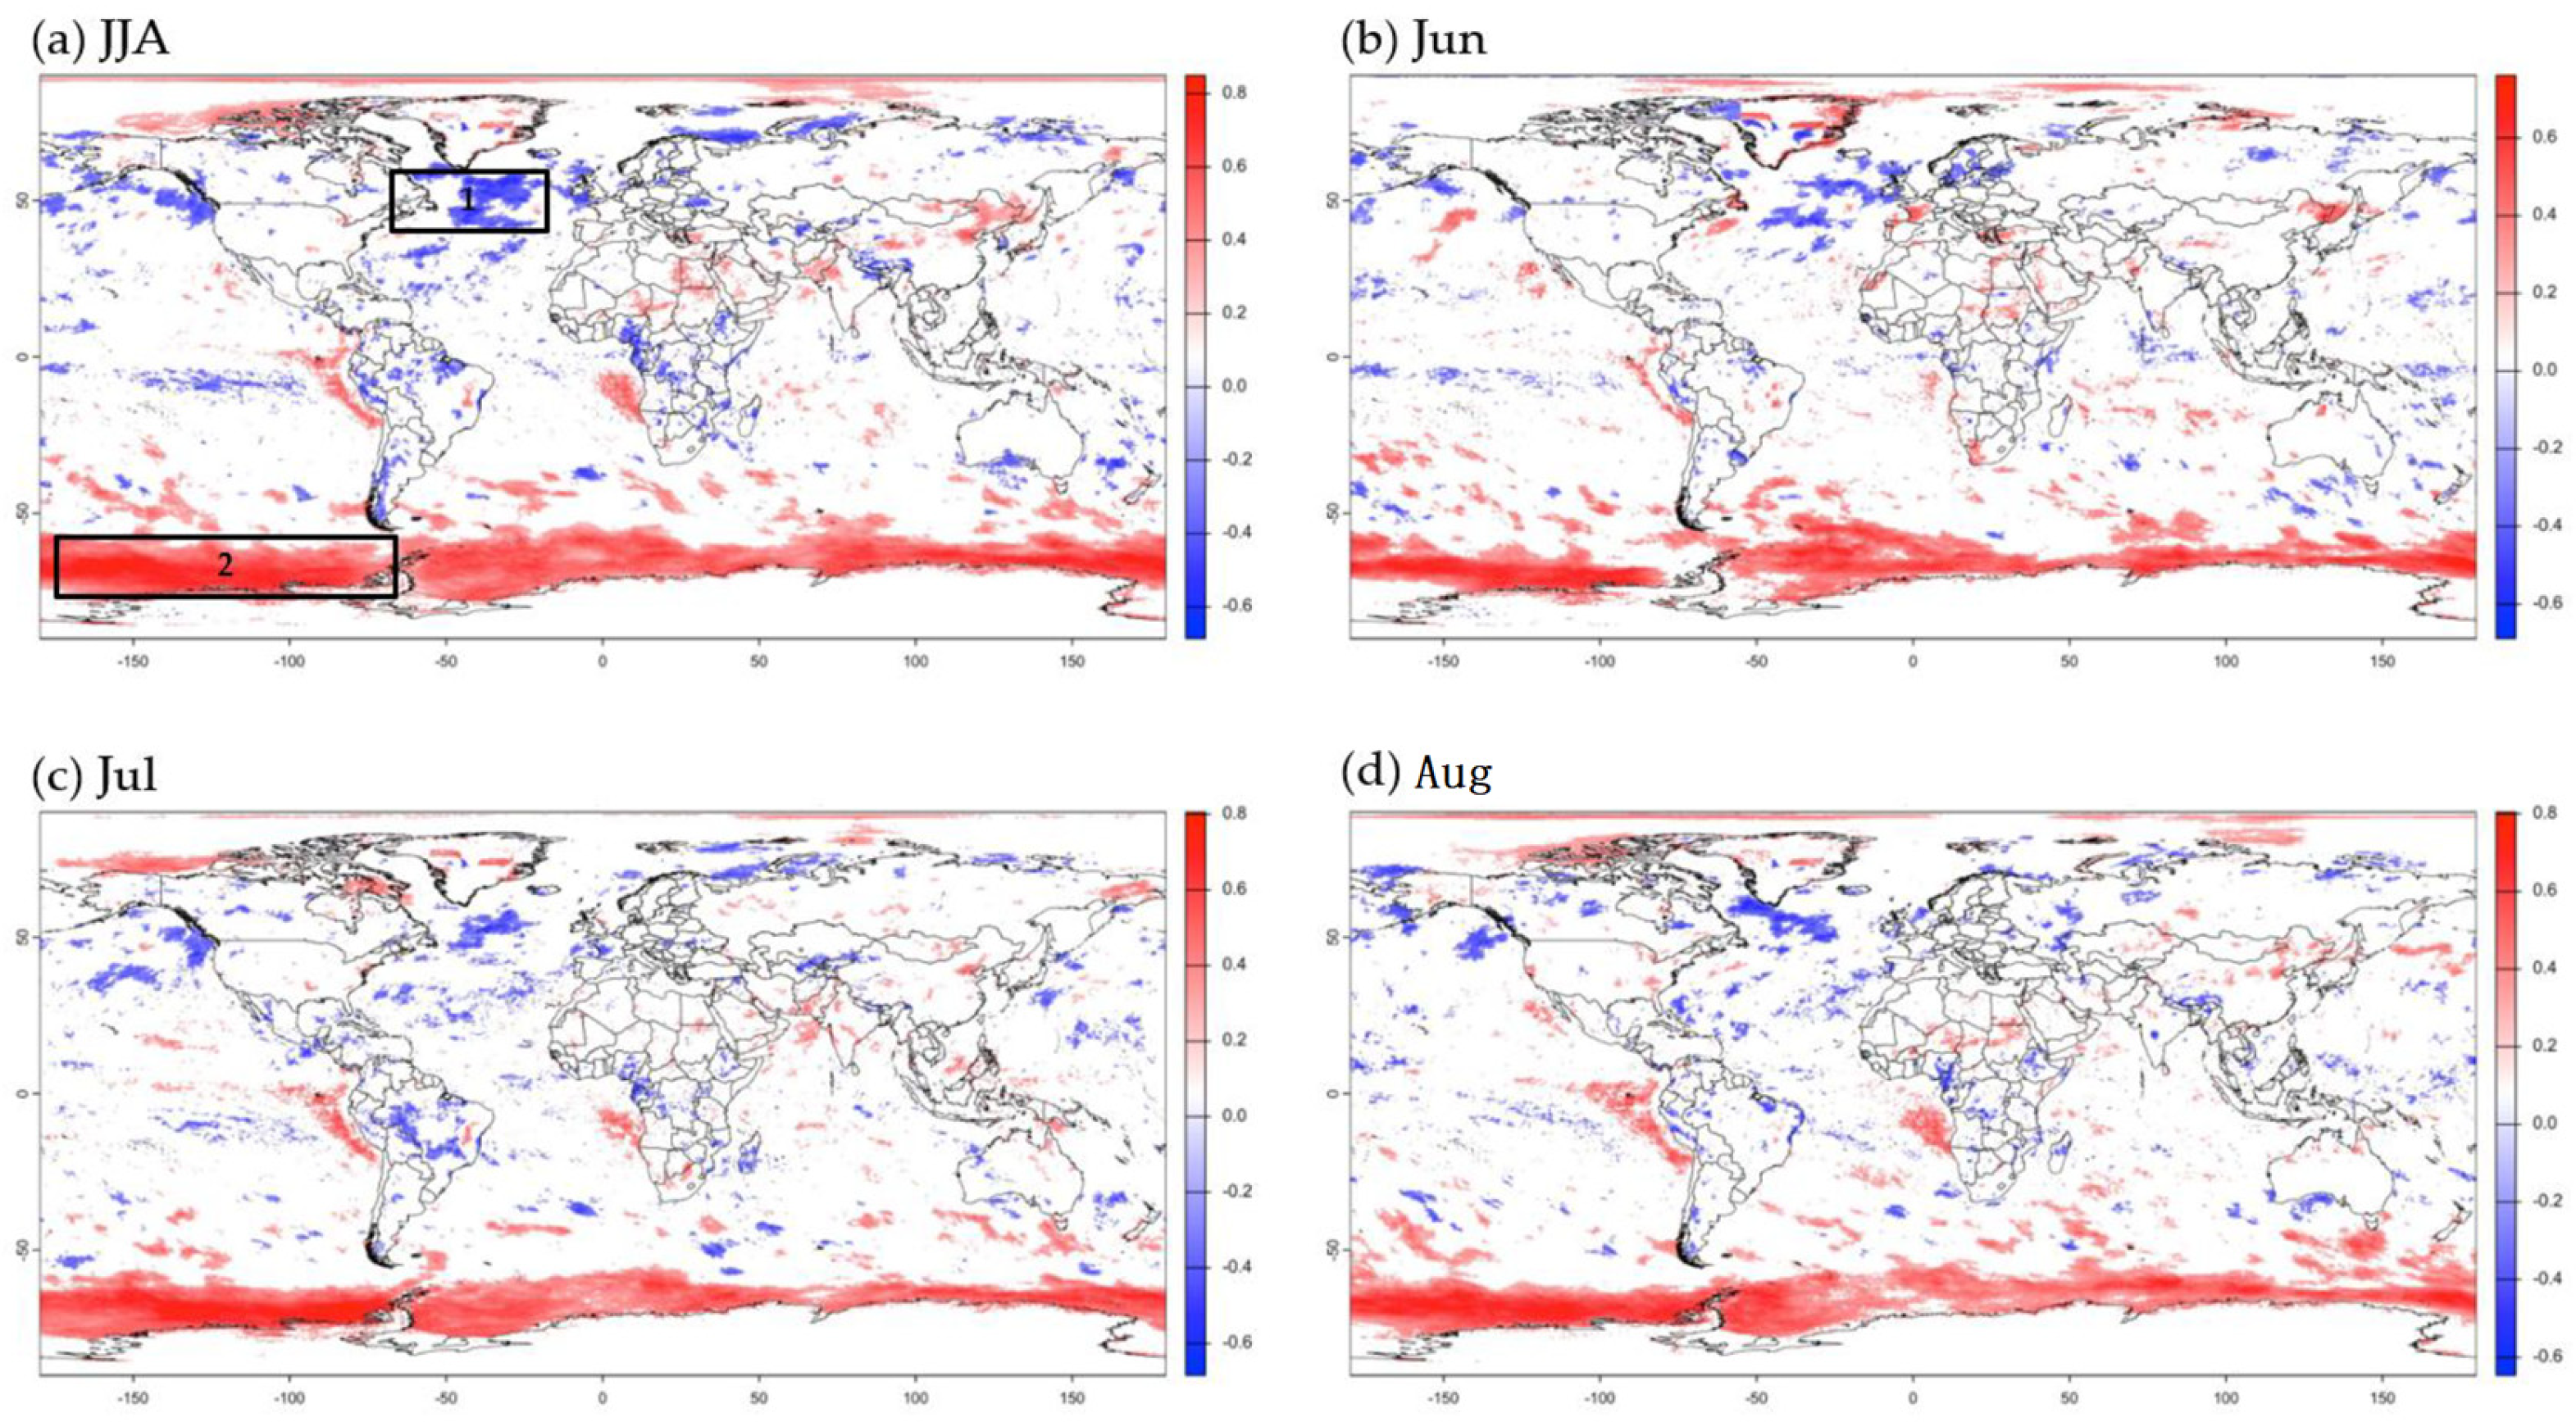
The results for summer/winter (JJA) show two regions where significant changes in precipitation were identified during the 1998–2024 period (
Figure 8a), the Southern Ocean and the North Atlantic. The area that shows the most significant trends is found in the Southern Ocean during the whole season and the individual months (
Figure 8a–d), and the Sen’s slope confirms a strong wetting of +0.03 mm/day (
Figure 9). These findings agree with work that examined how warming of the Southern Ocean, particularly driven by loss of sea ice from the Antarctic ice sheet, has been shown in recent modeling work to enhance rainfall over the adjacent mid and subtropical Southern Hemisphere oceans [
31,
32]. In contrast, the North Atlantic patch south of Greenland exhibits a significant cluster of declining JJA precipitation (
Figure 8a) with a Sen’s slope of −0.06 mm/day (
Figure 9). These findings coincide with research that has found that the accelerated melting of the Greenland Ice Sheet injects freshwater into the subpolar North Atlantic, enhancing upper-ocean stratification and surface stability, which reduces convection and ocean–atmosphere heat fluxes, thereby promoting more persistent summer North Atlantic Oscillation (NAO) like circulation patterns that weaken cyclogenesis and ultimately lead to declines in JJA rainfall in the North Atlantic south of Greenland [
33,
34,
35,
36].
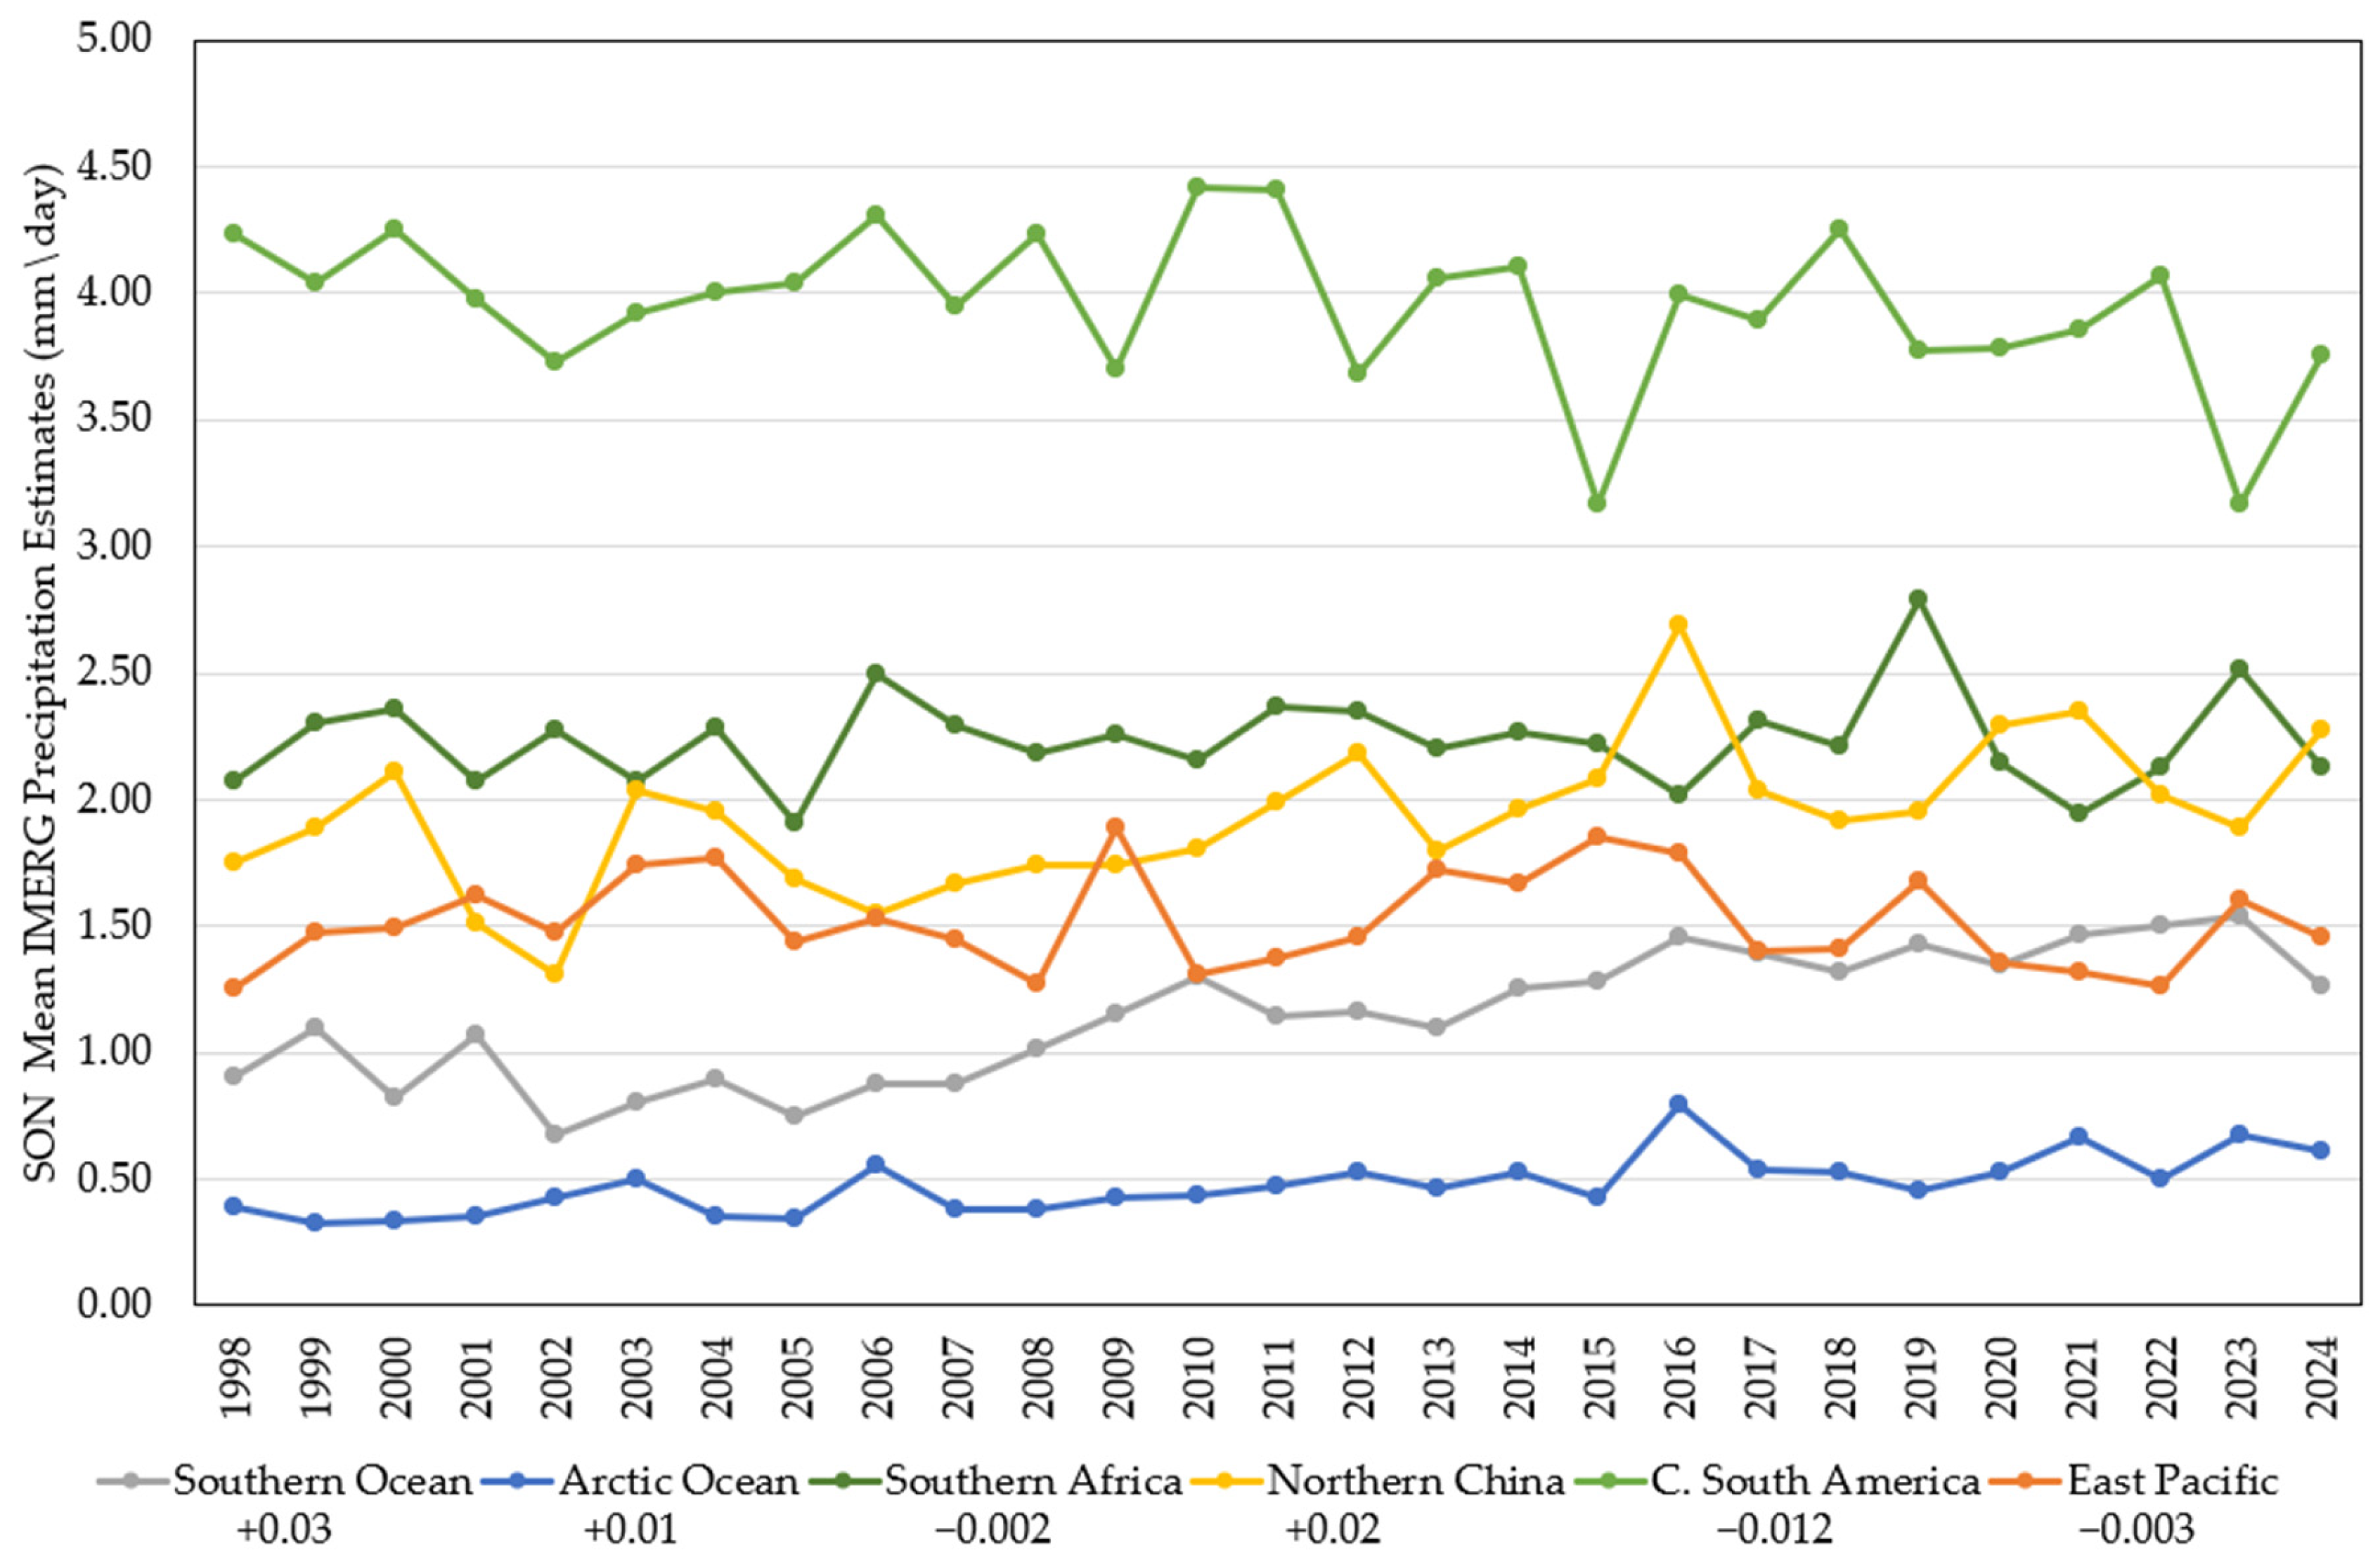
For the autumn/spring season (SON), six regions exhibit statistically significant trends in precipitation for the 1998–2024 period. The Southern Ocean around Antarctica shows the most prominent belt of significant increases in precipitation in all months (
Figure 10a–d), with a Sen’s slope of +0.03 mm/day (
Figure 11), while the Arctic Ocean shows a parallel high-latitude wet ring in the north but with a lower magnitude of +0.004 mm/day (
Figure 11). It is important to note that of all of the seasons analyzed in this study, SON is the one that shows both the Arctic and Southern Oceans as areas experiencing increasing trends in precipitation for the 1998–2024 period. Along the tropics, the tropical East Pacific stands out as a zone that continues to show a decreasing trend in all months (
Figure 10b–d) with a Sen’s slope of −0.003 mm/day (
Figure 11). In Asia, Northern China continues to show a significant increasing trend, especially in the month of November (
Figure 10d) with a magnitude of +0.02 mm/day) (
Figure 11). Central-southern Africa shows a patch of decreasing trends, especially in the month of November (
Figure 10d) with a magnitude of −0.002 mm/day (
Figure 11). Northern South America likewise trends negative in the months of September and October (
Figure 10b,c) with widespread decreasing precipitation along the Amazon and upper Madeira basins (−0.01 mm/day) (
Figure 11).
The Sen’s slope analysis reveals distinct regional and seasonal behaviors in mean precipitation trends, with several regions exhibiting consistent persistence across seasons (
Table 1). The Southern Ocean stands out as the most persistently increasing region, with positive slopes in all periods, from +0.018 annually to notable peaks of +0.037 in JJA and +0.03 in SON, indicating a steady intensification of precipitation year-round (
Table 1). The Arctic Ocean similarly shows consistent positive trends across seasons, particularly strong in DJF (+0.043) and modest in MAM (+0.008) and SON (+0.010), suggesting sustained high-latitude wetting (
Table 1). The highest Sen’s slope (+0.048) was found in the high latitudes of the north Pacific during the DJF period. In contrast, the North Atlantic shows the sharpest decline of all selected regions, with a −0.061 slope in JJA, underscoring a significant summer drying trend. Other regions display mixed patterns: the East Pacific shows consistent but moderate declines across multiple seasons, while South America maintains negative slopes in both the annual (−0.010) and DJF (−0.008) periods, indicating persistent drying. Northern China shows a weak positive signal, strongest in SON (+0.020), hinting at localized late-year intensification (
Table 1). Overall, these results highlight the dominance of persistent precipitation increases in the Southern and Arctic Oceans, contrasting with pronounced drying signals in the North Atlantic and tropical–subtropical regions such as South America and the East Pacific.
4. Conclusions
The aim of this study focused on the application of the 27-year GPM-IMERG (1998–2024) product to detect statistically significant trends in global precipitation and to examine how those trends vary spatially and temporally. Monthly GPM-IMERG v07 raster datasets were obtained from NASA’s Giovanni. The monthly raster datasets were combined into annual and seasonal grids in order to examine the spatial and temporal characteristics of precipitation during the analyzed period. Mann–Kendall test for trends were then implemented on the annual, seasonal, and monthly GPM-IMERG rasters and maps of the statistically significant (>0.05) Tau coefficients were produced for all the series. To capture the magnitude of the changing trends, Sen’s slopes were calculated from selected zones that reflected statistically significant trends. Scatter plots of the Sen’s slopes for zones with significant increasing or decreasing trends were produced to quantify the amount of increase or decrease in annual and seasonal precipitation for the selected zones.
The results reveal consistent and spatially clustered patterns of significant precipitation change between 1998 and 2024. The Arctic and Southern Oceans stand out as the regions with the strongest and most consistent increases, showing high Tau coefficients (>0.4) and notable Sen’s slopes (up to +0.03 mm/day in DJF for the Arctic and +0.07 mm/day in JJA for the Southern Ocean). These findings reinforce the role of high-latitude warming in enhancing precipitation, aligning with research on the shift from snow- to rain-dominated conditions in the Arctic and sea ice decline in the Southern Ocean. The highest Sen’s slope (+0.048) was found in the higher latitudes of the north Pacific Ocean, near the Arctic circle, reinforcing the wetting trend found in the poles. Northern China also shows persistent increases in annual means, with magnitudes of up to +0.02 mm/day, in agreement with observed late-season intensification of extreme precipitation after 2010. Conversely, large-scale drying is evident in the tropical East Pacific (up to −0.02 mm/day), central-southern Africa, and parts of northern South America, reflecting links to SST anomalies, recurrent drought, and persistent drying trends reported in recent studies.
Seasonal analyses confirm and refine the annual patterns, showing that the strongest high-latitude wetting occurs in DJF for the Arctic and JJA for the Southern Ocean, with DJF and SON being the seasons when both regions exhibit simultaneous, statistically significant increases. The North Atlantic south of Greenland emerges as a distinct summer (JJA) drying hotspot, with the strongest identified Sen’s slope of −0.061 mm/day, consistent with the influence of Greenland Ice Sheet melt enhancing ocean stratification and NAO like circulation that reduces precipitation. Across the tropics, the East Pacific shows persistent drying in all seasons, while tropical South America and parts of southern Africa display scattered but significant negative trends. Together, these results highlight a dual pattern of wetting at high latitudes and drying in tropical belts, underlining the contrasting hydroclimatic impacts of polar warming, ocean circulation changes, and tropical SST-driven variability.
Several limitations temper these conclusions and guide future work. First, while the 27-year IMERG record provides valuable insights into recent precipitation trends, its relatively short duration limits the detection of low-frequency variability and multi-decadal oscillations that can influence long-term climate signals. This constraint reduces the statistical power of trend analyses compared to longer reanalysis datasets such as ERA5, which better capture decadal-scale variability and can serve as a complementary benchmark for evaluating IMERG-derived trends. Future work will compare trends identified in the IMERG dataset with precipitation estimates from ERA5. Second, precipitation type is not distinguished in the study (such as rain, snow, or even sleet) and high-latitude retrievals remain the least mature because of snowfall physics and sparse gauges. Future work will also examine geophysical causes for the detected patterns, including the roles of teleconnections such as the Arctic, Antarctic, and the North Atlantic Oscillations, and thermodynamic amplification under climate change, and explore separate phase contributions (rain vs. snow) using emerging DPR/Cloud Sat-constrained snowfall algorithms.
