1. Introduction
Aquaculture serves as a crucial source of food, nutrition, income, and livelihoods for millions of people globally [
1]. The rapid growth of aquaculture over recent decades has been fueled by the rising human population, the need for improved socio-economic benefits, and increasing protein demands [
2,
3]. Marine aquaculture involves a diverse array of species, including finfish, shellfish, crustaceans, and aquatic plants, to meet the escalating global demand for seafood [
4]. Between 2011 and 2021, there was a notable upward trajectory in marine and brackish water aquaculture production within the Mediterranean and Black Sea regions [
4]. A substantial 91.3% rise in volume, increasing from over 455,000 t to over 870,000 t was observed since 2011 [
4]. Similarly, there was a 74.5% increase in value, escalating from approximately USD 2.8 billion to over USD 4.9 billion [
4]. This expansion is primarily attributed to the proliferation of finfish aquaculture, which rose from around 300,000 t in 2011 to 738,000 t in 2021 [
4].
The growth of marine aquaculture in the Mediterranean Sea has introduced numerous environmental and socio-economic challenges that may have impacted the sector’s sustainability and potentially hindered its continued expansion [
5,
6]. The concept of farming-up the marine food webs [
7] sheds light on the complex interactions between aquaculture practices and marine ecosystems, referring to the practice of continuously including fish species of higher trophic level in marine aquaculture [
7] that have higher diet requirements [
8]. The mean weighted trophic level of Mediterranean marine farmed species increased between 1970 and 2004 indicating a shift towards farming species that occupy higher positions in the food web, such as piscivores and carnivores, rather than herbivores and detritivores [
7].
Across the Mediterranean Sea, most of the aquaculture fish farms are located in the Aegean Sea which is considered an aquaculture hot spot [
9,
10]. The industry of marine aquaculture in Greece and Turkey is leading when the number of fish cages and production volume are considered. The marine aquaculture production of Greece exceeded 130,177.4 t [
11] of farmed finfish in 2021, while that of Turkey, exceeded 471,686 t of farmed finfish [
12]. The aquaculture industries of the two countries differ in terms of spatial density and distribution of aquaculture cages, distance from shore, and depth, with some of the differences emerging from national laws and regulations [
9,
10].
The European Union has initiated a support system known as the European MSP Platform, designed to offer insights into ongoing initiatives, procedures, and optimal approaches for many human activities such as cargo and passenger transport, tourism, oil and gas exploration as well as renewable energy production in wind farms, fisheries and aquaculture. Additionally, the EU is financing various transboundary MSP endeavors, accessible for viewing on the European Atlas of the Seas, the European Marine Observation and Data Network, EMODnet [
13]. Additionally, Google Earth has demonstrated considerable potential in various scientific domains, such as geo-referencing and mapping [
14], educating about geological science [
15], discovering previously unknown archaeological sites [
16], and investigating predator-prey dynamics in coral reef ecosystems [
17]. In aquaculture, Google Earth satellite imagery has been used many times and in different studies to justify the trends of the section’s production [
9,
10].
The aim of the present work is to count the number of marine aquaculture farms and individual cages within each farm in the Aegean and eastern Ionian Seas using satellite imagery (Google Earth) and to compare the findings with the official numbers reported by EMODnet for the same area. Also to compare and contrast the aquaculture characteristics between Greece and Turkey in the Aegean Sea. The results of this work can be used for marine spatial planning and ecosystem-based (fisheries) management purposes.
2. Materials and Methods
2.1. Study Area
The Aegean Sea, designated as division 37.3.1 of FAO Major Area 37 is a relatively enclosed part of the eastern Mediterranean Sea. This area includes the coastlines of Greece and Turkey, along with numerous islands and islets. The study area is bounded by the Greek coastline to the west and the Turkish coastline to the east, with a southern boundary set 6 nautical miles from the coast. The total area, referred to as the Aegean Sea, covers 201,535 km
2 and reaches a maximum depth of 2250 m [
18,
19]. The Aegean Sea, particularly its northern part, is considered one of the most productive fishing grounds in the Mediterranean Sea [
19]. This high productivity is due to the influx of nutrient-rich, low-salinity water from the Black Sea, river flows that boost coastal zone productivity, and the extensive continental shelf of the northern Aegean Sea [
20].
2.2. Datasets and Mapping
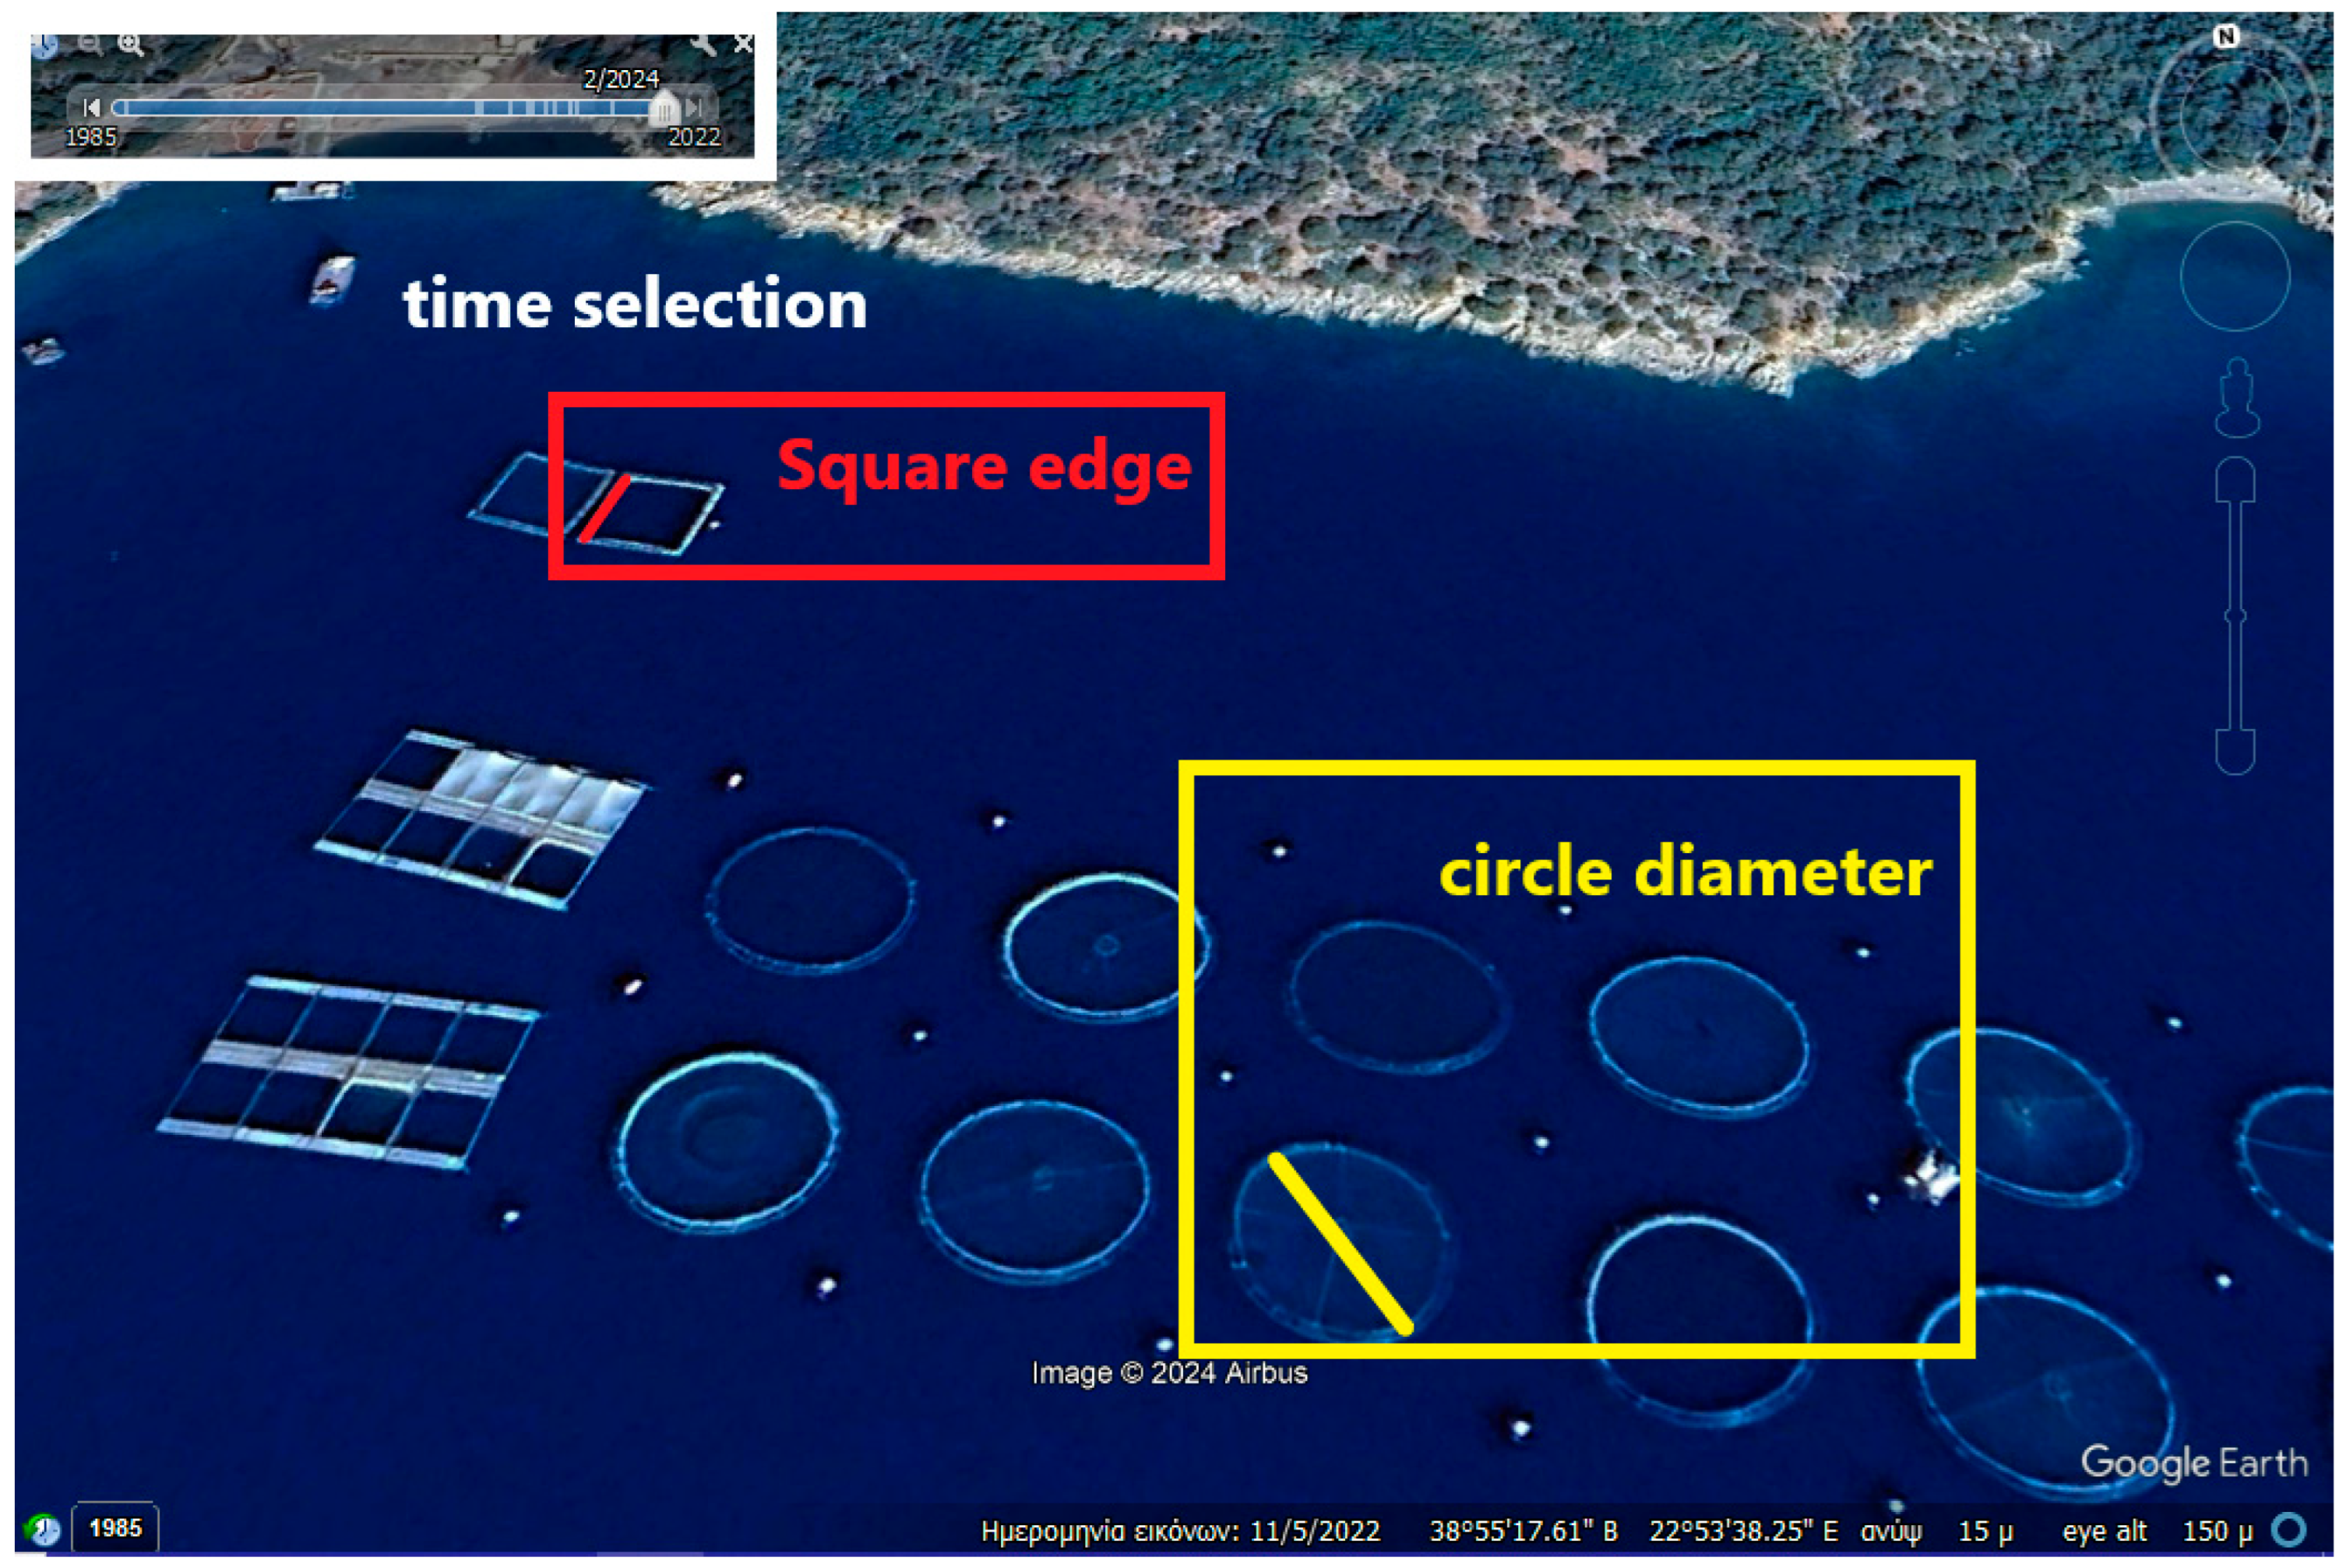
Using satellite imagery from Google Earth, a detailed survey of the Aegean Sea coastline was conducted to record every fish aquaculture farm and count all marine cages within, along with its location (longitude, LON; latitude, LAT) and the dimensions of each cage (cage width for the square ones and cage diameter for the circular ones). Google Earth’s ruler tool was used to measure the dimensions of the cages and subsequently calculate their respective areas (A, m
2), using the formula A = width
2 for square cages and A = 3.14 × (diameter/2)
2 for circular cages (
Figure 1). The locations of the fish farm cages were then downloaded, in order to use the coordinates provided by Google Earth to map the fish farm cages in QGIS (version: 3.36.2).
Additionally, the Google Earth time slider tool was used to verify that the satellite images were captured in 2021 or later (
Figure 1). Exceptions to this criterion were made only if cages were obscured by cloud cover or other impediments, provided the park arrangement remained unchanged. Out of the total 7078 fish cages, the 1204 were identified from images before 2021 (17%).
Initially, all marine aquaculture cages in the Aegean Sea were geospatially represented as points in QGIS to present their distribution along the Aegean Sea. This mapping was then used to identify the locations of unique aquaculture cages. Using the applications of QGIS for raster layers and geometry tools, an enclosed area around each fish farm was delineated to estimate the approximate space occupied by them [
10]. Based on these locations, polygons were delineated to represent the area directly associated with aquaculture structures. The total area of fish farms was then derived by summing the surface areas of all polygons for both Greek and Turkish fish farms. This approach ensured that the results reflect the effective space occupied by the farms themselves, rather than broader lease areas or surrounding zones not directly covered by cages.
Each fish farm identified was cross-checked with the aquaculture site information available in EMODnet and allowed the confirmation of farm boundaries and ownership structures. Hence, the combination of cage characteristics and EMODnet aquaculture dataset offered a robust framework for allocating cages to fish farms, which is consistent with the spatial planning practices [
10] and the satellite-based validation approach [
9].
The European Marine Observation and Data Network (EMODnet) provides a dataset on marine finfish aquaculture in the European seas, covering data up to the year 2021. The dataset contains details on the locations of marine finfish farms within the EU and partner countries, where such information is accessible (EMODnet). From the dataset, the selected finfish farms were those situated along the Aegean coastline. Data availability was limited to the Greek coastline, with no corresponding data for the Turkish coastline. The locations of the individual fish farms that were identified previously, were now used to compare how the total number of fish farms changed among the years; from 2021 until now.
The EMODnet aquaculture dataset provides harmonised geospatial information on marine finfish and shellfish farming sites across Europe; we only got data for the Greek coastline, as there were no data for the Turkish coastline. The data are primarily delivered as vector layers (points or polygons), with centroids representing farm locations, and attributes that may include site identifiers, country, owner, production method, species groups, production stage, purpose, status, and distance from the coast. The EMODnet dataset does not provide detailed information about the number or size of individual cages; rather, it represents aquaculture sites at the farm level, offering an overview of their presence, type, and basic characteristics.
3. Results
Overall, 7078 cages were located in the Aegean Sea covering an area of 2.99 km
2. The Aegean Sea and the Greek coastline host 4729 individual fish farm cages, collectively covering an area of approximately 1.35 km
2. In contrast, the Turkish coastline distributes approximately half of the number of the Greek cages, with 2349 cages found, spanning a larger total area of 1.64 km
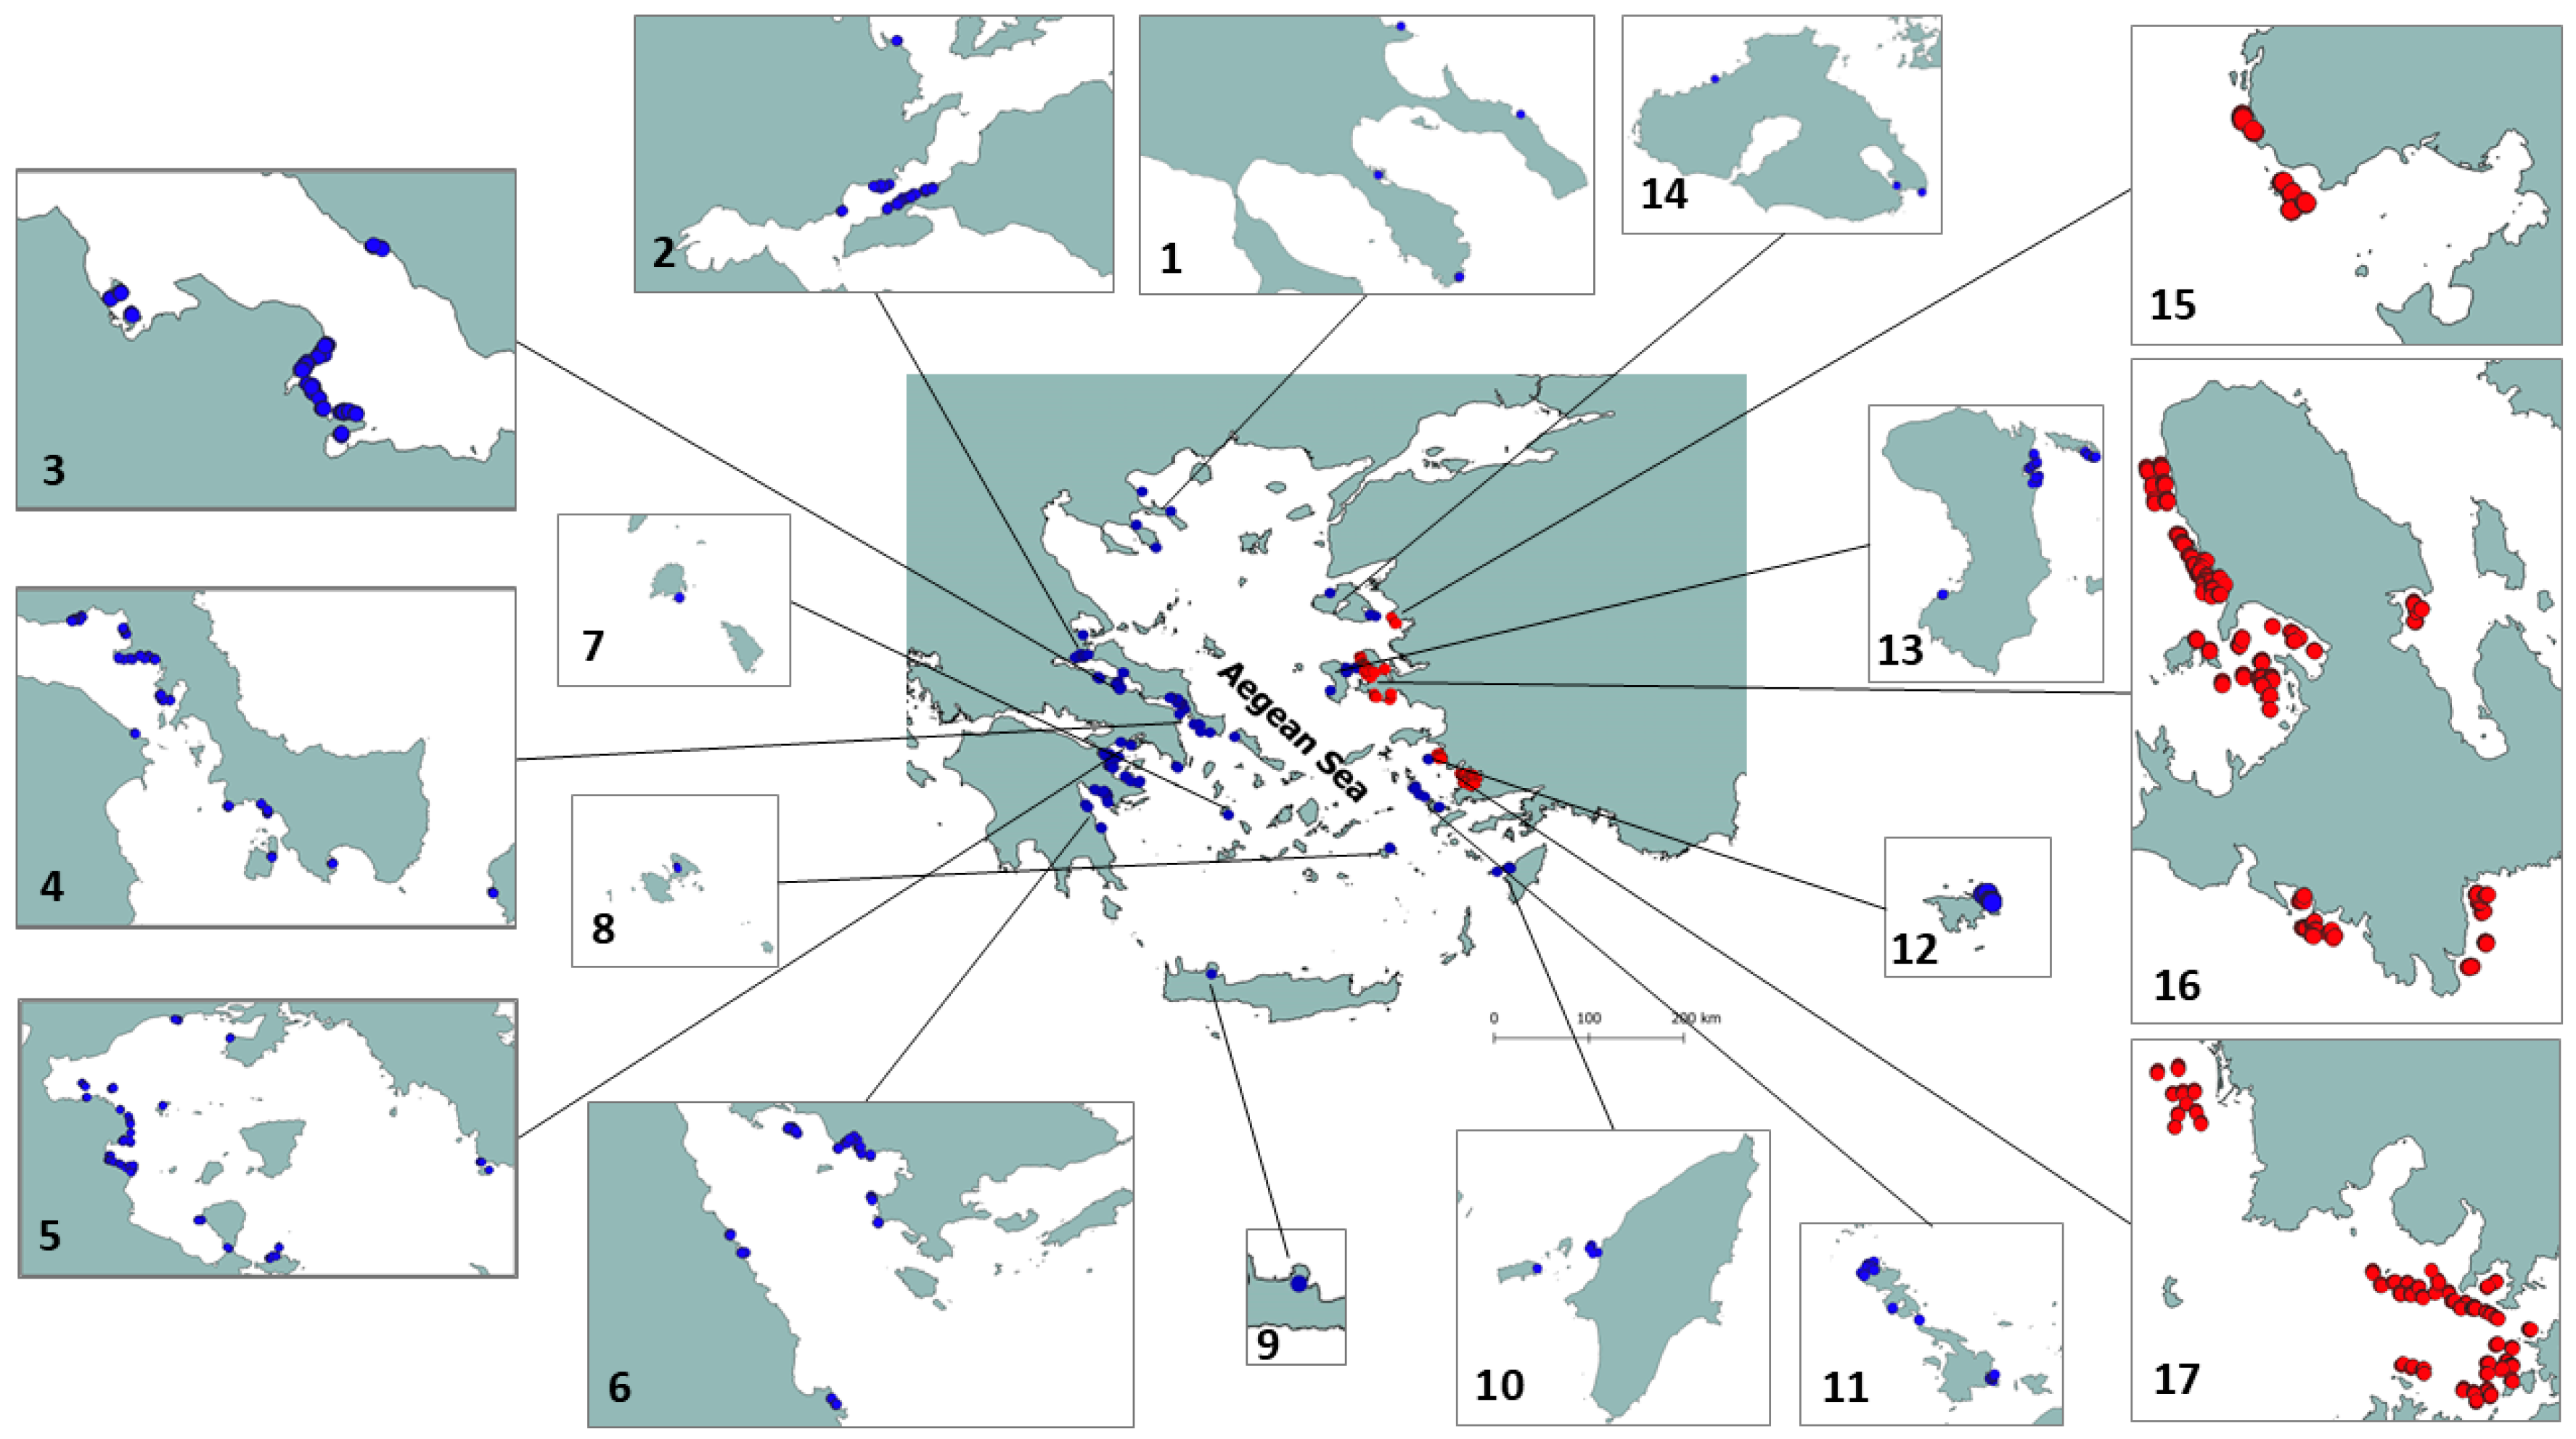
2 (
Table 1,
Figure 2). The average cage dimensions are larger in Turkey, with a mean diameter of 28.1 m compared to 18.7 m in Greece, while the mean width is similar at 8.4 m and 8.6 m, respectively (
Table 1). The area covered by fish farms in Greece is approximately 12.9 km
2, while in the Turkish coastline the area is approximately 2 times greater, with 23 km
2 being occupied by aquaculture (
Table 1).
Greek fish farms are often clustered closely together, whereas Turkish fish farms, especially in the Gulf of Ildır and Kazıklı Bay, are distributed more irregularly (
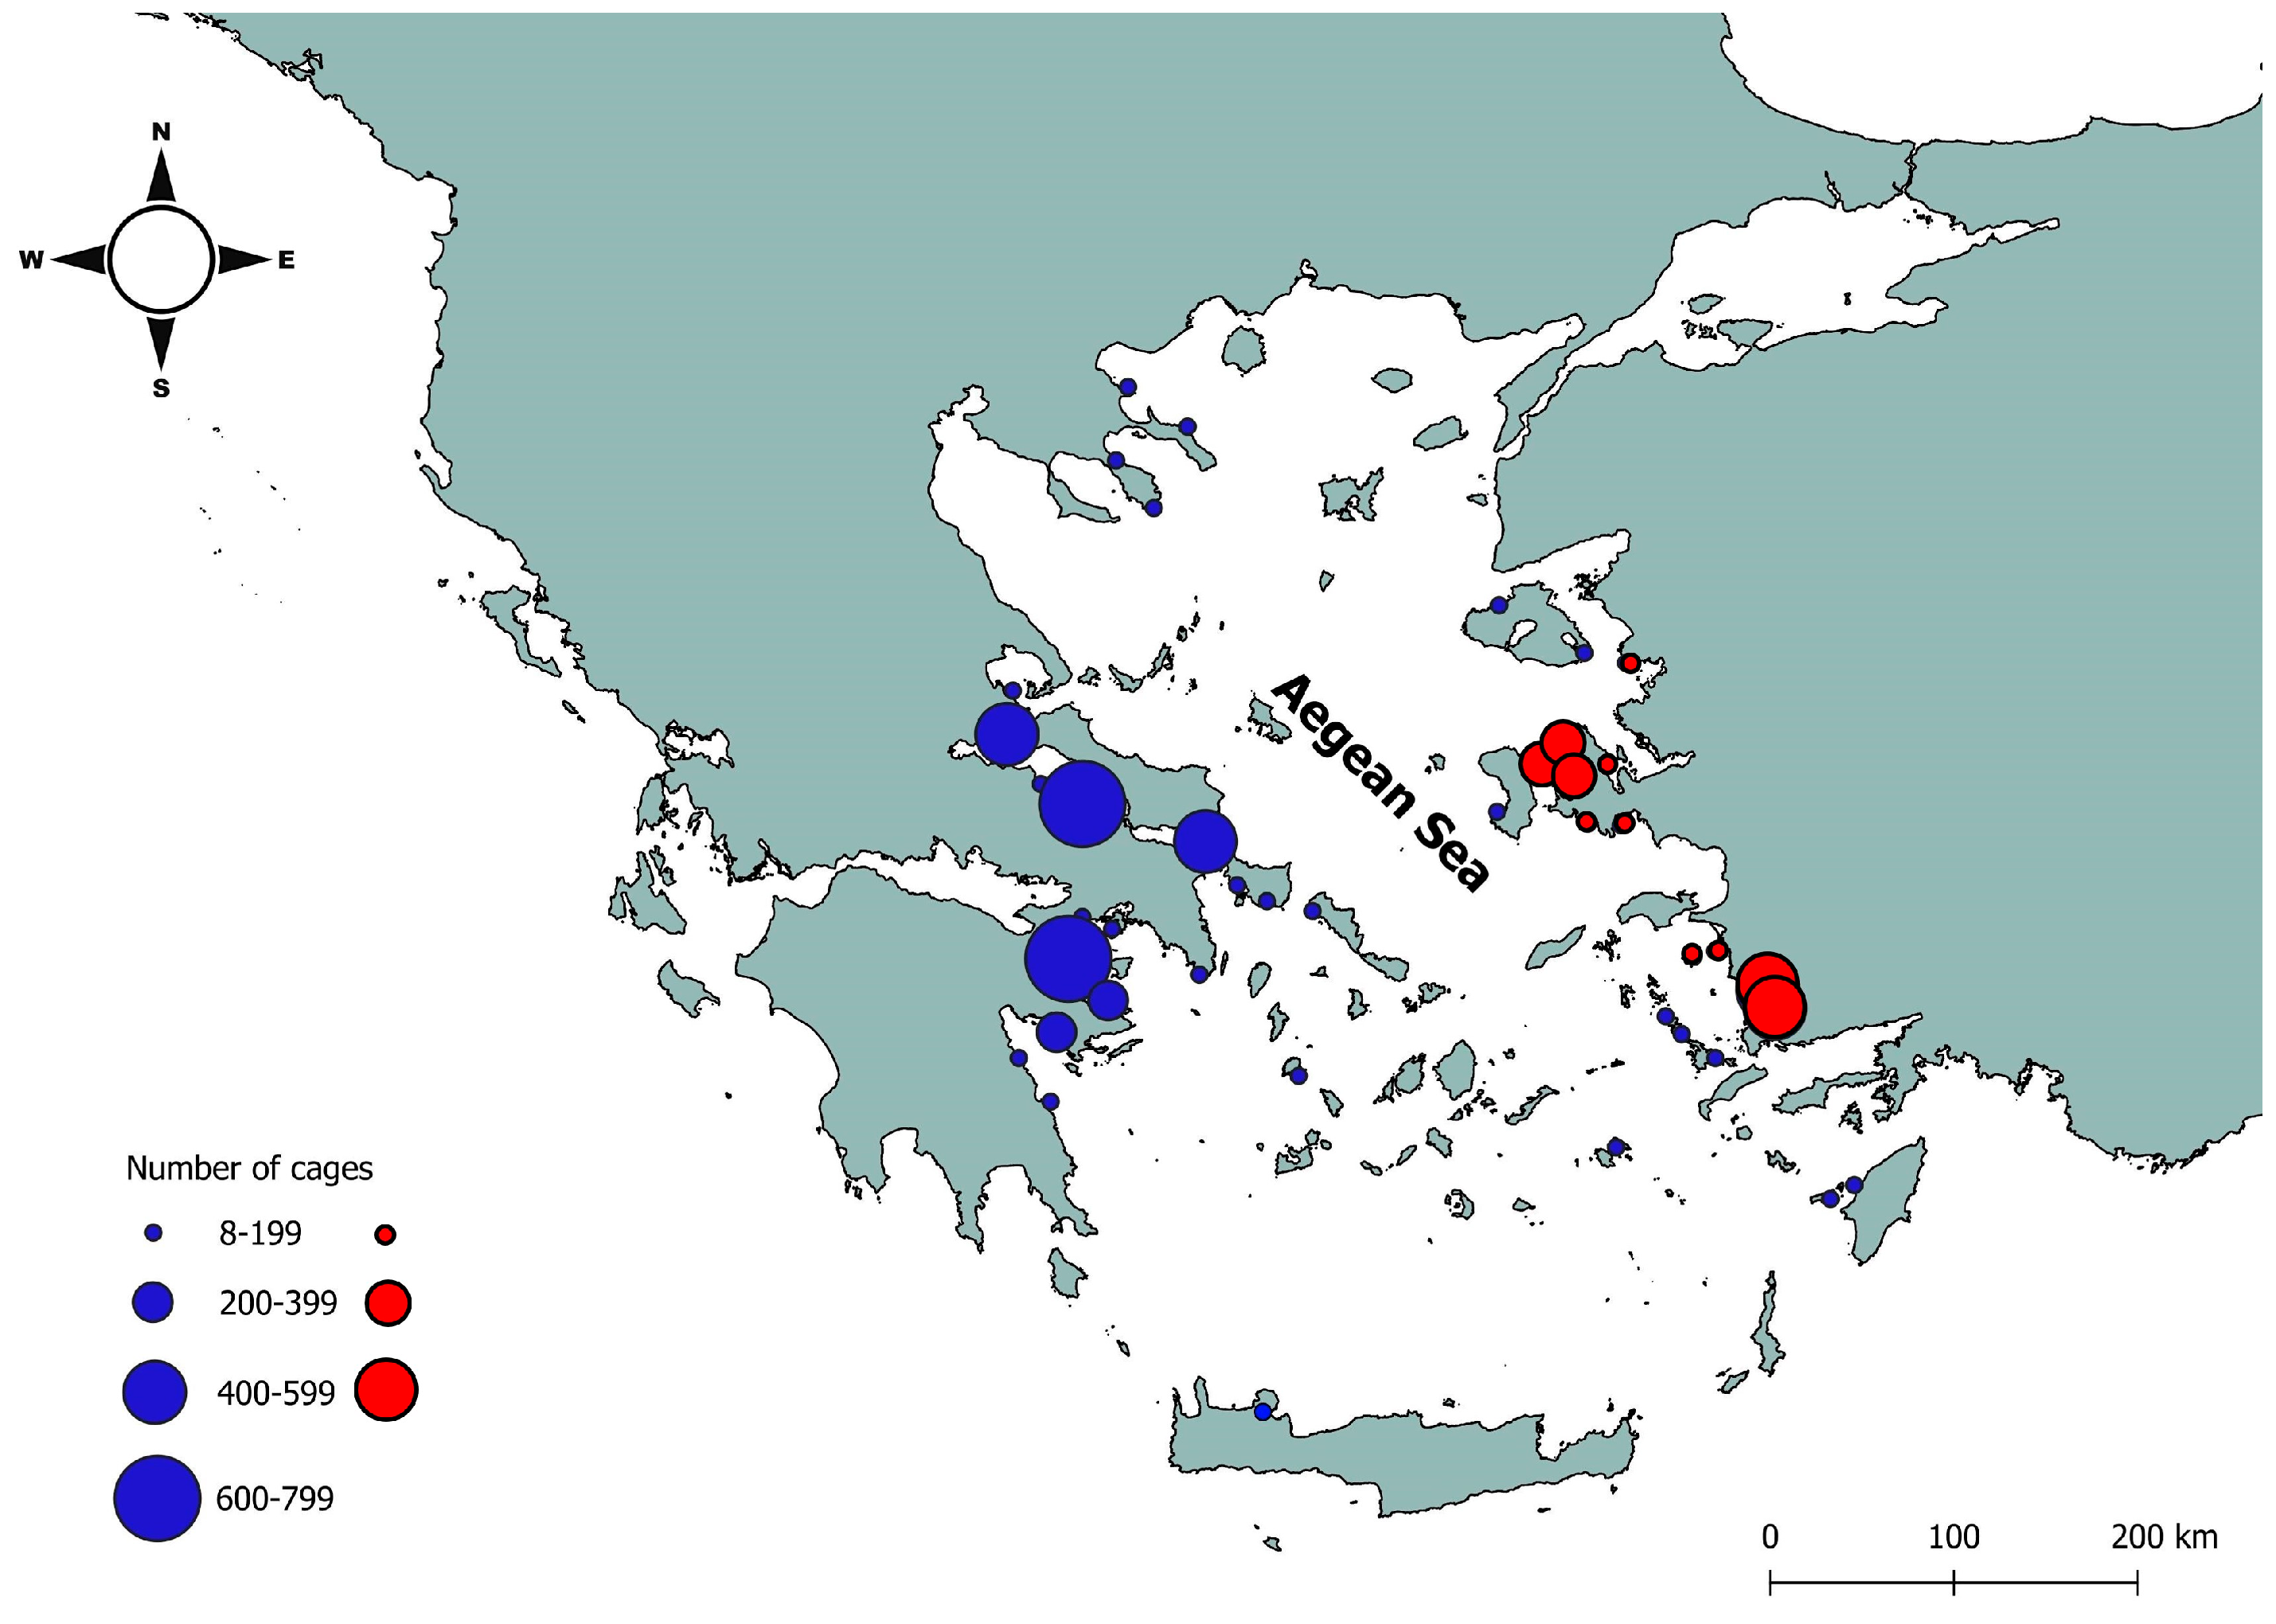
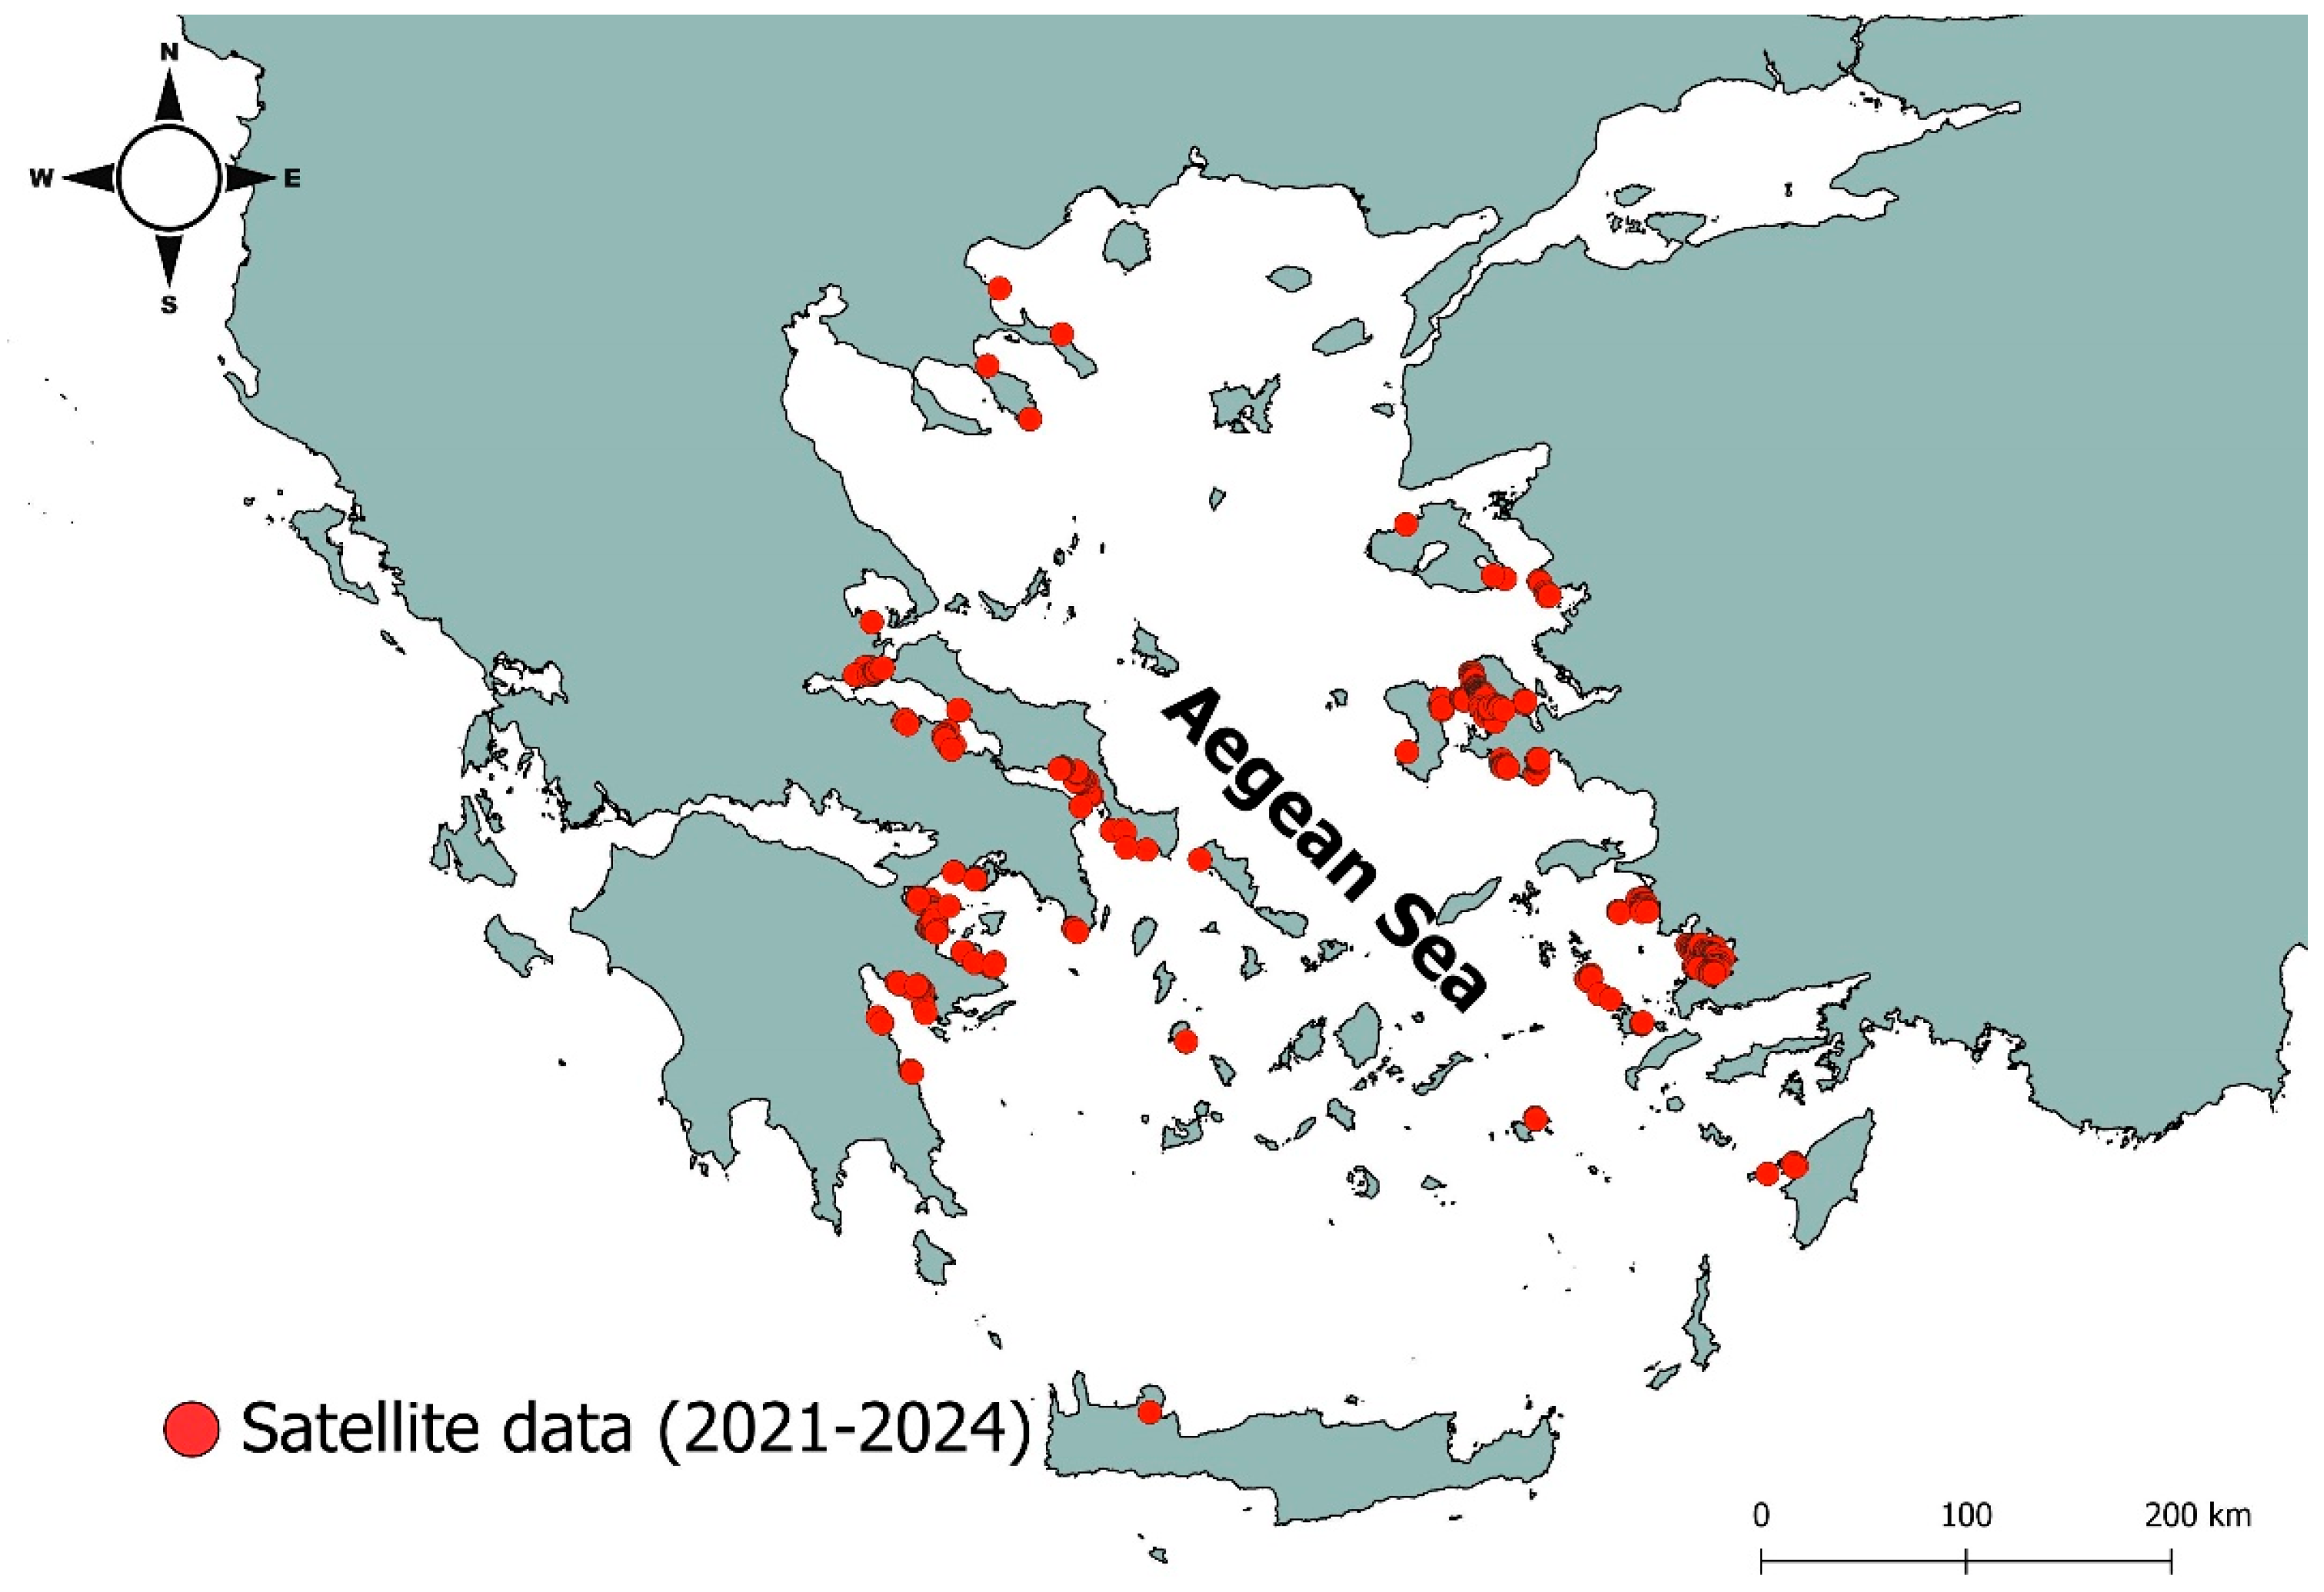
Figure 2). This pattern highlights significant regional differences in aquaculture practices along the Aegean coastline. Along the Greek shores, dense concentrations of fish farm cages are notably found around the Strait of Artemisium, the Northern and Southern Evoian Gulfs, and the Saronikos Gulf. In contrast, the Turkish coastline sees prominent activity concentrated in Kazıklı Bay, reflecting distinct geographic and operational dynamics (
Figure 2 and
Figure 3).
Data from the European Union reports 177 fish farms up to 2021 in the Aegean Sea. However, the analysis of satellite imagery from Google Earth identified a total of 353 fish farms in the Aegean Sea coastline for the years 2021–2024 (
Table 1). From satellite imagery within the Aegean Sea, the 231 fish farms are located along the Greek coastline and the rest 123 along the Turkish coastline. This distinction is more accurate for this comparison as it describes similar data, excluding data that are not found in both datasets. (
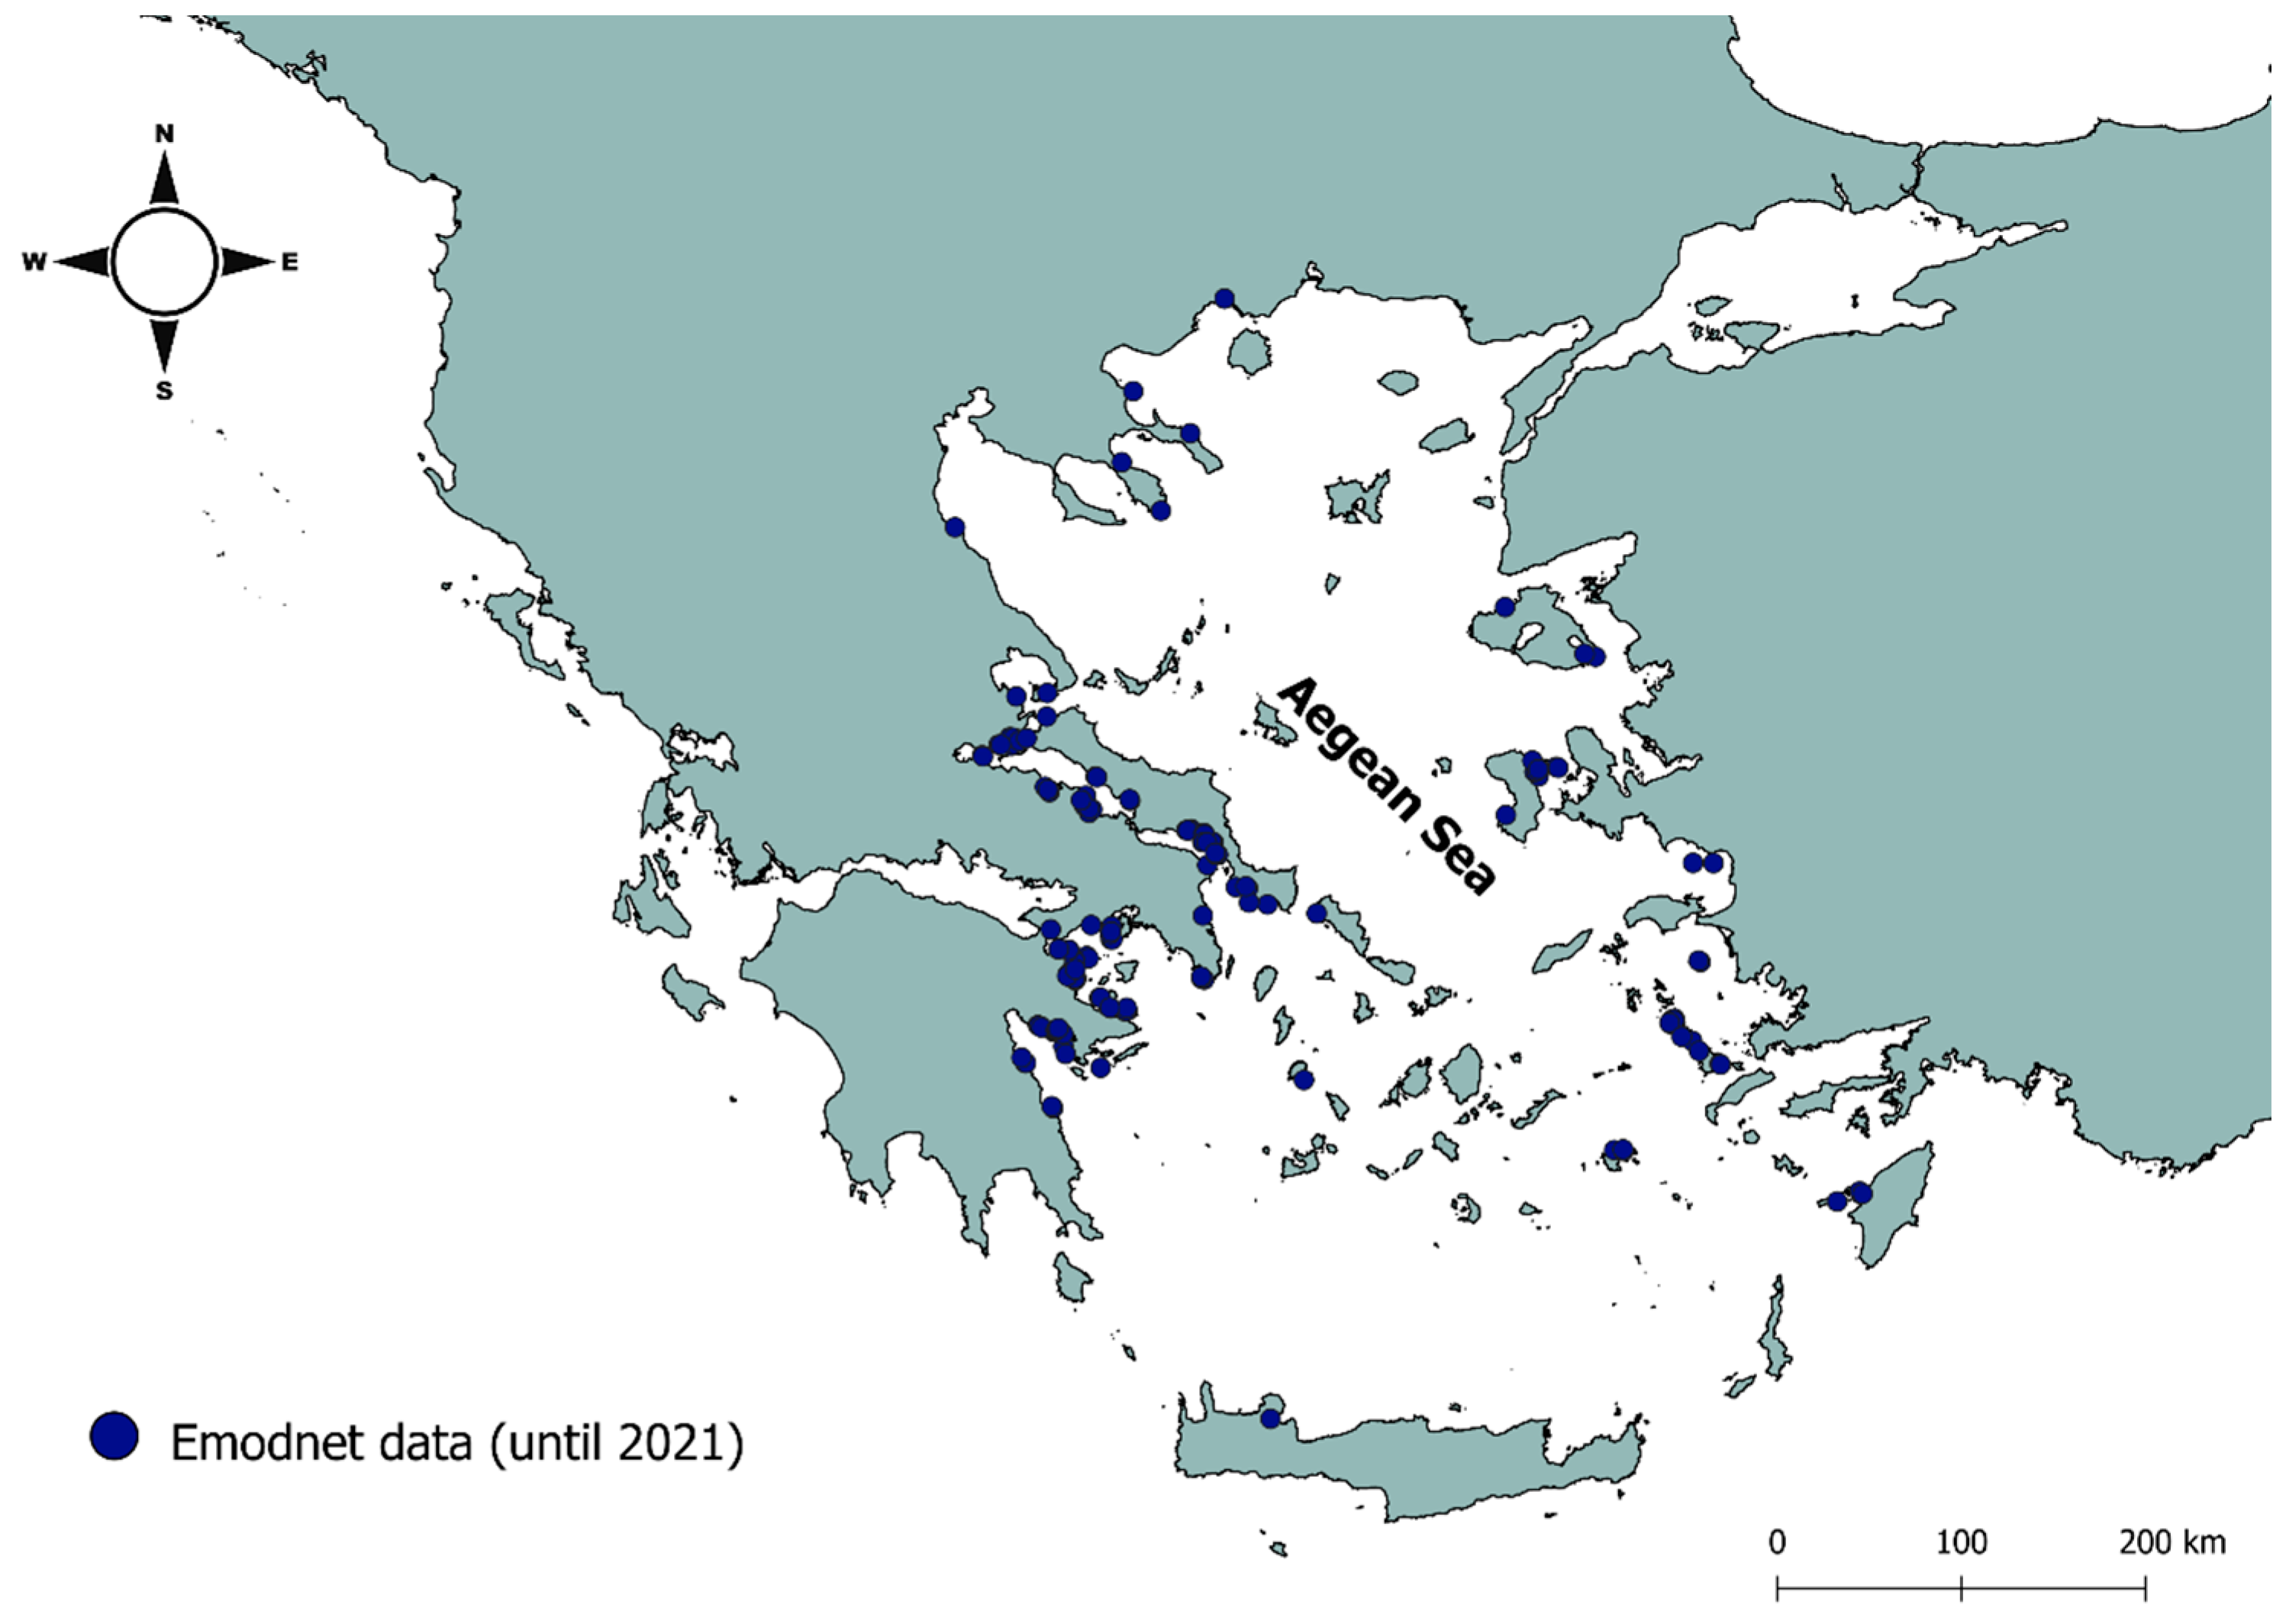
Table 1). Discrepancies are noted between the satellite imagery map and the EMODnet map: certain fish farms identified in the Northern Aegean and the Cretan Sea on the EMODnet map were not observed in the satellite imagery (
Figure 4). Conversely, additional fish farms were detected via satellite imagery in areas such as the Strait of Artemisium (North of Evoia), the Southern Evoian Gulf, and the Saronikos Gulf (
Figure 5).
4. Discussion
The present study highlights the spatial distribution and characteristics of aquaculture cages and fish farms in the Aegean Sea using remote sensing. The methodology used here aligns with previous literature that identified the combination of Google Earth and GIS technologies for monitoring aquaculture cages [
9,
10]. Although Greece has nearly twice as many fish farm cages as Turkey, the total area occupied by Turkish cages in the Aegean Sea is larger. This discrepancy is explained by the difference in average cage diameter, where Turkish cages are, on average, 10 m larger than their Greek counterparts. In contrast, the width of square cages is roughly the same in both countries (
Table 1,
Figure 2). When comparing the total area occupied by fish farms, Turkey surpasses Greece, with Turkish farms covering 1.64 km
2 along their coastline compared to Greece’s 1.35 km
2. The difference between the covered area of the fish farms cannot only be justified by the greater average diameter of the circular cages. What also plays a crucial role in this fact is the distribution of the cages across the coastline. Even though the results indicate that Greek aquaculture farms are more dispersed along the coastline, while Turkish farms are more concentrated in specific areas, the distances between the fish farms and their cages have also a small impact on the observed differences. In Greece, fish farms tend to be more densely clustered, particularly in regions with a high concentration of farms, with cages arranged in closer alignment. In contrast, the distribution of fish farms in Turkey appears more irregular and scattered, as illustrated in
Figure 2.
Based on the distribution shown in
Figure 2 and
Figure 3, fish farms are predominantly located in enclosed areas, such as gulfs and straits between land and islands. This pattern likely provides enhanced safety for fish farms, as these enclosed spaces offer better protection from harsh environmental conditions and wave exposure.
These findings are consistent with previous studies. While the specific figures differ, it has been reported that there are more fish farm cages in Greece than in Turkey, yet they occupy a smaller total area in the Aegean Sea [
9]. The dominance of Turkish fish farms in terms of the area they occupy compared to Greek fish farms has also been reported before [
10].
Comparing the total number of fish farms reported in our study (354 fish farms) to the EMODnet dataset (177 fish farms) can be misleading. A direct comparison of these figures is inappropriate due to the incomplete coverage of fish farms outside European Union waters in the EMODnet dataset, particularly along the Turkish coastline. The only valid comparison using this data is between the EMODnet dataset and the total number of fish farms in Greece, as Greece is the only one of these regions that is part of the European Union and contributed data to the European database. Since 2021, our results show a significant increase in the total number of fish farms in Greece, with 51 additional farms identified from 2021 to 2024 using satellite imagery. Upon examining
Figure 4 and
Figure 5, it is clear that in the southwestern Aegean Sea, particularly in the Southern Evoian Gulf, the Argosaronikos Gulf, and the Argolikos Gulf, fish farms appear more densely packed in the satellite imagery than in the EMODnet data. This discrepancy highlights the observed increase in fish farm numbers.
The spatial characteristics of aquaculture sites show a significant variation between Greece and Turkey [
9,
10]. Greek aquaculture zones are widely distributed along the coastline, while the aquaculture cages in Turkey are located further offshore in recent years due to new regulations [
10]. The disparity between the Greek and Turkish coastlines is evident. Despite Greece hosting a larger number of cages, the aquaculture cages in Turkey occupy a larger expanse of the Aegean Sea. Despite Turkey occupying a higher area of the Aegean Sea, the ecological footprint of Turkish aquaculture in this region is relatively small compared to other sectors, such as agriculture [
21].
Outside the EU, various non-EU Mediterranean nations have incorporated IUCN principles, Environmental Impact Assessments (EIAs), and Aquaculture Zoning Area (AZA) concepts into their policies, aligning with EU directives to establish legal frameworks for aquaculture. The General Fisheries Commission for the Mediterranean (GFCM) has adopted resolutions to foster sustainable aquaculture development, emphasizing the central role of AZA [
22]. Guidelines for streamlining aquaculture authorization and leasing processes have also been endorsed to support AZA implementation [
23]. However, the integration of AZA concepts into regulations across Mediterranean countries lacks uniformity. Major finfish-producing nations such as Greece and Turkey have adopted distinct approaches to resolve spatial management challenges, influenced by factors like local legislation and geographical considerations. For instance, Greece bases fish farm spatial planning on site carrying capacity, considering parameters such as distance from shore, depth, and currents [
10]. Turkey, in a policy shift in 2009, mandated the relocation of aquaculture operations offshore to designated AZAs, situated at least 1 km from the coast and at depths exceeding 30 m. This directive aimed to mitigate conflicts with coastal tourism and other coastal zone activities [
24]. Regulatory differences between Greece and Turkey include Greece’s site-specific carrying capacity and Turkey’s offshore aquaculture zones, reflecting different approaches to spatial management. Overall, integrating remote sensing and regulatory frameworks is crucial for sustainable aquaculture in the Aegean Sea.
