Article

Hydrodynamic Modelling and Morphometric Assessment of Supratidal Boulder Transport on the Moroccan Atlantic Coast: A Dual-Site Analysis

1
GEOPAC Research Center, Geophysics and Natural Hazards Laboratory, Scientific Institute, Mohammed V University in Rabat, Rabat 10100, Morocco
2
Geosciences Department, Williams College, Williamstown, MA 01267, USA
3
Laboratory of Process Engineering and Environment, Faculty of Science and Technology Mohammedia, University Hassan II of Casablanca, Mohammedia 28806, Morocco
4
Department of Engineering and Geology, Geological Science and Technology, Università degli Studi ‘G. d’Annunzio, 66100 Chieti Scalo, Italy
*
Author to whom correspondence should be addressed.
Earth 2025, 6(4), 124; https://doi.org/10.3390/earth6040124
Submission received: 27 August 2025 / Revised: 2 October 2025 / Accepted: 10 October 2025 / Published: 11 October 2025

Abstract

Coastal boulder deposits (CBDs) are important geomorphic indicators of extreme wave activity, yet integrated morphometric and hydrodynamic analyses remain limited along the Moroccan Atlantic coast. This study characterizes the morphology, spatial distribution, and transport thresholds of supratidal boulders at Oued Cherrat and Mansouria, and quantifies the wave energy required for their mobilization. Between 2021 and 2025, 85 boulders were surveyed, supported by lithological analyses, GPS mapping, and pre-/post-storm photographic documentation. At Oued Cherrat, boulders ranged from 0.01 to 3.56 m3 (≤7.84 t), with solitary blocks located 30–94 m inland and larger imbricated clasts up to 150.5 m. At Mansouria, dimensions reached 22 × 20 × 3.5 m (>2032 t), positioned 5–140 m from the shoreline. Storms in January and March 2025 displaced boulders up to 4.5 m at Oued Cherrat (e.g., 6.39 t) and up to 3 m at Mansouria (e.g., 21.42 t), with new blocks deposited and megaboulders showing slight in situ rotations. Hydrodynamic modelling estimated sliding thresholds of 1.1–4.0 m/s at Oued Cherrat and 2.7–11.0 m/s at Mansouria, while rolling thresholds reached 18.23 m/s. These values confirm the dependence of transport on boulder mass, imbrications, and topography. The findings demonstrate that extreme storms can rapidly reorganize multi-tonne CBDs, while the largest megaboulders require rare, exceptionally high-energy events.

1. Introduction

Coastal boulder deposits (CBDs) are key geomorphic signatures of extreme wave events, including storms and tsunamis [1]. CBDs include large wave-emplaced boulders, commonly emplaced above the high-tide line, that are out of reach of fair weather waves and therefore require extreme energy for their creation and transport [2]. Once emplaced, they are difficult to remobilize, so their spatial distribution, morphology, and lithology provide critical insight into past hydrodynamic conditions, shoreline evolution, and associated hazards [3,4,5]. These deposits have been documented globally across a variety of rocky coastal settings, from the Pacific Islands to the North Atlantic, with prominent examples in western Europe, Japan, Australia, Hawaii, the Bahamas, and the Mediterranean [1,6,7,8,9]. CBD research is crucial not only for reconstructing past hydrodyamic conditions but also for improving risk assessment in the context of growing coastal vulnerability under climate change. The increasing frequency and intensity of extreme marine weather events, driven by sea-level rise and changes in storm climatology, make accurate assessment of boulder transport mechanisms a scientific and societal imperative [10,11].
The Moroccan Atlantic coastline is increasingly exposed to high-energy marine events, including powerful winter storms, long-period swells, and occasional bore wave phenomena. These forces contribute to morphological reworking of coastal zones, particularly in low-lying and rock-bound areas between Rabat and Casablanca. Within the past decade, for example, severe cyclonic storms such as Hercules (2014) and Leslie (2018) generated recorded wave heights exceeding 13 m and wave periods reaching 22 s [12,13]. Such events cause severe coastal erosion, infrastructure damage, and sediment displacement, highlighting the necessity of understanding the sedimentological and dynamic responses of the coastal system. Notably, swell heights exceeding 4.5 m are now considered thresholds for extreme storm events along Morocco’s western coast [14]. The intensification of such hazards due to climate change further emphasizes the importance of studying hydrodynamic interactions with boulder-sized sediments.
Despite their global importance, the processes governing the transport and emplacement of coastal boulders remain incompletely understood. Traditional hydrodynamic models often fail to reconcile the wave energy theoretically required to mobilize massive boulders with field observations [15,16,17]. Boulder movement was initially modeled through equations that relate wave-induced flow velocity to boulder dimensions and rock density, but this approach is hampered by uncertainties in input parameters such as drag and lift coefficients and a lack of consideration of initial boulder positions and local topography [18]. Nandasena et al. [19] provided refinements, introducing distinctions between submerged, subaerial, and joint-bound (i.e., unexcavated) boulders, as well as considering the effect of slope, and these results have since been refined and validated. These equations permit an analysis of CBDs and an assessment of the relationships between boulder size, location, and bore velocity, which can quantify the wave energy experienced at specific locations along these exposed coastlines.
Although previous studies have identified and classified CBDs along parts of Morocco’s coast including Rabat, Larache, and Safi, quantitative assessments of block mobility, wave velocity thresholds, and source material remain rare [4,20,21]. Moreover, the relationship between supratidal boulder positions and environmental parameters such as elevation, slope, and inland distance has not been explored in Moroccan contexts. This gap limits our ability to distinguish between different emplacement mechanisms and to model future coastal response under extreme wave conditions. Integrating empirical observations with numerical modeling is essential for enhancing predictive accuracy and informing coastal planning and disaster mitigation efforts.
This study aims to address this gap by (1) categorizing CBDs at two contrasting Moroccan sites (Oued Cherrat and Mansouria) over a period of five years, which includes 2025 Atlantic storms, (2) evaluating morphometric and lithological attributes, and (3) modeling bore wave velocities to assess their explanatory power relative to environmental variables. The goal is to enhance the predictive understanding of CBD transport mechanisms and contribute to improved coastal hazard assessment in North Africa.

2. Materials and Methods

Understanding coastal boulder deposit emplacement and mobility requires a multidisciplinary methodological framework that integrates geomorphometric, geological, and hydrodynamic analyses [22]. Field-based surveys provide the foundation for measuring boulder dimensions, distribution, and orientation, typically using standard axis-based measurements (major, intermediate, and minor axes) and geospatial positioning via high-precision GPS. Lithological analysis, including density determination through water displacement and saturation methods, allows for an estimation of boulder mass; however, due to uncertainties in volume calculation (especially when relying on XYZ coordinate measurements for irregularly shaped boulders) these mass estimates should be considered approximate. Pre- and post-storm photographic comparisons and image archives, when available, remain valuable tools for documenting boulder displacement.
To assess transport mechanisms, hydrodynamic models based on established motion initiation equations can be applied to estimate flow velocities necessary for boulder entrainment under various conditions, including sliding, rolling, and saltation [18,23]. When combined, these techniques provide a comprehensive and replicable approach for evaluating the response of coastal boulder fields to extreme hydrodynamic events and for informing broader coastal hazard assessments.

2.1. Study Area Description

This study focuses on two sites on the Moroccan Atlantic coast including Oued Cherrat, located 35 km south of Rabat, and Mansouria, situated 25 km north of Casablanca (Figure 1). This sandy, rocky coastline is shaped by a temperate oceanic climate and exposed to high wave energy, with powerful Atlantic swells and frequent storms. These storms are most intense during the winter months of November to March. Recent studies (1991–2020) of wave energy along this coast suggest an average of 20 kW/m [24]. Studies of extreme events highlight an increase in high-energy storms. For example, Mhammdi et al. [25] reported 36 significant wave height (Hs) events exceeding 7 m between 1998 and 2015 near Rabat, which were capable of transporting blocks of 8–16 m3. This aligns with hydrodynamic classifications of Moroccan steep coasts that list swell energy among principal morphodynamic drivers [26]. In addition, in previous work by Gharnate et al. [27] synthesizes meteorological and wave datasets for this region, confirming seasonal storm peaks and regional variability. Such conditions create an ideal natural laboratory for investigating boulder transport and the effects of high-energy wave action in a dynamic coastal setting.
The two study sites are bordered by dune belts that overlie marine terraces. These geomorphic terraces were formed during the Holocene but are carved into older Pleistocene limestone bedrock of marine and aeolian origin. Geologically, the area belongs to the Atlantic coastal margin of the northwestern Moroccan Meseta, which is characterized by a series of stepped marine platforms sloping westward toward the Atlantic Ocean [28]. Prevailing winds in the study area are predominantly from the north and northwest, as confirmed by long-term hydro-meteorological records from offshore observation points along the Moroccan Atlantic coast.
The marine climate of the region (based on data from SIMAR points 1052036 and 1050036) is characterized by long shore currents influencing sand transport and the geomorphological evolution of the coastline. The tidal range varies between 1.5 and 3.5 m, corresponding to the typical neap-to-spring tide cycle, with occasional high spring tides reaching up to 4 m.
Very high ocean swells, with significant wave heights ranging from 7 to 9 m, typically occur two to three times per year. Exceptional swells exceeding 9 m are less frequent, with a recurrence interval of approximately 2 to 3 years. These energetic events are associated with long wave periods ranging from 18 to 21 s. They are generally generated by extratropical cyclones that develop during the winter months between the Azores High and the Icelandic Low pressure systems [25]. The historical occurrence of such swells was also noted by Rouch [29], though we rely primarily on more recent datasets.

2.2. Geomorphometric Boulder Analysis

Field surveys and prospecting campaigns were carried out over several field seasons between 2021 and 2025 at Sites 1 (Oued Cherrat) and site 2 (the Mansoria coastline). We identified multiple groups of boulders distributed in different parts of the study areas and recorded their distribution using GPS location data and Google Earth imagery imported into ArcGIS 10.8 software for visualization and analysis of the morphometry, orientation, altitude, and distance of the boulders from the coast. Both sites were surveyed using methods described in [17].
Topographic profiles for each boulder were surveyed following the approach of Cox et al. [17], with the use of alternative measurement tools. Horizontal distances between each boulder and the high-water line (HWL) were measured directly in the field. With the HWL defined as a visible shoreline indicator, commonly represented by the wet/dry boundary, strandline, or wrack line left by the most recent high tide (Kraus, 1997). For short distances, measuring tapes were used, while GPS readings were taken for boulders located farther away or in less accessible areas. To enhance accuracy and validate field measurements, all distance data were subsequently cross-checked and refined using georeferenced satellite imagery in Google Earth Pro. Since Google Earth imagery can present positional uncertainties of a few meters, we assessed this by con-ducting a local validation against high-precision Magellan GPS measurements. A set of fixed checkpoints visible both in the field and on the imagery were compared, and the Root Mean Square Error (RMSE) was calculated, providing a quantified estimate of the imagery’s positional error in our study area using Equation (1):
R M S E = i = 1 n E G , i E T , i 2 + i = 1 n N G , i N T , i 2 n    
where “EG,i” and “NG,i” are the Google Earth coordinates for point “i”, “ET,i” and “NT,i” are the true (Magellan) coordinates for point “i” and “n” is the number of check points.
The elevation of each boulder above sea level was initially estimated in the field using the GPS Topografer mobile application on an Android smartphone, which provided re-al-time coordinates and altitude data in WGS 84 (latitude, longitude). These preliminary measurements were then refined through a high-precision handheld GPS device (Magel-lan Explorist), following a two-phase geospatial acquisition protocol. Control points were re-measured in WGS 84/UTM Zone 29 N (Easting, Northing) for horizontal accuracy, while vertical positions were corrected using the Earth Gravitational Model 1996 (EGM96) global geoid. This procedure ensured consistent, precise, and robust topographic data for all surveyed boulders.
We measured 35 boulders at Site 1 and 50 at Site 2, recording for each: the major, intermediate, and shortest axes (a, b, c), distance inland from the high-water mark, height above sea level, and the local slope angle. The 85 boulders from Sites 1 and 2 were grouped together for analysis, representing a range of characteristics including size, distance from the coastline and altitude, providing a diverse sample from which to draw statistically significant conclusions. This set s included the largest and smallest, the furthest and closest to the coastline, as well as the highest and lowest boulders, and a set of randomly selected boulders.
To calculate the densities of the identified lithology moderately cemented coastal limestone, we collected a total of six representative rock samples from both study sites (three per site). These samples were brought to the laboratory for density measurements. Each sample was immersed in water for a minimum of 24 h to achieve total saturation and then weighed. The volume was measured by immersing the sample in water and recording the displaced volume. To ensure accuracy, all measurements were taken twice. The density (ρ) was determined by applying the fundamental Formula (1):
ρ   =   m V
The average density is 2.2 g/cm3. The estimated average density of 2.2 g/cm3 is based on 8 measurements performed on representative rock samples collected from the study sites. The density values ranged from 2.0 to 2.4 g/cm3. The lithology of the boulders primarily consists of moderately cemented limestone.
Our boulders are somewhat irregular in shape, so to estimate volume we used a Corrected Volume (CV) formula:
CV = 0.6 × (a × b × c)
This is based on previous work [30,31,32] showing that true boulder volumes (measured by 3D photogrammetric scanning) is generally only 40–60% of the volume calculated through axis multiplication.

2.3. Photo-Documentation

At each site, we took a series of photographs, showing the view inland, offshore, and along the coast in both directions following methods of [16], producing a total of 10 to 20 photographs of the deposits at each site surveyed. The photographs were associated with GPS positions, and the established sites were visited and re-photographed periodically over several years. This process resulted in the creation of an extensive database of precisely located deposits, with reference images showing the layout of the blocks.

2.4. Post-Storm Observations

To assess boulder displacement, we imported georeferenced reference images taken before and after major storm events that occurred between 2020 and 2025 (including the January 2025 Atlantic storm and Storm Jana in March 2025) into ArcGIS 10.8 [33]. These images were linked to the study site locations using GPS data collected in the field. By comparing the configuration of boulders in the pre-storm and post-storm imagery, we were able to identify changes in position. At each site, we focused on the five or six largest boulders that exhibited clear signs of movement. For each selected boulder, we measured the axes and recorded the values on a standardized data sheet. This process resulted in a catalogue of 20 displaced boulders at Site 1 and 15 at Site 2. Additionally, 10 boulders at Site 1 had disappeared after the storms, and we were unable to relocate them.
The missing boulders were originally isolated and located a few meters from the mouth of the oued. It is therefore highly probable that they were displaced landward and transported along shore during storm events. This interpretation is supported by two main observations: first, these boulders were few in number and not part of a densely packed boulder field; second, their morphology differed from the other blocks, which were imbricated within a well-structured boulder train. Based on post-storm field surveys, these boulders were no longer present at their original locations, and no clear evidence was found to identify their new positions.

2.4.1. Measuring Boulder Movement

In cases where we could unambiguously identify the original and final locations of clasts using photographic evidence, we were able to measure transport distance and direction. This was the case for 35 out of our 85 documented boulders, 20 from Site 1 and 15 from Site 2. The boulders are clearly visible in satellite images, so we measured their transport in ArcGIS (10.8 version) by superimposing recent Google Earth imagery on georeferenced and scaled satellite images [33,34,35,36,37].

2.4.2. Flow Velocity Calculation

Horizontal flow velocities required to transport boulders in the studied data set were calculated using equations for initiation of motion formulated by Nandasena et al. [18]. Several versions of the equations provide the flow velocities required to initiate the motion of boulders, whether submerged or subaerial, through different transport modes such as sliding, rolling, and saltation, as expressed in Equations (4)–(6):
Sliding :   u 2 2 ρ s ρ w 1 × g × C × ( μ s × cos θ + sin θ ) C d × C B + μ s × C l
Rolling / overturning :   u 2 2 ρ s ρ w 1 × g × C × ( cos θ + C B × sin θ ) C d × C 2 B 2 + C l
Saltation / lifting :   u 2 2 ρ s ρ w 1 × g × C × cos θ C l
where “u” is flow velocity, “g” is gravitational acceleration (9.81 m/s2), “µs” is the coefficient of static friction between the boulder and the bed (0.7), “Cd” is the coefficient of drag (1.95) and “Cl” is the coefficient of lift (0.178) [18,23].

3. Results

3.1. Boulder Distribution and Morphometry

3.1.1. Oued Cherrat (Site 1)

The dataset distinguishes two categories of coastal boulders, solitary boulders (BL01 to BL26) and imbricated boulders (BL27 to BL61), which exhibit contrasting morphometric and spatial characteristics (Table 1).
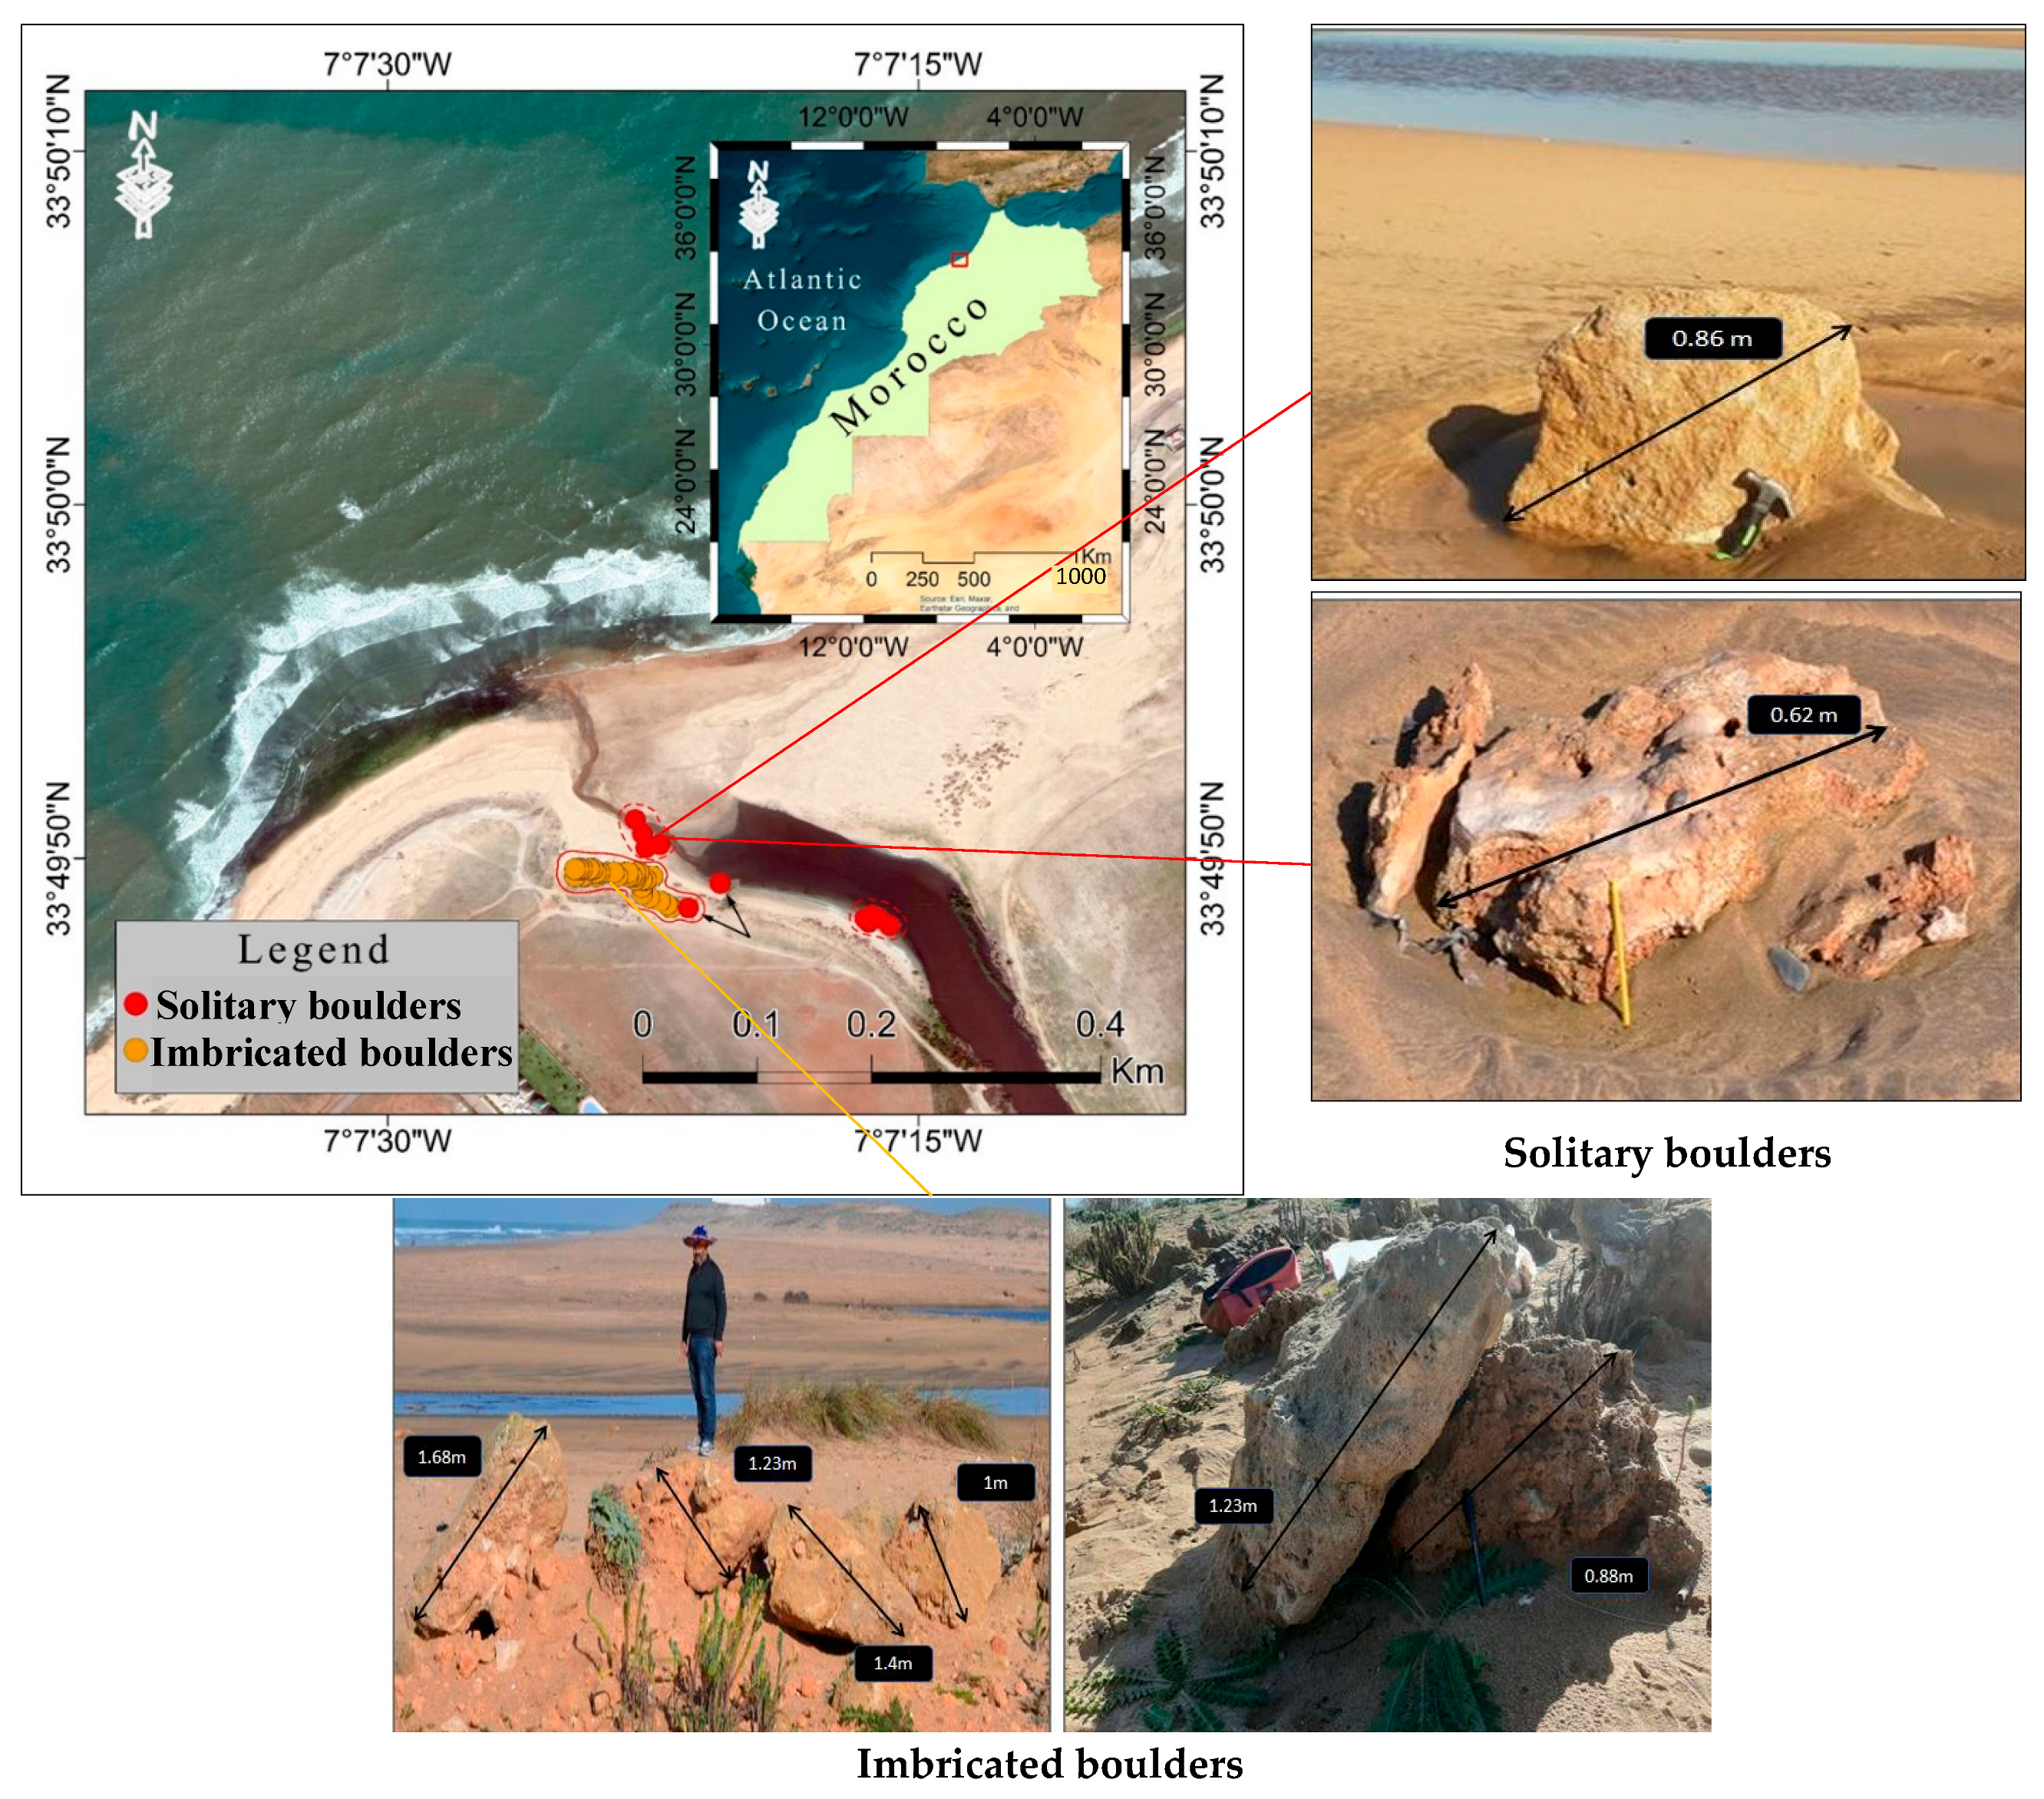
The solitary boulders (n = 26) are generally smaller in size, with A-axis lengths ranging from 0.25 to 1.1 m, and estimated masses between 0.01 and 0.44 t (Figure 2).
Their calculated volumes range from 0.01 to 0.20 m3, based on an assumed average density of 2.2 g/cm3, consistent with moderately cemented limestone. These boulders are scattered across the study site, located at distances between 30 and 94 m from the shoreline, and elevations ranging from 1.2 to 3.1 m above sea level. The variability in shape and size, as well as their isolated distribution, suggests that they were transported by moderate to high-energy storm waves, with limited subsequent reworking or rearrangement.
In contrast, the group of imbricated boulders (n = 35) presents significantly larger dimensions and masses than isolated boulders. The largest specimens reach up to 2.5 m along their longest axis (A-axis), with volumes exceeding 3.5 m3 and masses greater than 7 t. On average, the corrected volume of these boulders is estimated at 1.15 m3, with individual values ranging from 0.07 to 3.56 m3. The mean mass is approximately 2.47 t. These boulders are systematically located farther inland, at distances ranging from 100 to 150.5 m from the shoreline, with a mean transport distance of 125 m (Figure 3).
In terms of elevation, they are positioned at relatively uniform altitudes between 2.1 and 2.5 m above sea level, averaging around 1.32 m. The considerable dimensions, mass, and inland location of these clasts point to deposition by high-energy processes capable of transporting large boulders well beyond the high-water line. Their tightly clustered and imbricated configuration suggests limited post-depositional reworking and reinforces the interpretation of emplacement by powerful wave action, likely associated with exceptional storm surges. Moreover, the recurrence of blocks of comparable size and morphology at similar elevations supports the scenario of a single high-energy event or a short succession of such events.
Overall, the marked contrast between solitary and imbricated boulders in terms of size, mass, and spatial distribution reflects different emplacement mechanisms and hydrodynamic thresholds. The imbricated boulders, being larger and more concentrated, would have required significantly greater flow energy to be transported and deposited in their current positions. The long-axis orientations of solitary blocks are variable (N, NW, S, SE), in contrast to imbricated blocks within the boulder ridge, which are consistently imbricated towards the northwest (NW). This imbrication direction aligns with the prevailing wave climate along the Oued Cherrat coastline, where dominant swells approach from the north-northwest to northwest (NNW–NW), generated by North Atlantic storm activity. This suggests a strong correlation between wave direction and boulder transport dynamics. To better capture the central tendency of imbrication orientation, we used the median rather than the mean, as it is less sensitive to outliers.

3.1.2. Mansouria (Site 2)

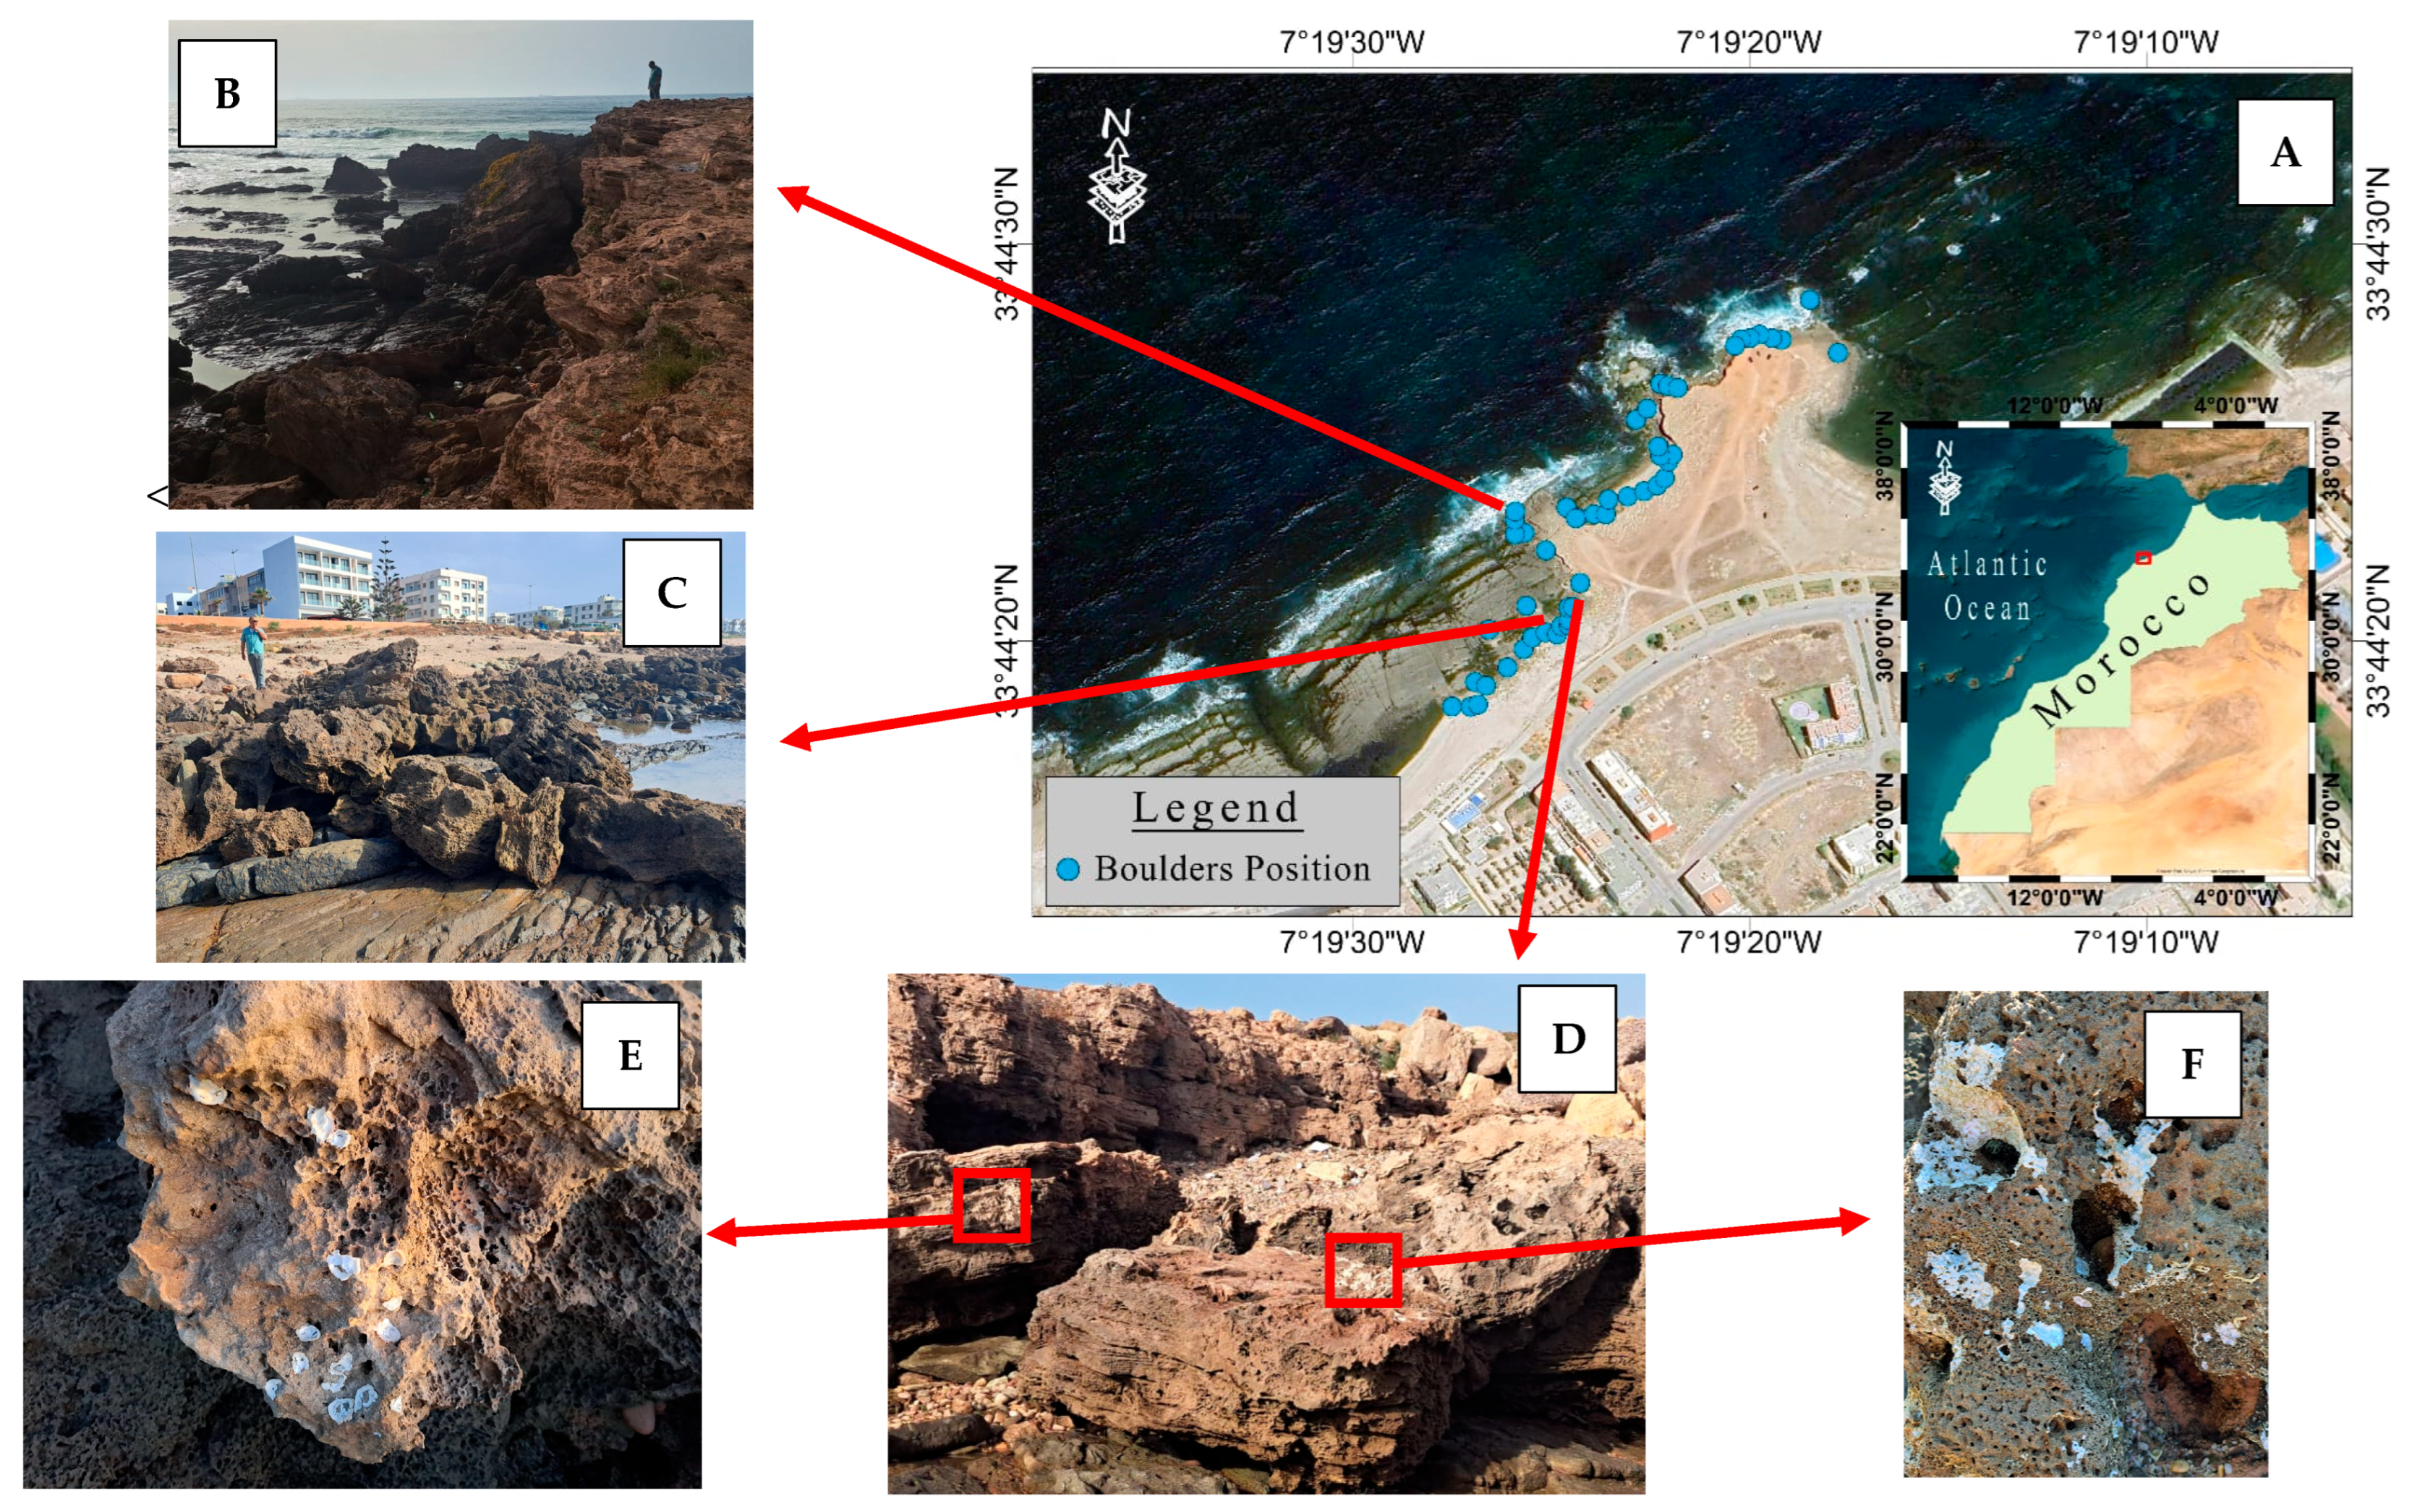
Several megaclasts have been observed on the Mansouria coast, characterized by marine biogenic encrustations and bio-indicators associated with marine erosion features suggest that these boulders originate from the subtidal zone (Figure 4).
Boulders at Mansouria are generally very large. The maximum size parameters (A, B, C) observed at Mansouria are 10.7 m × 8.9 m × 2 m. The mass varies from 308.3 to 1 tonne (average = 66.8 tonne) (Table 2). In terms of distribution, The Mansouria boulders occur in a variety of configurations, including solitary boulders and clusters. These clusters often form rows oriented north-west to south-east, between 5 and 140 m from the coast and 1–3 m asl. It should be noted that at the Mansouria site, in addition to the boulders observed, there are two megaboulders of considerable size has been observed. BLMA1 with 22 m × 20 m × 3.5 m and BLMA2 with are 20 m × 16 m × 3.5 m, with mass of over 2032 and 1478 tonne, respectively, both at an altitude of around 1.5 m and 68 m from the coast (Figure 5).
The boulder accumulations along the coast exhibit notable variations in size, reflecting spatial differences in hydrodynamic energy or availability of source material. Many of these clasts are imbricated, meaning they are stacked in an overlapping pattern, and their longest axes (A-axes) are predominantly aligned perpendicular to the shoreline, generally oriented toward the southeast. This systematic orientation suggests a consistent transport direction, most likely driven by high-energy wave activity.
The relationship between the coastal distance of the blocks and the weight of the latter, as well as the relationship between the altitude of the blocks and the weight of the blocks at Mansouria, is illustrated in Figure 6.
Several of the largest blocks (megaclasts) show signs of physical fragmentation and are encrusted with marine organisms such as barnacles (balanids), vermetid gastropods, and serpulidpolychaetes, indicating prolonged exposure to marine conditions. In addition, some reworked boulders display characteristic supratidal karst pools on their upper surfaces, (features typically formed by subaerial chemical weathering) implying that these blocks were originally located above the reach of normal tidal action before being remobilized.

3.2. Boulder Dynamics

A systematic photographic survey was conducted between 2021 and 2025, capturing conditions before and after the major storm events under investigation, notably the storms of January and March 2025. These time-stamped images provided a robust basis for identifying and analyzing boulder movement at both study sites. For boulders with clearly distinguishable initial and final positions, we were able to quantify both horizontal and vertical displacement. The documented movements involved two main types of clasts: (1) pre-existing boulders that were reoriented or repositioned either across the platform surface or within established boulder ridges at both Mansouria and Oued Cherrat, and (2) new boulders that became detached from in situ bedrock outcrops, particularly observed at the Mansouria site. Notably, at Oued Cherrat, some previously documented boulders were no longer present in post-storm imagery, suggesting either complete removal or submergence beyond the visible survey area.

3.2.1. Oued Cherrat

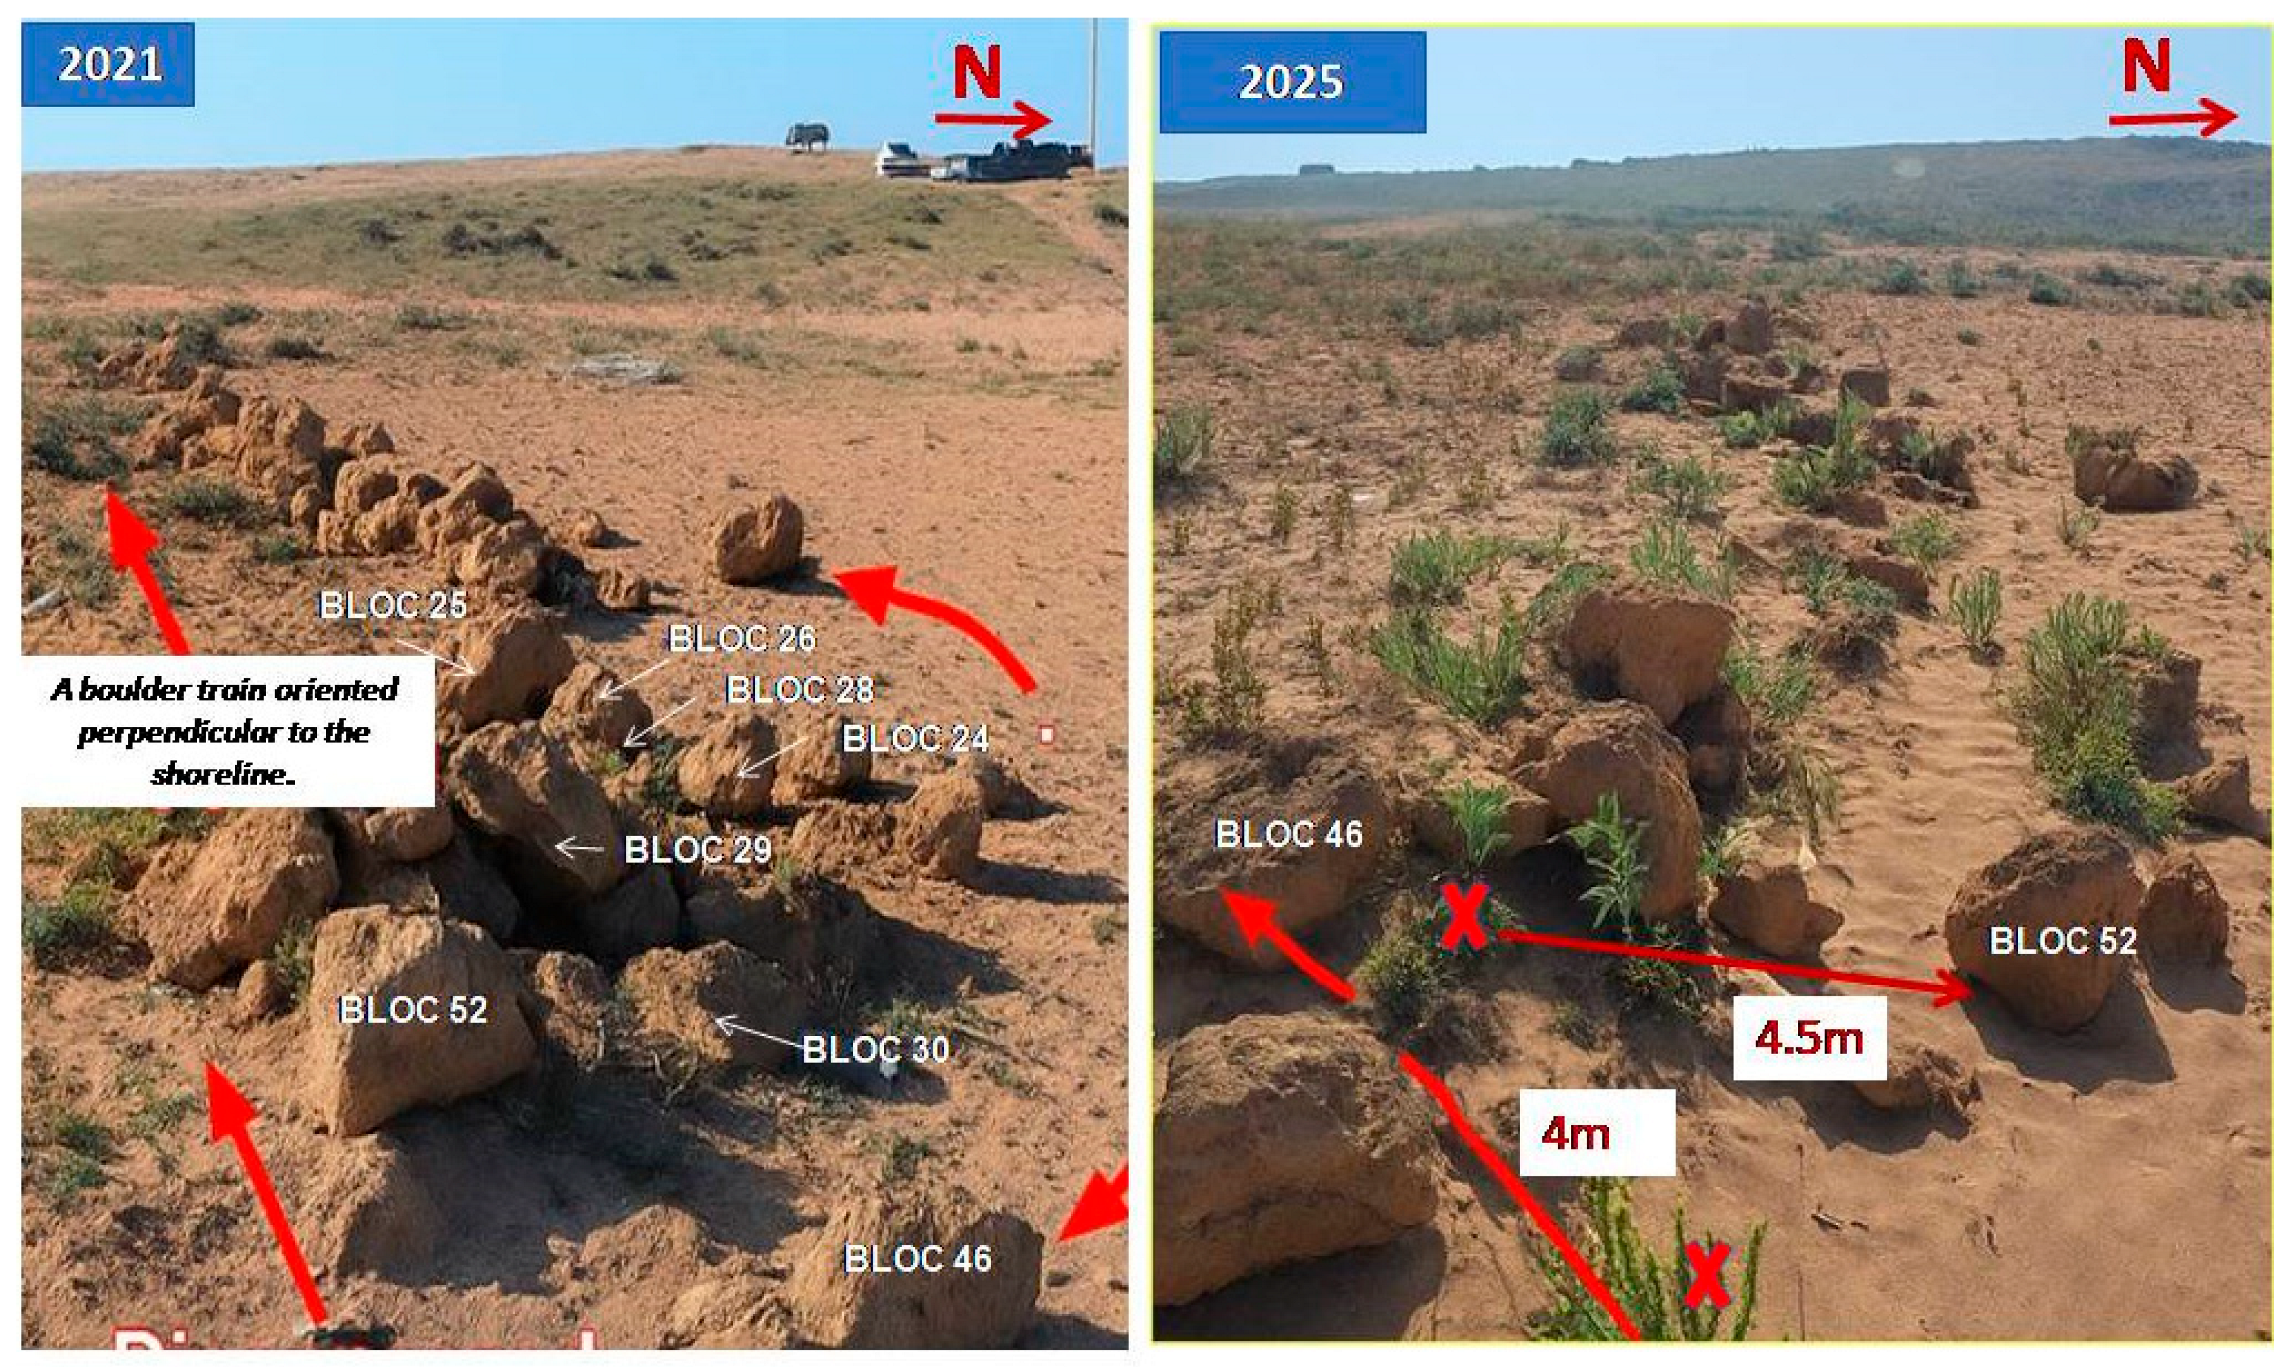
The comparative analysis of the two photographs (taken before and after the storm) clearly reveals significant boulder dynamics at the study site. In the “Before” image (right), a relatively continuous line of boulders is visible, aligned roughly in a WSW direction, some partially embedded in the sandy substrate (Figure 7). In contrast, the “After” image (left) shows a reorganization of this configuration with evidence of displacement and loss of alignment.
Several types of movement were identified, firstly, horizontal displacement of individual boulders, evidence from post-storm surveys indicates that several individual boulders experienced significant horizontal displacement across the coastal platform. For example, Boulder (BLOC 52), with an estimated mass of 6.39 t, was shifted approximately 4.5 m in a northeastward direction, aligning with the principal inland path of storm wave run-up. Likewise, Boulder (BLOC 46), estimated mass 6.34 t, was moved approximately 4.0 m landward (Table 1). These displacements illustrate the ability of high-energy storm waves to mobilize multi-tonne clasts over several meters, even across irregular, stepped bedrock surfaces.
Secondly, disappearance of boulders following storm events, in addition to the measured horizontal displacements, detailed visual analysis of the photographic time series reveals the disappearance of at least ten boulders across the study sites following the 2025 storm events. Of these, seven boulders, specifically BLOC 24, 25, 26, 28, 29, 30, and 54 each with an estimated mass below 1 tonne, were distinctly visible in pre-storm images but are no longer identifiable in the corresponding post-storm photographs. The loss of these boulders from the visible field can be attributed to two principal mechanisms: firstly, these blocks may have been transported outside the bounds of the surveyed area by strong storm wave forces; secondly, they may have become buried beneath sediment accumulations, collapsed rock debris, or other displaced materials, which is a common occurrence in dynamic high-energy coastal environments during extreme weather events. These processes of removal and burial not only explain the apparent disappearance but also reflect the significant sedimentological and geomorphological reworking triggered by storm impacts, resulting in the alteration of the spatial arrangement and surface exposure of boulder deposits.
These observations confirm that storm-induced hydrodynamic forces during the 2025 events were sufficient to mobilize multi-tonne boulders across the stepped coastal platform, resulting in displacements of several meters and occasional removal or concealment of large clasts. Additionally these observations confirm that, despite their large size, the coastal boulders are susceptible to extreme hydrodynamic forcing, especially during storm events (waves, run-up, backwash, or even sheet flow). The measured displacements, although variable, demonstrate that blocks weighing several hundred kilograms to possibly several t can be mobilized. The straight-line movement of some boulders, as well as the curved trajectories or rotation observed in others, points to a combination of transport mechanisms (sliding, rolling, overturning), likely influenced by terrain slope, boulder shape, and flow direction.

3.2.2. Mansouria

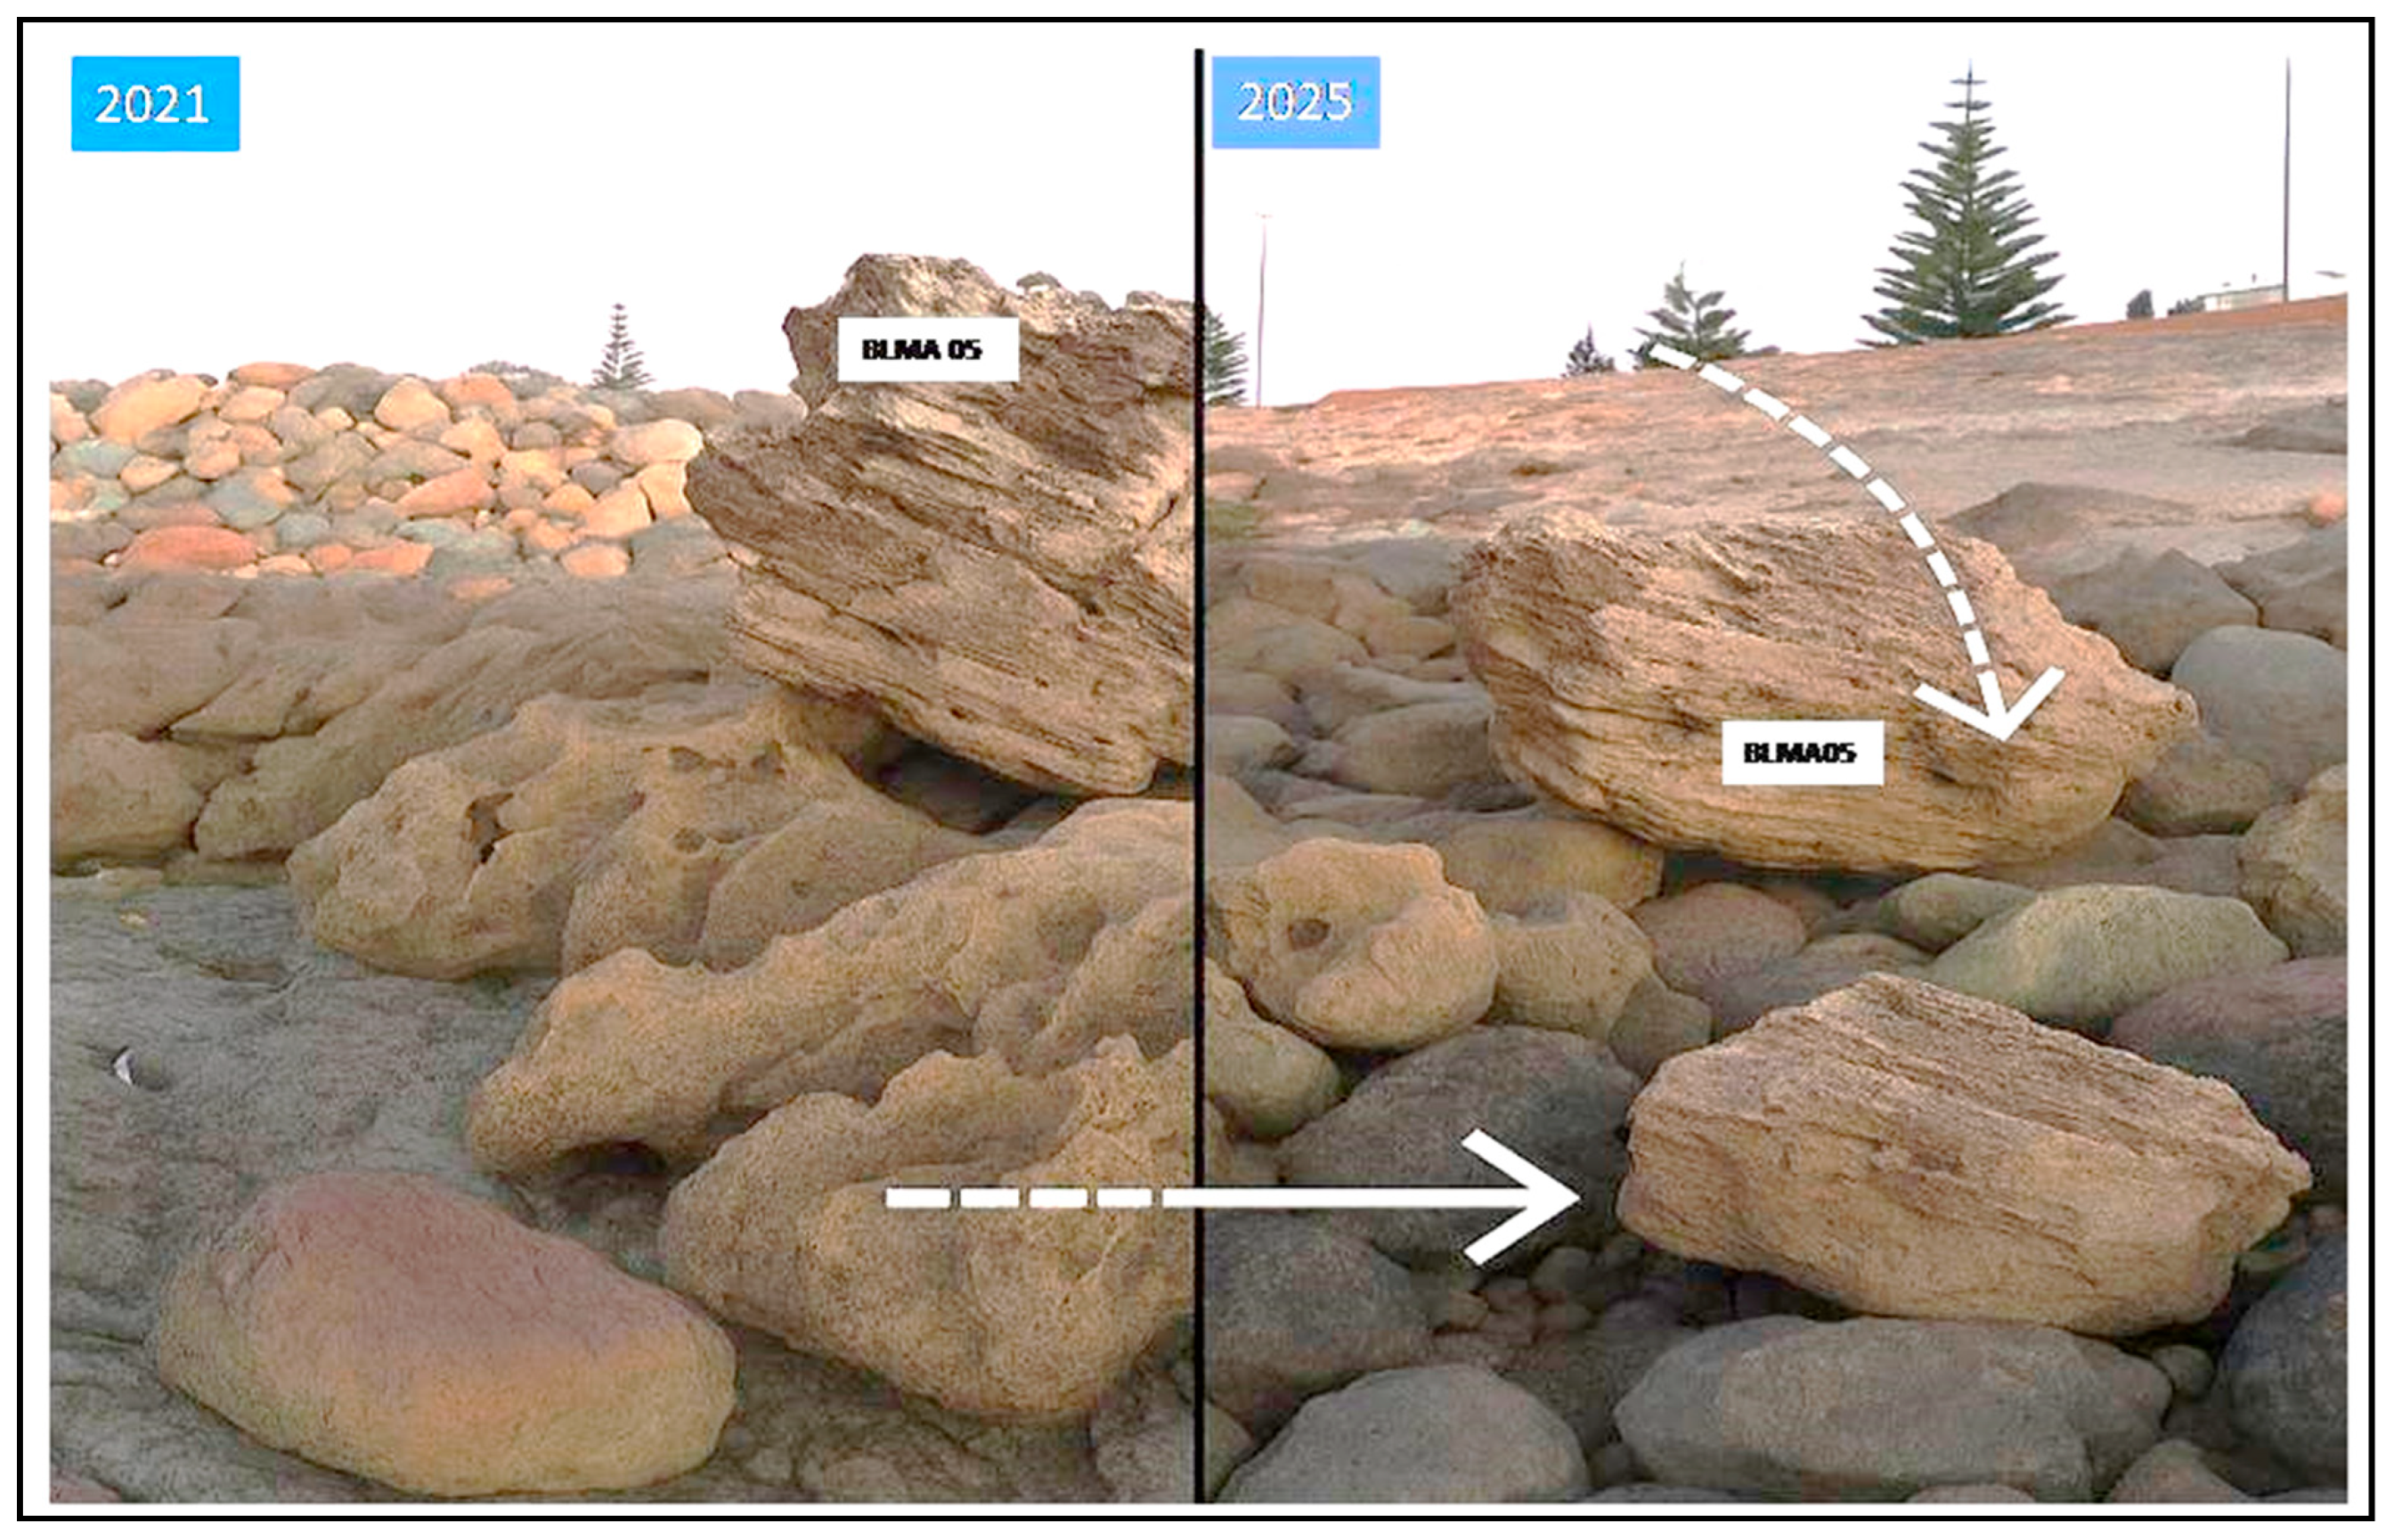
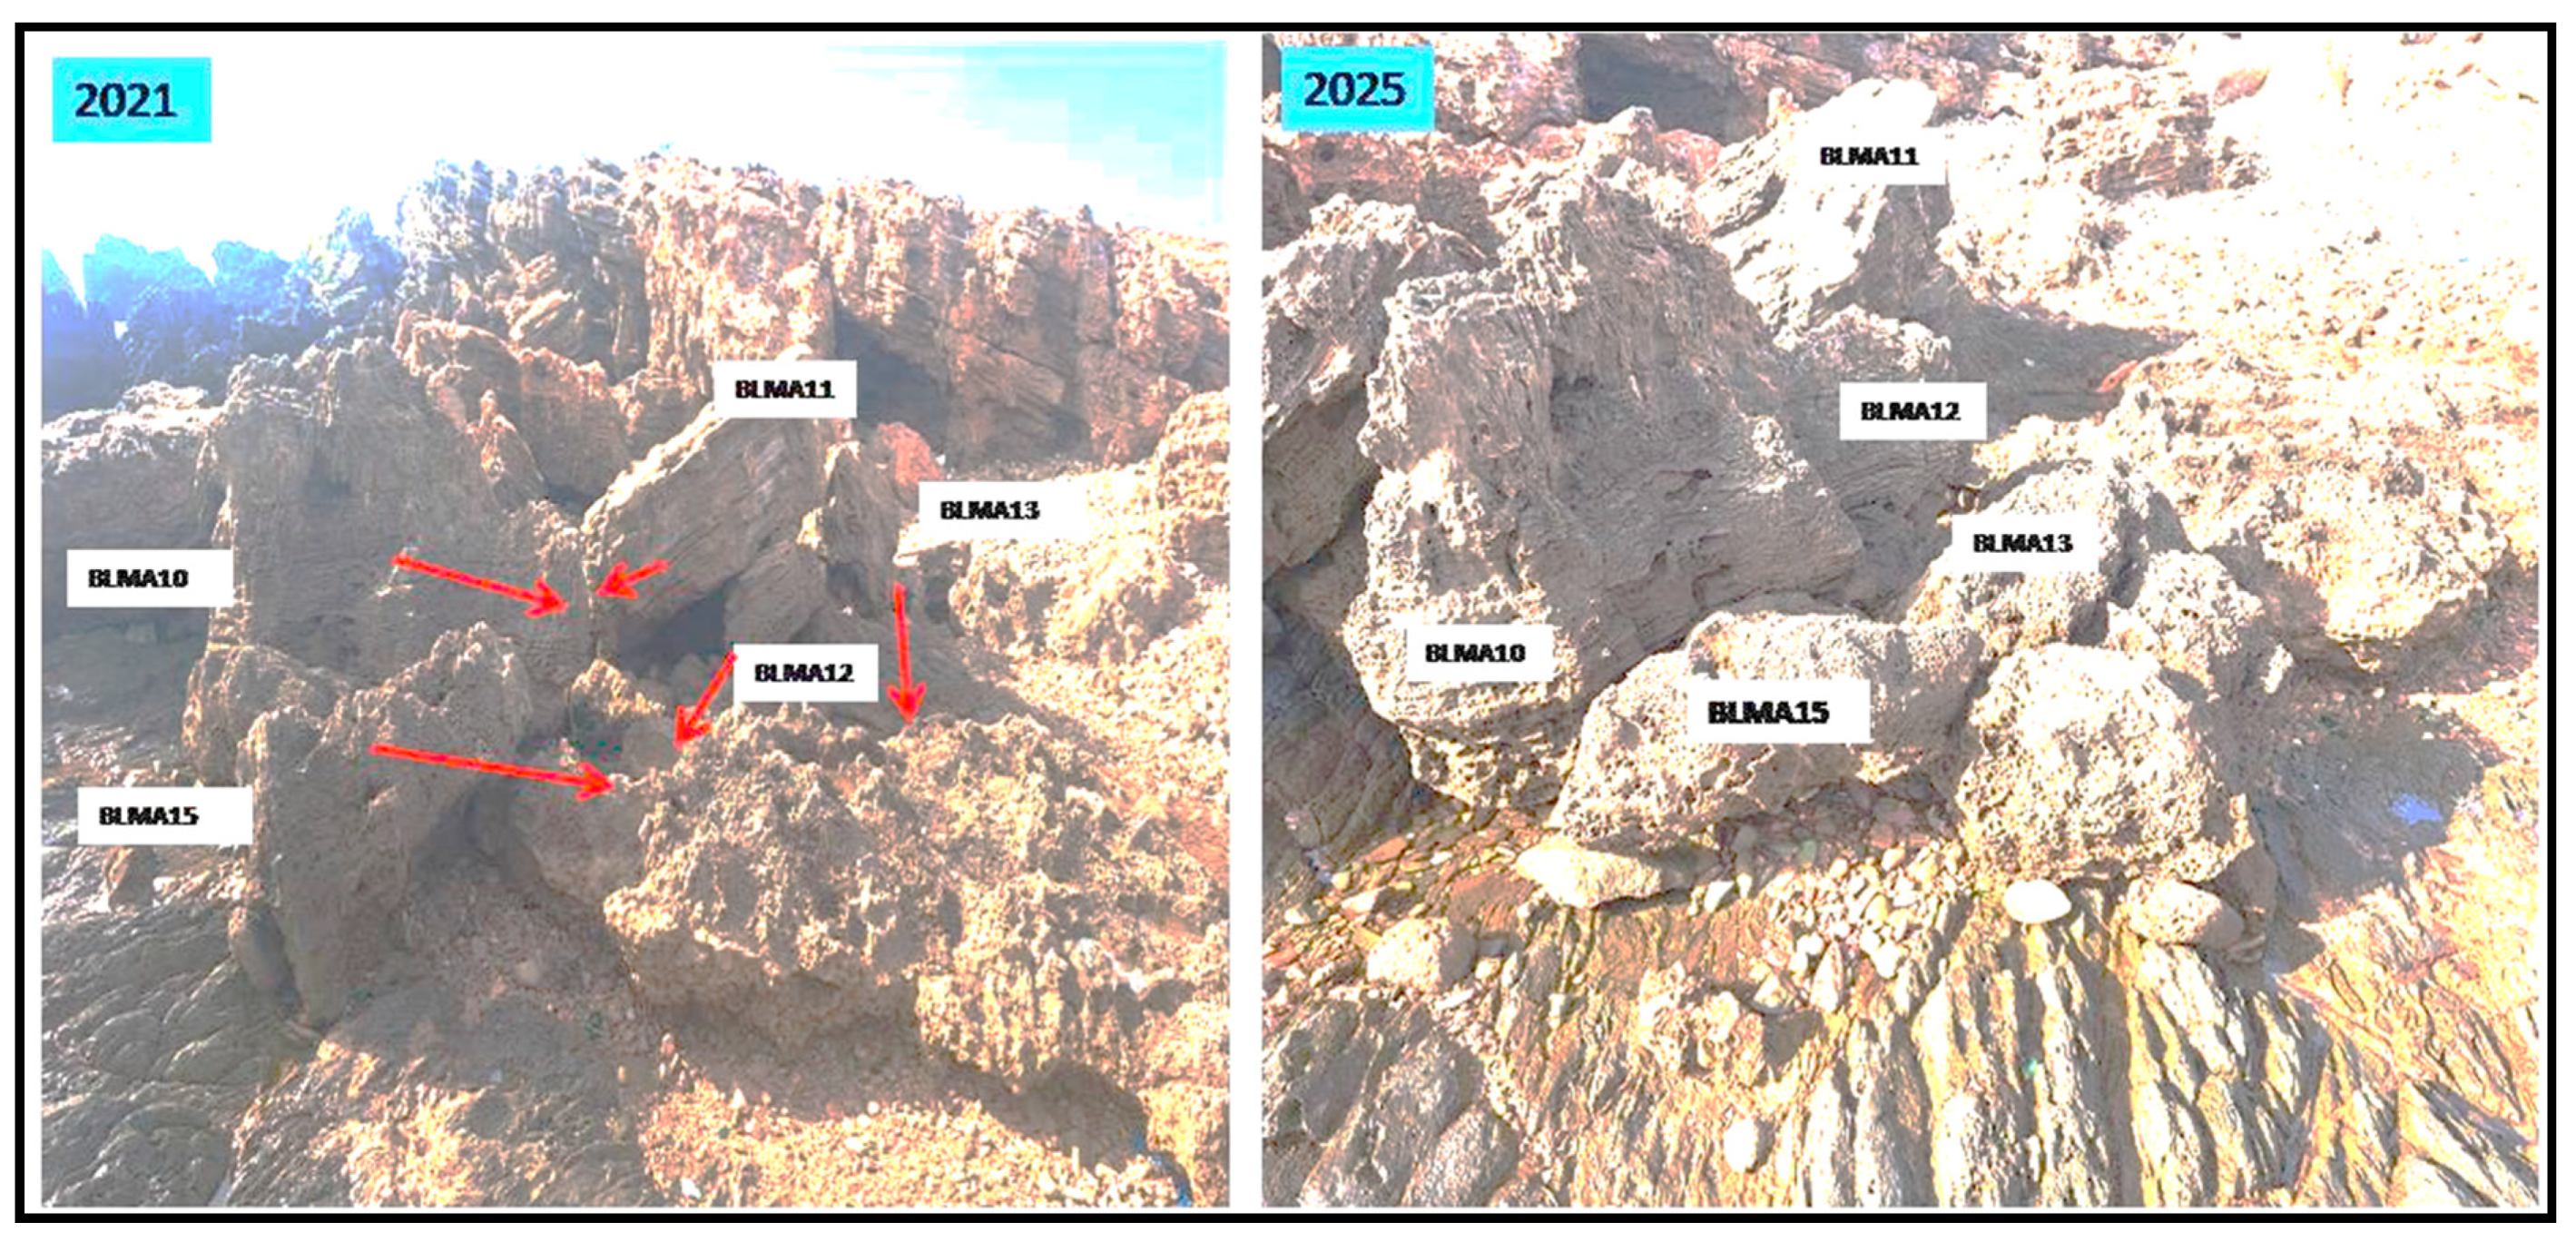
The comparative image clearly shows significant changes in the arrangement and distribution of coastal boulders in response to a high-energy storm event (Figure 8). The following key observations were made, first Displacement of Boulders, A comparative analysis of the photographic records taken before and after the storm event reveals clear evidence of boulder displacement within the study area. A total of 15 boulders were identified as having been mobilized inland to varying degrees, highlighting the mechanical impact of storm-induced hydrodynamic forces on the coastal platform.
Notably, several boulders that were originally well-aligned and relatively stable in the pre-storm image (right) appear to have undergone horizontal displacement in the post-storm configuration (left). This includes boulder (BLMA 5), with an estimated mass of 4.49 t, and, boulder (BLMA 10), weighing approximately 21.42 t, both of which are clearly visible in the photographs and were displaced inland. In addition to these larger elements, multiple other boulders BLMA 6, 7, 11, 12, 13, 14, 15, 30 and 43 were also found to have shifted. These blocks exhibit a range of masses from approximately 1 to 15 t. The measured displacement distances range from 0.5 m to over 3 m, with the most substantial movements observed in the heaviest boulders. In several cases, the orientation of the boulders has also changed, indicating that the blocks were not only translated but also rotated, tilted, or rolled during the storm event. These alterations in both position and attitude provide strong evidence that the wave forces associated with the storm had sufficient magnitude to overcome the gravitational and frictional resistance of even the larger, previously stable boulders. While no long-distance transport was recorded, the observed movements particularly among blocks exceeding several tonnes in mass underscore the significant reworking potential of storm waves on rocky coastal platforms.
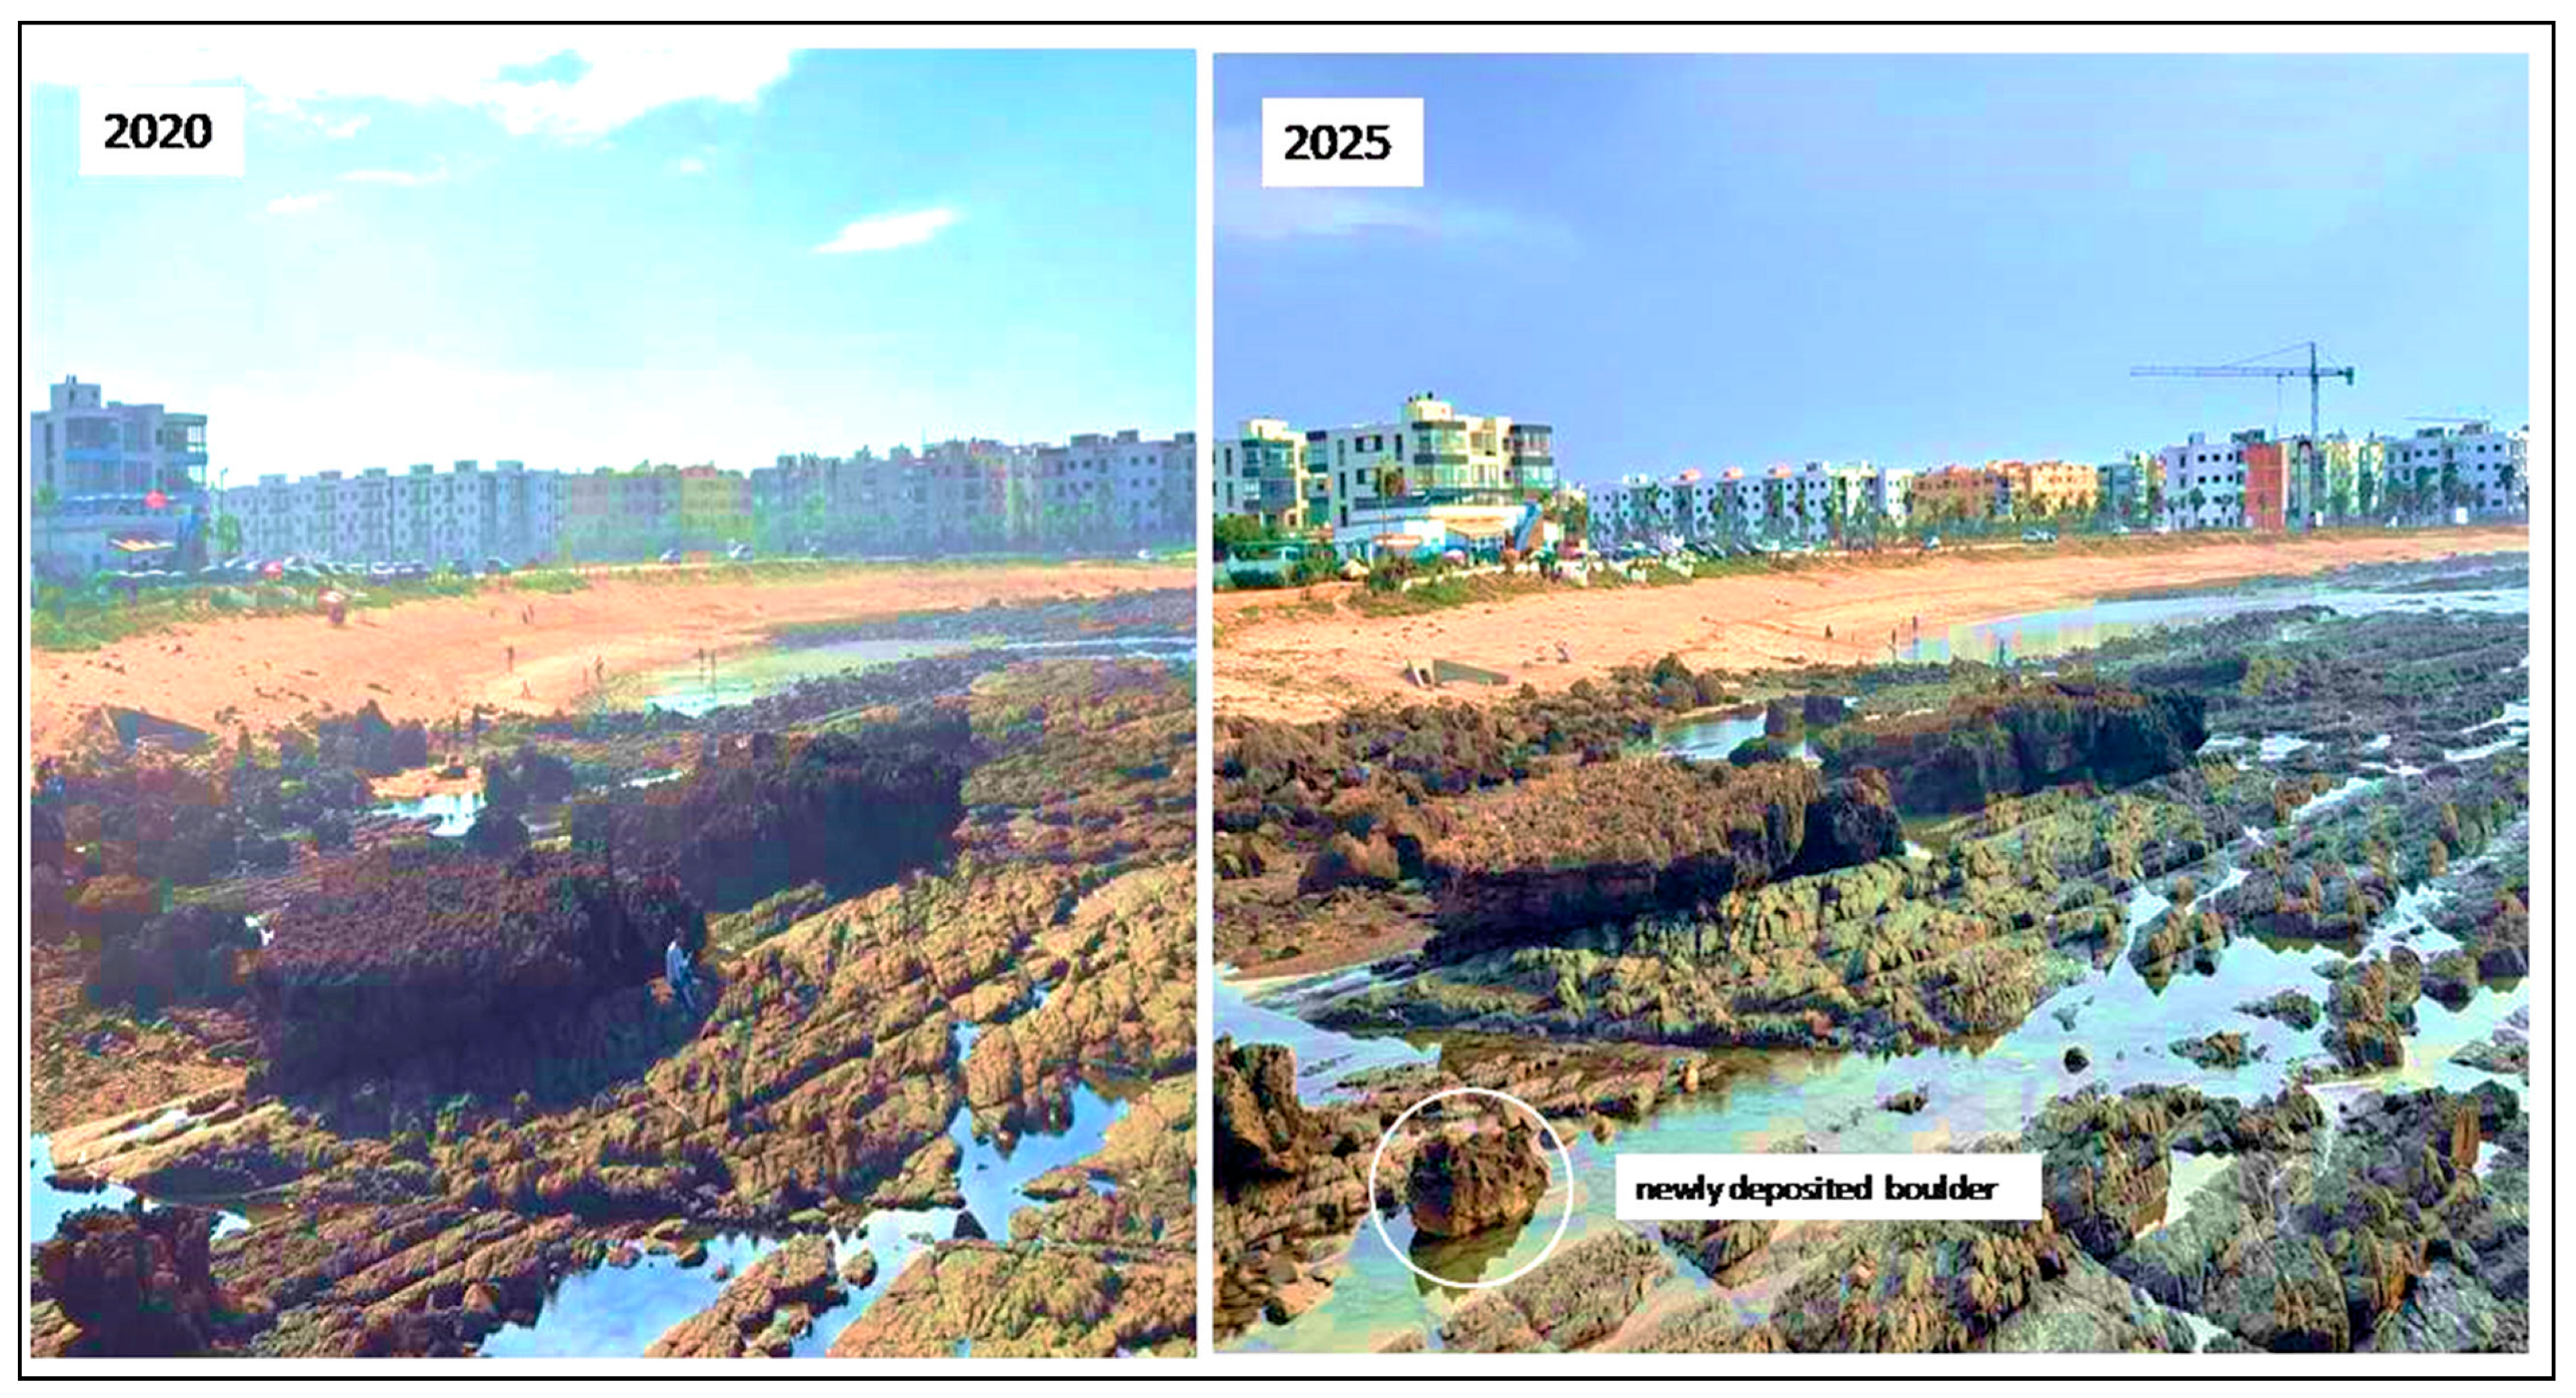
Secondly, newly deposited boulders, several elements visible exclusively in the post-storm image appear to correspond to newly emplaced boulders (Figure 9).
These blocks are absent or not detectable in the pre-storm photograph, suggesting that they were introduced to the area as a result of the storm. Their angular morphology and irregular spatial distribution indicate that they were likely detached from the adjacent bedrock outcrops or transported from other sectors of the coastal platform during high-energy wave action. The lack of alignment and the scattered nature of these boulders strongly support the hypothesis of recent emplacement associated with the storm event, rather than slow or progressive natural accumulation.
In support of our field observations and photographic comparisons, we produced a synthetic map illustrating the evolution of the spatial distribution and orientation of the most significant boulders at the Mansouria study site (Figure 10).
This map compiles GPS-based positioning data from multiple years (2010–2024), overlaid on high-resolution satellite imagery, and focuses on three key coastal sectors labeled a, b, and c. The latest boulder positions (2024, in green) are compared with those from earlier years, allowing for precise documentation of displacement, rotation, and new emplacement patterns. In areas a and b, the displacement patterns show progressive inland migration, while sector c reveals positional changes even among blocks located in the lower platform or partially submerged zones. The chaotic clustering and apparent rotations in the recent boulder distribution strongly support the interpretation of storm-driven reorganization, rather than slow, long-term processes.
Crucially, even the largest boulders in the dataset, namely BLMA 1 (2032.80 t) and BLMA 2 (1478.40 t), show slight reorientation. While no significant horizontal displacement was recorded for these massive clasts, subtle angular changes in their long axes suggest that they were rotated in situ, likely due to wave-induced torque or localized uplift during storm impact. This cartographic synthesis provides compelling spatial evidence of the dynamic reconfiguration of the boulder field at Mansouria, underscoring the geomorphological impact of recent high-energy marine events and confirming the conclusions drawn from our ground-based measurements and photographic analyses.

3.3. Estimation of the Minimum Flow Velocity for Initiation of Boulder Motion

3.3.1. Oued Cherrat (Site 1)

According to Nandasena et al. [18], there are three pre-transport processes for calculating the wave velocity required to initiate boulder movement on a rock platform. The bore velocities required to initiate boulder movement at the Oued Cherrat site were estimated using the equations of [18] for two transport mechanisms: sliding and rolling. The dataset includes both solitary and imbricated boulders (Table 3).
For the solitary boulders (BLOC01 to BLOC22), sliding velocities range from 1.11 m/s to 2.56 m/s, while rolling velocities range from 0.79 m/s to 4.12 m/s. These relatively low values suggest that these blocks may be smaller, less embedded, or more exposed on the surface. Most solitary boulders show sliding thresholds between 1.5 and 2.5 m/s, and rolling thresholds between 1.4 and 3.5 m/s, indicating that moderate-energy wave events may be sufficient to initiate their movement.
The imbricated boulders (BLOC23 to BLOC57) exhibit higher resistance, with sliding velocities reaching up to 4.01 m/s (BLOC52) and rolling velocities up to 6.12 m/s. These elevated thresholds reflect the additional mechanical stability provided by clast imbricated and possibly larger boulder dimensions.
There is considerable variability among the imbricated blocks: some, like BLOC24, require relatively low velocities (1.89 m/s sliding; 1.87 m/s rolling), while others such as BLOC36 to BLOC39 require rolling velocities above 5.5 m/s, highlighting their enhanced stability. These results imply that only high-energy hydrodynamic conditions (e.g., extreme storm waves or tsunami flows) would be sufficient to mobilize such blocks.
In all cases, the sliding velocities are consistently lower than the rolling velocities, which confirms that sliding is the most probable initial transport mechanism. Furthermore, the wide range of required velocities highlights the influence of boulder morphology, emplacement conditions, and degree of imbricated on transport thresholds. These variations suggest that the hydrodynamic energy needed to mobilize boulders at this site is highly dependent on individual block characteristics and their arrangement within the deposit.

3.3.2. Mansouria (Site 2)

The bore velocities required to initiate boulder movement at the Mansouria site were estimated using the hydrodynamic equations developed by Nandasena et al. [18] for two transport modes: sliding and rolling. The results reveal a significant variability in the critical velocities among the 50 analyzed boulders (BLMA1–BLMA50) (Table 4).
Sliding velocities range from 2.71 m/s (BLMA6) to 11.05 m/s (BLMA1), while rolling velocities vary from 3.66 m/s (BLMA12) to 18.23 m/s (BLMA1). In all cases, the velocity required for rolling is higher than that for sliding, which is consistent with the higher energy demand of rotational movement.
Several boulders, such as BLMA1, BLMA2, BLMA35, BLMA36, and BLMA50, show high resistance to movement, requiring bore velocities exceeding 10 m/s (sliding) or 17 m/s (rolling). These values suggest that only high-energy events such as major storm surges or tsunamis would be capable of mobilizing these large blocks. In contrast, smaller or more isolated boulders such as BLMA6 and BLMA12 show much lower thresholds, indicating that they could potentially be displaced by less intense waves.
The majority of boulders show sliding thresholds between 3 and 8 m/s and rolling thresholds between 5 and 13 m/s, defining a typical range of hydrodynamic conditions for boulder transport on this site. These results support the hypothesis that both block size and emplacement conditions (e.g., degree of embedment, imbricated, or slope) control the variability in transport resistance. The systematically lower thresholds for sliding indicate that it is likely the dominant initial mechanism of transport, particularly for boulders lying directly on the surface without substantial imbricated.

4. Discussion

4.1. Boulder Morphometric and Topographic Relationships

Morphometric analysis conducted at the two study sites, Oued Cherrat and Mansouria reveals marked disparities in boulder size, mass, and spatial distribution, reflecting differing hydrodynamic regimes and coastal morphologies. At Oued Cherrat, two distinct morphological categories of boulders were identified, first, small isolated boulders, with axis A measuring less than 1.1 m and estimated masses generally below 2 t, and second massive imbricated boulders, reaching up to 2.5 m in length and exceeding 7 t. This morphological differentiation is matched by a contrasting spatial distribution: small isolated boulders are located closer to the shoreline (30–94 m), whereas the larger imbricated boulders are positioned further inland, between 100 and 150.5 m. Such spatial organization suggests hydrodynamic sorting based on wave energy: lighter boulders are more easily displaced but to shorter distances, while heavier ones require exceptional energy to be transported inland over longer ranges. In contrast, the boulder morphology at Mansouria is dominated by the presence of exceptionally large megaboulders, some measuring up to 22 × 20 × 3.5 m, with estimated masses exceeding 2000 t. Unlike Oued Cherrat, the topographic distribution of these colossal blocks appears relatively uniform, ranging from 1.5 to 3 m above sea level and up to 140 m from the shoreline. This homogeneous positioning is indicative of emplacement during high-energy events, such as powerful storms or tsunamis, capable of mobilizing extremely large masses. A particularly telling feature is the presence of supratidal karst pools on the upper surfaces of some reworked boulders at Mansouria. These features indicate prolonged prior subaerial exposure, suggesting that some boulders were transported from previously inland positions, adding further complexity to their remobilization pathways. These findings are consistent with those of Goto et al. [9] and Etienne and Paris [38], who demonstrated a strong correlation between boulder size, imbricated configuration, and topographic position as indicators of the hydrodynamic conditions at the time of deposition. The combined analysis of morphometry, mass, and spatial distribution thus provides valuable insight into the nature and intensity of the extreme coastal processes, whether storm or tsunami related responsible for boulder emplacement. In addition to the morphometric and spatial evidence, it is important to consider the cumulative effect of multiple extreme waves in shaping boulder emplacement. Studies from the ABC Islands have shown that successive high-energy waves, whether tsunami or storm generated, can progressively destabilize large coastal blocks, increasing their likelihood of detachment and enhancing transport distances.

4.2. Boulder Transport Dynamics

Diachronic analysis of boulder transport between 2021 and 2025, based on high-resolution GPS measurements and post-storm observations, reveals significant movement patterns attributable to the major storm events of January and March 2025. These events generated hydrodynamic forces sufficient to mobilize multi-tonne boulders, substantially modifying the morphodynamic structure of both study sites. At Oued Cherrat, several large boulders each weighing over 6 t were displaced horizontally over distances ranging from 4 to 4.5 m. Such movements imply extremely high-energy conditions, particularly considering the relatively gentle slope of the coastal platform. In parallel, the disappearance of smaller boulders (less than 1 tonne) suggests either transport beyond the surveyed area or burial beneath storm-induced sediment, a process often documented in high-energy coastal settings [16]. These findings confirm that coastal boulder fields can be substantially restructured within hours during extreme storm events. At Mansouria, measured displacements ranged from 0.5 to 3 m for 15 boulders, some of which exceeded 21 t. In addition, new boulders were identified in post-storm imagery, likely resulting from detachment from adjacent rocky outcrops, suggesting that both transport and source area erosion were active. Notably, subtle reorientations were detected for megaboulders exceeding 1000 t, even though no significant translational movement was recorded. These slight rotations reflect the magnitude of the hydrodynamic stresses involved, which, while insufficient to induce horizontal transport, were capable of partially destabilizing these massive structures. These observations support the findings of Barbano et al. [39] and Cox et al. [16], who highlighted the potential for extreme storm events to mobilize even multi-tonne boulders and rapidly reconfigure coastal boulder accumulations. Collectively, these results underscore the pivotal role of storms in contemporary boulder transport dynamics and offer valuable insights for interpreting past extreme events based on present-day depositional patterns.

4.3. Flow Velocity Estimates and Comparison with the Literature

The estimated flow velocities required to initiate boulder transport, calculated using the equations proposed by Nandasena et al. [18], vary significantly between the two study sites. At Oued Cherrat, sliding velocities for isolated boulders ranged from 1.1 to 2.5 m/s, while imbricated boulders required up to 4.0 m/s for sliding and 6.1 m/s for rolling. In contrast, at Mansouria, the estimated thresholds were much higher, exceeding 11 m/s (sliding) and reaching over 18 m/s (rolling) for megaboulders. When compared with the results of Khalfaoui et al. [21], who analyzed mid-sized coastal boulders along a similar stretch of the Moroccan coast, a clear contrast emerges. Their reported thresholds ranged from 2.5 to 5.5 m/s for sliding and 2.9 to 8.4 m/s for rolling, with approximate means of 3.9 m/s and 5.4 m/s, respectively. These intermediate values fall between those observed for imbricated boulders at Oued Cherrat and the much higher values calculated for the largest boulders at Mansouria. This comparison highlights the strong dependence of critical transport thresholds on the morphological context, anchoring conditions, and block mass. The values provided by Khalfaoui et al. [21] appear to represent moderately embedded boulders, confirming ranges identified in similar settings by Engel and May [30] in Kennedy et al. [40] in Hawai’i. Overall, the data suggest that most boulders could be mobilized by extreme storm-induced flows (>8 m/s), while the largest megaboulders likely require tsunami-scale energy.

4.4. Origin of the Boulders: Storm or Tsunami?

Determining whether the coastal boulders were emplaced by storm waves or by tsunami remains a key question in understanding the morphodynamic processes shaping the Atlantic rock platforms [19,41]. An integrated analysis of field observations, morphometric characteristics, and hydrodynamic transport thresholds provides multiple lines of evidence in favor of a predominantly storm-driven origin for the majority of the boulders observed at Oued Cherrat and Mansouria. First, the major winter storms of 2025 clearly demonstrated the capacity to mobilize large blocks, over 20 t at Mansouria and more than 6 t at Oued Cherrat. These values align with the minimum flow velocities calculated using established transport equations (e.g., [18]), and fall within the range of boulder transport observed under extreme storm conditions elsewhere [30,40]. The direct evidence of recent displacement, documented between 2021 and 2025, further confirms the mechanical efficiency of storm-induced wave energy along the Moroccan Atlantic coast. Second, the northwestward imbrication of boulders at Oued Cherrat closely matches the dominant wave direction (NNW–NW) associated with Atlantic storm systems. This directional correlation between wave forcing and boulder orientation strongly supports a storm-wave emplacement mechanism. In contrast, tsunami-generated boulder fields typically exhibit more chaotic or radial dispersion patterns, depending on local topography and flow conditions. Third, the sedimentary context does not exhibit typical tsunami-related features such as laminated deposits, inverted beds, or reworked organic inclusions. Instead, the pattern of boulder rearrangement appears progressive and chaotic, suggesting multiple episodes of remobilization rather than a single high-energy event. This interpretation is reinforced by the presence of marine erosion features and fossilized supratidal karst pools on the largest boulders (e.g., BLMA1, BLMA2), indicating prolonged exposure and polyphase reworking consistent with a storm-dominated regime. Nonetheless, some caution is warranted. The extreme mass of certain blocks at Mansouria, particularly those exceeding 15 to 20 t, surpasses the theoretical transport limits of storm waves under current topographic and hydrodynamic conditions. These outliers may reflect either an overestimation of their actual stability (e.g., due to partial undermining or basal erosion), or an ancient tsunami emplacement followed by later storm-induced remobilization. This hypothesis remains plausible in the absence of absolute chronological constraints. Therefore, while the majority of the available evidence wave direction, observed displacement, flow velocity thresholds, and sedimentological signatures, supports a recurrent storm-driven origin, the possibility of a palaeotsunami origin for a few megaboulders cannot be entirely excluded. To resolve this ambiguity, further investigations involving absolute dating techniques (e.g., radiocarbon, optically stimulated luminescence) and high-resolution sedimentological analyses will be required. In conclusion, the most parsimonious interpretation of the current dataset is one of predominant boulder emplacement and remobilization by extreme storm events, with a residual possibility of tsunami influence limited to a small number of exceptional blocks.

5. Conclusions

This study provides the first integrated morphometric and hydrodynamic assessment of supratidal boulder deposits at Oued Cherrat and Mansouria on the Moroccan Atlantic coast, revealing distinct differences in boulder size, spatial distribution, and transport dynamics between the two sites. At Oued Cherrat, boulders are categorized into small solitary clasts (≤2 t) located closer to shore and larger imbricated blocks (>7 t) positioned further inland, indicating hydrodynamic sorting and emplacement by high-energy storm waves. In contrast, Mansouria is dominated by exceptionally large megaboulders, some exceeding 2000 t, whose uniform elevation and inland positions suggest emplacement during rare, extreme events such as major storm surges or tsunamis. Storm events triggered significant reorganization of both boulder fields, with multi-tonneclasts displaced up to 4.5 m inland at Oued Cherrat and up to 3 m at Mansouria, alongside the detachment and deposition of new blocks. Even megaboulders displayed subtle in situ rotations, underscoring the magnitude of storm-induced hydrodynamic forces. Hydrodynamic modelling showed that the initiation of motion required sliding velocities ranging from 1.1–4.0 m/s at Oued Cherrat and up to 11.0 m/s at Mansouria, with rolling thresholds consistently higher. These values highlight the strong influence of block mass, imbricated degree, and topographic setting on transport resistance. Overall, the findings confirm that extreme storm waves are capable of mobilizing and reconfiguring multi-tonneclasts along the Moroccan Atlantic coast, with the largest megaboulders likely requiring exceptional events for displacement. This research enhances the understanding of boulder transport thresholds in high-energy environments and provides a valuable empirical basis for refining coastal hazard assessments and predictive models under future climate-driven increases in extreme marine events.

Author Contributions

Conceptualization, A.G., R.C. and N.M.; methodology, A.G., R.C. and N.M.; software, H.S., O.T. and M.O.L.; Resources, A.G., H.S., O.T. and M.O.L.; validation, A.G., R.C. and N.M.; formal analysis, A.G., R.C., H.S. and N.M.; writing—original draft preparation, A.G., R.C., H.S. and N.M.; writing—review and editing, A.G., R.C., H.S., O.T., M.O.L. and N.M.; visualization, H.S., O.T. and M.O.L.; supervision, R.C. and N.M.; funding acquisition, A.G. All authors have read and agreed to the published version of the manuscript.

Funding

This research received no external funding.

Data Availability Statement

The authors strongly encourage interested researchers to contact us, as we are more than willing to share the data upon request.

Acknowledgments

The authors would like to thank all those who collaborated in this work through field sampling, data analysis, and manuscript preparation. The authors also thank the GEOPAC Research Center, Geophysics and Natural Hazards Laboratory, Scientific Institute, Mohammed V University in Rabat, Morocco, for their valuable support. RC would also like to acknowledge the support pro-vided by NSF Award 2114016.

Conflicts of Interest

The authors declare no conflicts of interest.

References

  1. Causon Deguara, J.; Gauci, R.; Inkpen, R. Coastal Boulder Deposits in the Mediterranean: A Comprehensive Review of Research and Findings. Mediterr. Geosci. Rev. 2025, 7, 255–274. [Google Scholar] [CrossRef]
  2. Cox, R.; o’Boyle, L.; Cytrynbaum, J. Imbricated Coastal Boulder Deposits Are Formed by Storm Waves, and Can Preserve a Long-Term Storminess Record. Sci. Rep. 2019, 9, 10784. [Google Scholar] [CrossRef]
  3. Nott, J. Waves, Coastal Boulder Deposits and the Importance of the Pre-Transport Setting. Earth Planet. Sci. Lett. 2003, 210, 269–276. [Google Scholar] [CrossRef]
  4. Mhammdi, N.; Medina, F.; Kelletat, D.; Ahmamou, M.; Aloussi, L. Large Boulders along the Rabat Coast (Morocco); Possible Emplacement by the November, 1st, 1755 A.D. Tsunami. Sci. Tsunami Hazards 2008, 27, 17–30. [Google Scholar]
  5. Kennedy, A.; Cox, R.; Engel, M.; Speyrer, E.; Lau, A.; Mori, N. The Inundation Signatures on Rocky Coastlines Global Database for Coastal Boulder Deposits (ISROC-DB). Mar. Geol. 2025, 487, 107581. [Google Scholar] [CrossRef]
  6. Nott, J. How High Was the Storm Surge from Tropical Cyclone Mahina?: North Queensland, 1899. Aust. J. Emerg. Manag. 2000, 15, 14–19. [Google Scholar]
  7. Noormets, R.; Crook, K.; Felton, E. Sedimentology of Rocky Shorelines: 3.: Hydrodynamics of Megaclast Emplacement and Transport on a Shore Platform, Oahu, Hawaii. Sediment. Geol. 2004, 172, 41–65. [Google Scholar] [CrossRef]
  8. Hall, A.; Hansom, J.; Williams, D.; Jarvis, J. Distribution, Geomorphology and Lithofacies of Cliff-Top Storm Deposits: Examples from the High-Energy Coasts of Scotland and Ireland. Mar. Geol. 2006, 232, 131–155. [Google Scholar] [CrossRef]
  9. Goto, K.; Miyagi, K.; Kawamata, H.; Imamura, F. Discrimination of Boulders Deposited by Tsunamis and Storm Waves at Ishigaki Island, Japan. Mar. Geol. 2010, 269, 34–45. [Google Scholar] [CrossRef]
  10. Qiu, H.; Li, T.; Zhang, B. The Impact of Climate Change on the Earth System and Its Simulation Predictions: Progress, Challenges, and Future Directions. Geogr. Res. Bull. 2024, 3, 231–246. [Google Scholar]
  11. Feng, S.; Hu, C.; Li, X.; Sun, W.; Quaye, J.A.; Su, H.; Dong, C. Tempestites in the Marine Environment: Review and Perspectives. Int. Geol. Rev. 2025, 67, 1353–1375. [Google Scholar] [CrossRef]
  12. Mhammdi, N.; Medina, F.; Font, E.; Belkhayat, Z.; Geawhari, M.A. Sedimentary evidence of palaeo-tsunami deposits along the Loukkos estuary (Moroccan Atlantic coast). Sci. Tsunami Hazards 2015, 34, 83–100. [Google Scholar]
  13. El Messaoudi, B.; Ait Laâmel, M.; El Hou, M.; Bouksim, H. Situations Des Fortes Houles Sur Les Côtes Atlantiques Marocaines. In Actes Session Plénière Académie Hassan II des Sciences & Techniques; Académie Hassan II des Sciences et Techniques: Rabat, Morocco, 2016; pp. 79–99. [Google Scholar]
  14. Cherfaoui, N.; Doghmi, H. Vagues Dans l’océan: Nouveau Regard Sur Les Digues Portuaires; Sciences de l’Ingénieur: Rabat, Morocco, 2002; ISBN 978-9954-8143-0-7. [Google Scholar]
  15. Cox, R.; Ardhuin, F.; Dias, F.; Autret, R.; Beisiegel, N.; Earlie, C.; Herterich, J.; Kennedy, A.; Paris, R.; Raby, A.; et al. Systematic Review Shows That Work Done by Storm Waves Can Be Misinterpreted as Tsunami-Related Because Commonly Used Hydrodynamic Equations Are Flawed. Front. Mar. Sci. 2020, 7, 4. [Google Scholar] [CrossRef]
  16. Cox, R.; Lopes, W.A.; Jahn, K.L. Quantitative Roundness Analysis of Coastal Boulder Deposits. Mar. Geol. 2018, 396, 114–141. [Google Scholar] [CrossRef]
  17. Cox, R.; Zentner, D.B.; Kirchner, B.J.; Cook, M.S. Boulder Ridges on the Aran Islands (Ireland): Recent Movements Caused by Storm Waves, Not Tsunamis. J. Geol. 2012, 120, 249–272. [Google Scholar] [CrossRef]
  18. Nandasena, N.A.K.; Paris, R.; Tanaka, N. Reassessment of Hydrodynamic Equations: Minimum Flow Velocity to Initiate Boulder Transport by High Energy Events (Storms, Tsunamis). Mar. Geol. 2011, 281, 70–84. [Google Scholar] [CrossRef]
  19. Nandasena, N.A.K.; Scicchitano, G.; Scardino, G.; Milella, M.; Piscitelli, A.; Mastronuzzi, G. Boulder Displacements along Rocky Coasts: A New Deterministic and Theoretical Approach to Improve Incipient Motion Formulas. Geomorphology 2022, 407, 108217. [Google Scholar] [CrossRef]
  20. Medina, F.; Mhammdi, N.; Chiguer, A.; Akil, M.; Jaaidi, E. The Rabat and Larache Boulder Fields; New Examples of High-Energy Deposits Related to Storms and Tsunami Waves in North-Western Morocco. Nat. Hazards 2011, 59, 725–747. [Google Scholar] [CrossRef]
  21. Khalfaoui, O.; Joudar, I.; Chahid, N.E.; Khalidi, K.E.; Minoubi, A.; Bouchkara, M.; Zourarah, B. The Safi Boulders (Morocco): Evidence of Past Extreme Wave Events. Mar. Geol. 2024, 470, 107265. [Google Scholar] [CrossRef]
  22. Cox, R.; Bourke, M.C.; Engel, M.; Kennedy, A.B.; Lau, A.; Suanez, S.; Boulton, S.J.; Oliveira, M.A.; Paris, R.; Salmanidou, D.; et al. Understanding Extreme-Wave Hazards on High-Energy Coasts Requires a Standardised Approach to Field Data Collection: Analysis and Recommendations. EGUsphere 2025, 2025, 1–38. [Google Scholar] [CrossRef]
  23. Nandasena, N.A.K.; Tanaka, N.; Sasaki, Y.; Osada, M. Boulder Transport by the 2011 Great East Japan Tsunami: Comprehensive Field Observations and Whither Model Predictions? Mar. Geol. 2013, 346, 292–309, reprinted in Mar. Geol. Mar. Geol. 2014, 358, 49–66. [Google Scholar] [CrossRef]
  24. Schneider, M.; Bernardino, M.; Gonçalves, M.; Guedes Soares, C. Wave Energy Assessment for the Atlantic Coast of Morocco. J. Mar. Sci. Eng. 2023, 11, 2159. [Google Scholar] [CrossRef]
  25. Mhammdi, N.; Medina, F.; Belkhayat, Z.; Aoula, R.E.; Geawahri, M.-A.; Chiguer, A. Marine Storms along the Moroccan Atlantic Coast: An Underrated Natural Hazard? J. Afr. Earth Sci. 2020, 163, 103730. [Google Scholar] [CrossRef]
  26. Farhaoui, I.; Dakki, M.; Saloui, A. Morphodynamic Classification of Morocco’s Steep Coasts Using Multivariate Methods and Remote Data. J. Coast. Res. 2025, 41, 431–451. [Google Scholar] [CrossRef]
  27. Gharnate, A.; Taouali, O.; Mhammdi, N. Shoreline Change Assessment of the Moroccan Atlantic Coastline Using DSAS Techniques. J. Coast. Res. 2024, 40, 418–435. [Google Scholar] [CrossRef]
  28. Beaudet, G.; Maurer, G.; Ruellan, A. Le Quaternaire Marocain. Observations et Hypothèses Nouvelles. Rev. Géographie Phys. Géologie Dyn. 1967, 9, 269–310. [Google Scholar]
  29. Rouch, J. Le Maroc Maritime Français. In Mémoires de la Société des Sciences Naturelles du Maroc; Larose, C.E., Ed.; Au Siège de L’institut Scientifique Chérifien: Paris, France; Rabat, Morocco, 1931. [Google Scholar]
  30. Engel, M.; May, S.M. Bonaire’s Boulder Fields Revisited: Evidence for Holocene Tsunami Impact on the Leeward Antilles. Quat. Sci. Rev. 2012, 54, 126–141. [Google Scholar] [CrossRef]
  31. Lario, J.; Zazo, C.; Goy, J.L. Tectonic and Morphosedimentary Features of the 2010 Chile Earthquake and Tsunami in the Arauco Gulf and Mataquito River (Central Chile). Geomorphology 2016, 267, 16–24. [Google Scholar] [CrossRef]
  32. Lario, J.; Spencer, C.; Azcárate, T.; Marchante, A.; Garduño Monroy, V.; Macías, J.; Ortega, S. An Extreme Wave Event in Eastern Yucatán, Mexico: Evidence of a Paleotsunami Event during the Mayan Times. Sedimentology 2020, 67, 1481–1504. [Google Scholar] [CrossRef]
  33. Sanad, H.; Moussadek, R.; Mouhir, L.; Lhaj, M.O.; Dakak, H.; Manhou, K.; Zouahri, A. Monte Carlo Simulation for Evaluating Spatial Dynamics of Toxic Metals and Potential Health Hazards in Sebou Basin Surface Water. Sci. Rep. 2025, 15, 29471. [Google Scholar] [CrossRef]
  34. Sanad, H.; Moussadek, R.; Mouhir, L.; Lhaj, M.O.; Dakak, H.; Zouahri, A. Geospatial Analysis of Trace Metal Pollution and Ecological Risks in River Sediments from Agrochemical Sources in Morocco’s Sebou Basin. Sci. Rep. 2025, 15, 16701. [Google Scholar] [CrossRef] [PubMed]
  35. Sanad, H.; Moussadek, R.; Mouhir, L.; Lhaj, M.O.; Zahidi, K.; Dakak, H.; Manhou, K.; Zouahri, A. Ecological and Human Health Hazards Evaluation of Toxic Metal Contamination in Agricultural Lands Using Multi-Index and Geostatistical Techniques across the Mnasra Area of Morocco’s Gharb Plain Region. J. Hazard. Mater. Adv. 2025, 18, 100724. [Google Scholar] [CrossRef]
  36. Manhou, K.; Taghouti, M.; Moussadek, R.; Elyacoubi, H.; Bennani, S.; Zouahri, A.; Ghanimi, A.; Sanad, H.; Oueld Lhaj, M.; Hmouni, D.; et al. Performance, Agro-Morphological, and Quality Traits of Durum Wheat (Triticum Turgidum L. Ssp. Durum Desf.) Germplasm: A Case Study in Jemâa Shaïm, Morocco. Plants 2025, 14, 1508. [Google Scholar] [CrossRef]
  37. Oueld Lhaj, M.; Moussadek, R.; Mouhir, L.; Sanad, H.; Manhou, K.; Iben Halima, O.; Yachou, H.; Zouahri, A.; Mdarhri Alaoui, M. Application of Compost as an Organic Amendment for Enhancing Soil Quality and Sweet Basil (Ocimum Basilicum L.) Growth: Agronomic and Ecotoxicological Evaluation. Agronomy 2025, 15, 1045. [Google Scholar] [CrossRef]
  38. Etienne, S.; Paris, R. Boulder Accumulations Related to Storms on the South Coast of the Reykjanes Peninsula (Iceland). Geomorphology 2010, 114, 55–70. [Google Scholar] [CrossRef]
  39. Barbano, M.; Pirrotta, C.; Gerardi, F. Large Boulders along the South-Eastern Ionian Coast of Sicily: Storm or Tsunami Deposits? Mar. Geol. 2010, 275, 140–154. [Google Scholar] [CrossRef]
  40. Kennedy, A.B.; Mori, N.; Zhang, Y.; Yasuda, T.; Chen, S.-E.; Tajima, Y.; Pecor, W.; Toride, K. Observations and Modeling of Coastal Boulder Transport and Loading During Super Typhoon Haiyan. Coast. Eng. J. 2016, 58, 1640004. [Google Scholar] [CrossRef]
  41. Nandasena, N.A.K. Chapter 29—Perspective of Incipient Motion Formulas: Boulder Transport by High-Energy Waves. In Geological Records of Tsunamis and Other Extreme Waves; Engel, M., Pilarczyk, J., May, S.M., Brill, D., Garrett, E., Eds.; Elsevier: Amsterdam, The Netherlands, 2020; pp. 641–659. ISBN 978-0-12-815686-5. [Google Scholar]
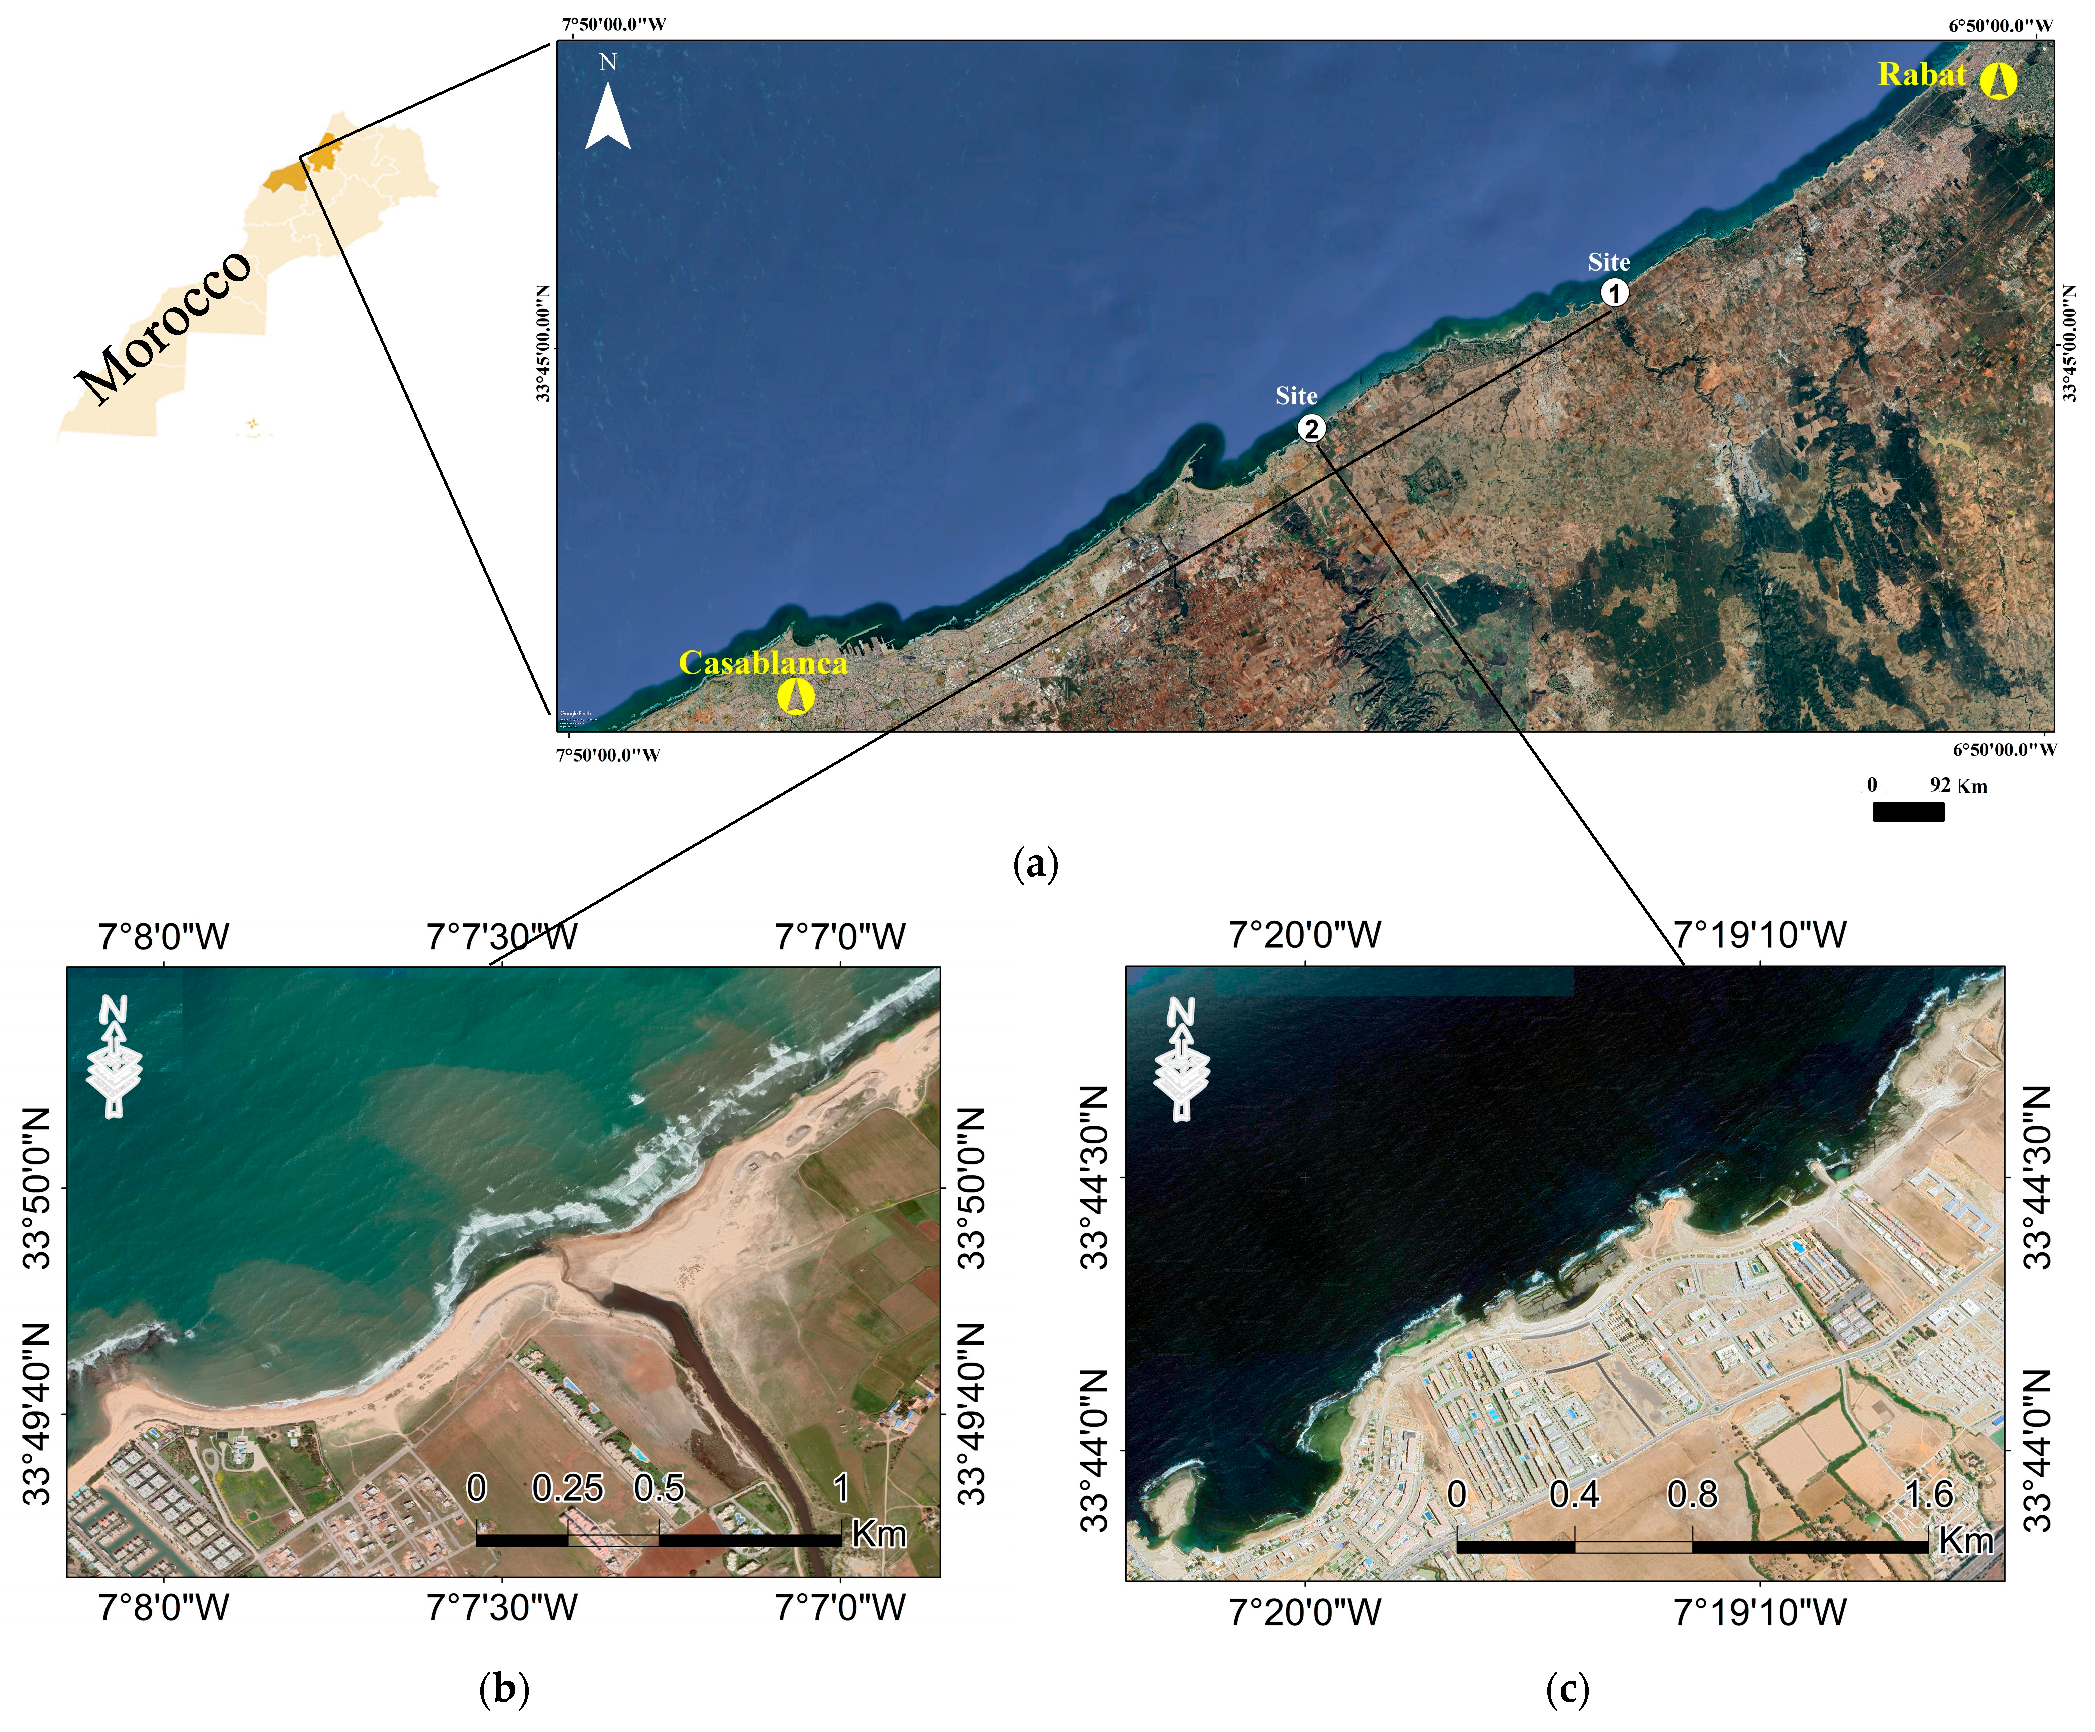
Figure 1. The geographical location of (a) the study area, (b) Site 1 (Oued Cherrat) is 35 km south of Rabat and (c) Site 2 (Mansouria) is 25 km north of Casablanca.
Earth 06 00124 g001
Figure 2. Satellite image of the Oued Cherrat region showing the location of solitary boulders and imbricated boulders.
Earth 06 00124 g002
Figure 3. Correlation between Oued Cherrat boulders (a) weight-distance from the shoreline and (b) weight-elevation.
Earth 06 00124 g003
Figure 4. Spatial distribution of the boulders in Mansouria: (A) satellite image showing the distribution of boulders; (B) view of the rocky cliff directly exposed to wave action; (C) displaced boulders accumulated at the backshore area; (D) boulders showing irregular morphology, (E) with weathering features on the rock surface and (F) marine erosion features with microcavities and evidence of hydrodynamic action.
Earth 06 00124 g004
Figure 5. The boulders at the Mansouria (A) site 1, (B) site 2 and (C) site 3 exhibit variable sizes and shapes.
Earth 06 00124 g005
Figure 6. Graphs illustrating the correlation of the boulders (a) weight-distance and (b) weight-elevation.
Earth 06 00124 g006
Figure 7. Photographic comparisons before and after the 2025 storm events revealed the landward displacement of several large boulders at the Oued Cherrat site.
Earth 06 00124 g007
Figure 8. Photographic comparisons before and after events revealed the landward displacement of several large boulders at the Mansouria site.
Earth 06 00124 g008aEarth 06 00124 g008b
Figure 9. Newly deposited boulders in Mansouria site.
Earth 06 00124 g009
Figure 10. The figure highlights the spatio-temporal dynamics of coastal boulders at the Mansouria (a) site 1, (b) site 2 and (c) site 3 between 2010 and 2024.
Earth 06 00124 g010
Table 1. Morphometric and positional characteristics of imbricated coastal boulders in Oued Cherrat area.
BouldersA-AxisB-AxisC-AxisLongitude (X)Latitude (Y)D
(m)
H
(m)
CV (m3)Density
(t/m3)
Mass (t)Slope Angle (Radians)
Solitary bouldersBLOC010.550.150.4533°49′50.7″ N7°07′22.8″ W63.52.10.022.20.050.03
BLOC020.650.590.1533°49′51.1″ N7°07′23.0″ W65.432.30.032.20.080.04
BLOC031.10.90.3433°49′50.3″ N7°07′22.7″ W60.562.20.202.20.440.04
BLOC040.620.60.1833°49′50.4″ N7°07′22.3″ W51.872.20.042.20.090.04
BLOC050.70.40.4833°49′49.3″ N7°07′20.6″ W48.781.90.082.20.180.04
BLOC060.860.260.433°49′48.2″ N7°07′16.4″ W30.121.20.052.20.120.04
BLOC090.70.640.433°49′48.3″ N7°07′16.5″ W33.891.20.112.20.240.04
BLOC100.70.40.2833°49′48.4″ N7°07′16.3″ W37.561.30.052.20.100.03
BLOC110.630.380.233°49′48.3″ N7°07′16.1″ W66.982.70.032.20.060.04
BLOC120.250.180.1333°49′48.1″ N7°07′15.8″ W62.112.50.012.20.010.04
BLOC130.60.40.233°49′48.6″ N7°07′21.5″ W61.172.60.032.20.060.04
BLOC140.50.50.233°49′48.6″ N7°07′21.5″ W45.231.80.032.20.070.04
BLOC150.70.350.433°49′48.6″ N7°07′21.5″ W84.362.80.062.20.130.03
BLOC160.70.40.433°49′48.6″ N7°07′21.5″ W85.392.90.072.20.150.03
BLOC170.50.50.533°49′48.6″ N7°07′21.5″ W76.382.60.082.20.170.03
BLOC180.50.20.333°49′48.6″ N7°07′21.5″ W87.642.80.022.20.040.03
BLOC190.50.30.233°49′48.6″ N7°07′21.5″ W93.673.10.022.20.040.03
BLOC200.650.250.333°49′48.6″ N7°07′21.5″ W89.082.90.032.20.060.03
BLOC210.660.650.4633°49′48.6″ N7°07′21.5″ W67.322.30.122.20.260.03
BLOC220.850.530.2533°49′48.6″ N7°07′21.5″ W77.182.70.072.20.150.03
Imbricated bouldersBLOC232.251.20.533°49′48.6″ N7°07′21.5″ W101.12.50.812.21.780.02
BLOC241.680.660.4533°49′48.6″ N7°07′22.0″ W101.32.30.302.20.660.02
BLOC2510.530.2333°49′48.7″ N7°07′22.1″ W104.52.40.072.20.160.02
BLOC260.880.540.4733°49′48.8″ N7°07′22.3″ W1062.40.132.20.290.02
BLOC271.40.830.7333°49′48.9″ N7°07′22.6″ W110.42.20.512.21.120.02
BLOC280.550.540.4833°49′49.0″ N7°07′22.8″ W111.52.50.092.20.190.02
BLOC29110.533°49′49.2″ N7°07′22.8″ W1182.50.302.20.660.02
BLOC300.590.440.5133°49′49.5″ N7°07′22.6″ W116.32.50.082.20.170.02
BLOC310.90.80.7133°49′49.5″ N7°07′22.5″ W119.82.40.312.20.670.02
BLOC320.780.440.3633°49′49.4″ N7°07′22.7″ W1242.40.072.20.160.02
BLOC331.2310.933°49′49.4″ N7°07′22.8″ W122.52.50.662.21.460.02
BLOC342.51.50.9833°49′49.6″ N7°07′22.9″ W1252.52.212.24.850.02
BLOC35210.7633°49′49.4″ N7°07′23.0″ W1282.50.912.22.010.02
BLOC362.220.533°49′49.5″ N7°07′23.0″ W1322.51.322.22.900.02
BLOC372.321.233°49′49.5″ N7°07′23.0″ W1372.43.312.27.290.02
BLOC3821.981.533°49′49.6″ N7°07′23.0″ W1162.33.562.27.840.02
BLOC3922133°49′49.5″ N7°07′23.1″ W1262.52.402.25.280.02
BLOC4021.5133°49′49.5″ N7°07′23.2″ W136.22.41.802.23.960.02
BLOC411.51.50.533°49′49.6″ N7°07′23.3″ W1352.50.682.21.490.02
BLOC4221133°49′49.6″ N7°07′23.2″ W1322.51.202.22.640.02
BLOC431.51.2133°49′49.5″ N7°07′23.5″ W1332.41.082.22.380.02
BLOC441.510.633°49′49.6″ N7°07′23.8″ W136.52.50.542.21.190.02
BLOC4521.50.533°49′49.6″ N7°07′23.6″ W1382.40.902.21.980.02
BLOC46221.233°49′49.6″ N7°07′23.6″ W139.42.52.882.26.340.02
BLOC4721.5133°49′49.5″ N7°07′24.1″ W1442.41.802.23.960.02
BLOC4822133°49′49.5″ N7°07′24.4″ W1482.52.402.25.280.02
BLOC491.51.3133°49′49.5″ N7°07′24.5″ W1462.41.172.22.570.02
BLOC501.51.1133°49′49.5″ N7°07′24.7″ W148.32.20.992.22.180.01
BLOC511.610.733°49′49.6″ N7°07′24.0″ W1442.20.672.21.480,02
BLOC5222.21.133°49′49.6″ N7°07′24.1″ W1472.32.902.26.390.02
BLOC531.761.530.833°49′49.7″ N7°07′24.2″ W1452.11.292.22.840.01
BLOC540.980.670.733°49′49.7″ N7°07′24.3″ W1472.50.282.20.610.02
BLOC551.210.933°49′49.7″ N7°07′24.5″ W147.92.250.652.21.430.02
BLOC56210.533°49′49.7″ N7°07′24.6″ W1492.30.602.21.320.02
BLOC571.91.3133°49′49.7″ N7°07′24.7″ W150.52.11.482.23.260.01
Note: “D” the distance, “H” the elevation and “CV” the corrected volume.
Table 2. Morphometric and positional characteristics of coastal boulders in Mansouria area.
Boulders IDA-AxisB-AxisC-AxisLongitude (X)Latitude (Y)D
(m)
H
(m)
CV
(m3)
Density
(t/m3)
Mass
(t)
Slope Angle (Radians)
BLMA 0122.0020.003.5033°44′20.9″ N7°19′25.6″ W67.631.5924.002.22032.800.02
BLMA 0220163.533°44′20.3″ N7°19′26.6″ W68.121.6672.002.21478.400.02
BLMA 0364.21.533°44′18.3″ N7°19′27.5″ W133.231.522.682.249.900.02
BLMA 0410.78.9233°44′19.0″ N7°19′26.9″ W136.371.2114.282.2251.410.02
BLMA 0521.7133°44′18.3″ N7°19′27.0″ W127.0912.042.24.490.02
BLMA 061.3810.533°44′18.4″ N7°19′26.8″ W112.1110.412.20.910.02
BLMA 072.723.361.333°44′18.9″ N7°19′26.6″ W114.2217.132.215.680.02
BLMA 084.654.31233°44′19.3″ N7°19′26.1″ W116.14124.052.252.910.02
BLMA 096.765.232.333°44′19.8″ N7°19′25.7″ W118.67148.792.2107.340.02
BLMA 103.932.951.433°44′20.1″ N7°19′25.5″ W86.8919.742.221.420.02
BLMA 113.632.121.1233°44′20.2″ N7°19′25.1″ W92.4615.172.211.380.02
BLMA 123.421.13133°44′20.2″ N7°19′24.8″ W93.3532.322.25.100.02
BLMA 132.6521.1433°44′20.4″ N7°19′24.7″ W91.633.632.27.980.03
BLMA 142.862.31.1533°44′20.4″ N7°19′24.6″ W9034.542.29.990.03
BLMA 152.62133°44′20.5″ N7°19′24.5″ W93.7633.122.26.860.03
BLMA 163.52.3233°44′20.8″ N7°19′24.6″ W99.4739.662.221.250.03
BLMA 173.22.42.133°44′20.9″ N7°19′24.4″ W98.3939.682.221.290.03
BLMA 184.22.11233°44′21.5″ N7°19′24.3″ W93.48210.632.223.400.02
BLMA 195.282.32.1433°44′22.3″ N7°19′25.1″ W77.81.115.592.234.300.01
BLMA 206.634.732.333°44′22.7″ N7°19′25.7″ W81.761.243.282.295.210.01
BLMA 218.318.033.533°44′22.7″ N7°19′25.9″ W71.81140.132.2308.290.01
BLMA 225.545.142.633°44′23.1″ N7°19′25.9″ W70.5144.422.297.730.01
BLMA 236.425.622.533°44′23.3″ N7°19′25.9″ W70.21.554.122.2119.070.02
BLMA 247.24.5233°44′23.4″ N7°19′24.6″ W68138.882.285.540.01
BLMA 258.33.61.233°44′23.1″ N7°19′24.3″ W69121.512.247.330.01
BLMA 264.64.91.933°44′23.1″ N7°19′24.4″ W67.5125.702.256.530.01
BLMA 275.43133°44′23.2″ N7°19′23.9″ W661.39.722.221.380.02
BLMA 28742.333°44′23.2″ N7°19′23.6″ W651.238.642.285.010.02
BLMA 296.2532.533°44′23.6″ N7°19′23.6″ W64.6128.132.261.880.02
BLMA 302.131.5133°44′23.6″ N7°19′23.1″ W632.21.922.24.220.03
BLMA 3163.5233°44′23.8″ N7°19′22.7″ W552.125.202.255.440.04
BLMA 3253.4133°44′23.9″ N7°19′22.3″ W45210.202.222.440.04
BLMA 335.54.32.633°44′24.1″ N7°19′22.1″ W35.68236.892.281.170.06
BLMA 346.46333°44′24.5″ N7°19′22.0″ W25269.122.2152.060.08
BLMA 358.97.81.8733°44′24.7″ N7°19′21.9″ W14277.892.2171.360.14
BLMA 369.78.92.433°44′24.7″ N7°19′22.3″ W102.3124.322.2273.490.23
BLMA 377.46.261.2333°44′24.9″ N7°19′22.3″ W4.252.534.192.275.210.53
BLMA 386.35.81.933°44′25.6″ N7°19′22.9″ W22241.662.291.640.09
BLMA 395.344.91.2533°44′25.9″ N7°19′22.6″ W301.819.622.243.170.06
BLMA 405.6741.2533°44′26.5″ N7°19′22.3″ W251.817.012.237.420.07
BLMA 415.873.5133°44′26.4″ N7°19′22.1″ W181.912.332.227.120.11
BLMA 427.96.5233°44′26.4″ N7°19′21.8″ W17.191.561.622.2135.560.09
BLMA 433.42.5133°44′27.6″ N7°19′19.2″ W201.35.102.211.220.06
BLMA 44431.533°44′27.6″ N7°19′19.4″ W14.151.410.802.223.760.10
BLMA 4532.91.933°44′27.7″ N7°19′19.7″ W121.59.922.221.820.12
BLMA 4653233°44′27.6″ N7°19′20.0″ W10.39218.002.239.600.19
BLMA 4754.81.533°44′27.3″ N7°19′17.8″ W9.5221.602.247.520.21
BLMA 4854.5333°44′27.6″ N7°19′20.2″ W8.8240.502.289.100.22
BLMA 4943.4333°44′27.4″ N7°19′20.4″ W5.46224.482.253.860.35
BLMA 507.156.65233°44′28.6″ N7°19′18.5″ W4.5257.062.2125.530.42
Note: “D” the distance, “H” the elevation and “CV” the corrected volume.
Table 3. Calculated flow velocities necessary to initiate transport of boulders in the Oued Cherrat.
Oued Cherrat Boulders Nandasena Bore Velocity (Sliding) (m/s)Nandasena Bore Velocity (Rolling) (m/s)
Solitary boulders BLOC011.110.79
BLOC022.003.34
BLOC032.564.12
BLOC042.063.40
BLOC051.801.94
BLOC061.461.41
BLOC092.223.13
BLOC101.762.38
BLOC111.702.53
BLOC121.191.59
BLOC131.742.63
BLOC141.923.05
BLOC151.671.85
BLOC161.782.09
BLOC171.992.34
BLOC181.271.24
BLOC191.522.10
BLOC201.421.53
BLOC212.253.03
BLOC221.993.06
Imbricated bouldersBLOC232.954.69
BLOC242.243.07
BLOC251.963.10
BLOC262.052.55
BLOC272.533.15
BLOC282.052.53
BLOC292.724.13
BLOC301.862.05
BLOC312.493.08
BLOC321.842.35
BLOC332.793.42
BLOC343.374.70
BLOC352.773.65
BLOC363.636.14
BLOC373.875.57
BLOC383.895.14
BLOC393.845.84
BLOC403.374.67
BLOC413.235.35
BLOC422.793.28
BLOC433.043.86
BLOC442.743.94
BLOC453.235.35
BLOC463.875.57
BLOC473.364.67
BLOC483.835.84
BLOC493.154.14
BLOC502.913.57
BLOC512.753.75
BLOC524.016.12
BLOC533.355.05
BLOC542.282.64
BLOC552.783.42
BLOC562.704.13
BLOC573.144.13
Table 4. Calculated flow velocities necessary to initiate transport of boulders in the Mansouria site.
Mansouria Boulders Nandasena Bore Velocity (Sliding) (m/s)Nandasena Bore Velocity (Rolling) (m/s)
BLMA111.0518.23
BLMA210.1217.06
BLMA35.438.92
BLMA47.5712.78
BLMA53.565.16
BLMA62.714.13
BLMA74.887.91
BLMA85.428.71
BLMA95.969.69
BLMA104.497.17
BLMA113.965.93
BLMA122.953.66
BLMA133.905.67
BLMA144.156.28
BLMA153.875.86
BLMA164.255.28
BLMA174.345.39
BLMA184.064.88
BLMA194.215.11
BLMA205.879.03
BLMA217.5912.02
BLMA226.139.33
BLMA236.3910.03
BLMA245.698.97
BLMA254.998.29
BLMA265.899.55
BLMA274.577.57
BLMA285.467.97
BLMA294.796.10
BLMA303.414.69
BLMA315.187.51
BLMA324.898.10
BLMA335.828.23
BLMA346.9110.25
BLMA357.7012.18
BLMA368.6713.22
BLMA377.7810.25
BLMA386.6410.64
BLMA395.869.67
BLMA405.438.82
BLMA415.148.27
BLMA426.9811.26
BLMA434.366.86
BLMA444.947.28
BLMA454.996.72
BLMA465.266.91
BLMA476.409.77
BLMA486.548.52
BLMA496.057.03
BLMA508.1311.47
Disclaimer/Publisher’s Note: The statements, opinions and data contained in all publications are solely those of the individual author(s) and contributor(s) and not of MDPI and/or the editor(s). MDPI and/or the editor(s) disclaim responsibility for any injury to people or property resulting from any ideas, methods, instructions or products referred to in the content.