Article

Impact of Climate Change on the Spatio-Temporal Groundwater Recharge Using WetSpass-M Model in the Weyib Watershed, Ethiopia

by
Mesfin Reta Aredo
1,2,* and
Megersa Olumana Dinka
1
1
Department of Civil Engineering Sciences, Faculty of Engineering and the Built Environment, University of Johannesburg, Auckland Park 2006, Johannesburg P.O. Box 524, South Africa
2
Department of Water Resources and Irrigation Engineering, College of Engineering, Institute of Technology, Madda Walabu University, Bale Robe P.O. Box 247, Ethiopia
*
Author to whom correspondence should be addressed.
Earth 2025, 6(4), 118; https://doi.org/10.3390/earth6040118
Submission received: 21 July 2025 / Revised: 26 August 2025 / Accepted: 8 September 2025 / Published: 28 September 2025

Abstract

Comprehension of spatio-temporal groundwater recharge (GWR) under climate change is imperative to enhance water resources availability and management. The main aim of this study is to examine climate change’s effects on spatio-temporal GWR. This study was done by ensembling five climate models and the physically-based WetSpass-M model to estimate GWR during baseline (1986 to 2015), mid-term (2031 to 2060), and long-term (2071 to 2100) periods for the Representative Concentration Pathways (RCP) 4.5 and 8.5 scenarios. In comparison to the Identification of unit Hydrographs and Component flows from Rainfall, Evaporation, and Streamflow (IHACRES)’s baseflow and direct runoff with corresponding WetSpass-M model outputs, the statistical indices showed good performance in simulating water balance components. Projected future temperature and rainfall will likely increase dramatically compared to the baseline period for RCP4.5 and RCP8.5. In comparison to the baseline period, the annual GWR had been projected to increase by 4.28 mm for RCP4.5 for the mid-term (MidT4.5), 15.27 mm for the long-term (LongT4.5), 2.38 mm for the mid-term (MidT8.5), and 13.11 mm for the long-term for RCP8.5 (LongT8.5), respectively. The seasonal GWR findings showed an increasing pattern during winter and spring, whereas it declined in autumn and summer. The mean monthly GWR for MidT4.5, LongT4.5, MidT8.5, and LongT8.5 will increase by 0.34, 1.26, 0.18, and 1.07 mm, respectively. The watershed’s downstream areas were receiving the lowest amount of GWR, and prone to drought. Therefore, this study advocates and recommends that stakeholders participate intensively in developing and implementing climate change resilience initiatives and water resources management strategies to offset the detrimental effects in the downstream areas.

1. Introduction

One of the most fundamental human needs is access to adequate and quality water to meet the daily rising residential, irrigation, and industrial demands [1,2]. Fresh water sources are extremely scarce in quantity and spatial availability on this planet [3,4]. The total amount of fresh water is limited to 2.5% in the planet, with the other 97.5% being oceans [5]. The most considerable portion of the 2.5% of freshwater available can be located in glaciers (68.7%), whereas groundwater, surface water, and other sources contribute 30.1%, 0.9%, and 0.3%, respectively [5,6]. Furthermore, nearly half the world population relies on groundwater supplies for residential demand and food production, which is becoming increasingly challenging due to rapid climate change [2]. Groundwater recharge (GWR) is the amount of water contributed to the aquifer from the surface water sources [7]. Quantifying accurately a spatio-temporally varied GWR will rely on climate change, elevation differences, land-cover change, soil texture, and hydrogeology dynamics [8,9]. Groundwater availability is diminishing worldwide due to intensive water abstraction, inefficient usage, regional groundwater flows, and projected future climate change [2,5]. Scientific studies aiming to quantify climate change effects, track changes, tackle, and managing it will be critical for protecting this valuable and scarce groundwater resource [10].
Recently, numerous studies have been pointing out the effect of climate change on the GWR [1,11,12]. Climate change is one of the foremost pressing problems confronting the planet. This climate change is due to anthropogenic and natural activities, leading to global warming and shifting climate variables [13]. The specific factors contributing to climate change include land-cover change, coal and petroleum, the release of greenhouse gases, earthquakes, and tectonic activities [14]. Furthermore, the effects of global greenhouse warming were primarily responsible for the significant temperature rise, precipitation unpredictability, evaporation, and sea level change [15,16]. Globally, climate change can raise the global temperature by 0.4 °C to 5.8 °C from 1990 to 2100 [17,18]. Climate change devastates developing continents like Africa, as economic growth heavily relies on rainfed agriculture [1,2,18,19]. Additionally, Africa has witnessed a notable rise in temperatures and rainfall variability [20,21]. Ethiopia is also confronting the effects of climate change, like various African countries [1,2,21].
Despite Ethiopia being referred to as “East Africa’s Water Tower”, it faces drastically rising water demands, water stress, and limited spatio-temporal water availability, while the economy relies on rainfed agriculture [22,23,24]. Even Ethiopia’s agricultural economy depends heavily on rainfall, while the rainfall pattern varies considerably, leading to low production due to a lack of rainfall during crop growth [8]. In Ethiopia, water resource availability varied considerably on a spatiotemporal scale [2,5,6]. For instance, the impact of climate change has been causing water resources availability rising, while declining in some areas in Ethiopia [2,11,12,15,16]. One of prmary sources of fresh water is groundwater, owing to seasonal variability and its lower vulnerability to contamination [6]. Furthermore, Ethiopia’s domestic water demand highly depends majorly on the groundwater resources [7]. These resources were challenged due to an erratic pattern of projected rainfall and temperature recorded throughout Ethiopia based on RCP4.5 and RCP8.5 scenario analysis [25,26,27,28,29]. For instance, the temperature is projected to increase considerably in numerous study areas in Ethiopia under climate change scenarios [19,30]. Furthermore, temperature and rainfall are increasing in many study areas [1,2,31]. Future rainfall and temperature variability will pose a detrimental impact on water resources development and management.
Compared to numerous study areas in Ethiopia, the Weyib watershed has been experiencing unpredictable rainfall, water shortages, rapid population increase, and rising water demand [30,32,33,34]. Furthermore, the study area’s highland and central parts have been frequently affected due to high surface runoff and floods, whereas the downstream areas face drought [30,32,33,34,35,36,37]. Additionally, the study area faces water table fluctuations and flood inundations [30,32,33,34,35,36,37]. These areas’ temperature and rainfall will likely increase due to land-cover change, rising agricultural expansion, and moisture transport. [38,39]. Climate change may change water resource availability while posing a challenge to safeguard demands and sustainable management [31,40,41,42]. Although few studies are available in the Weyib watershed that considered a climate change by ensembling three climate models, this will lead to uncertainties due to limited number of climate model was used to estimate its effects [31,38].
Furthermore, the Weyib watershed was chosen as the research site because of its unique characteristics, including problem-driven and representativeness in agro-ecological zones and hydrologic services [3,30,31,32,33,34,35,36,37,38,39,40,41]. The Weyib watershed’s groundwater levels fluctuated considerably, and a more detailed recharge study was proposed [43]. Although these obstacles exist, little research has been done to predict water balance components due to a lack of data availability. Unlikely, the recharge amount varies globally, the availability of numerous approaches to estimate makes it challenging to select a suitable one [44]. One of the most effective top-performing physically-based distributed hydrological models was the WetSpass-M model, which was selected to estimate GWR at spatiotemporal scales [45,46,47]. These findings highlight the requirement for a more thorough study by addressing data constraints like groundwater levels and suggesting recharge estimation [43]. Predicting water budgets and comprehending hydrological processes are critical for sustainable water resource development. This study uniquely collects primary data, ensembles numerous climate data, and employs a physically-based distributed hydrological model. The objective of this study is to assess the impact of climate change on GWR on the spatiotemporal scale for the Weyib watershed, Ethiopia, using a verified WetSpass-M model and ensembling five climate models (CNRM-CM5, GFDL-ESM2M, IPSL-CM5A-MR, MPI-ESM-LR, and NorESM1-M). The materials and methods will cover climate model selection and analysis in more detail.

2. Materials and Methods

2.1. Study Area

The Weyib watershed covers a diverse agro-ecological area of 3611 km2 and is located between 6.83 and 7.46° N latitude and 39.53 and 40.50° E longitude (Figure 1). The highest elevation in the vicinity of Bale Mountains National Park (4346 m) and then declines as goes to the outlet, with a lowest point of 1739 m above mean sea level. During the baseline period, the mean annual maximum and minimum temperatures are 22.23 °C and 7.28 °C, respectively. The study area has an average annual rainfall range from 851 to 1341.23 mm with a bimodal rainfall pattern. The main tributaries of the Weyib River cover Shaya, Tegona, and Tebel Rivers [3,23,24]. The study area’s hydrogeological formations is dominated by volcanic rocks and extensive aquifers with fracture permeability, which ranges from low to high aquifer productivity [43]. The Weyib watershed’s geological formations are broadly classified as Quaternary volcanic, sedimentary, and Tertiary volcanic successions [3]. The Quaternary volcanic and sedimentary consist of scoriaceous vesicular olivine phyric basalt formations, with estimated aquifer productivity ranging from high to moderate in the central and downstream areas, covering 64.43% of the Weyib watershed [3]. Tertiary volcanic successions are categorized into five groups: alkali trachyte and basalt flows with a moderately productive aquifer (16.61%); alkali trachyte flows have low aquifer productivity (14.52% coverage); Teltele basalt flows (0.01%) and lower flood basalts (4.03%) ranges from high to moderate productive aquifer; and the Nazeret Group (Stratoid silica-ignimbrites, tuffs, ash, rhyolites, trachyte, and minor basalt) ranging from moderate to low productive aquifer, covering 0.41% of the watershed [3,43]. The aquifer types in the Weyib watershed are substantially productive and receive a moderate amount of recharge compared to other areas in Ethiopia [43].

2.2. Model Description

Recently, one of the freely available and physically-based distributed hydrological models was WetSpass-M, with strong model capability in estimating spatio-temporal water balance in the basin or watershed scales [45,46,48]. The model estimates water balance based on each raster cell scale, including impermeable, vegetated, bare, and open water fractions (Equations (1)–(3)). The model encompasses thirty-four land-use types in its lookup table in terms of the standard weightage allocated to the corresponding vegetated, bare, open water, and impermeable areas [5,49].
E T r a s t e r = a v E T v + a s E s + a i E i + a o E o
S r a s t e r = a v S v + a s S s + a i S i + a o S o
R r a s t e r = a v R v + a s R s + a i R i + a o R o
where ETraster is evapotranspiration, Sraster is runoff, Rraster is GWR, and E is evaporation, for each having (v) vegetated, (s) bare, (o) open water, and (i) impervious area. av, as, ao, and ai were fractions of vegetated, bare, open water, and impervious area, respectively.

2.3. Data Used and Analysis

The study collected primary data from field measurement of groundwater level data and secondary data such as climate, streamflow, groundwater levels, soil texture, digital elevation model (DEM), and land use/land cover (LULC) from various sources (Table 1). Inverse distance weight (IDW) was used to fill missing data for the climate datasets using nearby surrounding stations [50,51]. Furthermore, spatially distributed climate and groundwater level data were prepared using the IDW technique for each time step. Numerous studies have highlighted good interpolation performances in relation to considering distances between two points and spatiotemporal data [46,52]. Using upstream streamflow gauging station data, a linear regression equation was developed to fill the missing streamflow data at the Alemkerem gauging stations.

2.4. Climate Model Selection and Analysis

Future climate change data (precipitation and temperature) were downloaded in NetCDF format from the Coordinated Regional Climate Downscaling Experiment (CORDEX) from the WCRP official platform for the baseline period from 1986 to 2015, 2031 to 2060 for the mid-term, and 2071 to 2100 for the long-term periods using RCP4.5 and RCP8.5 scenarios. This study picked five GCMs, such as CNRM-CM5 (Centre National de Recherches Meteorolo-Giques/Centre Europeen de Recherche et Formation Avanceesencalcul scientifique, Toulouse, France), GFDL-ESM2M (NOAA Geophysical Fluid Dynamic Laboratory, Princeton, NJ, USA), IPSL-CM5A-MR (Institut Pierre-Simon Laplace, Guyancourt, France), MPI-ESM-LR (Max Planck Institute for Meteorology, Hamburg, Germany), and NorESM1-M (Norwegian Climate Centre, Bergen, Norway), based on the data quality and performance to examine the climate change effects relative to the study area [2,18,53,54,55]. Climate change scenarios were defined based on earlier studies in the research area and broader Ethiopia [2,29,30,31,32,33,34,35,36,37,38]. The climate models’ data were downloaded from the WCRP official website of CORDEX-AFRICA regional climate models (https://esgf-node.ipsl.upmc.fr/search/cordex-ipsl/ (accessed on 20 August 2020)). Furthermore, the dynamical downscaling technique was used to downscale, whereas the climate bias was corrected using linear scaling (multiplicative) for precipitation and linear scaling (additive) for temperature using Climate Model data for hydrologic modeling (CMhyd) [1]. Numerous studies recommended that ensemble multi-climate models using the simple arithmetic mean method for the rainfall and temperature were imperative to mitigate over- or under-estimation uncertainties by using a single climate model and boosting accuracy [1,2,25,26,27,28,29,30,38,39,40,41,53,54,55].

2.5. WetSpass-M Model Input Data

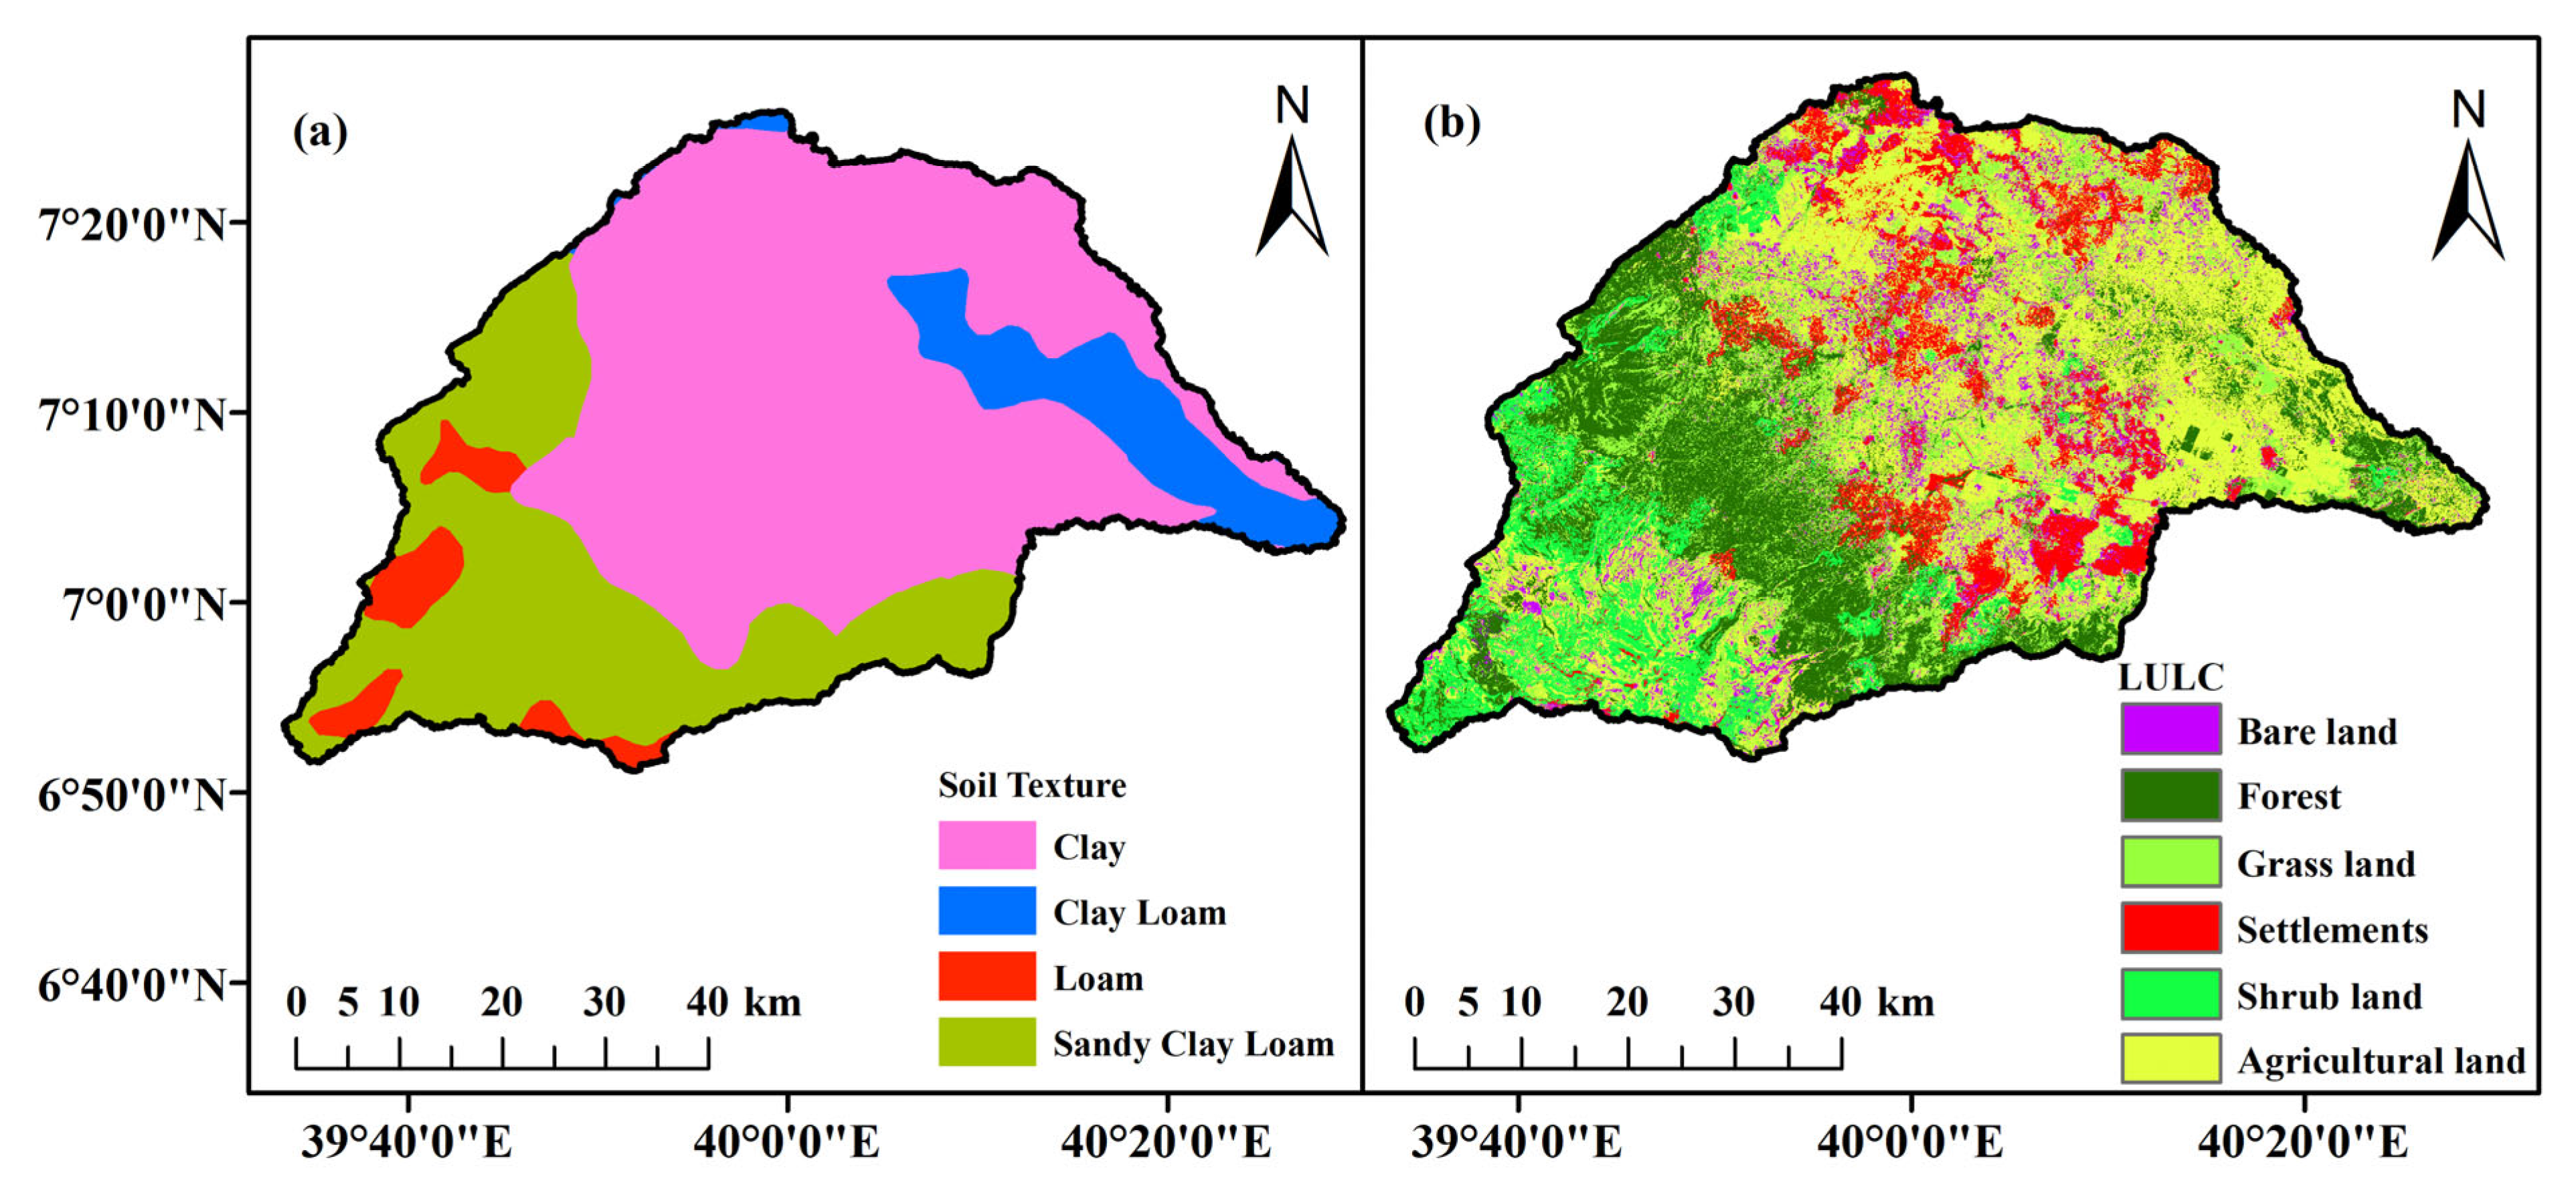
This model inputs two primary classes: spatio-temporal and lookup tables for soil texture and land-use lookup tables. This hydro-climate data includes base flow, direct runoff, groundwater level, potential evapotranspiration (PET), rainfall, wind speed, and temperature. The spatio-temporal input data was prepared in equal cell size with an ASCII-file format. The model performance was verified using streamflow separated into baseflow and direct runoff. The model needs spatial and biophysical basin characteristics such as DEM, LULC, soil texture, and slope maps (Figure 2a and Figure 3b). To address data limitations, the depth of the static groundwater level was measured at fifty-three boreholes using a deep-water level meter during the primary wet season (starting late July to August) and the dry season (late November to December) in 2022. It was measured after wells recovered from pumping to mitigate uncertainty regarding the existing domestic water demand for the study area. The LULC map was classified into six main categories, such as settlements 10.34%, bare land 8.04%, agriculture 35.08%, grassland 15.45%, forest 21.53%, and 9.57% for shrub land (Figure 3b). Additionally, the soil texture covers such as clay (58.86%), sandy clay loam (28.14%), loam (4.13%), and clay loam (8.86%) (Figure 3a).

2.6. Model Performance Evaluation

Statistical indices such as Nash-Sutcliffe Efficiency (NSE), Coefficient of determination (R2), and Kling-Gupta Efficiency (KGE) were used to examine WetSpass-M model performance, while comparing the IHACRES filtered baseflow and direct runoff with corresponding WetSpass-M model-simulated baseflow and direct runoff, as shown in Equations (4)–(6) [1,2,3,56].
R 2 = i = 1 n O i O ¯ ( P i P ¯ ) i = 1 n ( O i O ¯ ) 2 i = 1 n ( P i P ¯ ) 2 2
N S E = 1 i = 1 n ( O i P i ) 2 i = 1 n ( O i O ¯ ) 2
K G E = 1 r 1 2 + σ s i m σ o b s 1 2 + μ s i m μ o b s 1 2
where Oi is observed data at ith, Pi is model-simulated at ith, O   ¯ is the observed mean, P   ¯ is the simulated mean, n is the number of datasets used, r is the linear correlation, σ s i m and σ o b s is the standard deviation for simulations and observed, respectively; μ s i m and μ o b s is the mean of the simulated and observed values, respectively.

2.7. Baseflow Separation

This study used IHACRES, a recursive digital filter (RDF), to separate streamflow into baseflow and direct runoff, based on its performance in the study area [3]. Equation (7) was used to separate streamflow by the IHACRES filter [3]. Optimized IHACRES parameters values were identified, resulting in αq = 0.927, k = 0.96, and C = 0.013 [3]. The mean annual separated baseflow is compared with previous studies in the watershed [43]. As many studies applied, WetSpass-M model performances were evaluated by comparing the IHACRES separated baseflow and direct runoff with the corresponding WetSpass-M model direct runoff and Baseflow [1,2,3,5,26,46]. A similar methodological approach was followed to verify WetSpass-M model performances.
    B F t = k 1 + C B F t 1 + C 1 + C ( Q t + α q Q t 1 )
where Qt−1 is initial streamflow for the preceding sampling to t; Qt is initial streamflow for tth sampling; BFt is filtered baseflow response for tth sampling; C is a shape parameter for separation and altered; k is a filter parameter given by recession constant; BF(t−1) is filtered baseflow response for preceding sampling to t; and αq are filter parameters.

2.8. Methodological Flowchart

The general methodological approach used to examine the impacts of climate change on the groundwater recharge using the WetSpass-M model and ensembling multi-climate models. This study uses the WetSpass-M hydrological model with modeling preparation, performance evaluation, and verification by historical climate data; then it uses ensemble climate models to project future groundwater recharge for the study area. Figure 4 depicts a methodological flowchart for this study.

3. Results

3.1. Analysis of Projected Climate

The future climate change is expected to increase the ensemble average monthly temperature from 2031 to 2060, and from 2071 to 2100 for RCP4.5 and RCP8.5, compared to the baseline period (1986 to 2015) (Figure 5). A minimal increase in average monthly temperature will be 0.60 °C for MidT4.5, 1.10 °C for LongT4.5, 1.08 °C for MidT8.5, and 3.0 °C for LongT8.5 in September. Furthermore, the average monthly temperature is anticipated to climb by 1.47 °C for MidT8.5 and 3.58 °C for LongT8.5 scenarios, respectively. Likewise, the average monthly temperature will rise tremendously in February, by 1.62 °C for MidT4.5 and 2.40 °C for LongT4.5 in RCP4.5. Unlike RCP4.5, it’s predicted that the most significant spike will be seen in January by 4.43 °C for MidT8.5 and in April by 2.12 °C for LongT8.5. The mean monthly temperature’s standard deviations were 0.74 for the baseline period, 0.84 for MidT4.5, 0.78 for LongT4.5, 0.86 for MidT8.5, and 0.82 for LongT8.5 scenarios.
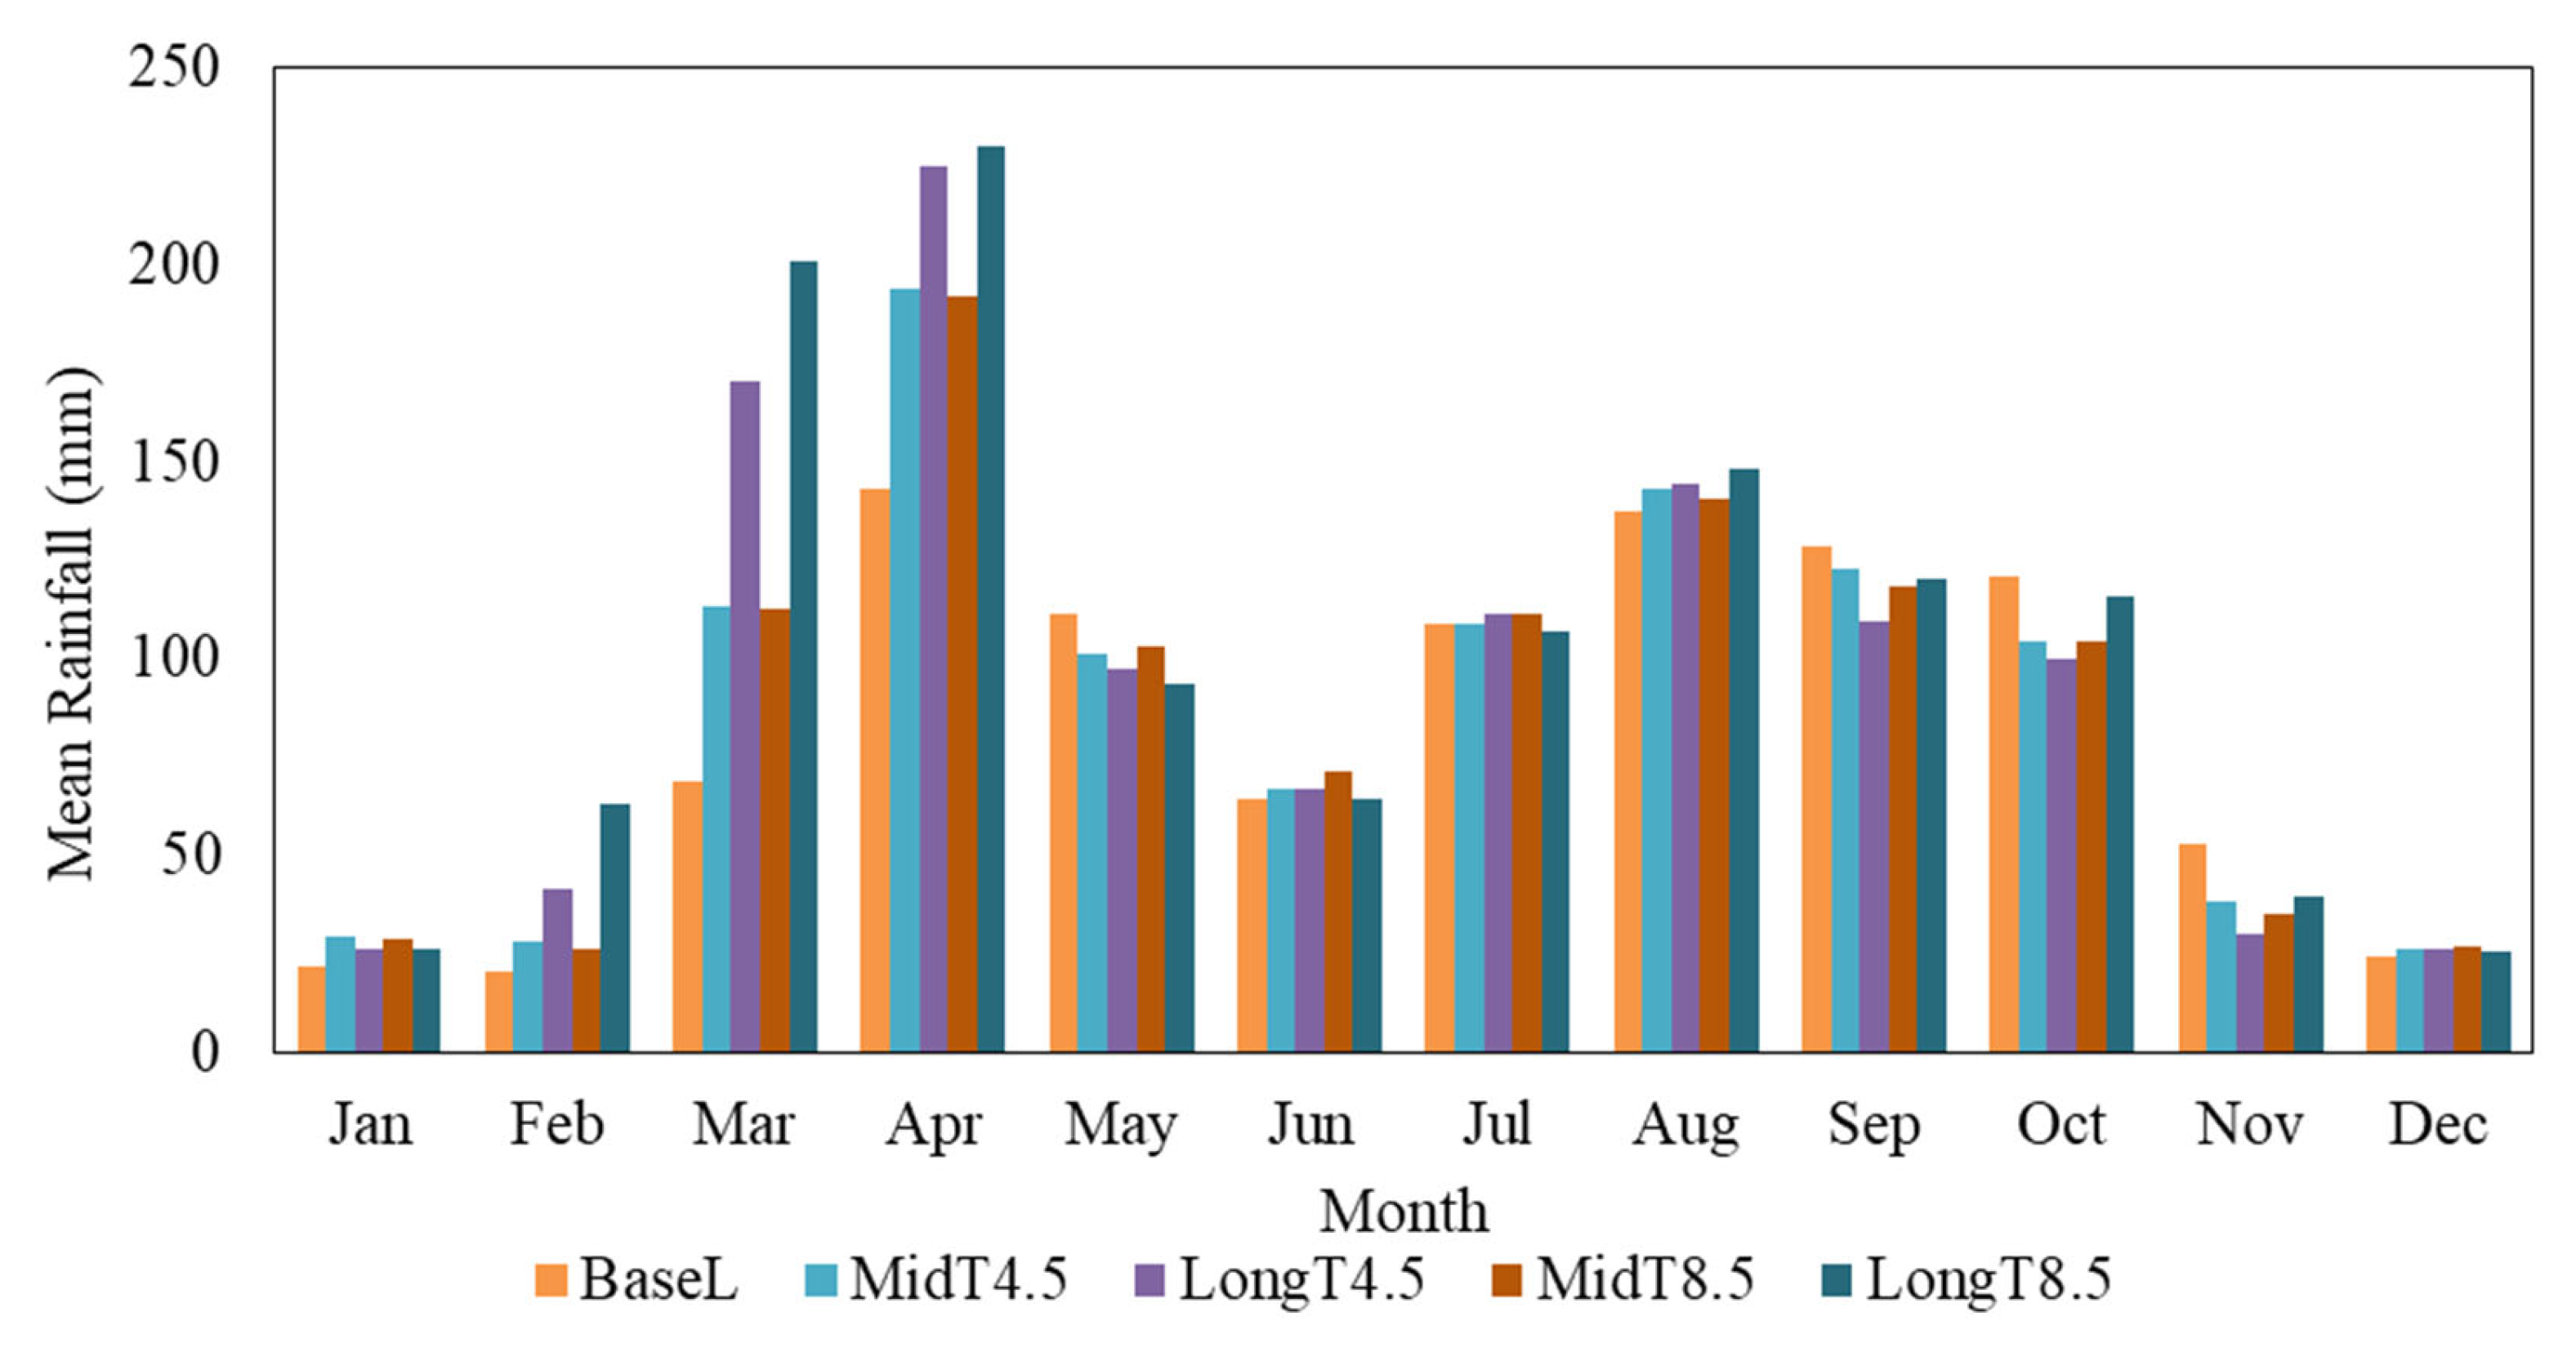
Compared to the baseline period, the annual rainfall is projected to rise dramatically for both RCP4.5 and RCP8.5 scenarios. As illustration, compared to the baseline period (1002.84 mm/year), the average precipitation is predicted to go up with 74.37 mm/year for MidT4.5, 144.87 mm/year for LongT4.5, 67.32 mm/year for MidT8.5, and 231.49 mm/year for LongT8.5, respectively (Figure 6). A monthly peak percentage increase will be in March by 65.14%, 148.11%, and 63.66% for MidT4.5, LongT4.5, and MidT8.5, respectively, while LongT8.5 (203.67%) will be recorded in February. On the other hand, the average monthly precipitation will decrease by a tremendous amount in November by 27.52%, 43.65%, 33.70%, and 25.23% for MidT4.5, LongT4.5, MidT8.5, and LongT8.5, respectively. Moreover, the highest monthly mean precipitation of 11.06 mm, 21.15 mm, 9.85 mm, and 36.35 mm for MidT4.5, LongT4.5, MidT8.5, and LongT8.5, respectively. The mean monthly rainfall’s standard deviations were 46.75, 52.78, 62.52, 52.46, and 65.54 for baseline period, MidT4.5, LongT4.5, MidT8.5, and LongT8.5 scenarios, respectively. Table 2 shows uncertainty analysis by comparing the standard deviations (plus or minus) from the mean monthly temperature and rainfall. Temperature has been deviating by less than one degree from the mean monthly value, while the mean monthly rainfall has been deviating considerably, ranging from 46.74 to 65.54 (Table 2).

3.2. WetSpass-M Model Evaluation

Statistical indicators verified the WetSpass-M model performance, which yielded R2 values of 0.90 and 0.85, NSE values of 0.95 and 0.89, and 0.82 and 0.84 for KGE, respectively. As depicted in Figure 7, the model is effective enough to estimate spatio-temporal water balance when the model performance is evaluated by comparing the IHACRES filtered baseflow and direct runoff with the equivalent WetSpass-M model-simulated baseflow and direct runoff, respectively. The WetSpass-M model, which considers a wide range of affecting variables and inputs, was used to predict spatio-temporal GWR at monthly, seasonal, and yearly scales with outstanding predictive ability [2,3]. Furthermore, the WetSpass-M model worked well across various periods while tested in diverse agro-ecological settings by considering climate change effects [2,3,4,5,26,57].

3.3. Mean Monthly Recharge Variability

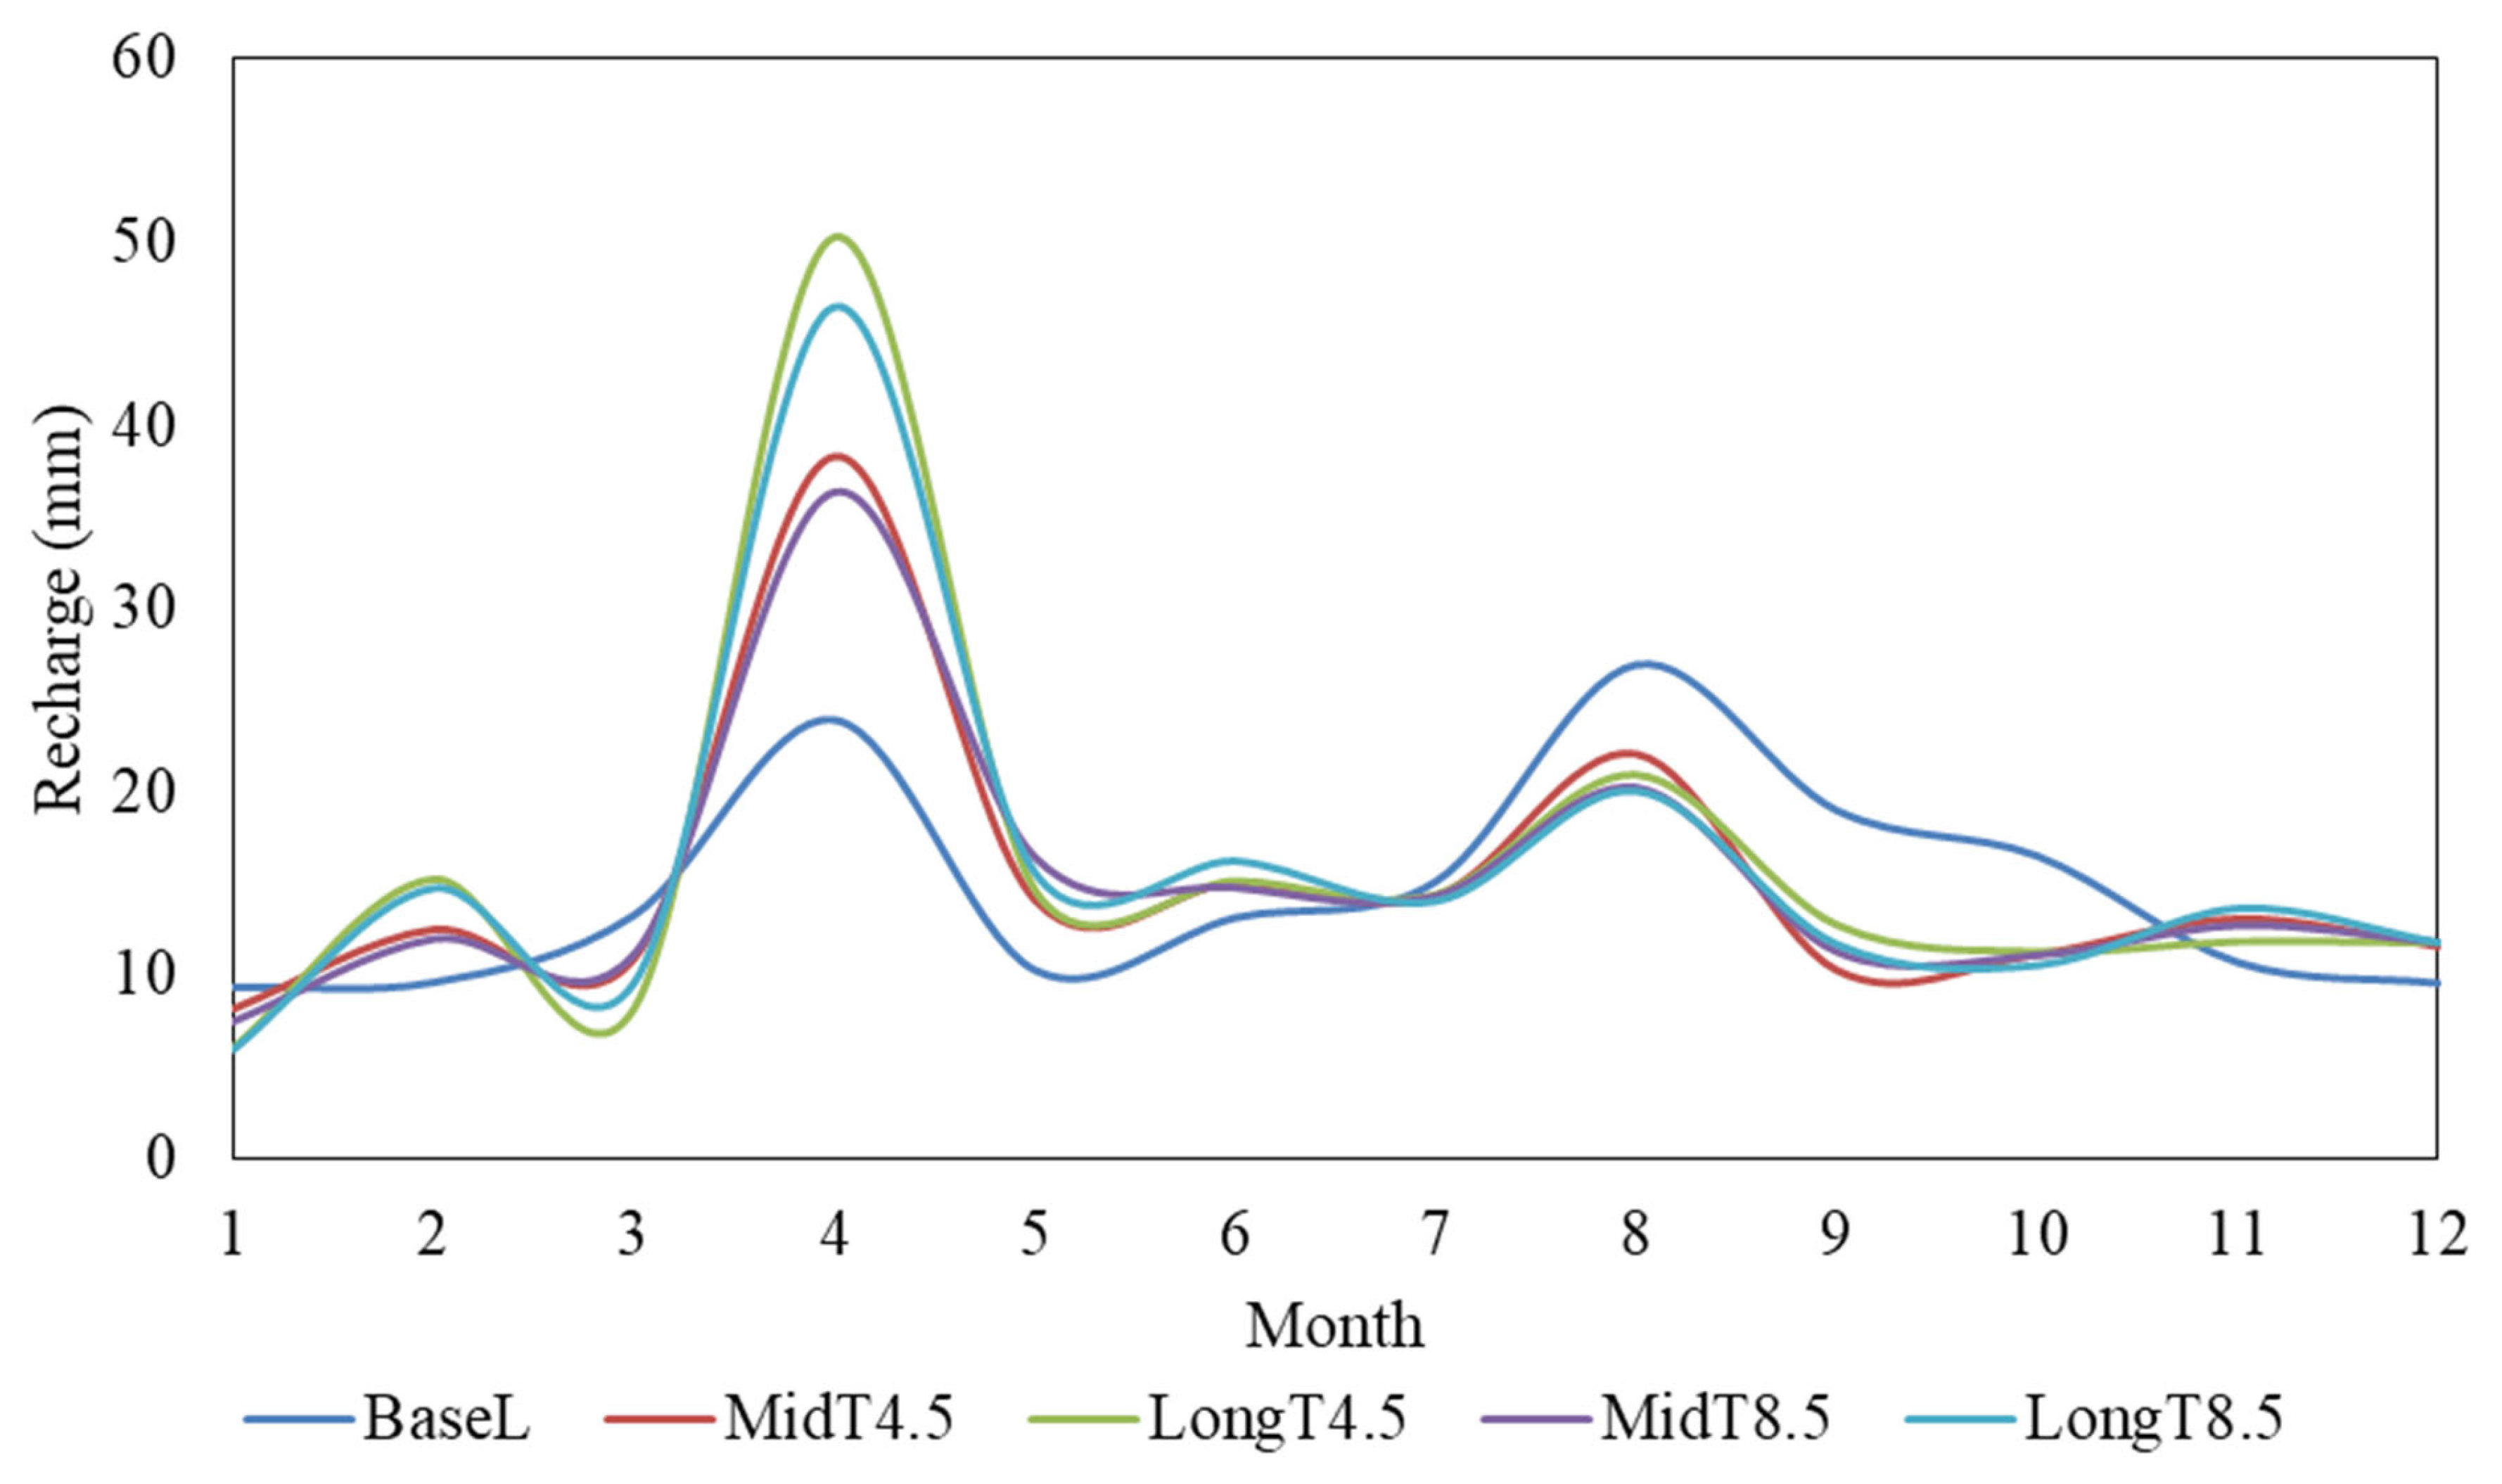
The impact of climate change on mean monthly GWR has been examined from 1986 to 2100 at the baseline, short-term, and long-term periods for RCP4.5 and RCP8.5 scenarios. The overall mean monthly GWR was 14.80 mm during the baseline period, whereas it has been increasing by 0.34 mm for the MidT4.5, 1.26 mm for the LongT4.5, 0.18 mm for the MidT8.5, and 1.07 mm for LongT8.5 (Figure 8).
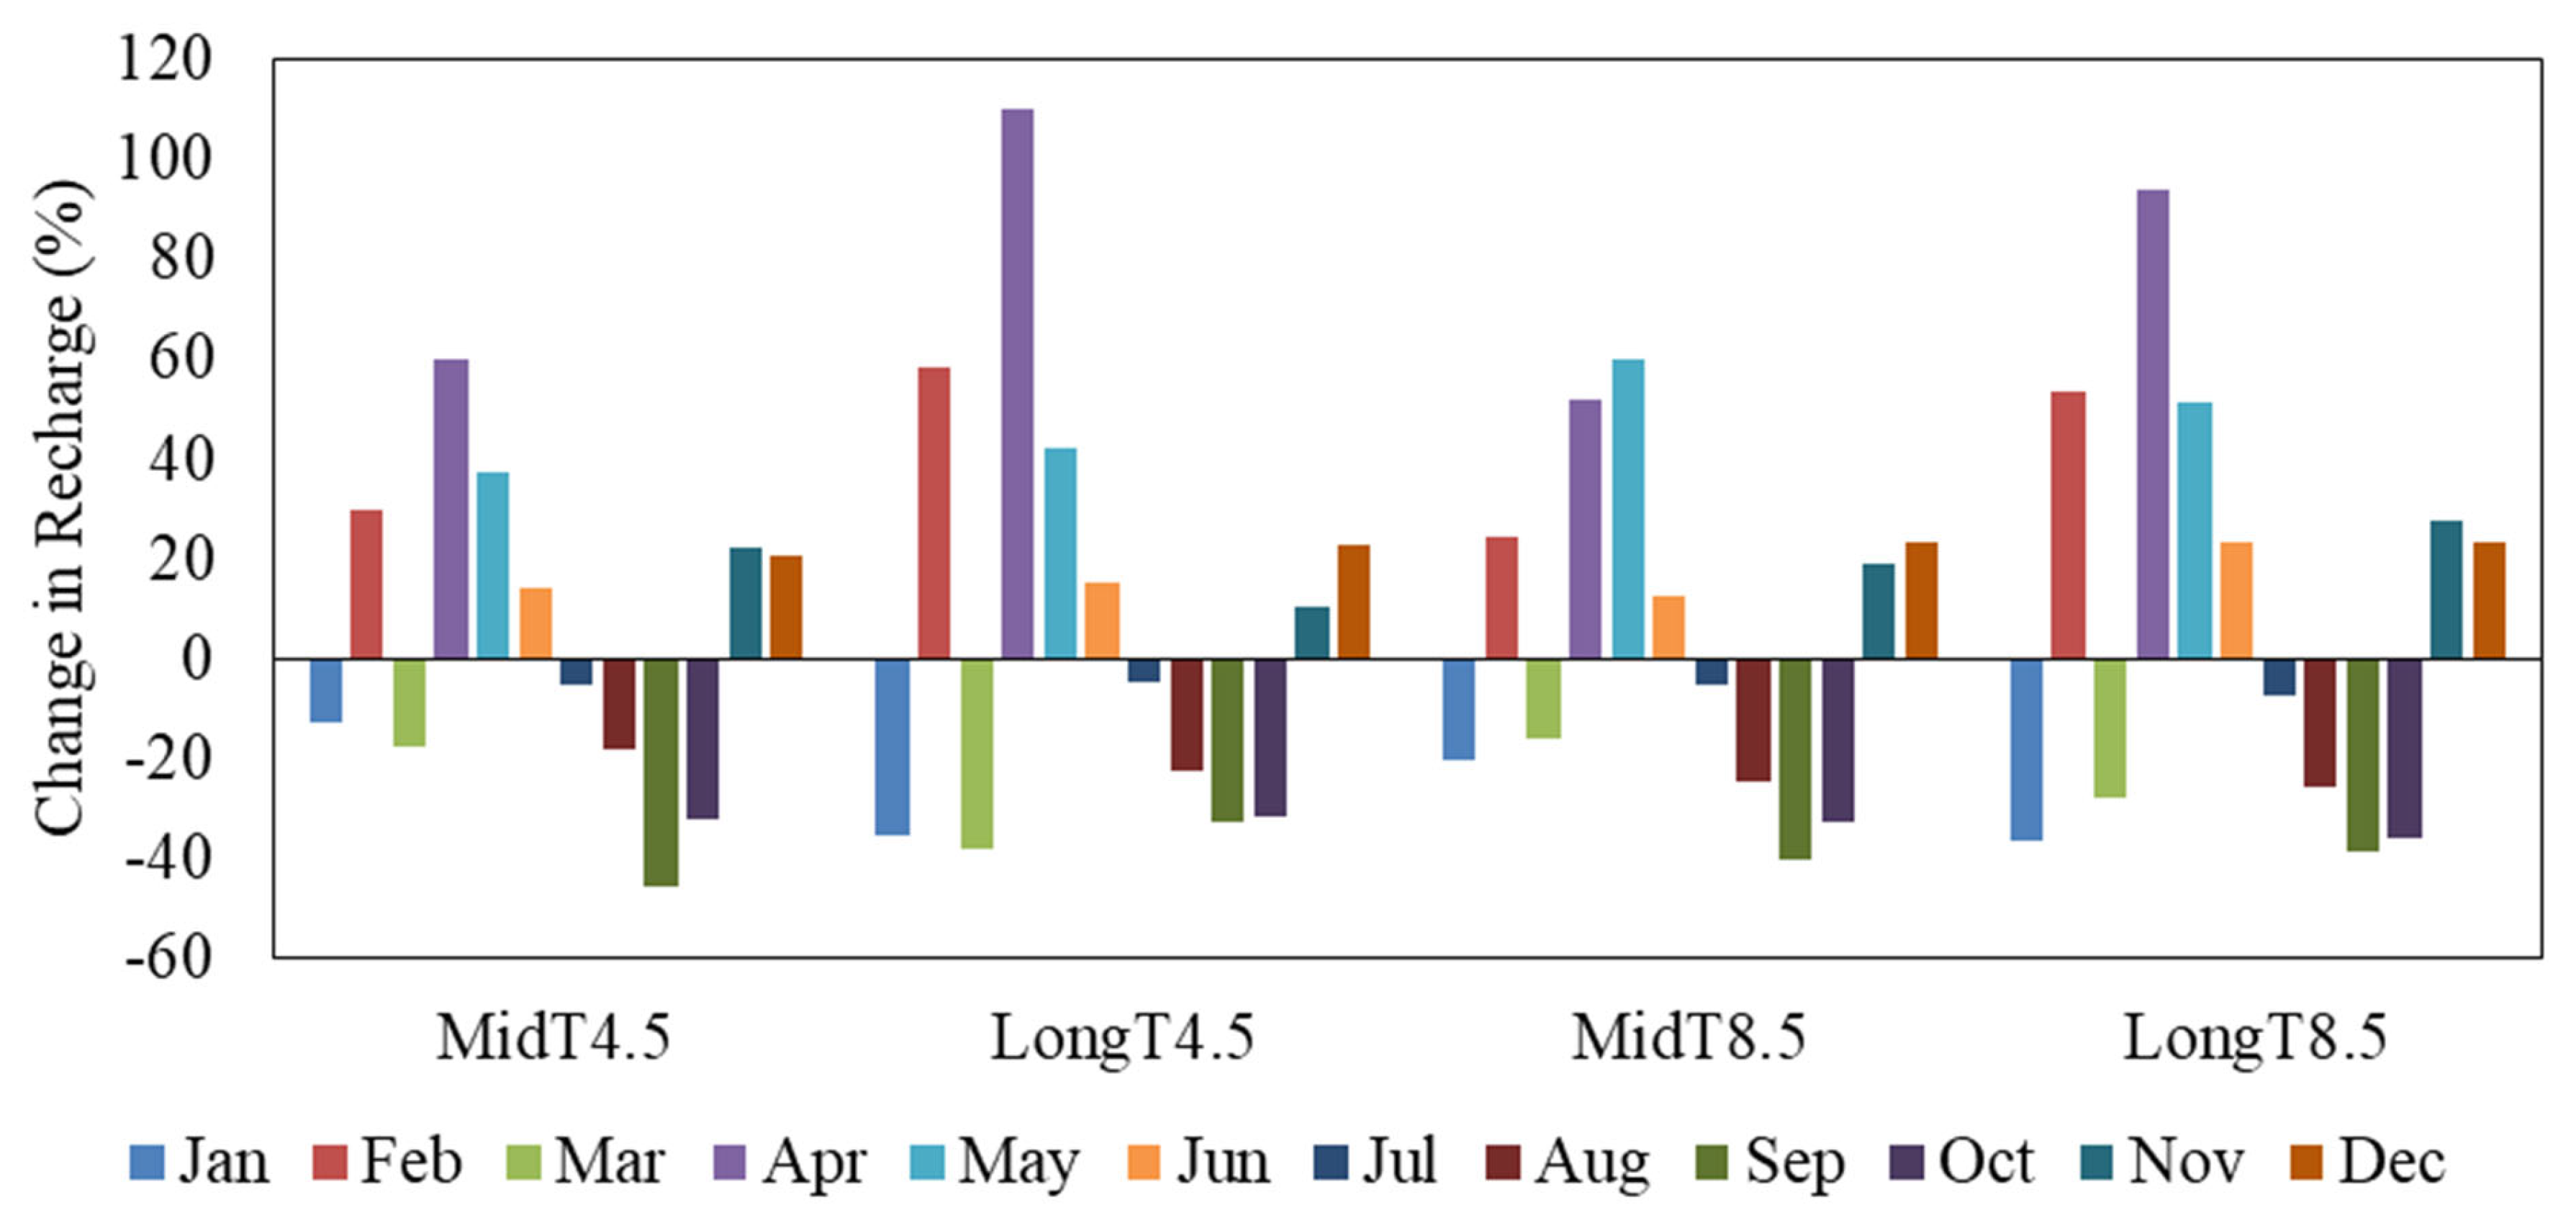
The lowest and peak monthly GWR were 9.38 and 26.95 mm during the baseline period, 8.19 and 38.32 mm for MidT4.5, 6.07 and 50.28 mm for the LongT4.5, 7.50 and 36.37 mm for the MidT8.5, and 5.96 and 46.47 mm for LongT8.5, respectively. The highest percentage increase in monthly GWR will occur in April by 60.03% for MidT4.5, 109.95% for LongT4.5, and 94.06% for LongT8.5, whereas the MidT8.5 (59.77%) will have in May. Furthermore, the highest monthly GWR decline will occur in September by −45.87% for MidT4.5, −40.52% for MidT8.5, and −38.42% for LongT8.5, while the LongT4.5 (−38.30%) will occur in March. The overall mean monthly GWR percentage increase will be 4.38% for MidT4.5, 7.88% for LongT4.5, 4.27% for MidT8.5, and 8.46% for LongT8.5, compared to the baseline period. Moreover, the overall average monthly percentage change for minimum and maximum GWR will be −12.75% and 42.17% for MidT4.5, −35.27% and 86.53% for LongT4.5, −20.06% and 34.96% for MidT8.5, and −36.44% and 72.41% for LongT8.5, respectively (Figure 9). The mean monthly GWR’s standard deviations were 5.86, 8.07, 11.41, 7.45, and 10.28 for baseline period, MidT4.5, LongT4.5, MidT8.5, and LongT8.5 scenarios, respectively.

3.4. Seasonal Recharge Variability

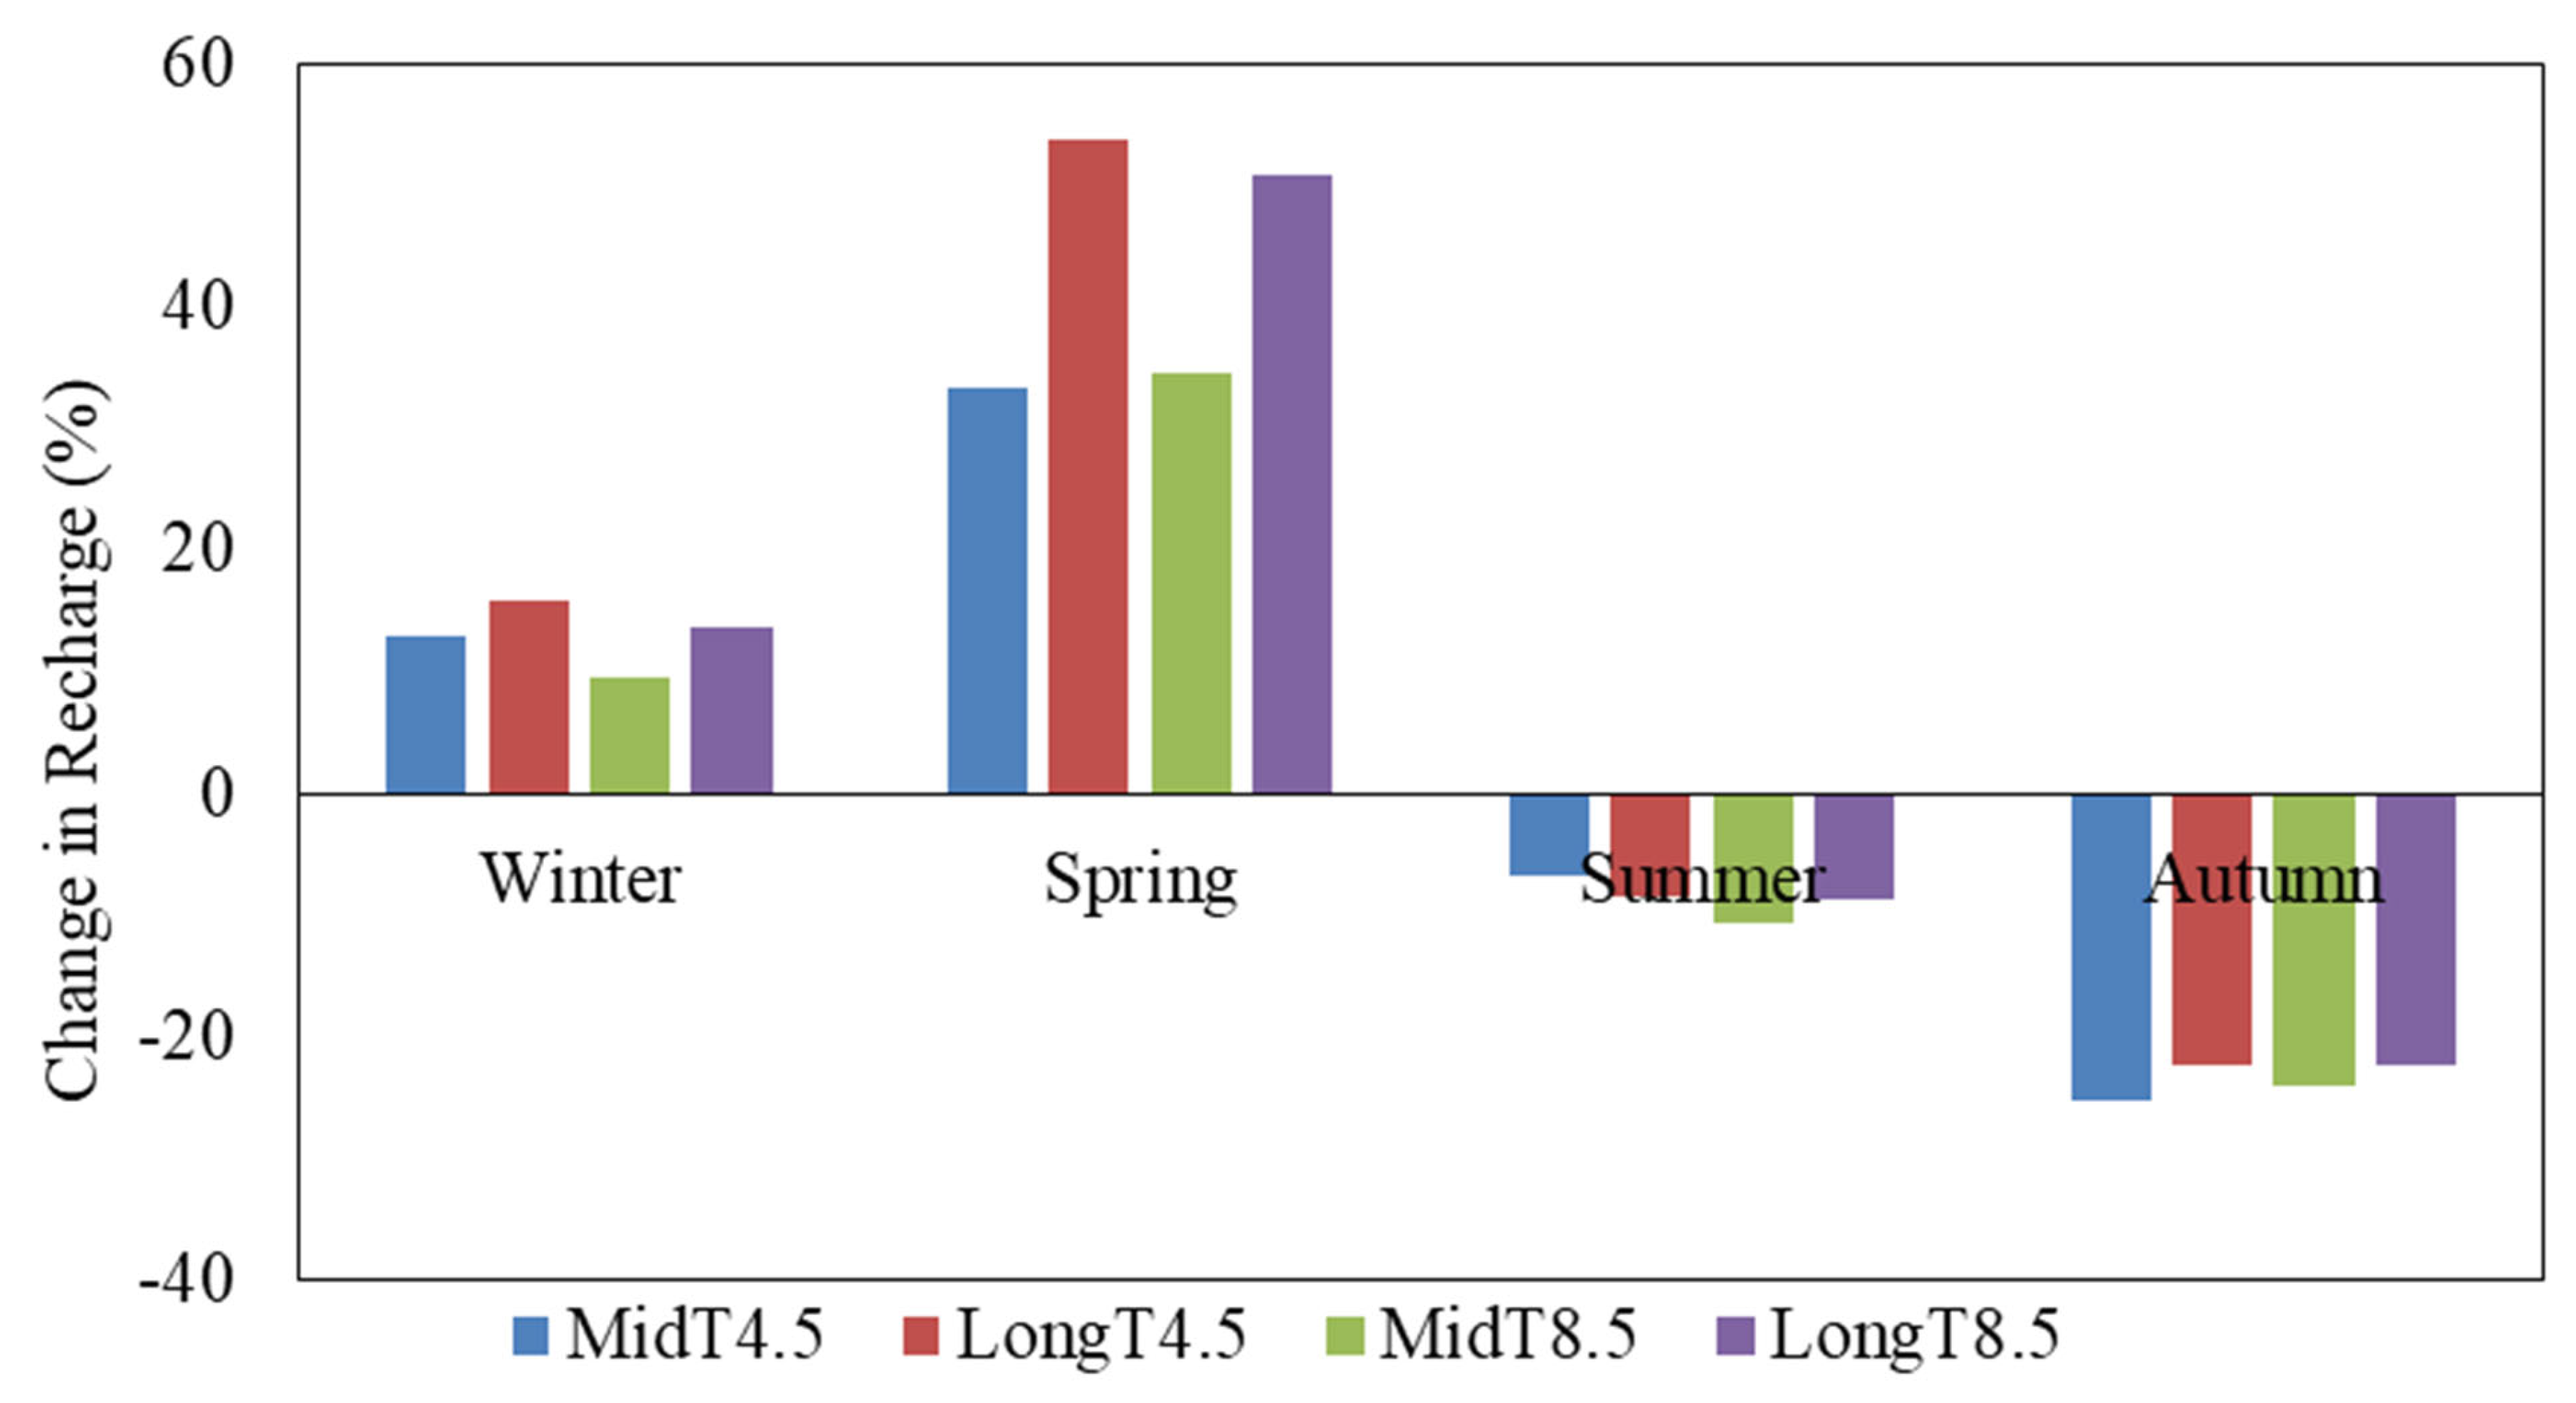
Compared to the baseline period, seasonal GWR increases throughout the winter and spring seasons while decreasing during summer and autumn (Figure 10 and Figure 11). Specifically, the baseline period GWR for the winter and spring seasons were 28.60 mm and 47.54 mm, the MidT4.5, LongT4.5, MidT8.5, and LongT8.5 had increases by 12.92% and 33.29%, 15.80%% and 53.86%, 9.50%% and 34.59%, and 13.74% and 50.76%, respectively. However, in the baseline period, GWR for summer and autumn seasons resulted in 55.26 mm and 46.26 mm, whereas the MidT4.5, LongT4.5, MidT8.5, and LongT8.5 had been declining by 6.80% and 25.27%, 8.52% and 22.34%, 10.60% and 24.00%, and 8.83% and 22.32%, respectively. The mean seasonal GWR’s standard deviations were 11.26 for the baseline period, 14.71 for the MidT4.5, 18.31 for the LongT4.5, 14.88 for the MidT8.5, and 17.80 for the LongT8.5 scenarios.

3.5. Estimated Annual Recharge

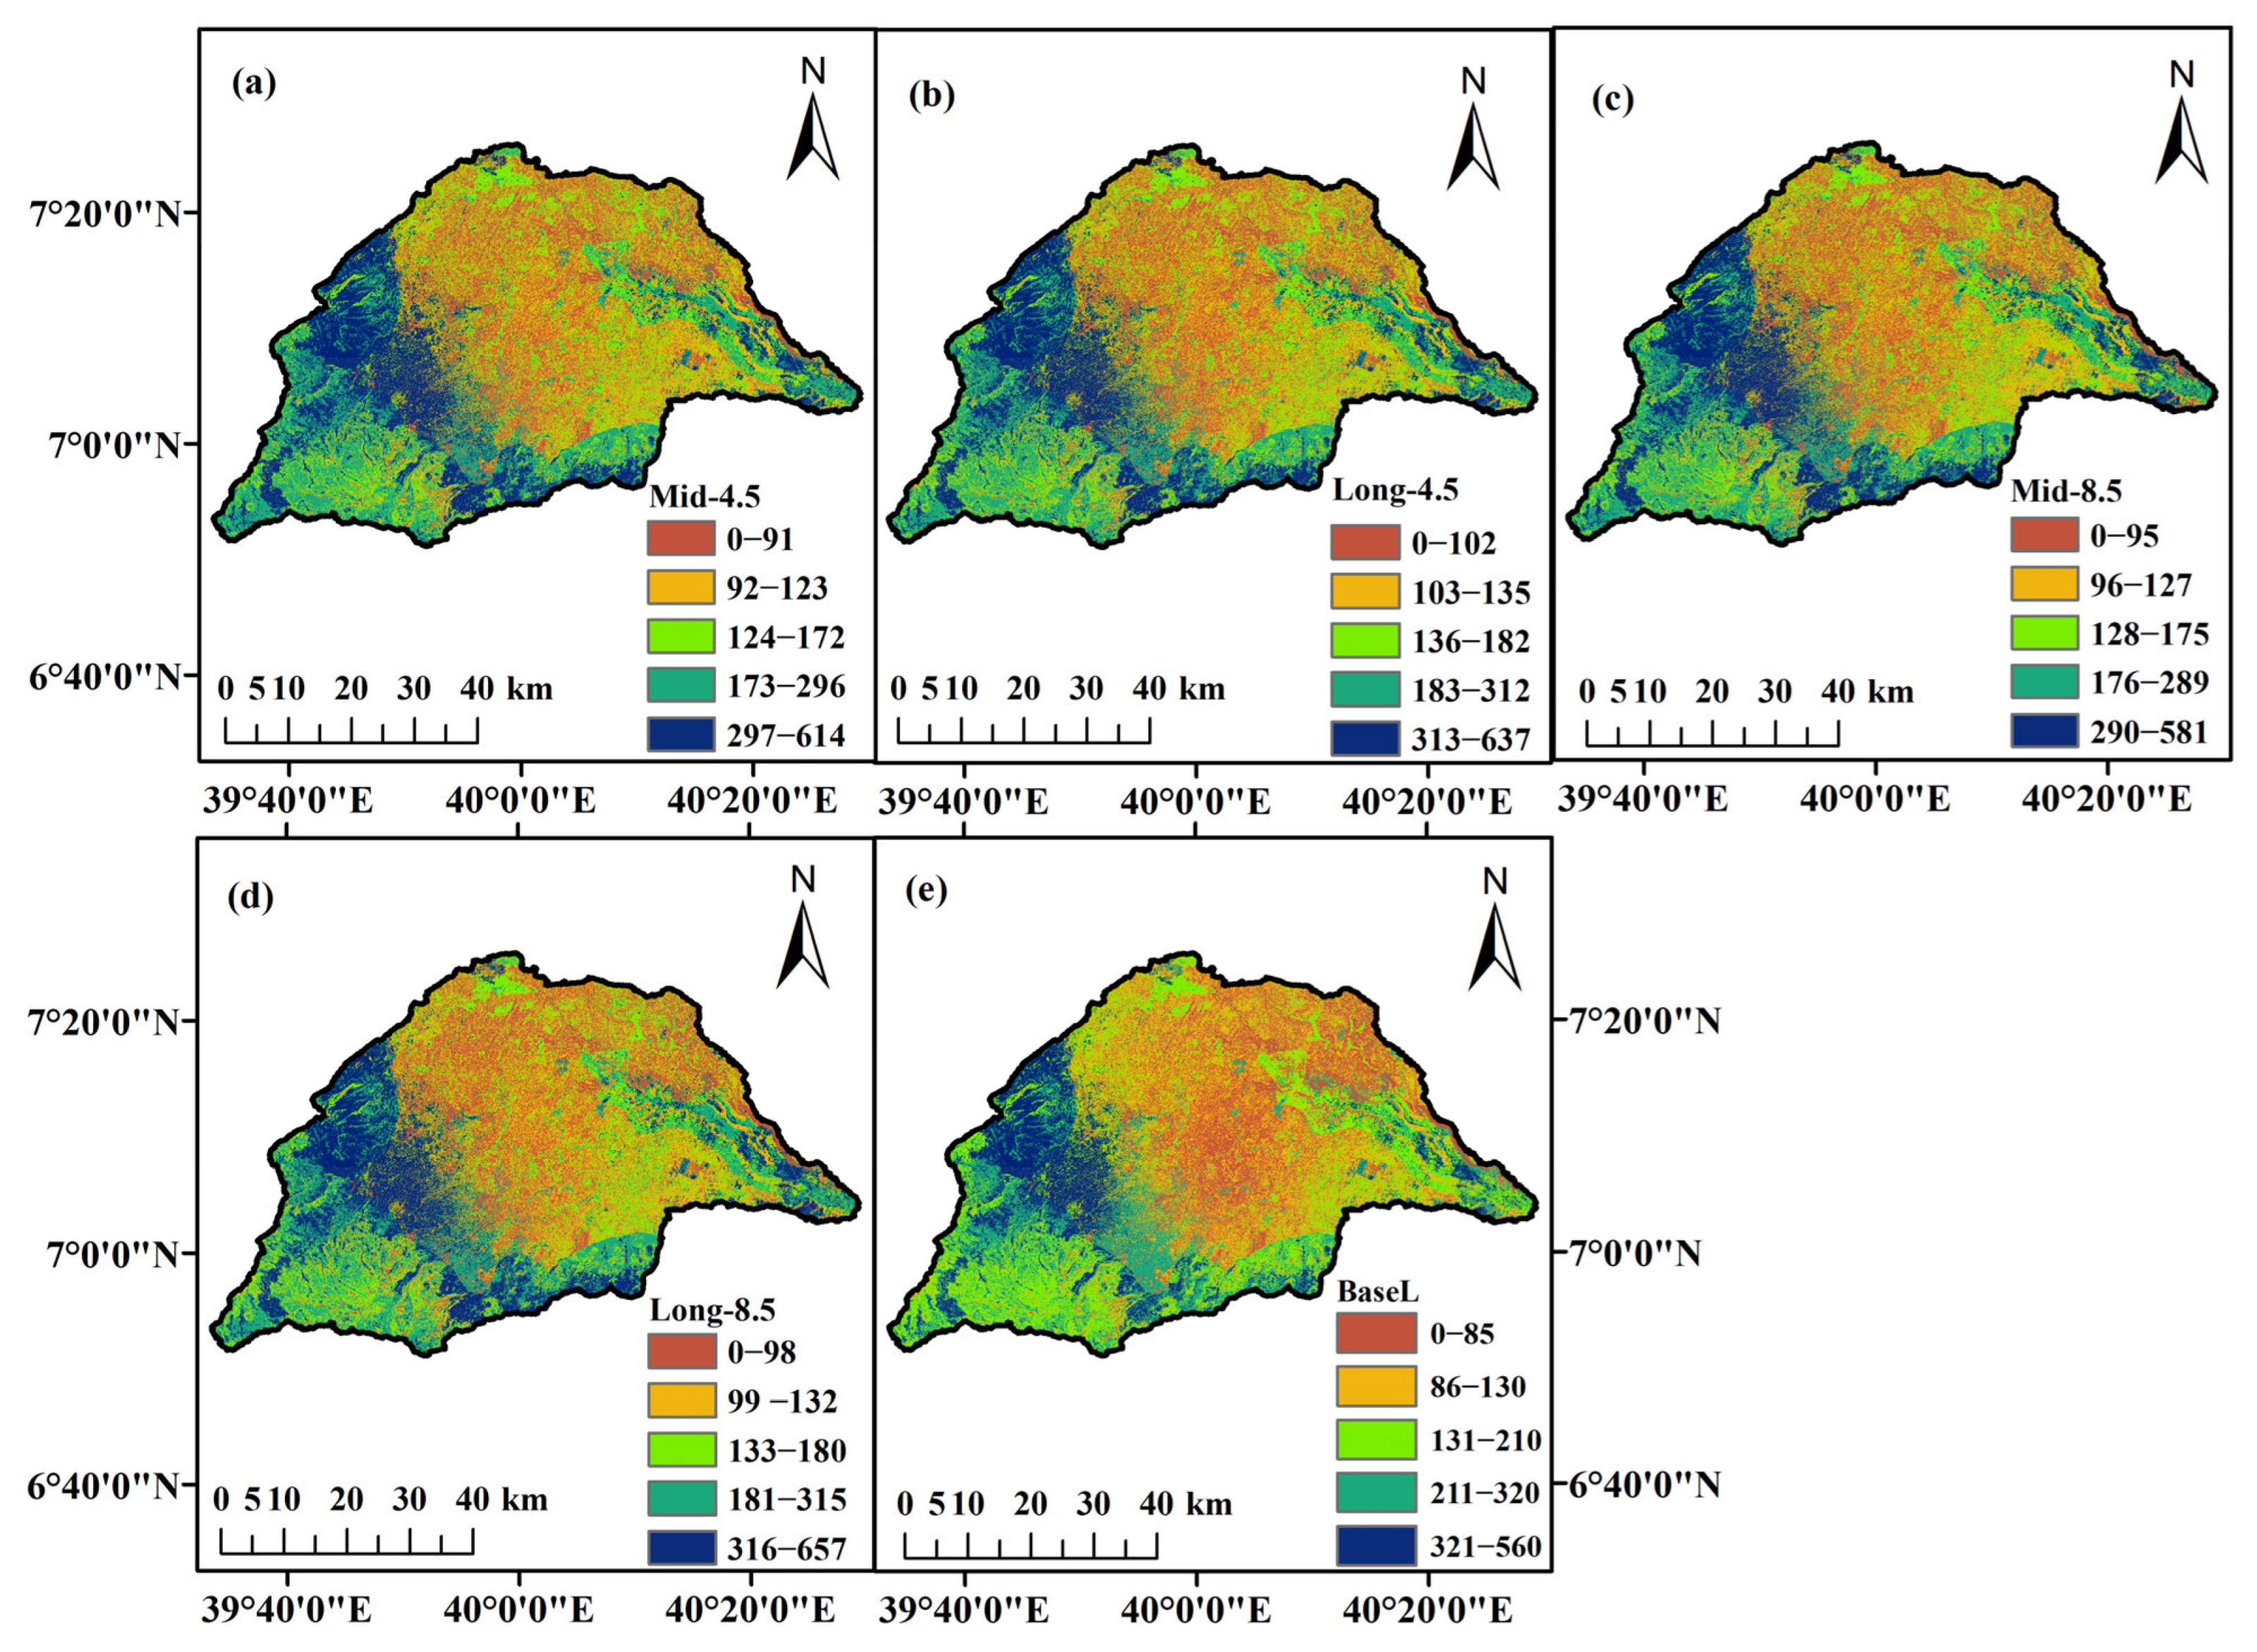
The Weyib watershed will be projected to experience increasing annual GWR compared to the baseline period under all climate change scenarios (Figure 12). Specifically, the mean annual GWR was 177.7 mm/year for the baseline period, 181.9, 192.9, 180.0, and 190.8 mm/year for MidT4.5, LongT4.5, MidT8.5, and LongT8.5, respectively. This means that the average annual GWR will be forecasted to increase by 2.41, 8.59, 1.34, and 7.38% for MidT4.5, LongT4.5, MidT8.5, and LongT8.5, respectively. Likewise, in contrast to the baseline period of 177.7 mm/year, the MidT4.5, LongT4.5, MidT8.5, and LongT8.5 will increase by 4.28, 15.27, 2.38, and 13.11 mm/year, respectively. In the Weyib watershed, in comparison to the baseline period (560 mm), the maximum annual GWR will rise by 9.6% (54 mm), 13.8% (77 mm), 3.8% (21 mm), and 17.3% (97 mm) for the MidT4.5, LongT4.5, MidT8.5, and LongT8.5, respectively. Increasing the highest GWR will be expected in the watershed’s southeastern areas, dense forest, and vegetation land-cover areas. In contrast, the central areas receive an average range of GWR (Figure 12). Additionally, in the baseline period, areas covered by vegetation, like forests, shrublands, and grasslands, gained the most significant level of GWR when compared to other LULC categories [3]. However, GWR is declining compared to the baseline period as it goes from upstream to the watershed’s outlet, due to decreasing rainfall and rising temperature. Table 3 shows plus or minus standard deviations from the mean monthly temperature and rainfall.

4. Discussion

4.1. Climate Variability Analysis

To guarantee reliable and sustainable availability, it is imperative to understand and mitigate the effects of climate change on groundwater resources [1]. In the Weyib watershed, the average temperature and precipitation will have a rising future pattern during both RCP4.5 and RCP8.5 in comparison to the baseline period (Figure 5 and Figure 6). The outcomes of this research will fall within a comparable range to those of preceding climate change studies carried out in Ethiopia. For example, in the Genale-Dawa river basin, studies conducted over a few watersheds showed a substantial rise in the projected precipitation and temperature [40,42,58]. More particularly, the research downscaled three climate models, such as GFDL-ESM2M, CanESM2, and GFDL-ESM2G with SDSM, and its findings demonstrate that the temperature and rainfall will be expected to rise considerably in the Weyib watershed [31]. The findings of a study conducted at Ethiopia’s Bilate River were consistent with the increasing temperature recorded in the Weyib watershed [1]. On top of that, annual rainfall and temperature increased sharply during the RCP4.5 and RCP8.5 scenarios, with a comparable pattern recorded [14]. Unlike most studies, the annual precipitation will increase in the long-term while declining in short-term periods for both RCPs in Ethiopia’s Erer watershed [16]. Moreover, it is clear from multiple studies that climate change will result in a significant increase in temperatures and precipitation in the years to come during both the RCP4.5 and RCP8.5 scenarios [14,15,59,60].

4.2. Spatio-Temporal Recharge

Given the climate change implications, understanding the variability of hydrological components was imperative for water resources development and management [2]. Directly estimating water balance components may not be practical due to hydrogeological complexity and method unavailability; indirect estimation was frequently used [5]. The WetSpass-M model can estimate water balance components on a spatio-temporal scale at lower expenses, suitable for data-scarce areas, and with more efficient water resources management in an environmentally sound way [59,61]. Throughout the world, climate change is posing a considerable effect on the groundwater recharge [62]. Similarly, in Ethiopia, the GWR has varied significantly in spatiotemporal scale with changing temperature and rainfall [15,16,30]. This study estimates the effects of climate change on the GWR in the Weyib watershed with emphasis on monthly, seasonal, and annual time scales. Several studies pointed out the uneven variability of GWR owing to climate change in Ethiopia. The groundwater availability will decrease in arid and semi-arid areas, while increasing in humid and semihumid highlands [16,31,35]. For instance, the GWR amount has been increasing as it goes from the baseline period to the future climate change scenario in Ethiopia’s Werii watershed [30]. However, in Ethiopia’s Bilate River basin, declining GWR was observed in comparison to the baseline period [2]. Although the study did not focus on GWR, the findings depict a rising water availability owing to increasing annual precipitation in the Weyib watershed [31]. Unlike elsewhere, despite substantially growing water use [3,4,43]. The outcomes of this study highlighted that increasing GWR is recorded on an annual scale, in the winter and spring seasons, whereas it declines during summer and autumn (Figure 10, Figure 11 and Figure 12).
Meanwhile, regions with vegetation in the south and southeast received the peak recharge, while the middle and northern areas reported the smallest amount [3]. Furthermore, vegetation-covered areas have a peak GWR during the baseline period, compared to all LULC categories [3]. Boosting afforestation activities in the downstream areas of the watershed will be imperative for drought-affected districts in the Genale Dawa River basin. This study emphasizes the significance of implementing a comprehensive water resources management plan to mitigate the adverse effects of climate change. Additionally, this study shows that climate change will increase annual GWR and likely raise groundwater resource availability in the central and upstream areas of the watershed. Moreover, investing in artificial GWR andwater harvesting projects is imperative to avoid these possible adverse effects in the autumn and summer, which will reduce the water availability and supply. In order to contribute to water resources management, stakeholders can lessen the adverse effects of climate change by investigating water policy and management scenarios in greater detail.
This study had limitations regarding groundwater level data availability on a spatiotemporal scale. This research also underlined the significance of institutional gathering of continuous groundwater level data to improve the reliability and accuracy of hydrological modeling. Furthermore, future researchers can build on this study by collecting primary data for groundwater level and water use and considering future land use change in the Weyib watershed. However, this study collected static groundwater levels for fifty-three wells over the 2022 wet and dry seasons to overcome data constraints. Additionally, this research promotes an organization to gather time series groundwater levels data to improve the efficiency of hydrological modeling and water resources management.

4.3. Climate Model Uncertainties

Climate models are instrumental in forecasting incoming climate change scenarios; it is imperative to comprehend the ramifications on water resources. Climate models in African areas exhibit a little overestimation or underestimation in some areas of rainfall while reflecting correctly the annual pattern [63,64]. However, these models include uncertainties owing to the initial hypothesis and characterization; studies proposed ensembling multiple climate models to tackle such drawbacks [63,64,65]. Furthermore, ensembling multiple climate models’ outputs was widely recommended to reduce possible uncertainties and produce an effective climate forecast [64,66]. To reduce uncertainties, this study employed one of the most often used estimation methods, the simple mean of rainfall and temperature outputs derived from numerous climate prediction models at the point gauge level [66,67]. Moreover, this study implemented a simple mean method to ensemble multiple climate models to mitigate uncertainties from a single model over- or underestimating.

5. Conclusions

This research aims to evaluate the effects of climate change on the spatio-temporal GWR for Ethiopia’s Weyib watershed at monthly, seasonal, and annual time scales. Using an ensemble of five climate models (such as CNRM-CM5, GFDL-ESM2M, IPSL-CM5A-MR, MPI-ESM-LR, and NorESM1-M) and a physically based distributed WetSpass-M model that has been proven effective, the study estimated spatio-temporal GWR for the RCP4.5 and RCP8.5 scenarios over baseline, mid-term, and long-term periods. The model performance metrics showed R2 values of 0.90 and 0.85, NSE values of 0.95 and 0.89, and 0.82 and 0.84 for KGE in comparison to IHACRES-filtered and WetSpass-M model-simulated baseflow and direct runoff, respectively. The study area’s annual GWR for the baseline period rates were 177.7 mm/yr, increasing by 2.41%, 8.59%, 1.34%, and 7.38% for MidT4.5, LongT4.5, MidT8.5, and LongT8.5, respectively. In comparison to the baseline period, the projected seasonal GWR will increase throughout winter and spring but decrease during autumn and summer. Additionally, the watershed’s monthly mean percentage change of GWR was 4.38%, 7.88%, 4.27%, and 8.46% for MidT4.5, LongT4.5, MidT8.5, and LongT8.5, respectively. Furthermore, the results of this research exhibit that climate change could lead to GWR increasing on an annual time scale, which boosts water resources availability. This study underlines the need to develop and practice water harvesting and artificial GWR projects, to mitigate climate change’s impact, and increasing sustainable groundwater resources availability. Future studies may look more into water-related policy scenarios to enhance stakeholder involvement in water resources management and reduce the adverse effects of climate change. This study is limited to the spatial scale of the collected groundwater level data; future researchers can explore this further by collecting time series of groundwater level data.

Author Contributions

All authors participated in the conceptualization and design of the study. M.R.A. collected data, examined, modelled, interpreted, analyzed, and wrote a draft manuscript. M.O.D. supervised and revised the manuscript. All authors have read and agreed to the published version of the manuscript.

Funding

This research received no external funding.

Institutional Review Board Statement

Not applicable.

Informed Consent Statement

All authors agree to publish in this journal.

Data Availability Statement

The corresponding author can provide the data used or analyzed in this research upon reasonable request.

Acknowledgments

The authors want to acknowledge the Ethiopian Ministry of Water and Energy and the National Meteorology Agency for providing hydrological and climate data, respectively. The researchers appreciate the University of Johannesburg for its assistance throughout this study. We thank the editor and reviewers for their valuable time and constructive feedback during the article’s review process.

Conflicts of Interest

The authors declare no conflicts of interest.

References

  1. Nannawo, A.S.; Lohani, T.K.; Eshete, A.A. Envisaging the actual evapotranspiration and elucidating its effects under climate change scenarios on agrarian lands of bilate river basin in Ethiopia. Heliyon 2022, 8, e10368. [Google Scholar] [CrossRef]
  2. Nannawo, A.S.; Lohani, T.K.; Eshete, A.A. Groundwater recharge evaluation due to climate change using WetSpass-M distributed hydrological model in Bilate river basin of Ethiopia. Groundw. Sustain. Dev. 2022, 19, 100860. [Google Scholar] [CrossRef]
  3. Aredo, M.R.; Lohani, T.K.; Mohammed, A.K. Groundwater recharge estimation using WetSpass-M and MTBS leveraging from HydroOffice and WHAT tools for baseflow in Weyib watershed, Ethiopia. Environ. Monit. Assess. 2024, 196, 532. [Google Scholar] [CrossRef]
  4. Aredo, M.R.; Lohani, T.K.; Mohammed, A.K. Revisiting the global weights of the integrated watershed health assessment framework and Weyib watershed health analysis: Ethiopia’s policy prospects. World Water Policy 2024, 10, 940–970. [Google Scholar] [CrossRef]
  5. Demissie, E.S.; Gashaw, D.Y.; Altaye, A.A.; Demissie, S.S.; Ayele, G.T. Groundwater Recharge Estimation in Upper Gelana Watershed, South-Western Main Ethiopian Rift Valley. Sustainability 2023, 15, 1763. [Google Scholar] [CrossRef]
  6. Meresa, E.; Taye, G. Estimation of groundwater recharge using GIS-based WetSpass model for Birki watershed, the eastern zone of Tigray, Northern Ethiopia. Sustain. Water Resour. Manag. 2019, 5, 1555–1566. [Google Scholar] [CrossRef]
  7. Gebremichael, M.; Mechal, A. Groundwater potential mapping using WetSpass-M and GIS-based multi-criteria decision analysis (MCDA) models in the Chamo Lake basin, Ethiopian rift. Sustain. Water Resour. Manag. 2025, 11, 40. [Google Scholar] [CrossRef]
  8. Kahsay, G.H.; Gebreyohannes, T.; Gebremedhin, M.A.; Gebrekirstos, A.; Birhane, E.; Gebrewahid, H.; Welegebriel, L. Spatial groundwater recharge estimation in Raya basin, Northern Ethiopia: An approach using GIS based water balance model. Sustain. Water Resour. Manag. 2019, 5, 961–975. [Google Scholar] [CrossRef]
  9. Mechal, A.; Karuppannan, S.; Bayisa, A. Groundwater recharge estimation in the Ziway Lake Watershed, Ethiopian Rift: An approach using SWAT and CMB techniques. Sustain. Water Resour. Manag. 2024, 10, 130. [Google Scholar] [CrossRef]
  10. Baran-Gurgul, K.; Rutkowska, A. Water Resource Management: Hydrological Modelling, Hydrological Cycles, and Hydrological Prediction. Water 2024, 16, 3689. [Google Scholar] [CrossRef]
  11. Daniel, D.; Ayenew, T.; Fletcher, C.G.; Duraisamy, R.; Jothimani, M. Numerical groundwater flow modelling under changing climate in Abaya–Chamo lakes basin, Rift Valley, Southern Ethiopia. Model. Earth Syst. Environ. 2022, 8, 3985–3999. [Google Scholar] [CrossRef]
  12. Khadim, F.K.; Dokou, Z.; Lazin, R.; Bagtzoglou, A.C.; Anagnostou, E. Groundwater Modeling to Assess Climate Change Impacts and Sustainability in the Tana Basin, Upper Blue Nile, Ethiopia. Sustainability 2023, 15, 6284. [Google Scholar] [CrossRef]
  13. Merga, D.D.; Adeba, D.; Regasa, M.S.; Leta, M.K. Evaluation of Surface Water Resource Availability under the Impact of Climate Change in the Dhidhessa Sub-Basin, Ethiopia. Atmosphere 2022, 13, 1296. [Google Scholar] [CrossRef]
  14. Balcha, S.K.; Awass, A.A.; Hulluka, T.A.; Bantider, A.; Ayele, G.T. Assessment of future climate change impact on water balance components in Central Rift Valley Lakes Basin, Ethiopia. J. Water Clim. Chang. 2023, 14, 175–199. [Google Scholar] [CrossRef]
  15. Alehu, B.A.; Bitana, S.G. Assessment of Climate Change Impact on Water Balance of Lake Hawassa Catchment. Environ. Process. 2023, 10, 14. [Google Scholar] [CrossRef]
  16. Mummed, B.A.; Seleshi, Y. Assessment of the effects of climate change on water balance components in the upper Erer subbasin, Ethiopia. Heliyon 2024, 10, e30297. [Google Scholar] [CrossRef]
  17. IPCC. Climate Change 2001: The Scientific Basis; Cambridge University Press: Cambridge, UK; Available online: www.ipcc.ch/site/assets/uploads/2018/03/WGI_TAR_full_report.pdf (accessed on 20 April 2025).
  18. Ayalew, D.W.; Asefa, T.; Moges, M.A.; Leyew, S.M. Evaluating the potential impact of climate change on the hydrology of Ribb catchment, Lake Tana Basin, Ethiopia. J. Water Clim. Chang. 2022, 13, 190–205. [Google Scholar] [CrossRef]
  19. Daba, M.H.; You, S. Assessment of Climate Change Impacts on River Flow Regimes in the Upstream of Awash Basin, Ethiopia: Based on IPCC Fifth Assessment Report (AR5) Climate Change Scenarios. Hydrology 2020, 7, 98. [Google Scholar] [CrossRef]
  20. Nyembo, L.O.; Larbi, I.; Mwabumba, M.; Selemani, J.R.; Dotse, S.Q.; Limantol, A.M.; Bessah, E. Impact of climate change on groundwater recharge in the lake Manyara catchment, Tanzania. Sci. Afr. 2022, 15, e01072. [Google Scholar] [CrossRef]
  21. Mengistu, A.G.; Tesfuhuney, W.A.; Woyessa, Y.E.; Ejigu, A.A.; Alemu, M.D. Contrasting hydro-climatic trends and drought dynamics in Ethiopia and South Africa under climate change. Clim. Dyn. 2025, 63, 105. [Google Scholar] [CrossRef]
  22. Arsano, Y.; Tamrat, I. Ethiopia and the Eastern Nile Basin. Aquat. Sci. 2005, 67, 15–27. [Google Scholar] [CrossRef]
  23. Aredo, M.R.; Lohani, T.K.; Mohammed, A.K. Assessment of river response to water abstractions in the Weyib Watershed, Ethiopia. Int. J. River Basin Manag. 2023, 23, 93–104. [Google Scholar] [CrossRef]
  24. Aredo, M.R.; Lohani, T.K.; Mohammed, A.K. Numerical groundwater modelling under changing water abstraction in Weyib watershed, Ethiopia. Cogent Eng. 2023, 10, 2283297. [Google Scholar] [CrossRef]
  25. Gebremeskel, G.; Kebede, A. Estimating the effect of climate change on water resources: Integrated use of climate and hydrological models in the Werii watershed of the Tekeze river basin, Northern Ethiopia. Agric. Nat. Resour. 2018, 52, 195–207. [Google Scholar] [CrossRef]
  26. Molla, D.D.; Tegaye, T.A.; Fletcher, C.G. Simulated surface and shallow groundwater resources in the Abaya-Chamo Lake basin, Ethiopia using a spatially-distributed water balance model. J. Hydrol. Reg. Stud. 2019, 24, 100615. [Google Scholar] [CrossRef]
  27. Dile, Y.T.; Ayana, E.K.; Worqlul, A.W.; Xie, H.; Srinivasan, R.; Lefore, N.; You, L.; Clarke, N. Evaluating satellite-based evapotranspiration estimates for hydrological applications in data-scarce regions: A case in Ethiopia. Sci. Total Environ. 2020, 743, 140702. [Google Scholar] [CrossRef]
  28. Dong, Z.; Hu, H.; Wei, Z.; Liu, Y.; Xu, H.; Yan, H. Estimating the Actual Evapotranspiration of Different Vegetation Types Based on Root Distribution Functions. Front. Earth Sci. 2022, 10, 893388. [Google Scholar] [CrossRef]
  29. Hordofa, A.T.; Leta, O.T.; Alamirew, T.; Chukalla, A.D. Climate Change Impacts on Blue and Green Water of Meki River Sub-Basin. Water Resour. Manag. 2023, 37, 2835–2851. [Google Scholar] [CrossRef]
  30. Shiferaw, H.; Gebremedhin, A.; Gebretsadkan, T.; Zenebe, A. Modelling hydrological response under climate change scenarios using SWAT model: The case of Ilala watershed, Northern Ethiopia. Model. Earth Syst. Environ. 2018, 4, 437–449. [Google Scholar] [CrossRef]
  31. Serur, A.B.; Sarma, A.K. Climate change impacts analysis on hydrological processes in the Weyib River basin in Ethiopia. Theor. Appl. Climatol. 2018, 134, 1301–1314. [Google Scholar] [CrossRef]
  32. Awulachew, S.B.; Yilma, A.D.; Loulseged, M.; Loiskandl, W.; Ayana, M.; Alamirew, T. Water Resources and Irrigation Development in Ethiopia; IWMI Working Paper 123; International Water Management Institute (IWMI): Colombo, Sri Lanka, 2007; 66p, Available online: https://hdl.handle.net/10568/39349 (accessed on 20 August 2020).
  33. NDRMC. Flood Alert #2, 04 June 2020; National Disaster Risk Management Commission (NDRMC): Addis Ababa, Ethiopia, 2020. Available online: https://reliefweb.int/report/ethiopia/ndrmc-flood-alert-2-04-june-2020 (accessed on 20 August 2020).
  34. Aredo, M.R.; Hatiye, S.D.; Pingale, S.M. Impact of land use/land cover change on stream flow in the Shaya catchment of Ethiopia using the MIKE SHE model. Arab. J. Geosci. 2021, 14, 114. [Google Scholar] [CrossRef]
  35. Mengistu, T.D.; Feyissa, T.A.; Chung, I.M.; Chang, S.W.; Yesuf, M.B.; Alemayehu, E. Regional Flood Frequency Analysis for Sustainable Water Resources Management of Genale–Dawa River Basin, Ethiopia. Water 2022, 14, 637. [Google Scholar] [CrossRef]
  36. Tessema, Y.M.; Jasińska, J.; Yadeta, L.T.; Świtoniak, M.; Puchałka, R.; Gebregeorgis, E.G. Soil loss estimation for conservation planning in the welmel watershed of the Genale Dawa Basin, Ethiopia. Agronomy 2020, 10, 777. [Google Scholar] [CrossRef]
  37. Abebe, B.W.; Mana, T.T.; Hatiye, S.D. Assessment of meteorological drought and its association with global climate drivers in Genale Dawa River Basin, South-East of Ethiopia. Model. Earth Syst. Environ. 2024, 10, 5027–5042. [Google Scholar] [CrossRef]
  38. Serur, A.B. Modeling blue and green water resources availability at the basin and sub-basin level under changing climate in the Weyb River basin in Ethiopia. Sci. Afr. 2020, 7, e00299. [Google Scholar] [CrossRef]
  39. Bulti, A.; Abegaz, F. Impacts of Climate Change on Temperature and Rainfall on Dawa Sub-watershed, Genale Dawa River Basin, Southern Ethiopia. Int. J. Atmos. Ocean Sci. 2024, 8, 1–23. [Google Scholar] [CrossRef]
  40. Abdule, A.M.; Muluneh, A.; Woldemichael, A. Impact of Climate and Land Use/Cover Changes on Streamflow in Yadot Watershed, Genale Dawa Basin, Ethiopia. Air Soil Water Res. 2023, 16, 11786221231200106. [Google Scholar] [CrossRef]
  41. Gashaw, T.; Worqlul, A.W.; Lakew, H.; Taye, M.T.; Seid, A.; Haileslassie, A. Evaluations of satellite/reanalysis rainfall and temperature products in the Bale Eco-Region (Southern Ethiopia) to enhance the quality of input data for hydro-climate studies. Remote Sens. Appl. Soc. Environ. 2023, 31, 100994. [Google Scholar] [CrossRef]
  42. Mustefa, A.; Muluneh, A. Modeling climate change projection and its impact on the streamflow in the Yadot watershed, Genale Dawa basin, Ethiopia. J. Water Clim. Chang. 2024, 15, 3487–3505. [Google Scholar] [CrossRef]
  43. Kassahun, N.; Mohamed, M. Groundwater Potential Assessment and Characterization of Genale-Dawa River Basin. Open J. Mod. Hydrol. 2018, 8, 126–144. [Google Scholar] [CrossRef]
  44. Yenehun, A.; Dessie, M.; Nigate, F.; Belay, A.S.; Azeze, M.; Camp, M.V.; Taye, D.F.; Kidane, D.; Adgo, E.; Nyssen, J.; et al. Spatial and temporal simulation of groundwater recharge and cross-validation with point estimations in volcanic aquifers with variable topography. J. Hydrol. Reg. Stud. 2022, 42, 101142. [Google Scholar] [CrossRef]
  45. Abdollahi, K.; Bashir, I.; Verbeiren, B.; Harouna, M.R.; Van Griensven, A.; Huysmans, M.; Batelaan, O. A distributed monthly water balance model: Formulation and application on Black Volta Basin. Environ. Earth Sci. 2017, 76, 198. [Google Scholar] [CrossRef]
  46. Gelebo, A.H.; Kasiviswanathan, K.S.; Khare, D. Assessment of the spatial–temporal distribution of groundwater recharge in data-scarce large-scale African river basin. Environ. Monit. Assess. 2022, 194, 157. [Google Scholar] [CrossRef] [PubMed]
  47. Woldu, T.T.; Ayenew, T.; Baychken, B.; Birhanu, B. Spatiotemporal recharge estimation in the upper Awash sub-basin, central Ethiopia. Hydrol. Res. 2024, 55, 711–727. [Google Scholar] [CrossRef]
  48. Batelaan, O.; De Smedt, F. GIS-based recharge estimation by coupling surface–subsurface water balances. J. Hydrol. 2007, 337, 337–355. [Google Scholar] [CrossRef]
  49. Zeabraha, A.; G/yohannes, T.; W/Mariyam, F.; Mulugeta, A.; Gebreyesus, Z. Application of a spatially distributed water balance model for assessing surface and groundwater resources: A case study of Adigrat area, Northern Ethiopia. Sustain. Water Resour. Manag. 2020, 6, 73. [Google Scholar] [CrossRef]
  50. Hadi, S.J.; Tombul, M. Comparison of Spatial Interpolation Methods of Precipitation and Temperature Using Multiple Integration Periods. J. Indian Soc. Remote Sens. 2018, 46, 1187–1199. [Google Scholar] [CrossRef]
  51. Pirani, F.J.; Modarres, R. Geostatistical and deterministic methods for rainfall interpolation in the Zayandeh Rud basin, Iran. Hydrol. Sci. J. 2020, 65, 2678–2692. [Google Scholar] [CrossRef]
  52. Wu, Y.-H.; Hung, M.-C. Comparison of Spatial Interpolation Techniques Using Visualization and Quantitative Assessment. In Applications of Spatial Statistics; IntechOpen: London, UK, 2016; Volume 11, pp. 17–34. [Google Scholar] [CrossRef]
  53. Worku, G.; Teferi, E.; Bantider, A.; Dile, Y.T. Modelling hydrological processes under climate change scenarios in the Jemma sub-basin of upper Blue Nile Basin, Ethiopia. Clim. Risk Manag. 2021, 31, 100272. [Google Scholar] [CrossRef]
  54. Mengistu, A.G.; Woldesenbet, T.A.; Dile, Y.T.; Bayabil, H.K. Modeling the impacts of climate change on hydrological processes in the Baro–Akobo River basin, Ethiopia. Acta Geophys. 2023, 71, 1915–1935. [Google Scholar] [CrossRef]
  55. Shigute, M.; Alamirew, T.; Abebe, A.; Ndehedehe, C.E.; Kassahun, H.T. Assessing the impacts of climate change on hydrological processes in the upper Genale River basin, Ethiopia. Environ. Earth Sci. 2024, 83, 297. [Google Scholar] [CrossRef]
  56. Knoben, W.J.M.; Freer, J.E.; Woods, R.A. Technical note: Inherent benchmark or not? Comparing Nash-Sutcliffe and Kling-Gupta efficiency scores. Hydrol. Earth Syst. Sci. 2019, 23, 4323–4331. [Google Scholar] [CrossRef]
  57. Ashaolu, E.D.; Olorunfemi, J.F.; PaulIfabiy, I.; Abdollahi, K.; Batelaan, O. Spatial and temporal recharge estimation of the basement complex in Nigeria, West Africa. J. Hydrol. Reg. Stud. 2020, 27, 100658. [Google Scholar] [CrossRef]
  58. Negewo, T.F.; Sarma, A.K. Estimation of Water Yield under Baseline and Future Climate Change Scenarios in Genale Watershed, Genale Dawa River Basin, Ethiopia, Using SWAT Model. J. Hydrol. Eng. 2021, 26, 05020051. [Google Scholar] [CrossRef]
  59. Getachew, B.; Manjunatha, B.R. Potential climate change impact assessment on the hydrology of the Lake Tana Basin, Upper Blue Nile River Basin, Ethiopia. Phys. Chem. Earth 2022, 127, 103162. [Google Scholar] [CrossRef]
  60. Asrade, T. Application of coupled WetSpass-M and MODFLOW models to estimate spatial–temporal water balance components in the Chemoga watershed, Ethiopia. Water Pract. Technol. 2024, 19, 3833–3854. [Google Scholar] [CrossRef]
  61. Tadesse, G.; Jothimani, M. Assessing Groundwater Recharge in the Wabe River Catchment, Central Ethiopia, Through a GIS-Based Distributed Water Balance Model. Earth 2024, 5, 20–44. [Google Scholar] [CrossRef]
  62. Ngo, T.M.L.; Wang, S.J.; Chen, P.Y. Assessment of future climate change impacts on groundwater recharge using hydrological modeling in the Choushui River Alluvial Fan, Taiwan. Water 2024, 16, 419. [Google Scholar] [CrossRef]
  63. Min, S.-K.; Hense, A. A Bayesian approach to climate model evaluation and multi-model averaging with an application to global mean surface temperatures from IPCC AR4 coupled climate models. Geophys. Res. Lett. 2006, 33, L08708. [Google Scholar] [CrossRef]
  64. Buontempo, C.; Mathison, C.; Jones, R.; Williams, K.; Wang, C.; McSweeney, C. An ensemble climate projection for Africa. Clim. Dyn. 2015, 44, 2097–2118. [Google Scholar] [CrossRef]
  65. Kim, J.; Ivanov, V.Y.; Fatichi, S. Climate change and uncertainty assessment over a hydroclimatic transect of Michigan. Stoch. Environ. Res. Risk Assess. 2016, 30, 923–944. [Google Scholar] [CrossRef]
  66. You, Q.; Jiang, Z.; Wang, D.; Pepin, N.; Kang, S. Simulation of temperature extremes in the Tibetan Plateau from CMIP5 models and comparison with gridded observations. Clim. Dyn. 2018, 51, 355–369. [Google Scholar] [CrossRef]
  67. Ahmed, K.; Sachindra, D.A.; Shahid, S.; Demirel, M.C.; Chung, E.S. Selection of multi-model ensemble of general circulation models for the simulation of precipitation and maximum and minimum temperature based on spatial assessment metrics. Hydrol. Earth Syst. Sci. 2019, 23, 4803–4824. [Google Scholar] [CrossRef]
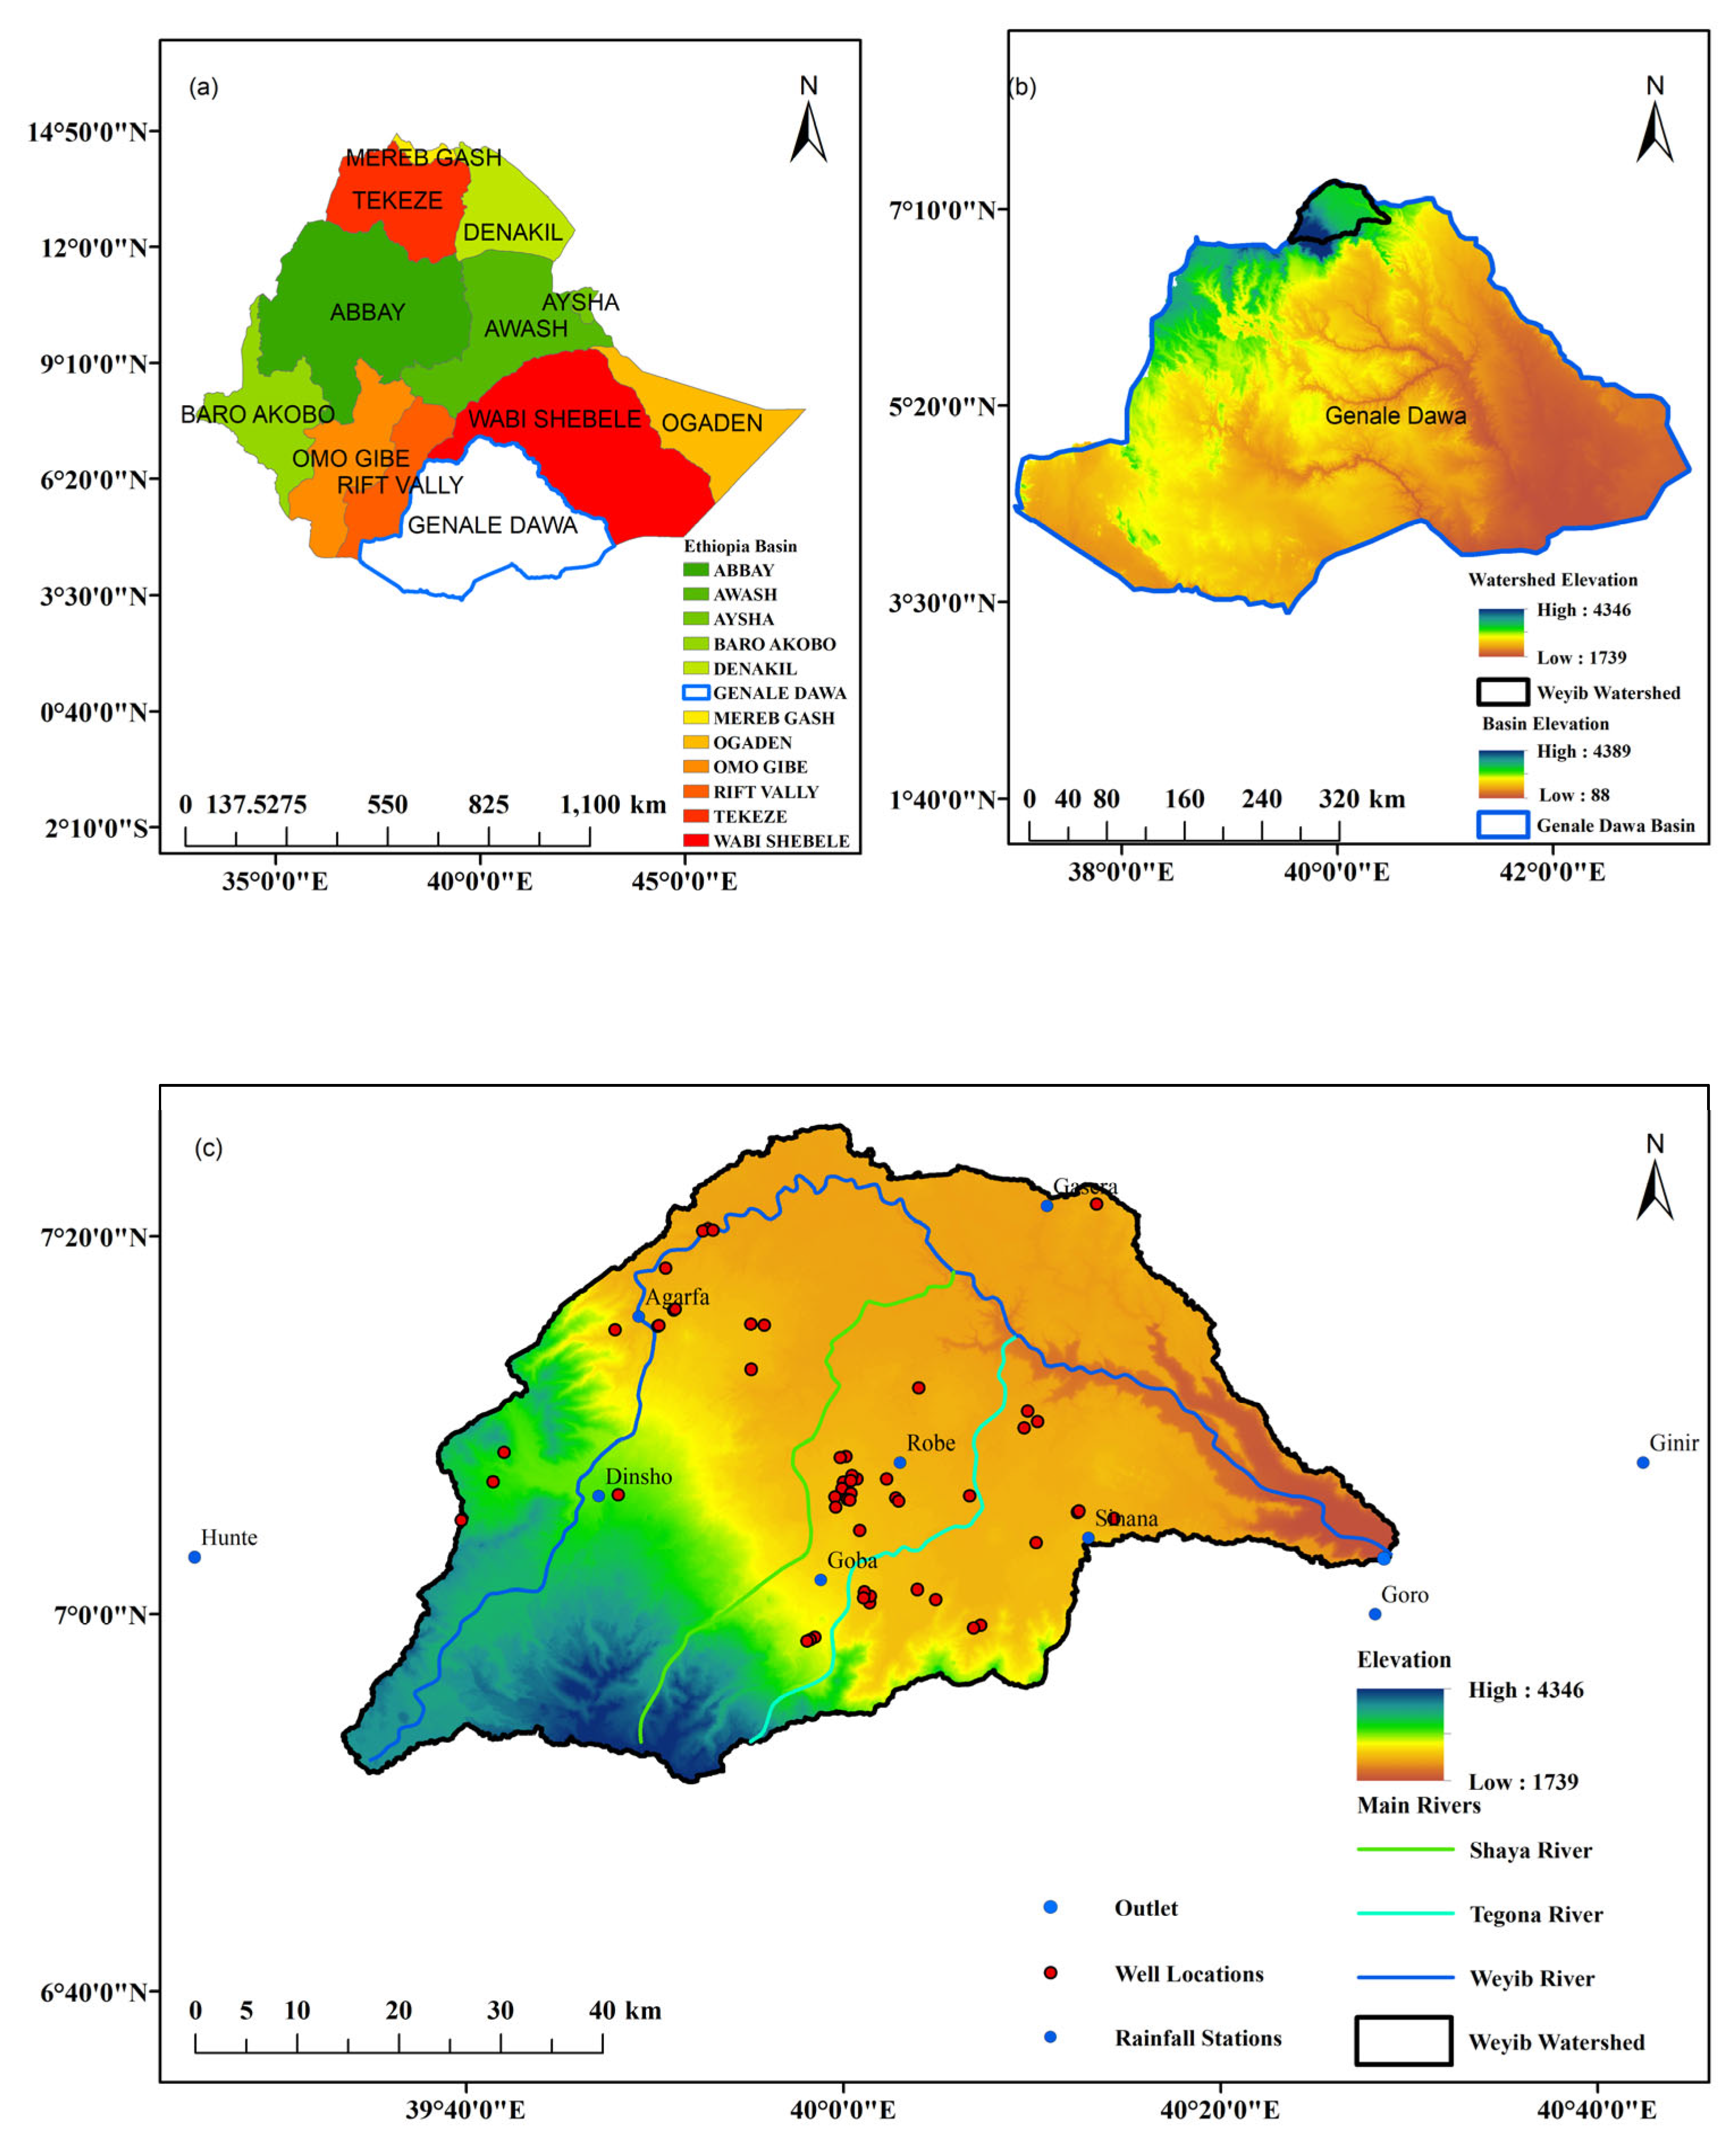
Figure 1. Location Map: (a) Ethiopian River Basin, (b) Genale-Dawa Basin, (c) Weyib watershed.
Earth 06 00118 g001
Figure 2. (a) Slope (%) and (b) Mean groundwater level (meters) maps.
Earth 06 00118 g002
Figure 3. Soil texture (a) and Land-use/land cover (b) maps.
Earth 06 00118 g003
Figure 4. Conceptual framework of this study: input data collected from primary and secondary sources; the process covers the future climate data was downloaded, downscaling by dynamic downscaling techniques, and linear scaling to correct climate change bias, data preparation in a format suitable for the spatiotemporal WetSpass-M, model verification and simulation of future climate change effects on groundwater recharge; analysis of output results for both historical and future climate change scenarios.
Earth 06 00118 g004
Figure 5. Mean monthly temperature for the watershed. Note: BaseL: Baseline period, MidT4.5: Mid-term for RCP4.5, LongT4.5: Long-term for RCP4.5, MidT8.5: Mid-term for RCP8.5, and LongT8.5: Long-term for RCP8.5.
Earth 06 00118 g005
Figure 6. Mean monthly rainfall for the watershed.
Earth 06 00118 g006
Figure 7. WetSpass-M model performance assessment.
Earth 06 00118 g007
Figure 8. Projected mean monthly GWR.
Earth 06 00118 g008
Figure 9. Percentage change of mean monthly GWR.
Earth 06 00118 g009
Figure 10. Projected seasonal mean GWR.
Earth 06 00118 g010
Figure 11. Projected seasonal change in mean GWR.
Earth 06 00118 g011
Figure 12. Spatial distribution of mean annual GWR: (a) Mid-4.5: Mid-term for RCP4.5, (b) Long-4.5: Long-term for RCP4.5, (c) Mid-8.5: Mid-term for RCP8.5, (d) Long-8.5: Long-term for RCP8.5, and (e) BaseL: Baseline Period groundwater recharge.
Earth 06 00118 g012
Table 1. Data collected for this study.
NoData TypeResolutionSources
1Historical climate data 1986 to 2015National Meteorology Agency, Ethiopia
https://www.ethiomet.gov.et/ (accessed on 20 August 2020)
2Stream flow1986 to 2015Ministry of Water and Energy, Ethiopia
https://www.mowe.gov.et (accessed on 20 August 2020)
3LULC30 × 30 mLandsat 8 OLI/TIRS
https://earthexplorer.usgs.gov/ (accessed on 20 August 2020)
4Groundwater levels53 wellsField measurement
5Soil texture30 × 30 mEthiopian Ministry of Agriculture (https://www.moa.gov.et) (accessed on 20 August 2020) and FAO (https://www.fao.org) (accessed on 20 August 2020)
6DEM30 × 30 mUSGS Earth Explorer
https://earthexplorer.usgs.gov/ (accessed on 20 August 2020)
Table 2. The uncertainty analysis for mean monthly temperature and rainfall (mean ± standard deviations).
ScenariosTemperature (°C) Rainfall (mm)
Baseline Period14.05 ± 0.7483.57 ± 46.75
MidT4.514.95 ± 0.8489.77 ± 52.78
LongT4.515.70 ± 0.7895.64 ± 62.52
MidT8.515.52 ± 0.8689.18 ± 52.46
LongT8.517.63 ± 0.82102.86 ± 65.54
Table 3. The uncertainty analysis for baseline and future periods for GWR.
ScenariosMean ± Standard Deviation
Baseline Period177.7 ± 105.5
MidT4.5181.9 ± 108.1
LongT4.5192.9 ± 109.7
MidT8.5180.0 ± 101.6
LongT8.5190.8 ± 113.6
Disclaimer/Publisher’s Note: The statements, opinions and data contained in all publications are solely those of the individual author(s) and contributor(s) and not of MDPI and/or the editor(s). MDPI and/or the editor(s) disclaim responsibility for any injury to people or property resulting from any ideas, methods, instructions or products referred to in the content.