Observational Evidence of Intensified Extreme Seasonal Climate Events in a Conurbation Area Within the Eastern Amazon
Abstract
1. Introduction
2. Materials and Methods
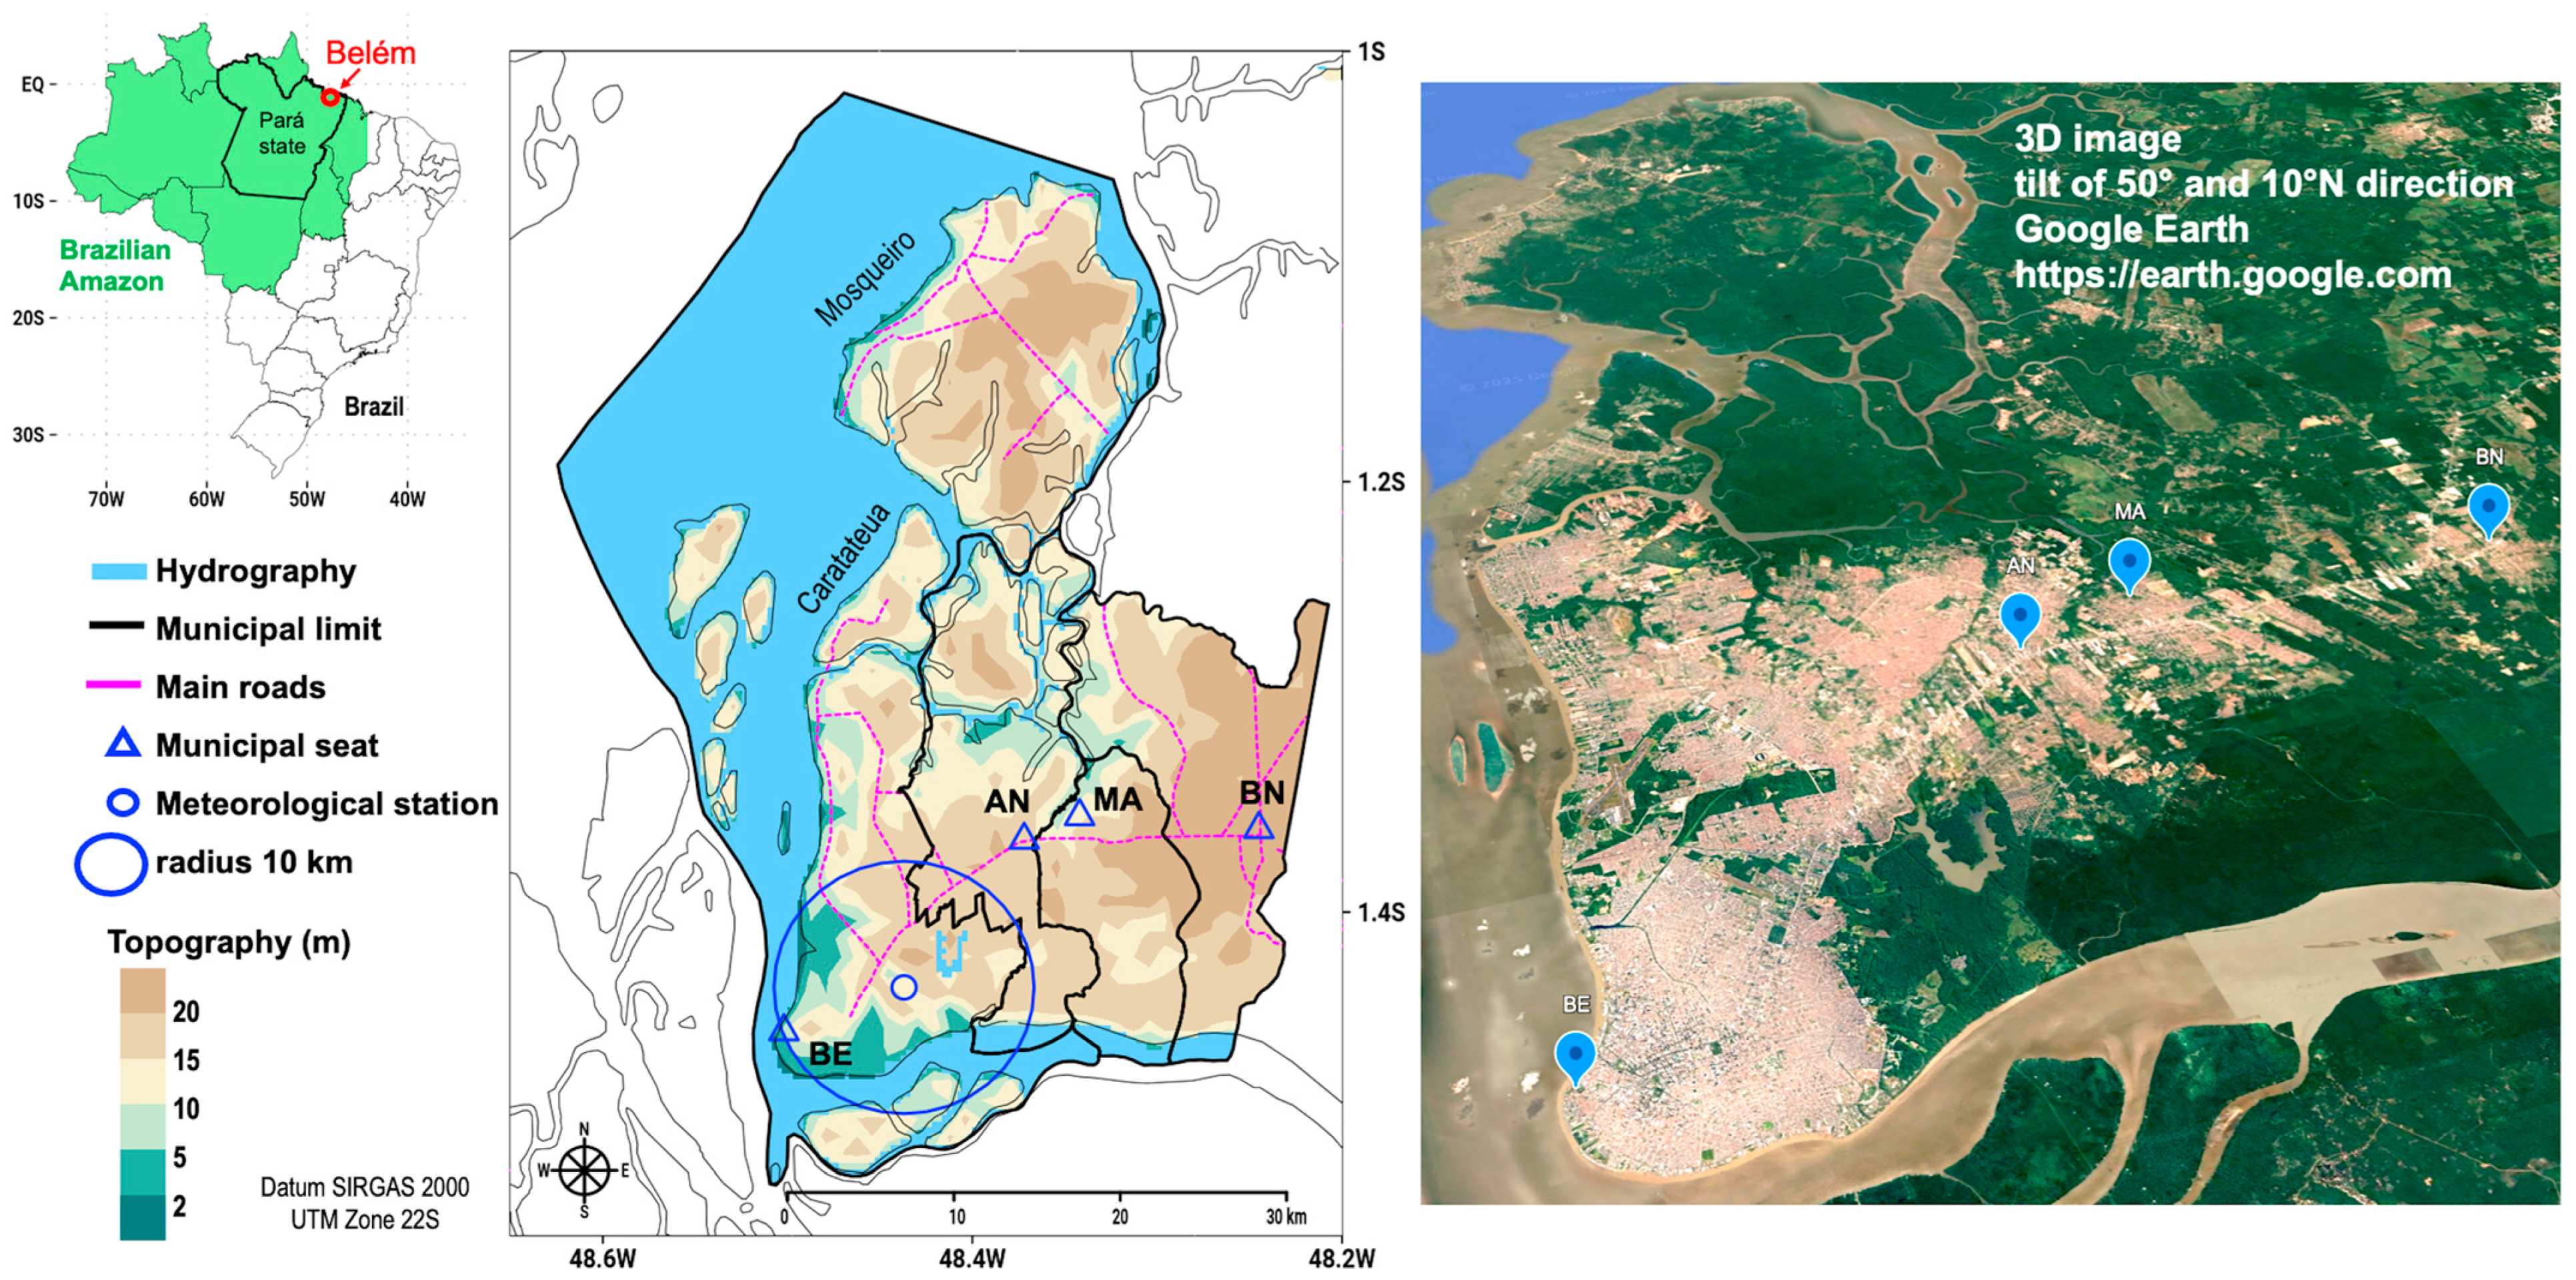
2.1. Study Area and Observational Data
2.2. Climatological Means and Definitions of Seasonal Regimes
2.3. Correlation and Principal Component Analysis
2.4. Mann–Kendall Test
2.5. Comparisons Between Past and Current Decades and Analysis of Extreme Events
3. Results
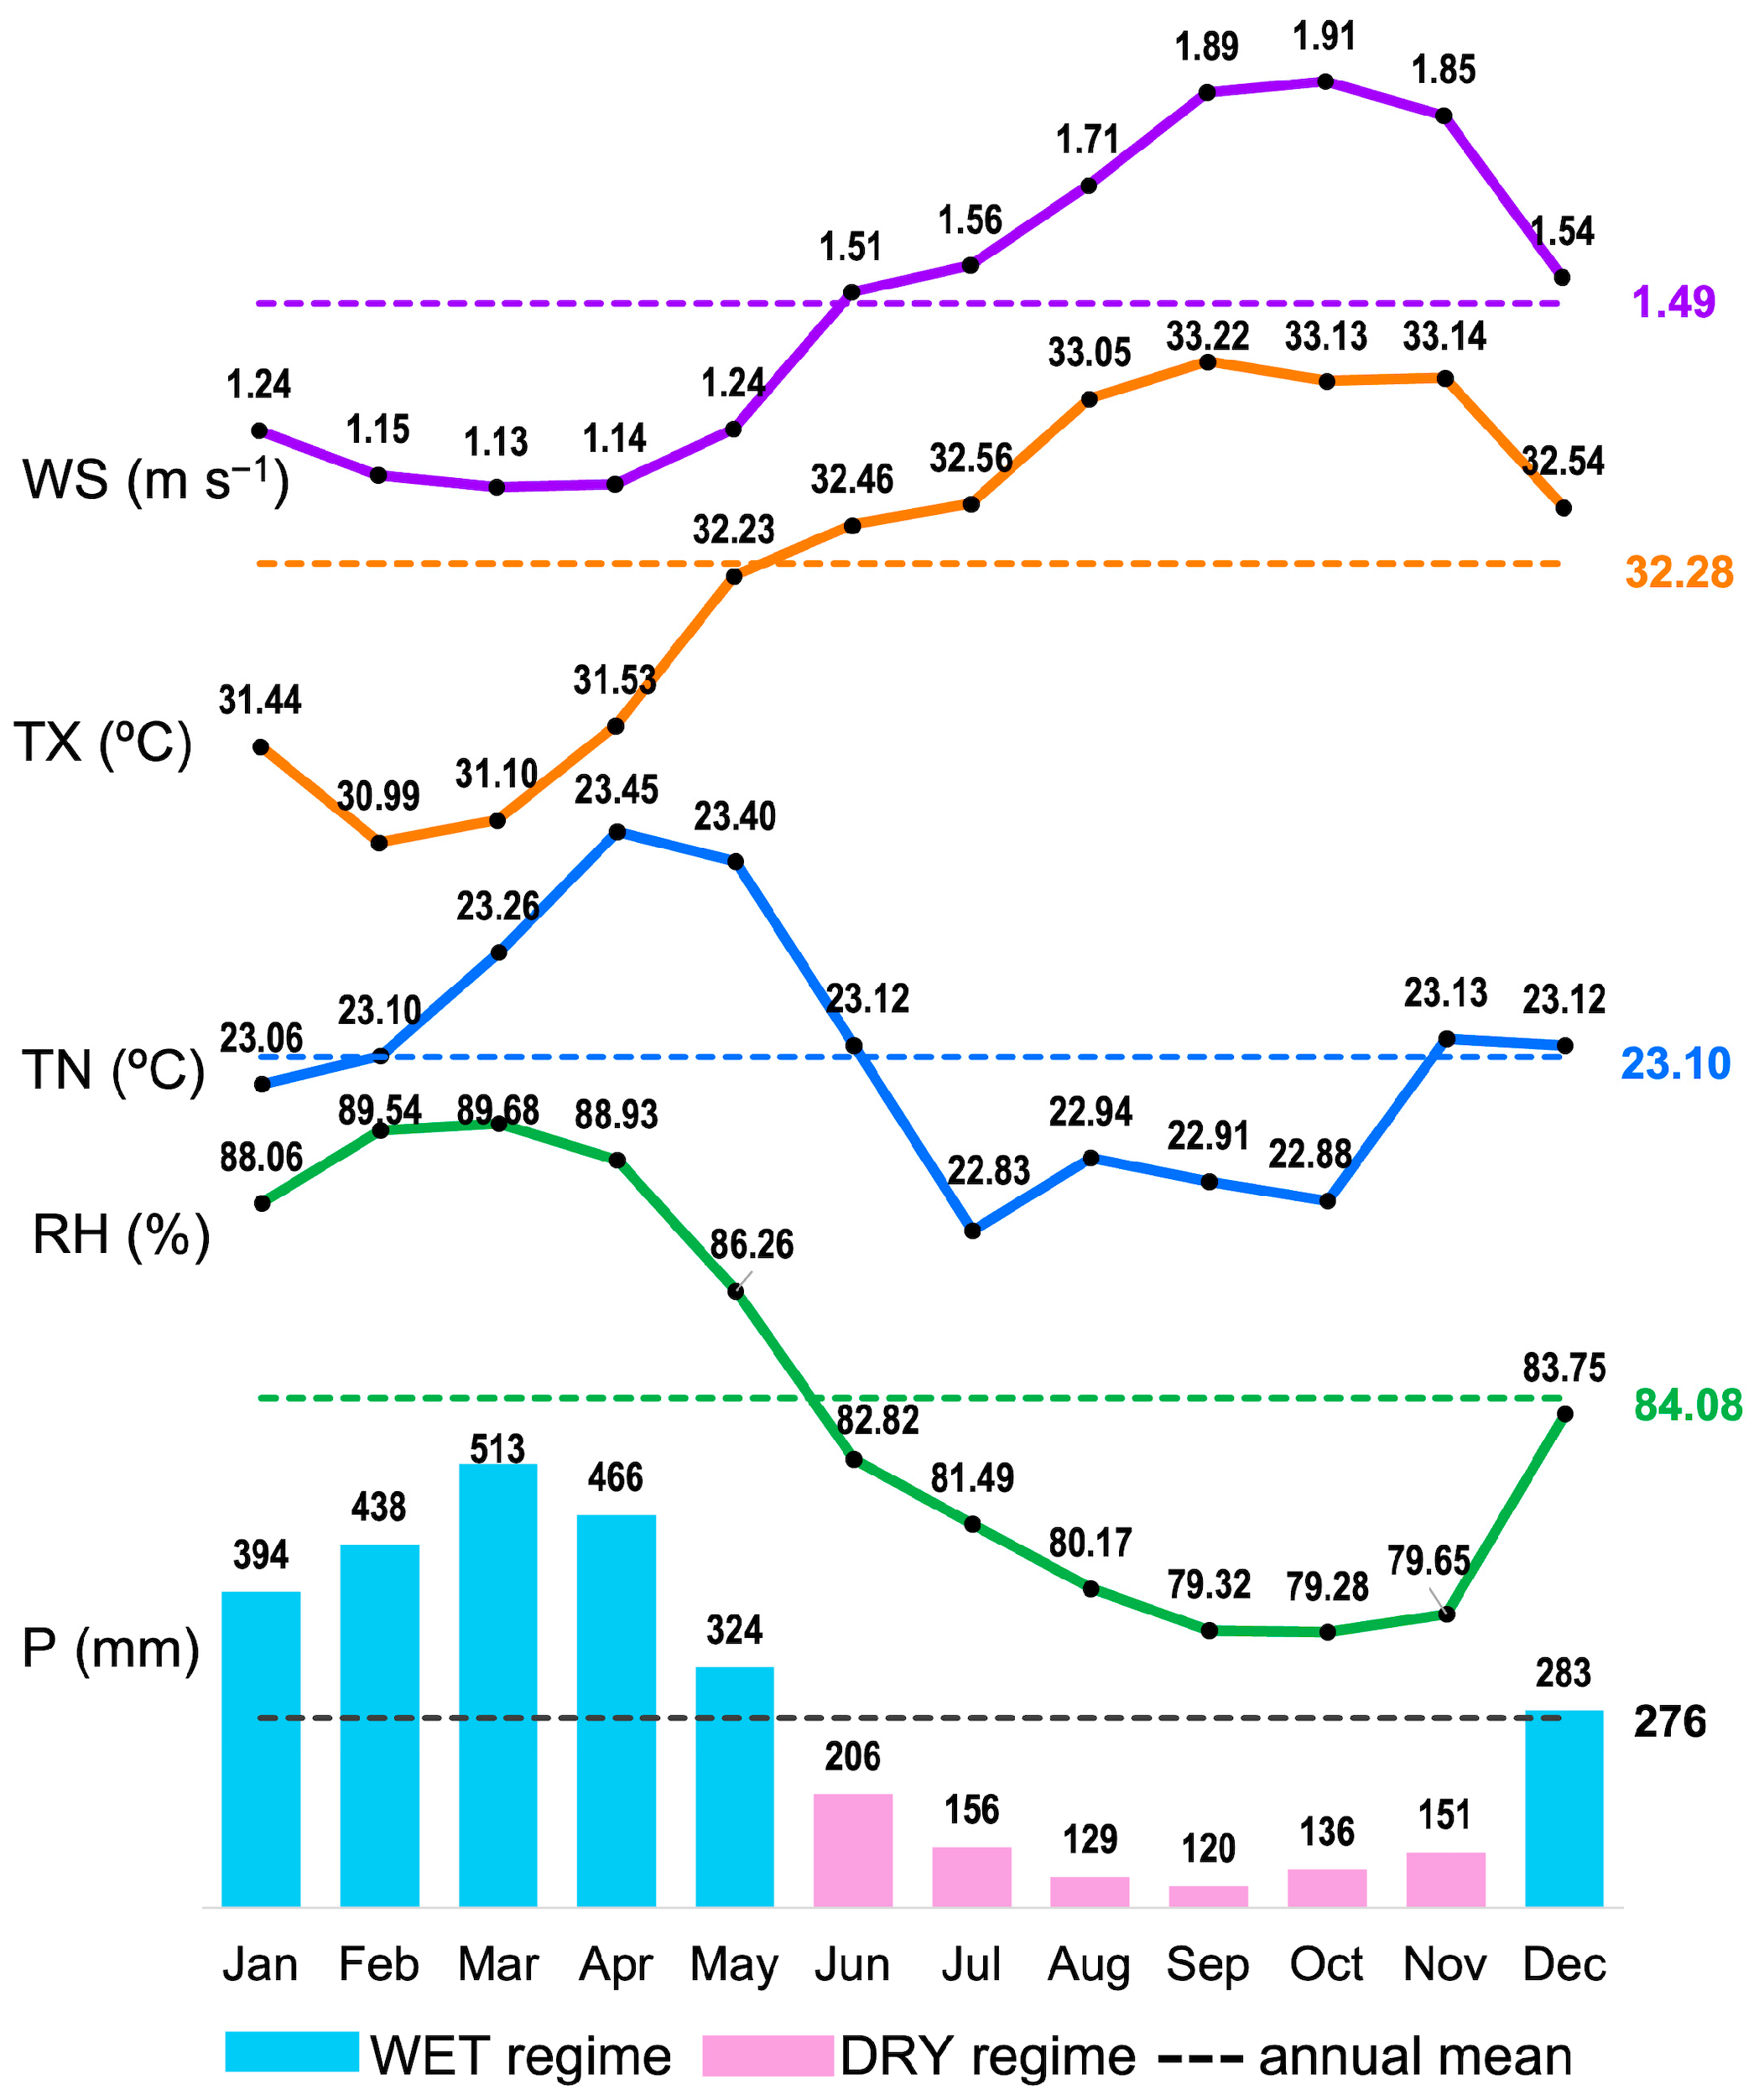
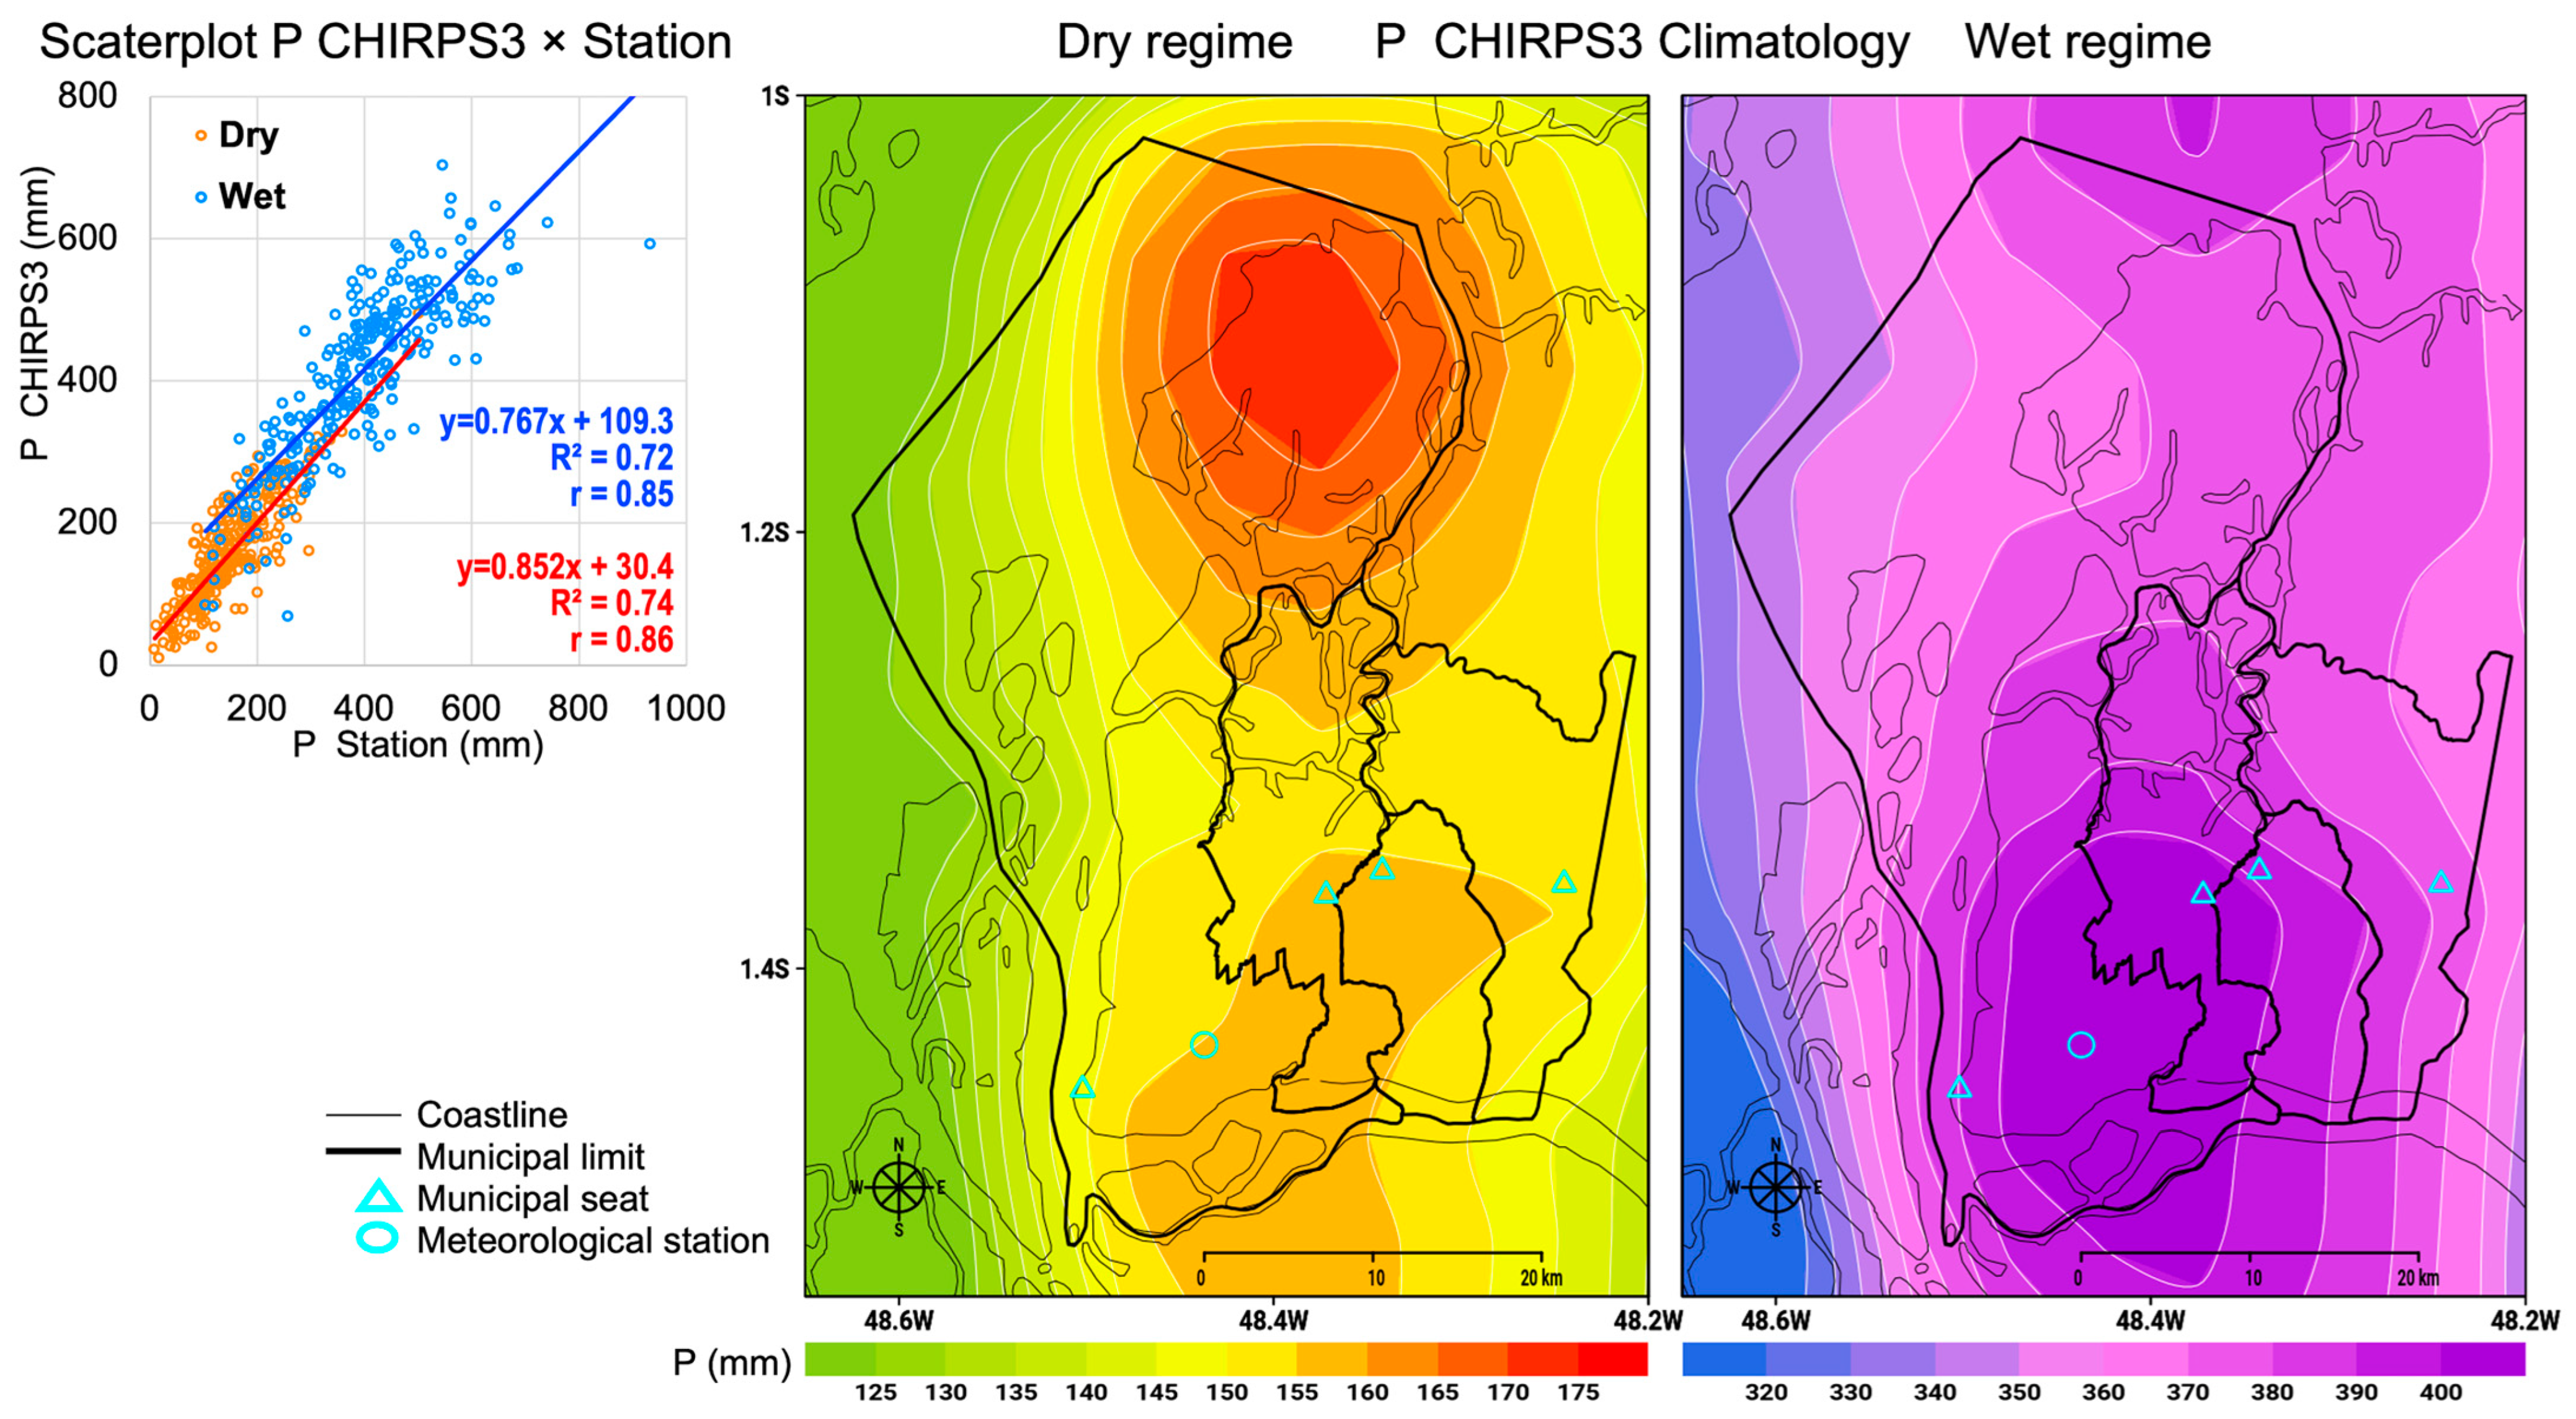
3.1. Annual Climatological Cycle, Seasonal Regimes, and Spatial Configuration of Precipitation
3.2. Environmental Changes Given by Satellite Mapping of LULC
3.3. Long-Term Trends
3.4. Correlations and PCA Analyses
3.5. Differences Between Past and Present Decades
3.6. Changes in Extreme Events: Point Analysis in Belém and Spatial Distribution of P CHIRPS3
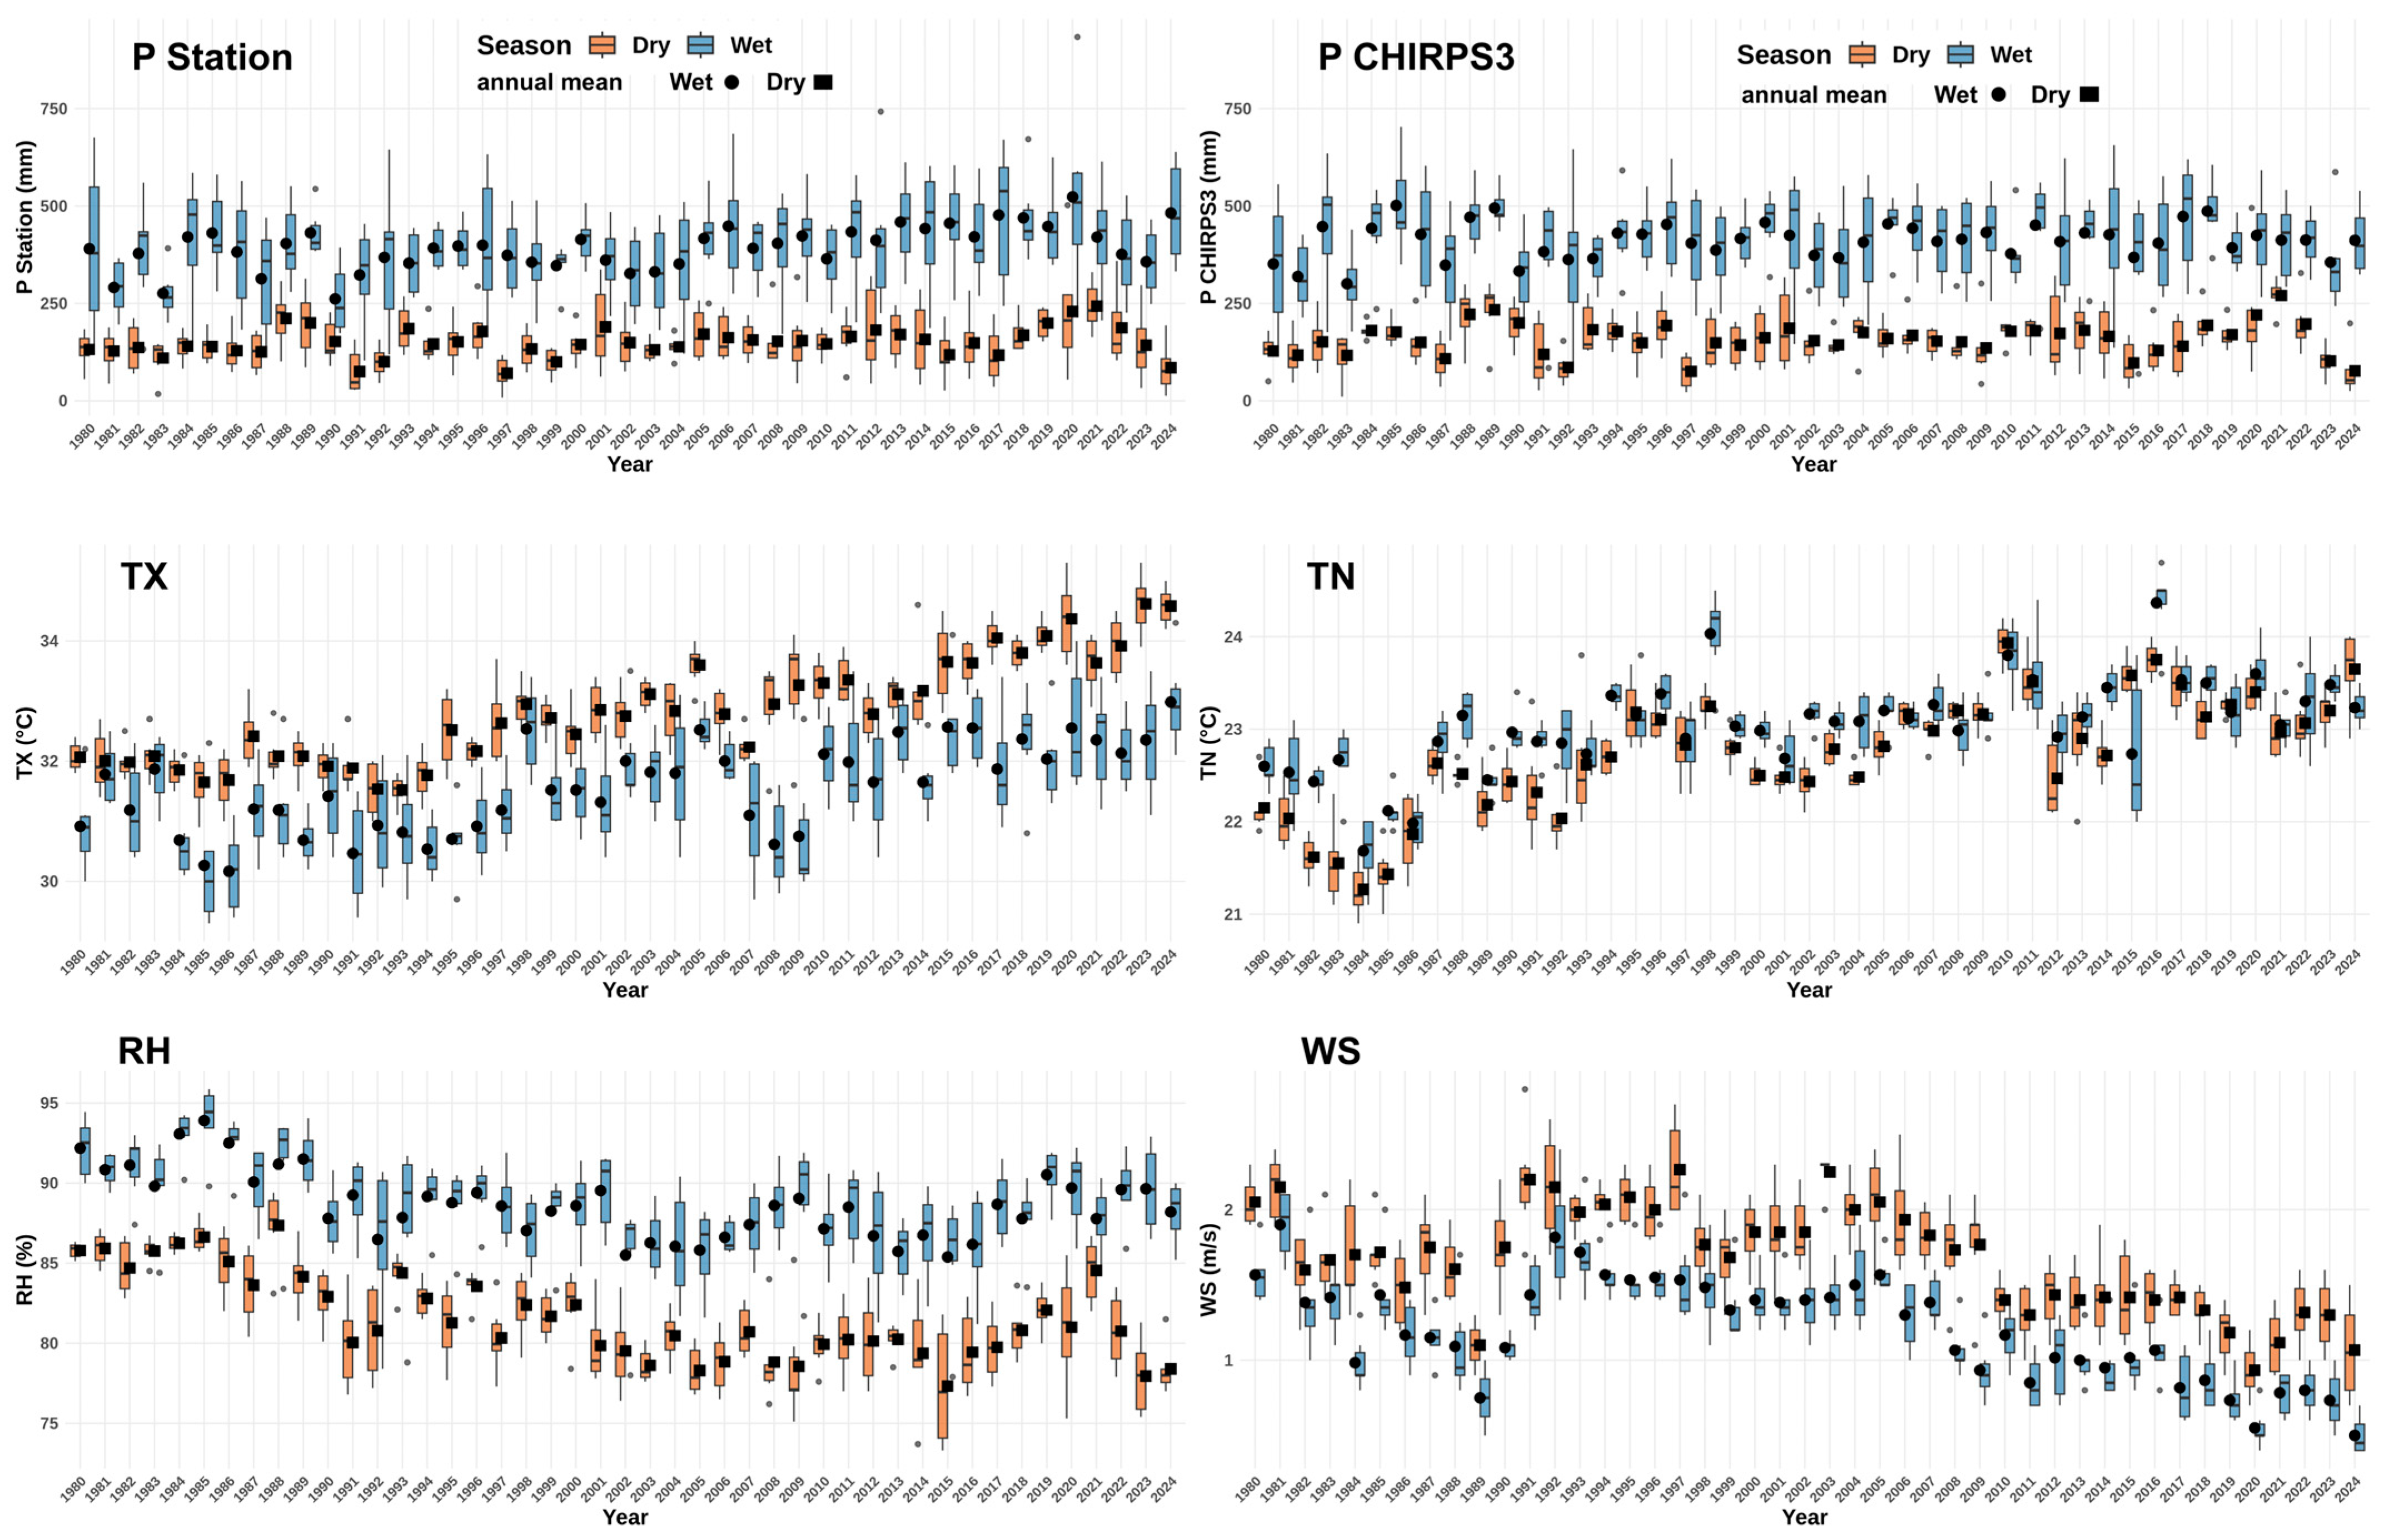
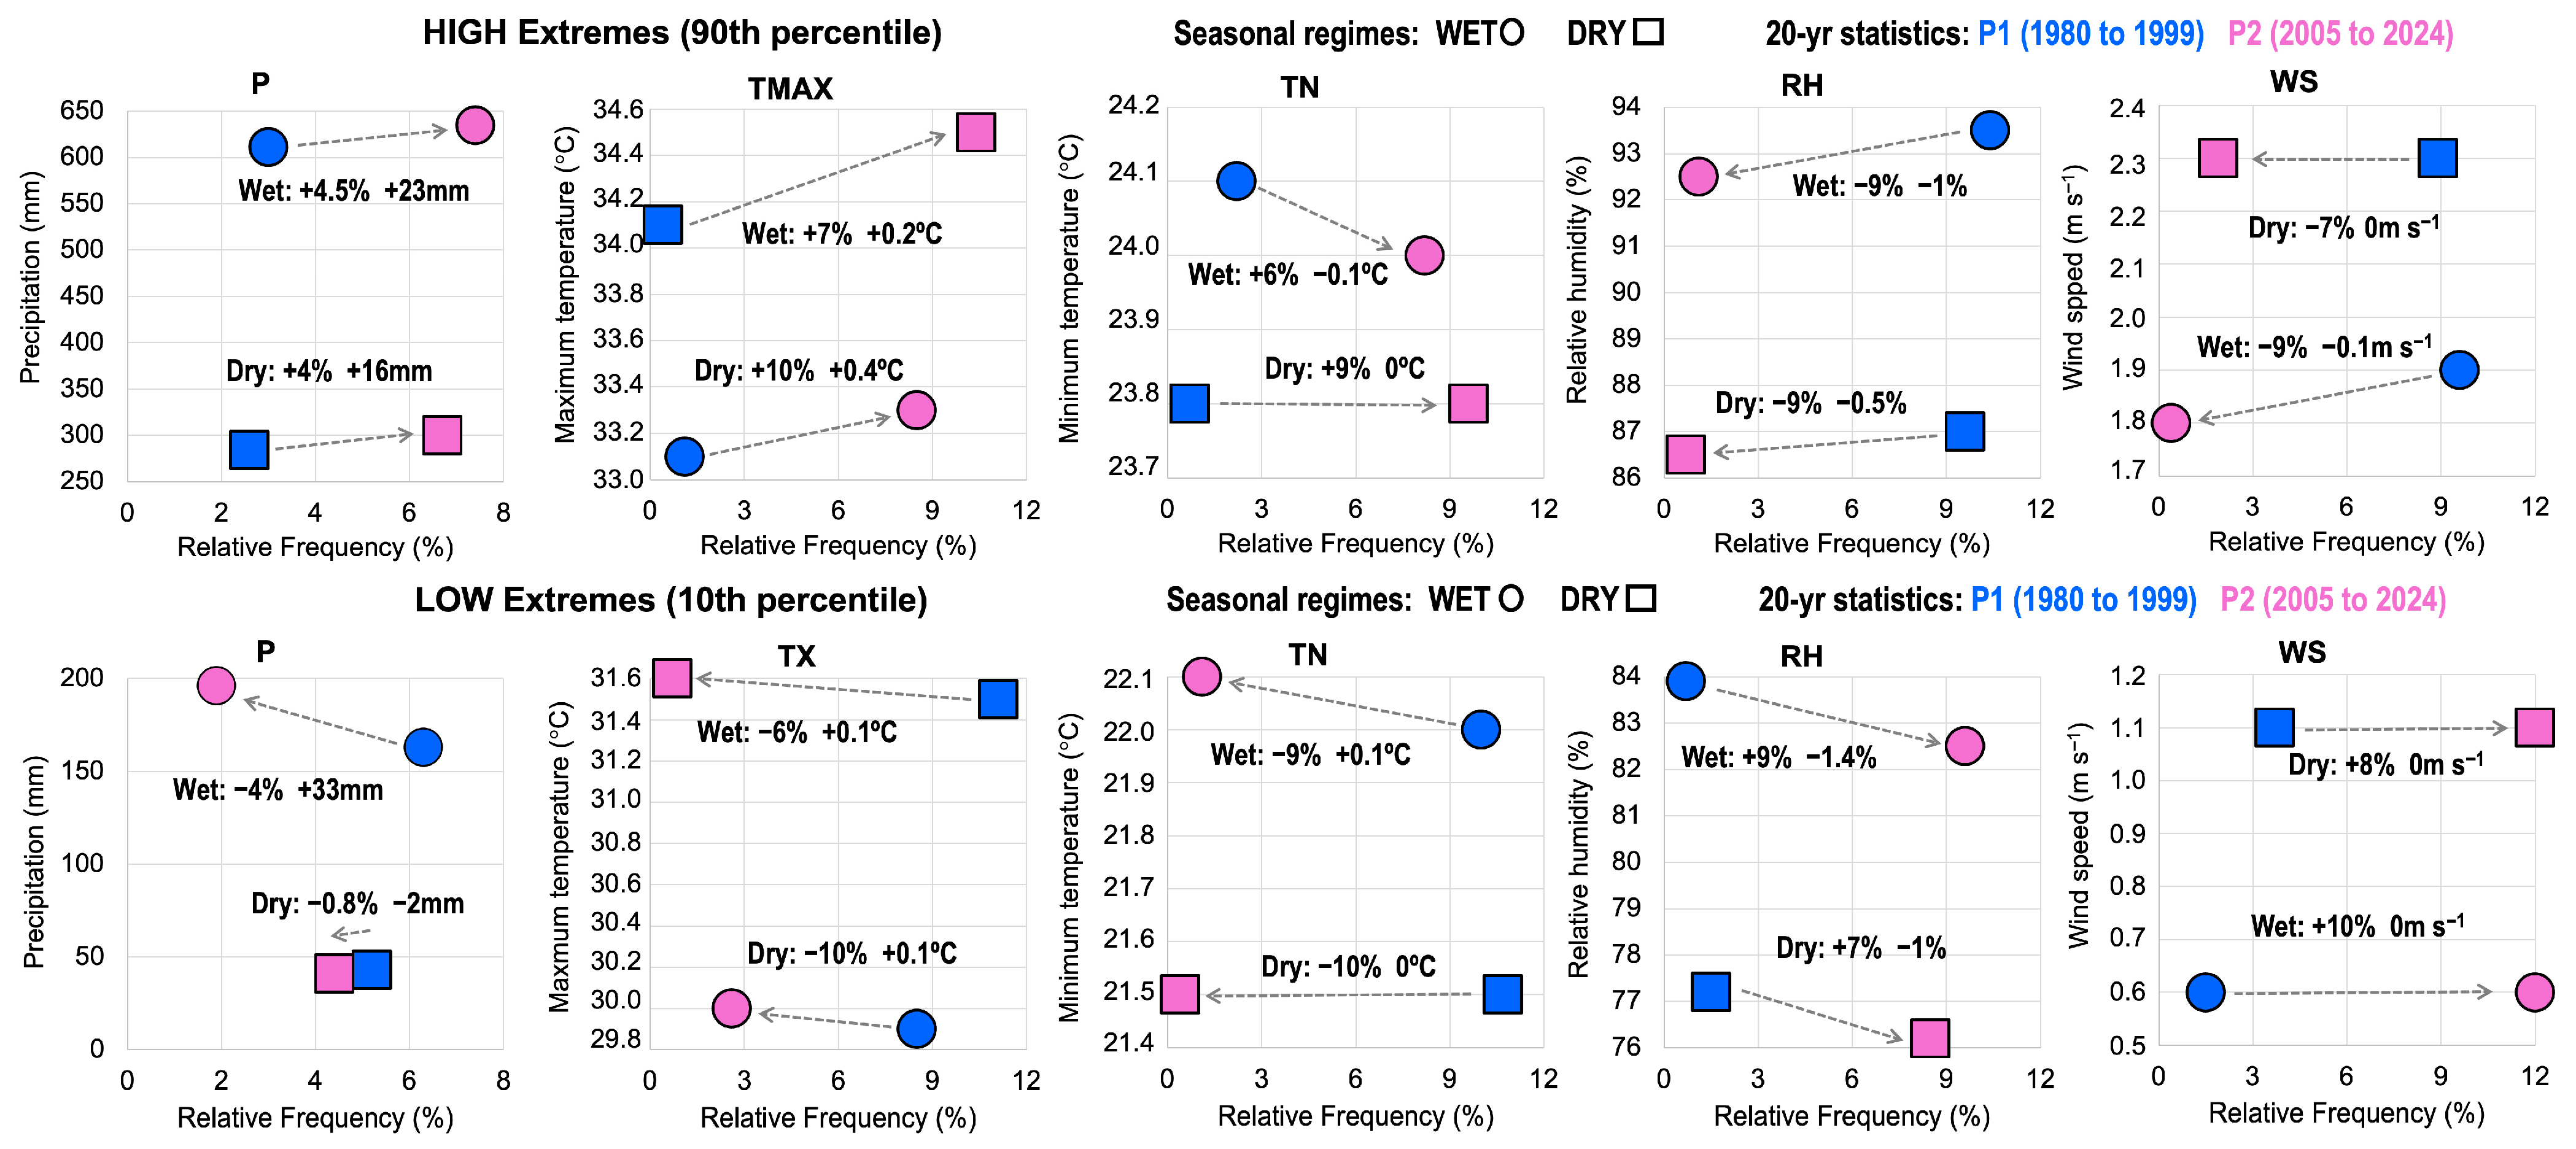
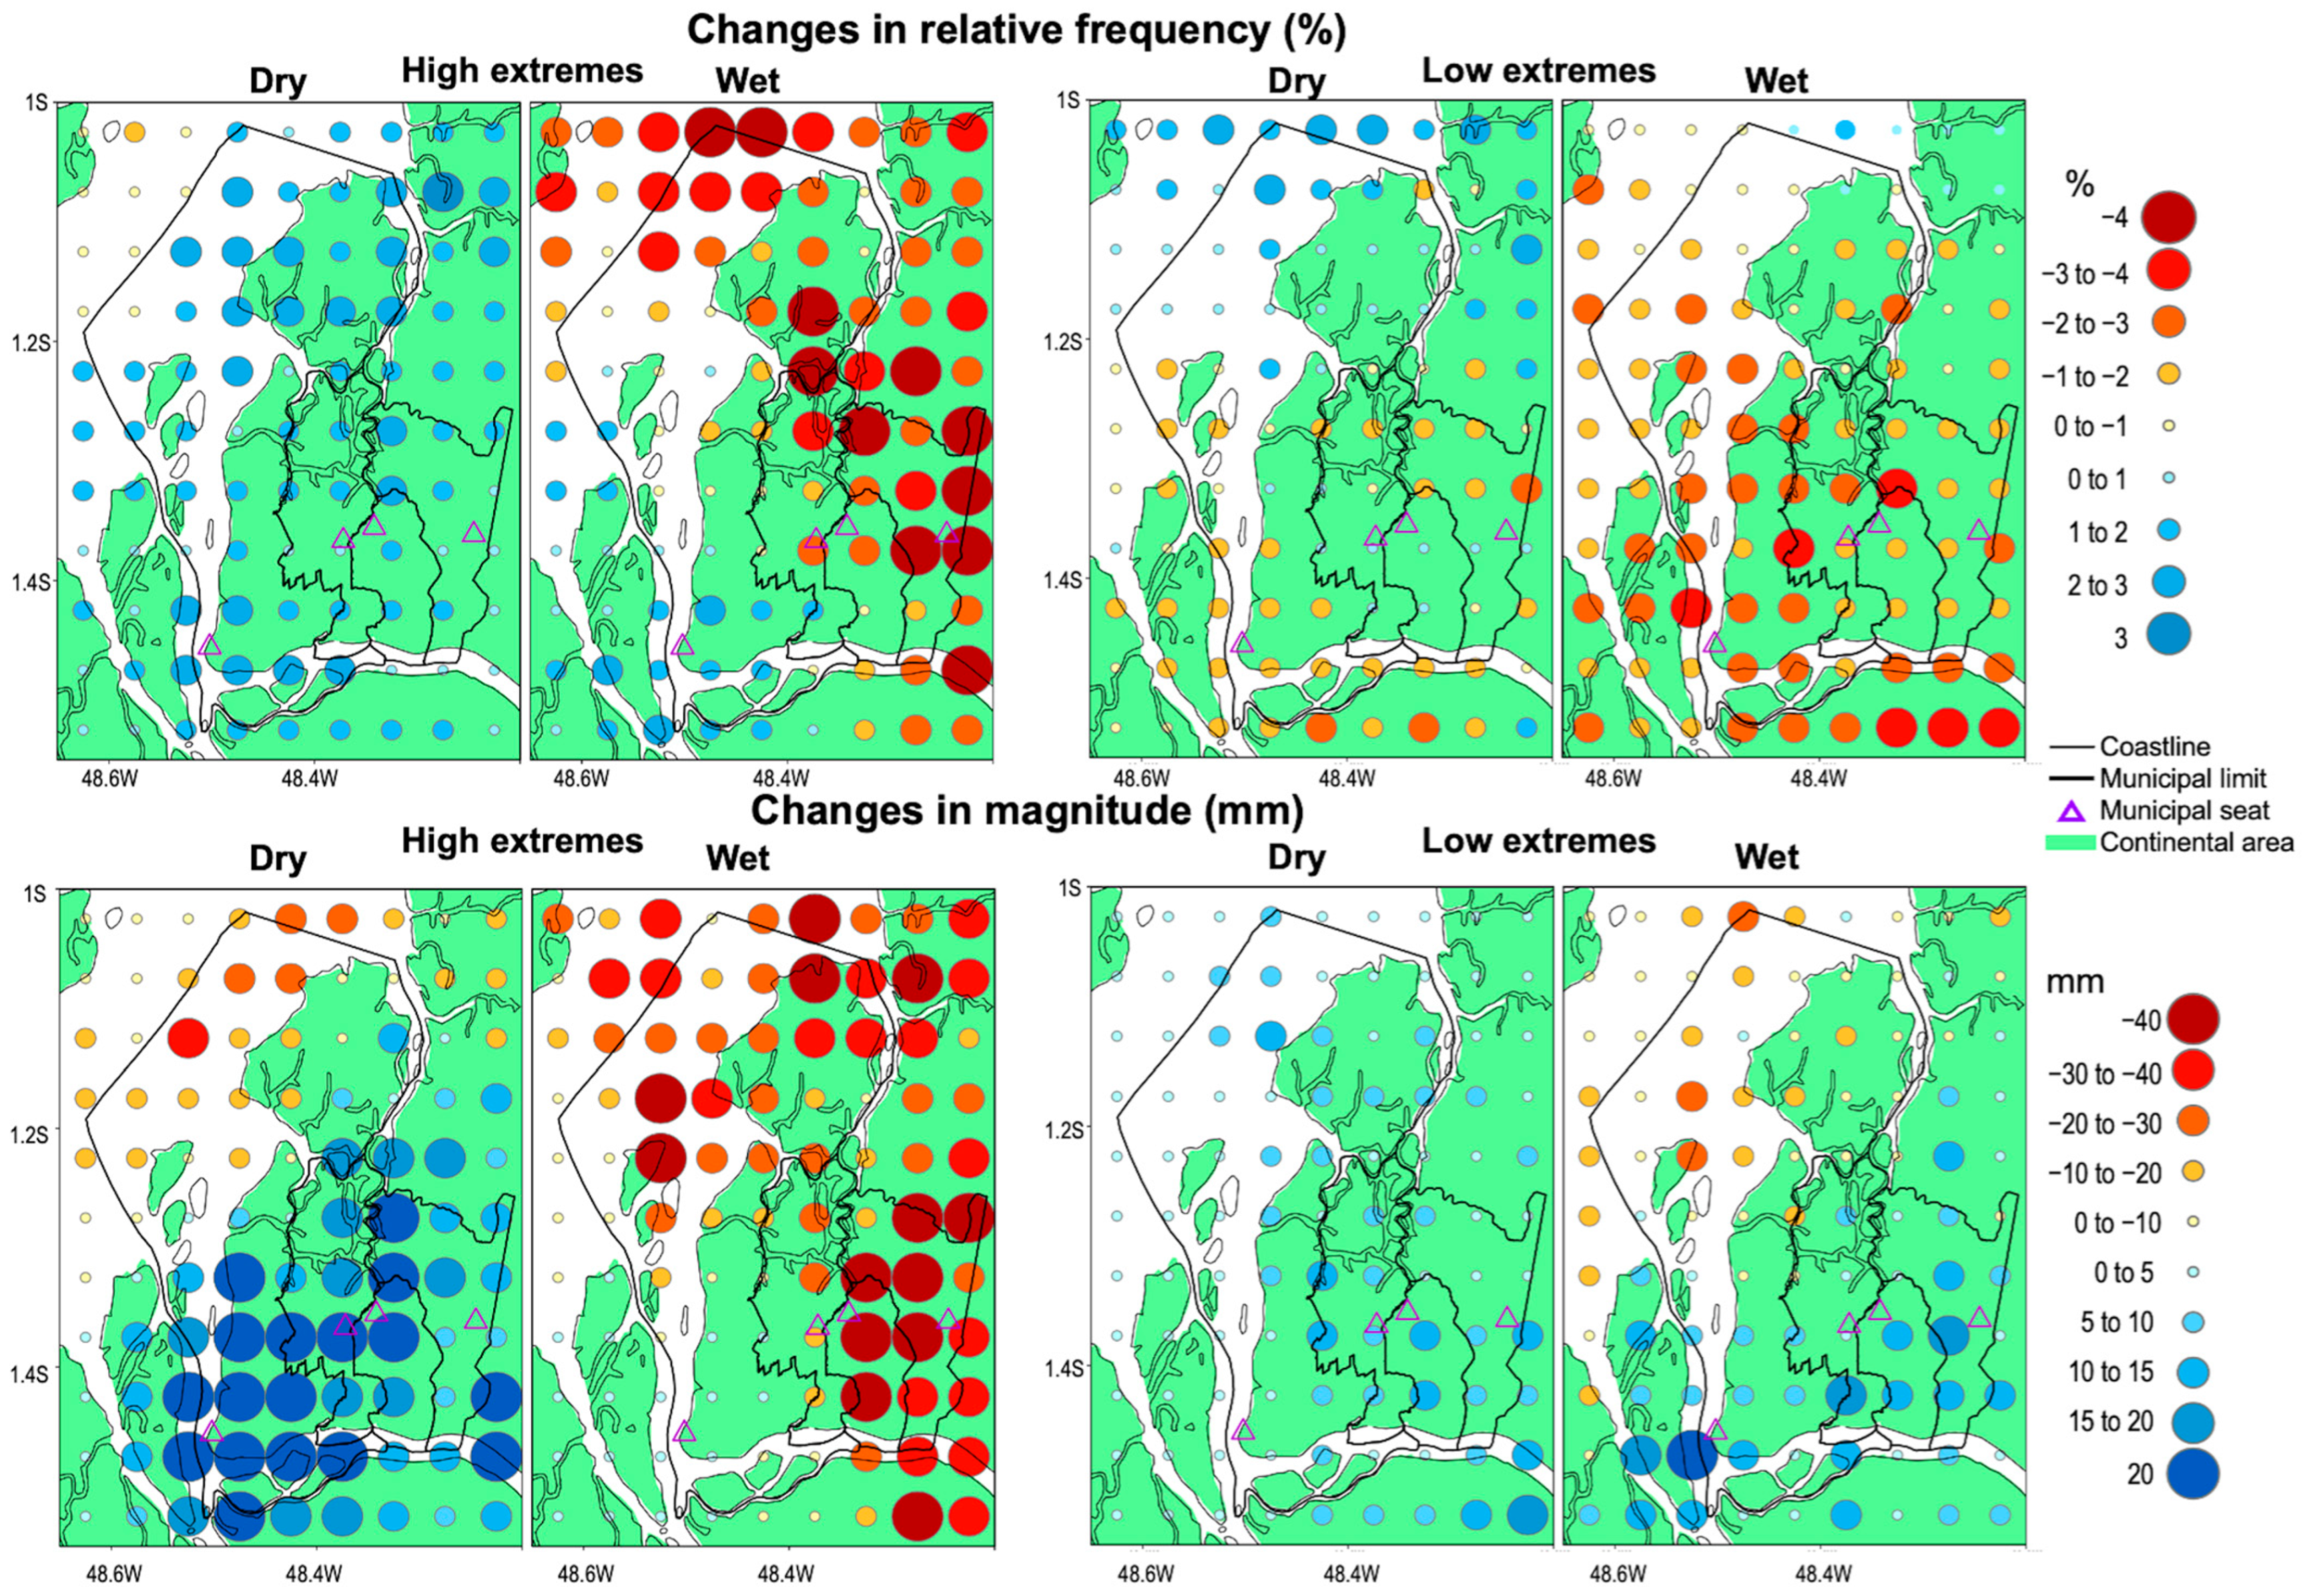
- For the P variable, the relative frequency for High extremes increased by 4.5% in the Wet season and 4% in the Dry season, with respective magnitude increases of 23 mm and 16 mm. Low extremes declined in frequency in the Wet season (−4%) but intensified by 33 mm; the Dry season showed a slight frequency rise (0.8%), while magnitude decreased by −2 mm.
- TX High extremes surged in frequency and magnitude during both regimes (+7% and +0.2 °C in Wet; +10% and +0.4 °C in Dry). Low extremes dropped sharply in frequency, with −6% in Wet and −10% in Dry, accompanied by weaker intensification in magnitude of about +0.1 °C in both regimes.
- For the High extremes, TN amplified the frequency by about +6% in the Wet (with a retraction in the magnitude of −0.1 °C) and +9% in the Dry (without changes in magnitude). The relative frequency of TN in the Low extreme reduced strongly by −10% in the Dry regime and by −9% in the Wet regime, with a magnitude increase of 0.1 °C in the Wet regime and no change in the Dry regime.
- RH High extremes decreased by −0.5 to −1% in intensity and −9% in relative frequency in both seasons. Low extremes increased in frequency by +9% in the Wet regime and +7% in the Dry regime, with a −1.4% drop in intensity in the Wet regime and −1% in the Dry regime.
- WS High extremes decreased in relative frequency (−7% in Wet, −9% in Dry) and magnitude (−0.1 m s−1 in Wet). For the Low extremes, frequency increased (8% in Wet, 10% in Dry) with stable magnitudes.
4. Discussion
5. Conclusions
Author Contributions
Funding
Data Availability Statement
Acknowledgments
Conflicts of Interest
Appendix A
References
- Alkama, R.; Cescatti, A. Biophysical climate impacts of recent changes in global forest cover. Science 2016, 351, 600–604. [Google Scholar] [CrossRef]
- Davidson, E.; de Araújo, A.; Artaxo, P.; Balch, J.K.; Brown, I.F.; Bustamante, M.M.C.; Coe, M.T.; DeFries, R.S.; Keller, M.; Longo, M.; et al. The Amazon basin in transition. Nature 2012, 481, 321–328. [Google Scholar] [CrossRef]
- Marengo, J.A.; Souza, C.M., Jr.; Thonicke, K.; Burton, C.; Halladay, K.; Betts, R.A.; Alves, L.M.; Soares, W.R. Changes in climate and land use over the Amazon region: Current and future variability and trends. Front. Earth Sci. 2018, 6, 228. [Google Scholar] [CrossRef]
- Artaxo, P. Amazon deforestation implications in local/regional climate change. Proc. Natl. Acad. Sci. USA 2023, 120, e2317456120. [Google Scholar] [CrossRef]
- Marengo, J.A.; Espinoza, J.C.; Fu, R.; Muñoz, J.C.J.; Alves, L.M.; DA Rocha, H.R.; Schöngart, J. Long-term variability, extremes and changes in temperature and hydrometeorology in the Amazon region: A review. Acta Amaz. 2024, 54, e54es22098. [Google Scholar] [CrossRef]
- Dutra, V.A.B.; Tavares, P.A.; de Lima, A.M.M.; Ribeiro, H.M.C. Anthropogenic environmental pressures in urban conservation units: A case study in Belém, Brazilian eastern Amazon. Int. J. Hydro. 2022, 6, 131–139. [Google Scholar] [CrossRef]
- Science Panel for the Amazon. Amazon Assessment Report 2021; Nobre, C., Encalada, A., Anderson, E., Roca Alcazar, F.H., Bustamante, M., Mena, C., Peña-Claros, M., Poveda, G., Rodrigues, J.P., Saleska, E., et al., Eds.; United Nations Sustainable Development Solutions Network: New York, NY, USA, 2021; Available online: https://www.theamazonwewant.org/spa-reports (accessed on 29 April 2024).
- de Souza, D.O.; Alvalá, R.C.S. Observational evidence of the urban heat island of Manaus City. Brazil. Met. Apps 2014, 21, 186–193. [Google Scholar] [CrossRef]
- Correa, P.B.; Candido, L.A.; Souza, R.A.F.; De Souza, R.A.F.; Andreoli, R.V.; Kayano, M.T. Estudo do fenômeno da ilha de calor na cidade de Manaus/AM: Um estudo a partir de dados de sensoriamento remoto, modelagem e estações meteorológicas. Rev. Bras. Meteorol. 2016, 31, 167–176. [Google Scholar] [CrossRef]
- Dias, T.S.S.; Souza, E.B.; Franco, V.S.; Pinto, Á.J.d.A.; Thales, M.C.; Mendoza, R.R.; Amaral, C.T.; Gonçalves, J.B.; Lima, I.F.; Pfeiff, G.K.; et al. Urban Environment and the Air Temperature Trend: The Case of the Metropolis of Brazilian Amazon. Rev. Bras. De Geogr. Física 2021, 14, 159–171. [Google Scholar] [CrossRef]
- Furtado, L.S.; Pereira, R.V.S.; de Souza, E.B. Hemeroby Mapping of the Belém Landscape in Eastern Amazon and Impact Study of Urbanization on the Local Climate. Urban Sci. 2024, 8, 15. [Google Scholar] [CrossRef]
- dos Santos, M.J.; Silva Dias, M.A.F.; Freitas, E.D. Influence of local circulations on wind, moisture, and precipitation close to Manaus City, Amazon Region, Brazil. J. Geophys. Res. Atmos. 2014, 119, 13233–13249. [Google Scholar] [CrossRef]
- Instituto Brasileiro de Geografia e Estatistica (IBGE). Estimativas de População Publicadas no DOU—2024. Available online: https://www.ibge.gov.br/estatisticas/sociais/populacao/9103-estimativas-de-populacao.html (accessed on 2 July 2025).
- Paca, V.H.M.; Espinoza-Dávalos, G.E.; Moreira, D.M.; Comair, G. Variability of trends in precipitation across the Amazon river basin determined from the CHIRPS precipitation product and from station records. Water 2020, 12, 1244. [Google Scholar] [CrossRef]
- Funk, C.; Peterson, P.; Landsfeld, M.; Pedreros, D.; Verdin, J.; Shukla, S.; Husak, G.; Rowland, J.; Harrison, L.; Hoell, A.; et al. The climate hazards infrared precipitation with stations—A new environmental record for monitoring extremes. Sci. Data 2015, 2, 150066. [Google Scholar] [CrossRef] [PubMed]
- Funatsu, B.M.; Le Roux, R.; Arvor, D.; Espinoza, J.C.; Claud, C.; Ronchail, J.; Michot, V.; Dubreuil, V. Assessing precipitation extremes (1981–2018) and deep convective activity (2002–2018) in the Amazon region with CHIRPS and AMSU data. Clim. Dyn. 2021, 57, 827–849. [Google Scholar] [CrossRef]
- Souza, C.M., Jr.; Shimbo, J.Z.; Rosa, M.R.; Parente, L.L.; Alencar, A.; Rudorff, B.F.; Hasenack, H.; Matsumoto, M.; Ferreira, L.G.; Souza-Filho, P.W.M.; et al. Reconstructing Three Decades of Land Use and Land Cover Changes in Brazilian Biomes with Landsat Archive and Earth Engine. Remote Sens. 2020, 12, 2735. [Google Scholar] [CrossRef]
- World Meteorological Organization (WMO). Guidelines on the Calculation of Climate Normals. WMO-No. 1203. 2017. Available online: https://library.wmo.int/idurl/4/55797 (accessed on 23 March 2023).
- Werth, D.; Avissar, R. The local and global effects of Amazon deforestation. J. Geophys. Res. Atmos. 2002, 107, LBA-55. [Google Scholar] [CrossRef]
- Jolliffe, I.T.; Cadima, J. Principal component analysis: A review and recent developments. Phil. Trans. R. Soc. A 2016, 374, 20150202. [Google Scholar] [CrossRef]
- Nobre, C.A.; Sampaio, G.; Borma, L.S.; Castilla-Rubio, J.C.; Silva, J.S.; Cardoso, M. Land-use and climate change risks in the Amazon and the need of a novel sustainable development paradigm. Proc. Natl. Acad. Sci. USA 2016, 113, 10759–10768. [Google Scholar] [CrossRef]
- Hirsch, R.M.; Slack, J.R.; Smith, R.A. Techniques of trend analysis for monthly water quality data. Water Resour. Res. 1982, 18, 107–121. [Google Scholar] [CrossRef]
- Sen, P.K. Estimates of the regression coefficient based on Kendall’s tau. J. Am. Stat. Assoc. 1968, 63, 1379–1389. [Google Scholar] [CrossRef]
- Trenberth, K.E.; Jones, P.D.; Ambenje, P.; Bojariu, R.; Easterling, D.; Tank, A.K.; Parker, D.; Rahimzadeh, F.; Renwick, J.A.; Rusticucci, M.; et al. Observations: Surface and Atmospheric Climate Change. In Climate Change 2007: The Physical Science Basis. Contribution of Working Group I to the Fourth Assessment Report of the Intergovernmental Panel on Climate Change; Solomon, S., Qin, D., Manning, M., Chen, Z., Marquis, M., Averyt, K.B., Tignor, M., Miller, H.L., Eds.; Cambridge University Press: Cambridge, UK; New York, NY, USA, 2007; Available online: https://www.ipcc.ch/site/assets/uploads/2018/02/ar4-wg1-chapter3-1.pdf (accessed on 10 December 2009).
- Zhang, X.; Alexander, L.; Hegerl, G.C.; Jones, P.; Tank, A.K.; Peterson, T.C.; Trewin, B.; Zwiers, F.W. Indices for monitoring changes in extremes based on daily temperature and precipitation data. WIREs Clim. Change 2011, 2, 851–870. [Google Scholar] [CrossRef]
- Alexander, L.V.; Zhang, X.; Peterson, T.C.; Caesar, J.; Gleason, B.; Tank, A.M.G.K.; Haylock, M.; Collins, D.; Trewin, B.; Rahimzadeh, F.; et al. Global observed changes in daily climate extremes of temperature and precipitation. J. Geophys. Res. 2006, 111, D05109. [Google Scholar] [CrossRef]
- de Souza, E.B.; Ferreira, D.B.S.; Guimarães, J.T.F.; Franco, V.D.S.; de Azevedo, F.T.M.; de Moraes, B.C.; de Oliveira Ponte de Souza, P.J. Padrões climatológicos e tendências da precipitação nos regimes chuvoso e seco da Amazônia oriental. Rev. Bras. Climatol. 2017, 21, 81–93. [Google Scholar] [CrossRef]
- Almeida, C.T.; Oliveira-Júnior, J.F.; Delgado, R.C.; Cubo, P.; Ramos, M.C. Spatiotemporal rainfall and temperature trends throughout the Brazilian Legal Amazon, 1973–2013. Int. J. Climatol. 2017, 37, 2013–2026. [Google Scholar] [CrossRef]
- Terassi, P.M.B.; Galvani, E.; Gobo, J.P.A.; Oscar-Júnior, A.C.d.S.; Luiz-Silva, W.; Sobral, B.S.; de Gois, G.; Biffi, V.H.R. Exploring climate extremes in Brazil’s Legal Amazon. Stoch. Environ. Res. Risk Assess. 2024, 38, 1403–1422. [Google Scholar] [CrossRef]
- Da Silva, P.E.; Santos e Silva, C.M.; Spyrides, M.H.C.; Andrade, L.M.B. Precipitation and air temperature extremes in the Amazon and northeast Brazil. Int. J. Climatol. 2019, 39, 579–595. [Google Scholar] [CrossRef]
- IPCC. Summary for Policymakers. In Climate Change 2023: Synthesis Report. Contribution of Working Groups I, II and III to the Sixth Assessment Report of the Intergovernmental Panel on Climate Change; Core Writing Team, Lee, H., Romero, J., Eds.; IPCC: Geneva, Switzerland, 2023; pp. 1–34. [Google Scholar] [CrossRef]
- Cavalcante, R.B.L.; Ferreira, D.B.S.; Pontes, P.R.M.; Tedeschi, R.G.; da Costa, C.P.W.; de Souza, E.B. Evaluation of extreme rainfall indices from CHIRPS precipitation estimates over the Brazilian Amazonia. Atmos. Res. 2020, 238, 104879. [Google Scholar] [CrossRef]
- Butt, E.W.; Baker, J.C.A.; Bezerra, F.G.S.; von Randow, C.; Aguiar, A.P.D.; Spracklen, D.V. Amazon deforestation causes strong regional warming. Proc. Natl. Acad. Sci. USA 2023, 120, e2309123120. [Google Scholar] [CrossRef] [PubMed]
- De Lima, A.C.B.; Almeida, O.; Pinedo-Vasquez, M.; Lee, T.M.; Rivero, S.; Schramski, S.; Mansur, A.V. Climate hazards in small and medium cities in the Amazon Delta and Estuary: Challenges for resilience. Environ. Urban. 2019, 32, 195–212. [Google Scholar] [CrossRef]
- Spracklen, D.V.; Baker, J.C.A.; Garcia-Carreras, L.; Marsham, J.H. The Effects of Tropical Vegetation On Rainfall. Annu. Rev. Environ. Resour. 2018, 43, 193–218. [Google Scholar] [CrossRef]
- Caccamo, M.T.; Castorina, G.; Colombo, F.; Insinga, V.; Maiorana, E.; Magazù, S. Weather forecast performances for complex orographic areas: Impact of different grid resolutions and of geographic data on heavy rainfall event simulations in Sicily. Atmos. Res. 2017, 198, 22–33. [Google Scholar] [CrossRef]
- Castorina, G.; Caccamo, M.T.; Colombo, F.; Magazù, S. The Role of Physical Parameterizations on the Numerical Weather Prediction: Impact of Different Cumulus Schemes on Weather Forecasting on Complex Orographic Areas. Atmosphere 2021, 12, 616. [Google Scholar] [CrossRef]
- de Oliveira, J.V.; Cohen, J.; Barlage, M.; Silva Dias, M.A. The Influence of Urbanization on the Development of a Convective Storm—A Study for the Belém Metropolitan Region, Brazil. Atmosphere 2022, 13, 1026. [Google Scholar] [CrossRef]
- Lovejoy, T.E.; Nobre, C. Amazon Tipping Point. Sci. Adv. 2018, 4, eaat2340. [Google Scholar] [CrossRef]

| Regime | Variable | Min | Q1 | Mean | Median | Q3 | Max | Coef. Var. | P10 | P90 |
|---|---|---|---|---|---|---|---|---|---|---|
| Wet | P Station (mm) | 103.3 | 299.1 | 392.6 | 393.2 | 464.7 | 934.0 | 33.3 | 222.3 | 564.4 |
| P CHIRPS3 (mm) | 60.0 | 305.0 | 400.9 | 407.5 | 496.0 | 703.5 | 34.8 | 239.9 | 552.1 | |
| TX (°C) | 29.30 | 30.80 | 31.56 | 31.60 | 32.30 | 34.30 | 3.21 | 30.20 | 32.90 | |
| TN (°C) | 21.10 | 22.80 | 23.05 | 23.10 | 23.40 | 24.80 | 2.46 | 22.30 | 23.70 | |
| RH (%) | 77.90 | 86.53 | 88.68 | 89.10 | 90.80 | 95.86 | 3.58 | 84.60 | 92.23 | |
| WS (m s−1) | 0.40 | 0.90 | 1.20 | 1.20 | 1.50 | 2.40 | 32.58 | 0.70 | 1.70 | |
| Dry | P Station (mm) | 8.2 | 101.9 | 149.7 | 139.1 | 188.7 | 402.0 | 47.2 | 67.2 | 243.3 |
| P CHIRPS3 (mm) | 10.5 | 110.4 | 155.3 | 143.3 | 190.4 | 495.0 | 49.5 | 72.6 | 258.5 | |
| TX (°C) | 30.90 | 32.00 | 32.81 | 32.70 | 33.50 | 35.30 | 2.88 | 31.70 | 34.10 | |
| TN (°C) | 20.90 | 22.33 | 22.75 | 22.80 | 23.20 | 24.20 | 2.98 | 21.80 | 23.60 | |
| RH (%) | 73.30 | 79.10 | 81.63 | 81.55 | 84.08 | 89.40 | 4.02 | 77.30 | 86.10 | |
| WS (m s−1) | 0.70 | 1.38 | 1.67 | 1.70 | 2.00 | 2.80 | 24.79 | 1.19 | 2.20 |
| Regime | Variable | Tau | Trend | CI Lower | CI Upper | p-Value |
|---|---|---|---|---|---|---|
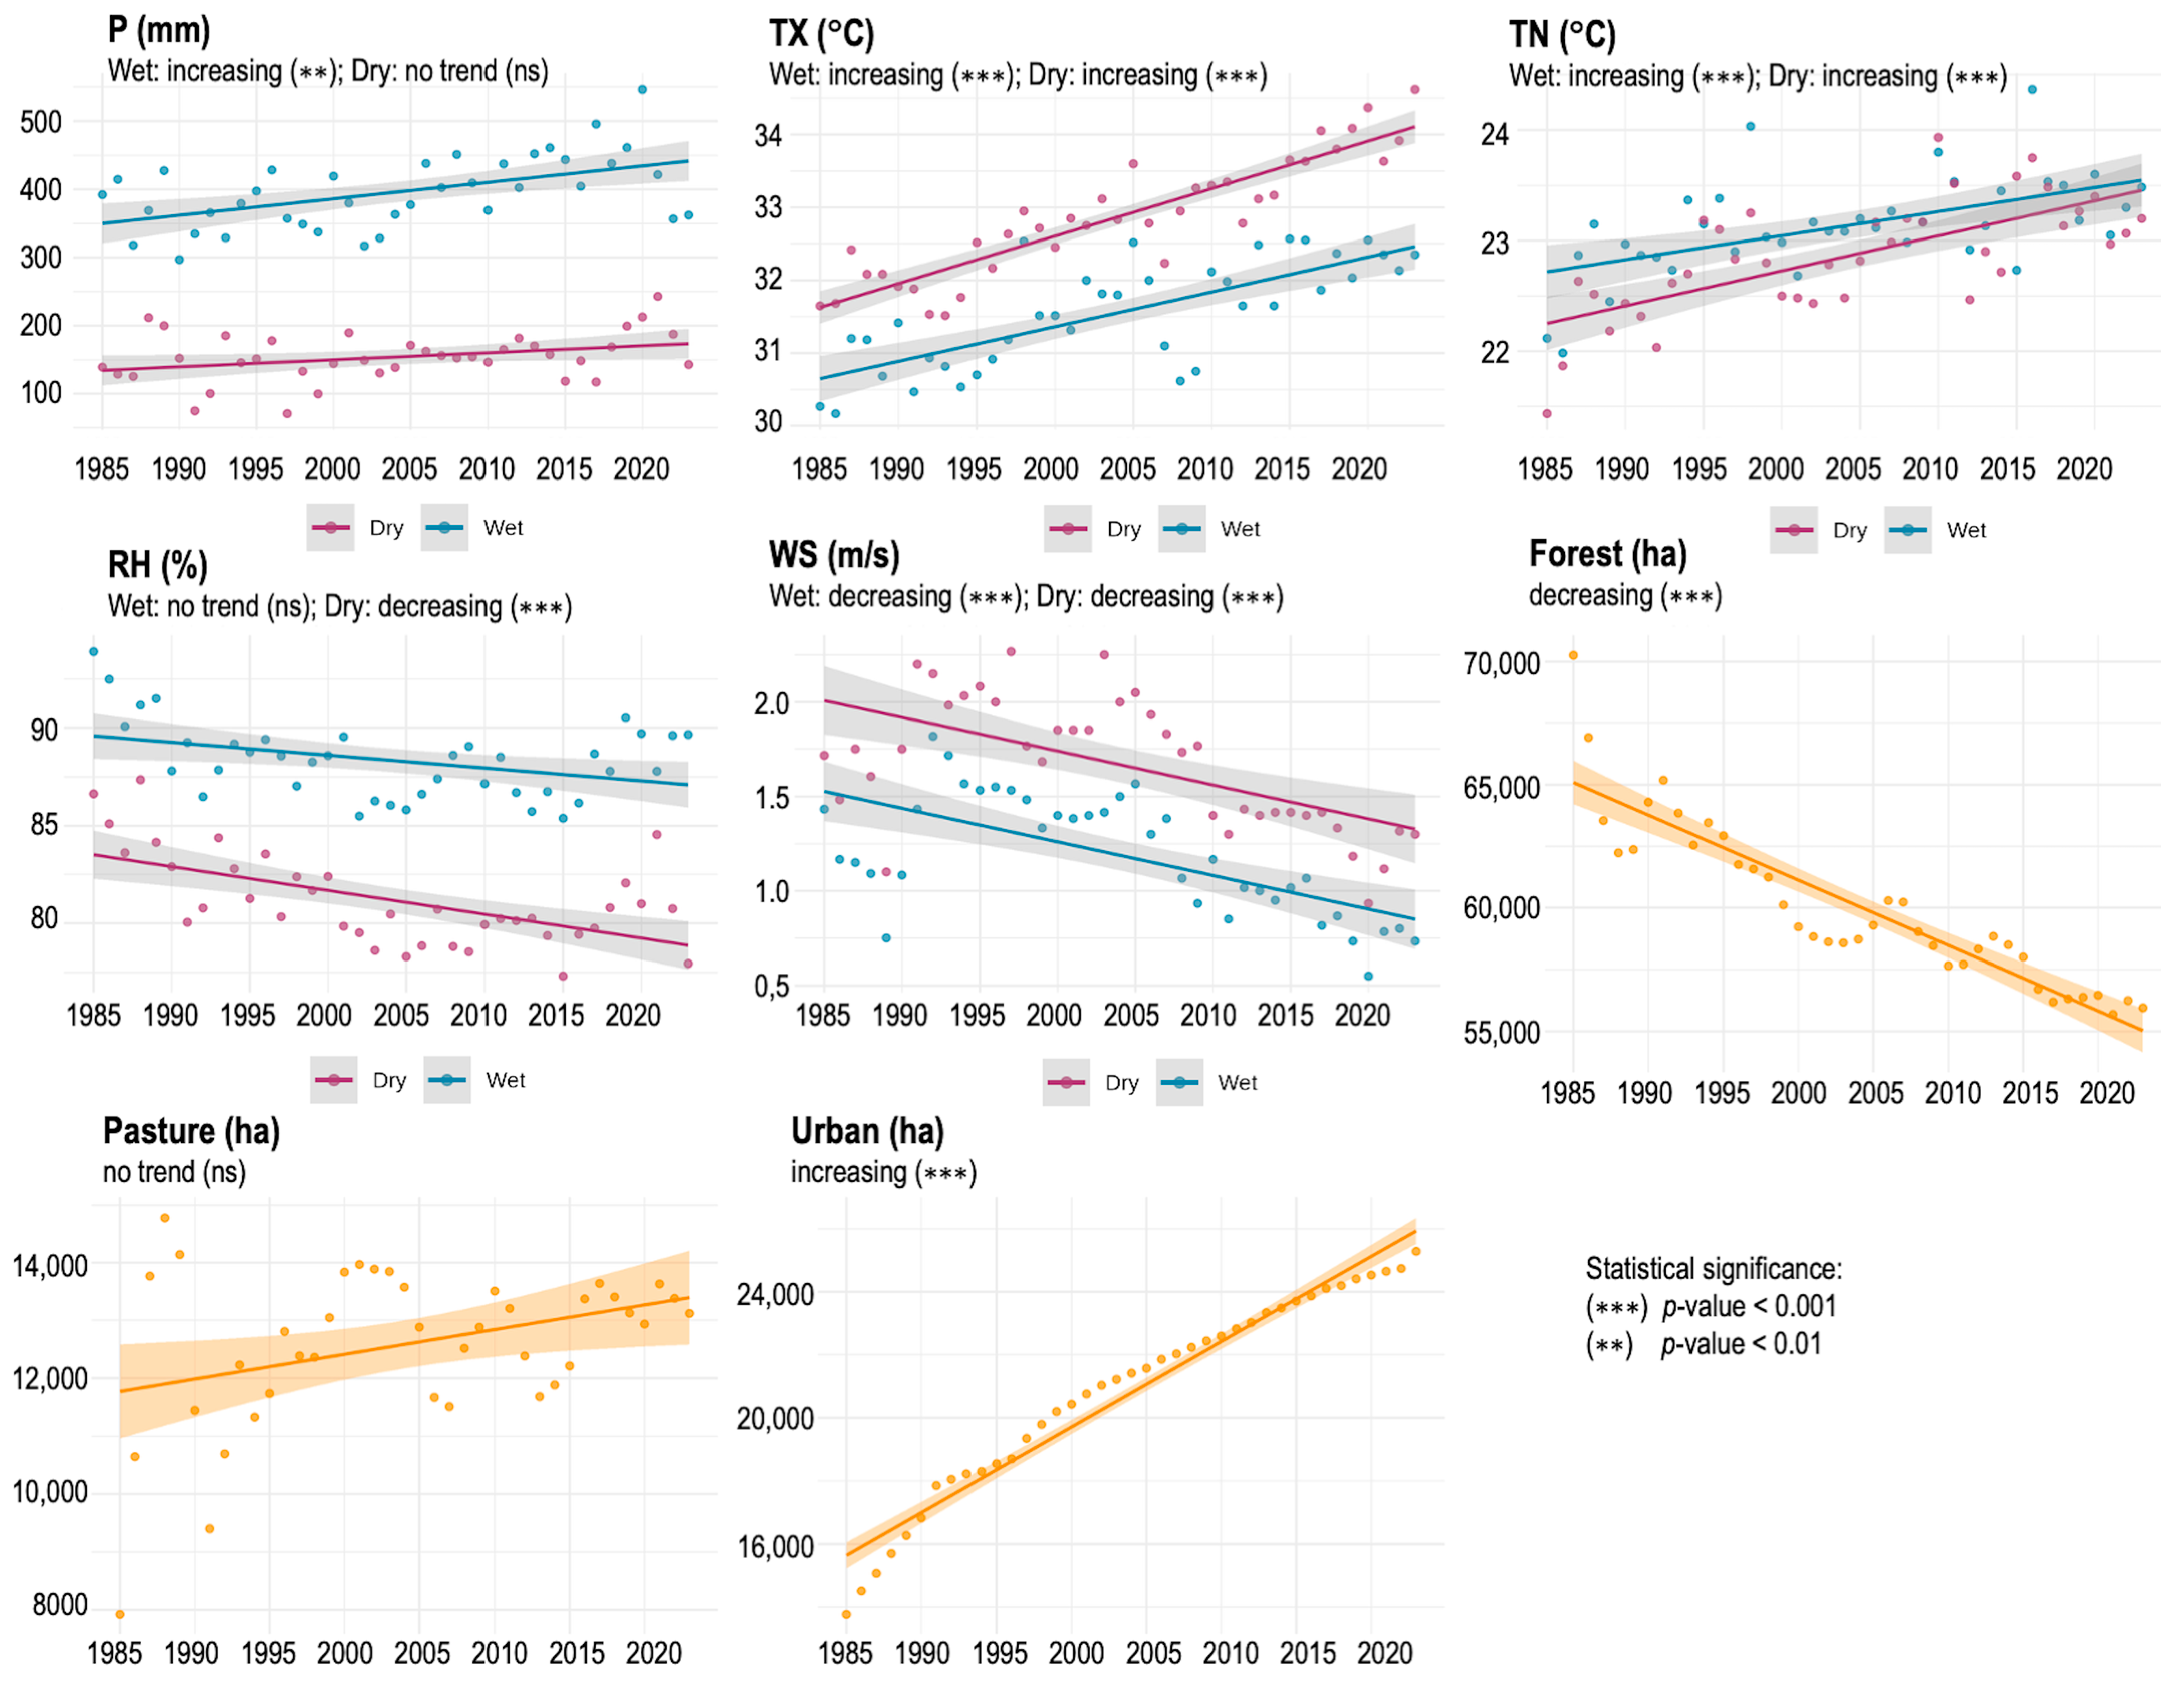
| Wet | P Station (mm) | 3.24 | 2.5 mm yr−1 | 1.0 | 4.1 | 0.001 |
| TX (°C) | 4.84 | 0.05 °C yr−1 | 0.04 | 0.06 | <0.001 | |
| TN (°C) | 3.79 | 0.02 °C yr−1 | 0.01 | 0.03 | <0.001 | |
| RH (%) | −1.83 | −0.06% yr−1 | −0.13 | 0.01 | 0.068 | |
| WS (m s−1) | −4.66 | −0.02 m s−1 yr−1 | −0.03 | −0.01 | <0.001 | |
| Dry | P Station (mm) | 1.96 | 1.01 mm yr−1 | −0.02 | 2.02 | 0.050 |
| TX (°C) | 6.69 | 0.07 °C yr−1 | 0.05 | 0.08 | <0.001 | |
| TN (°C) | 4.36 | 0.03 °C yr−1 | 0.02 | 0.04 | <0.001 | |
| RH (%) | −3.48 | −0.13% yr−1 | −0.18 | −0.06 | <0.001 | |
| WS (m s−1) | −3.86 | −0.02 m s−1 yr−1 | −0.03 | −0.01 | <0.001 | |
| Annual | Forest (ha) | −7.26 | −246.8 ha yr−1 | −283.5 | −208.6 | <0.001 |
| Pasture (ha) | 1.69 | 36.4 ha yr−1 | −7.1 | 72.9 | 0.090 | |
| Urban (ha) | 8.95 | 246.9 ha yr−1 | 223.1 | 271.6 | <0.001 |
| Variable Pair | Regime | Correlation | p-Value | Regime | Correlation | p-Value |
|---|---|---|---|---|---|---|
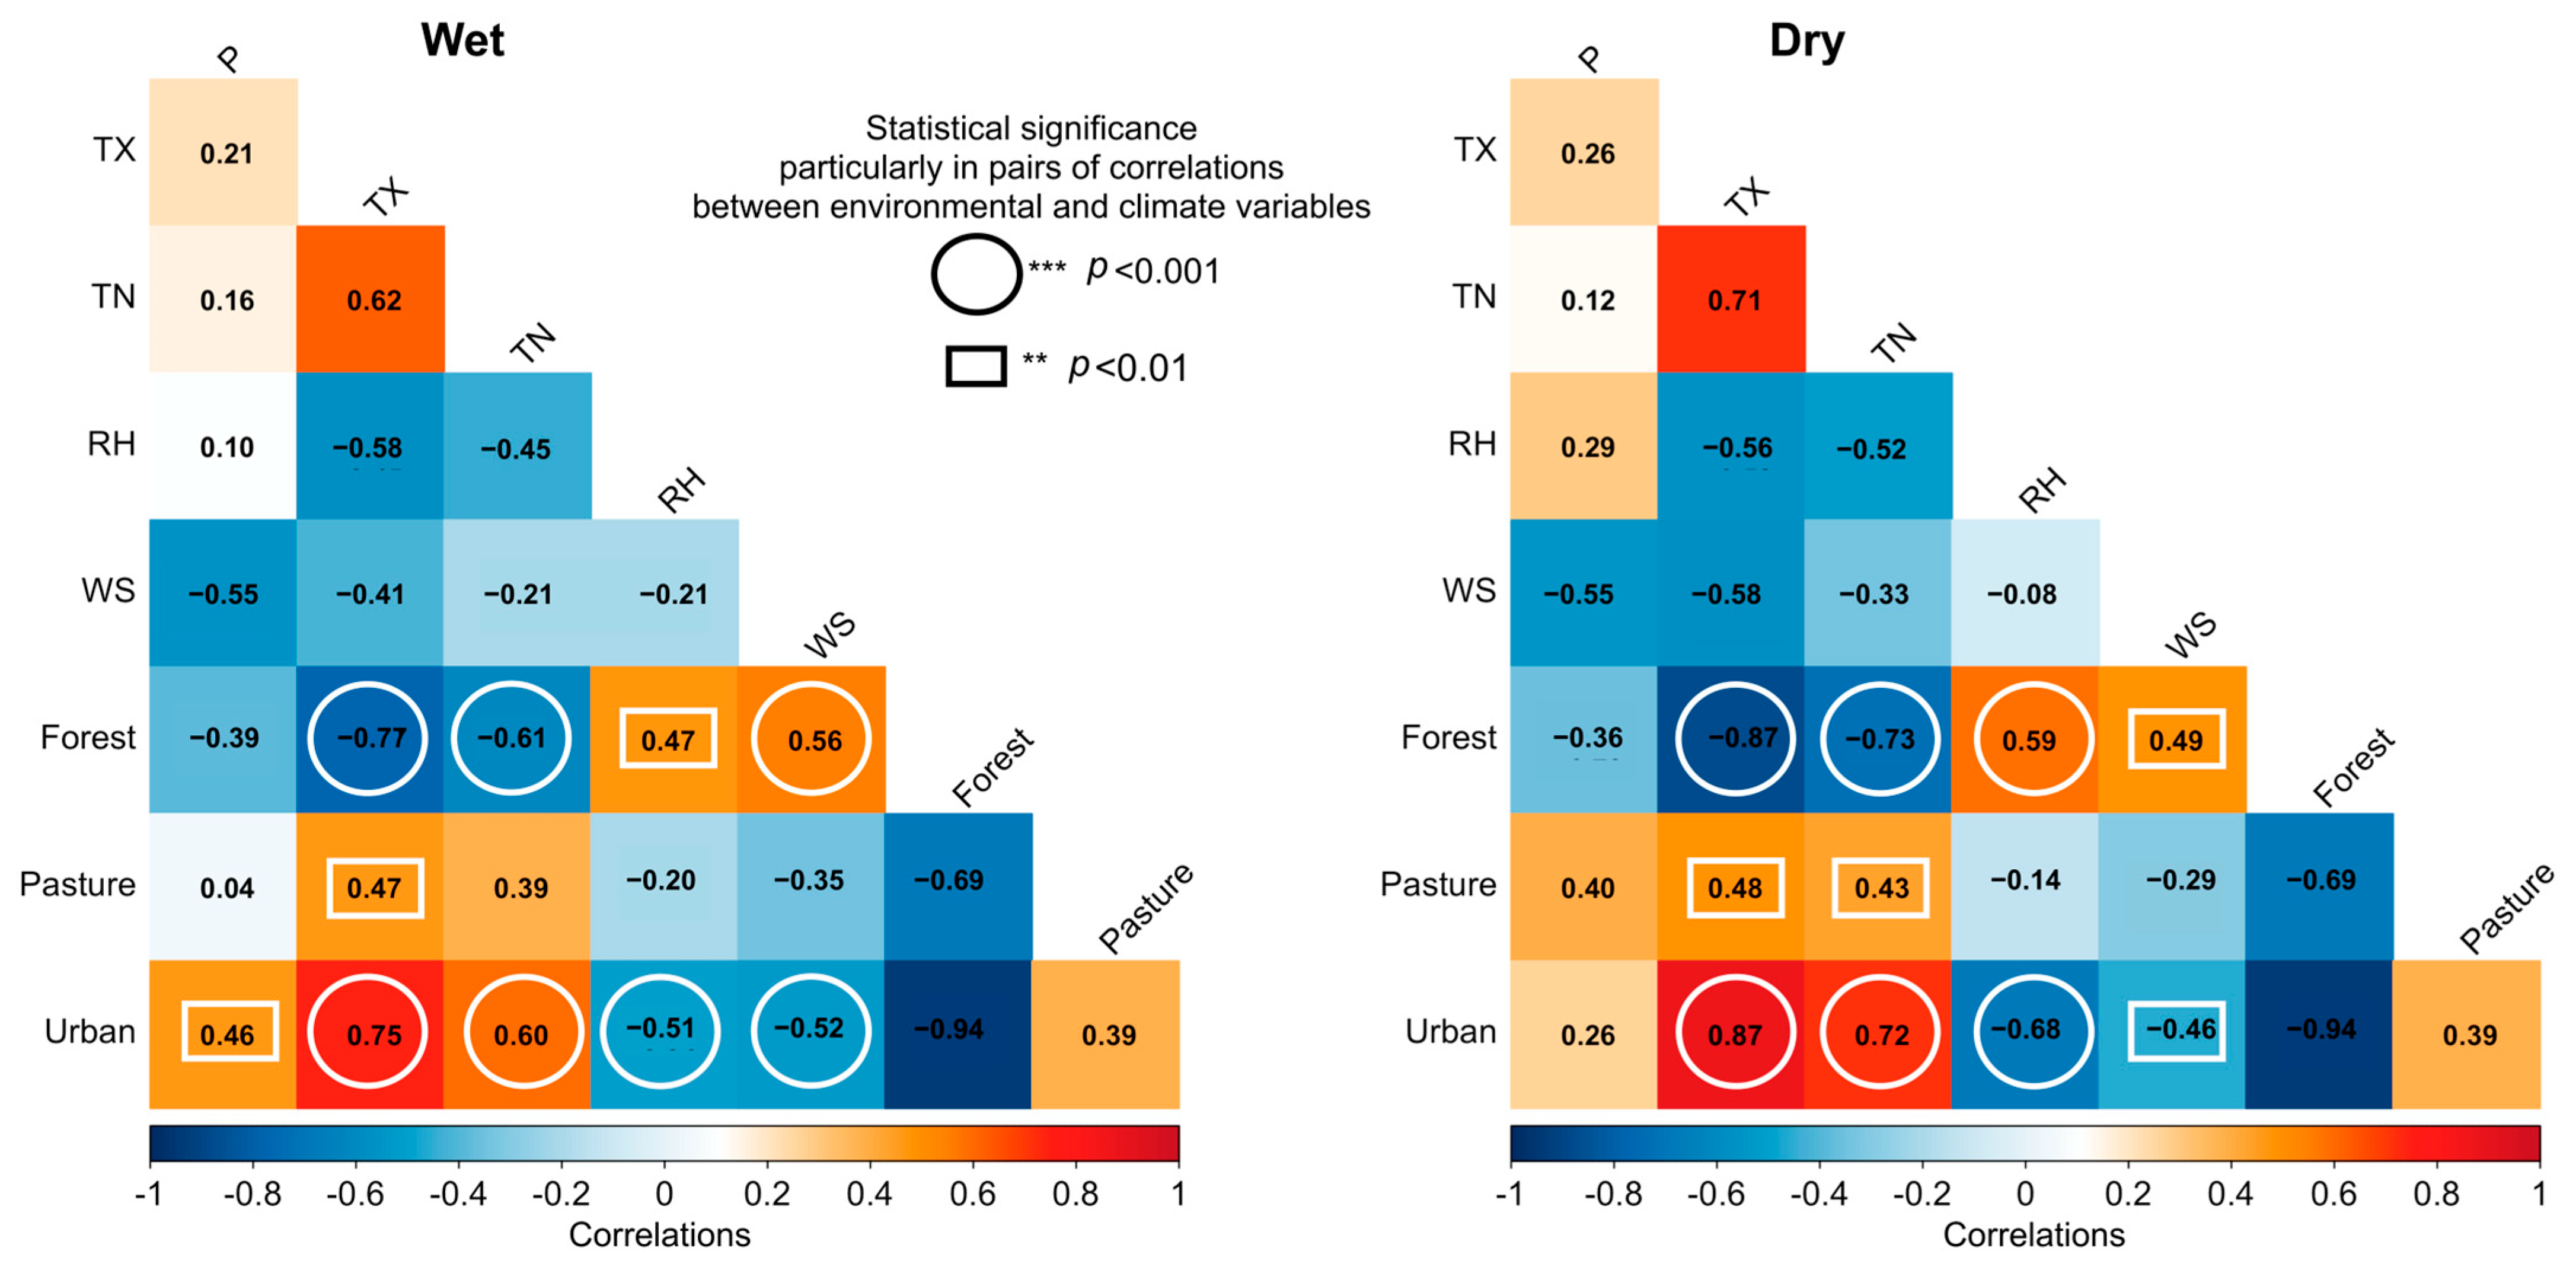
| Forest vs. P Station | Wet | −0.39 | 0.015 | Dry | −0.36 | 0.026 |
| Forest vs. TX | −0.77 | <0.001 | −0.87 | <0.001 | ||
| Forest vs. TN | −0.61 | <0.001 | −0.73 | <0.001 | ||
| Forest vs. RH | 0.47 | 0.002 | 0.59 | <0.001 | ||
| Forest vs. WS | 0.56 | <0.001 | 0.49 | 0.002 | ||
| Pasture vs. P Station | 0.04 | 0.791 | 0.40 | 0.012 | ||
| Pasture vs. TX | 0.47 | 0.003 | 0.48 | 0.002 | ||
| Pasture vs. TN | 0.39 | 0.015 | 0.43 | 0.006 | ||
| Pasture vs. RH | −0.20 | 0.221 | −0.14 | 0.403 | ||
| Pasture vs. WS | −0.35 | 0.030 | −0.29 | 0.072 | ||
| Urban vs. P | 0.46 | 0.003 | 0.26 | 0.110 | ||
| Urban vs. TX | 0.75 | <0.001 | 0.87 | <0.001 | ||
| Urban vs. TN | 0.60 | <0.001 | 0.72 | <0.001 | ||
| Urban vs. RH | −0.51 | 0.001 | −0.68 | <0.001 | ||
| Urban vs. WS | −0.52 | 0.001 | −0.46 | 0.003 |
| Statistics | Regime | Items and Variables | PC1 | PC2 | PC3 | PC4 | PC5 | PC6 | PC7 |
|---|---|---|---|---|---|---|---|---|---|
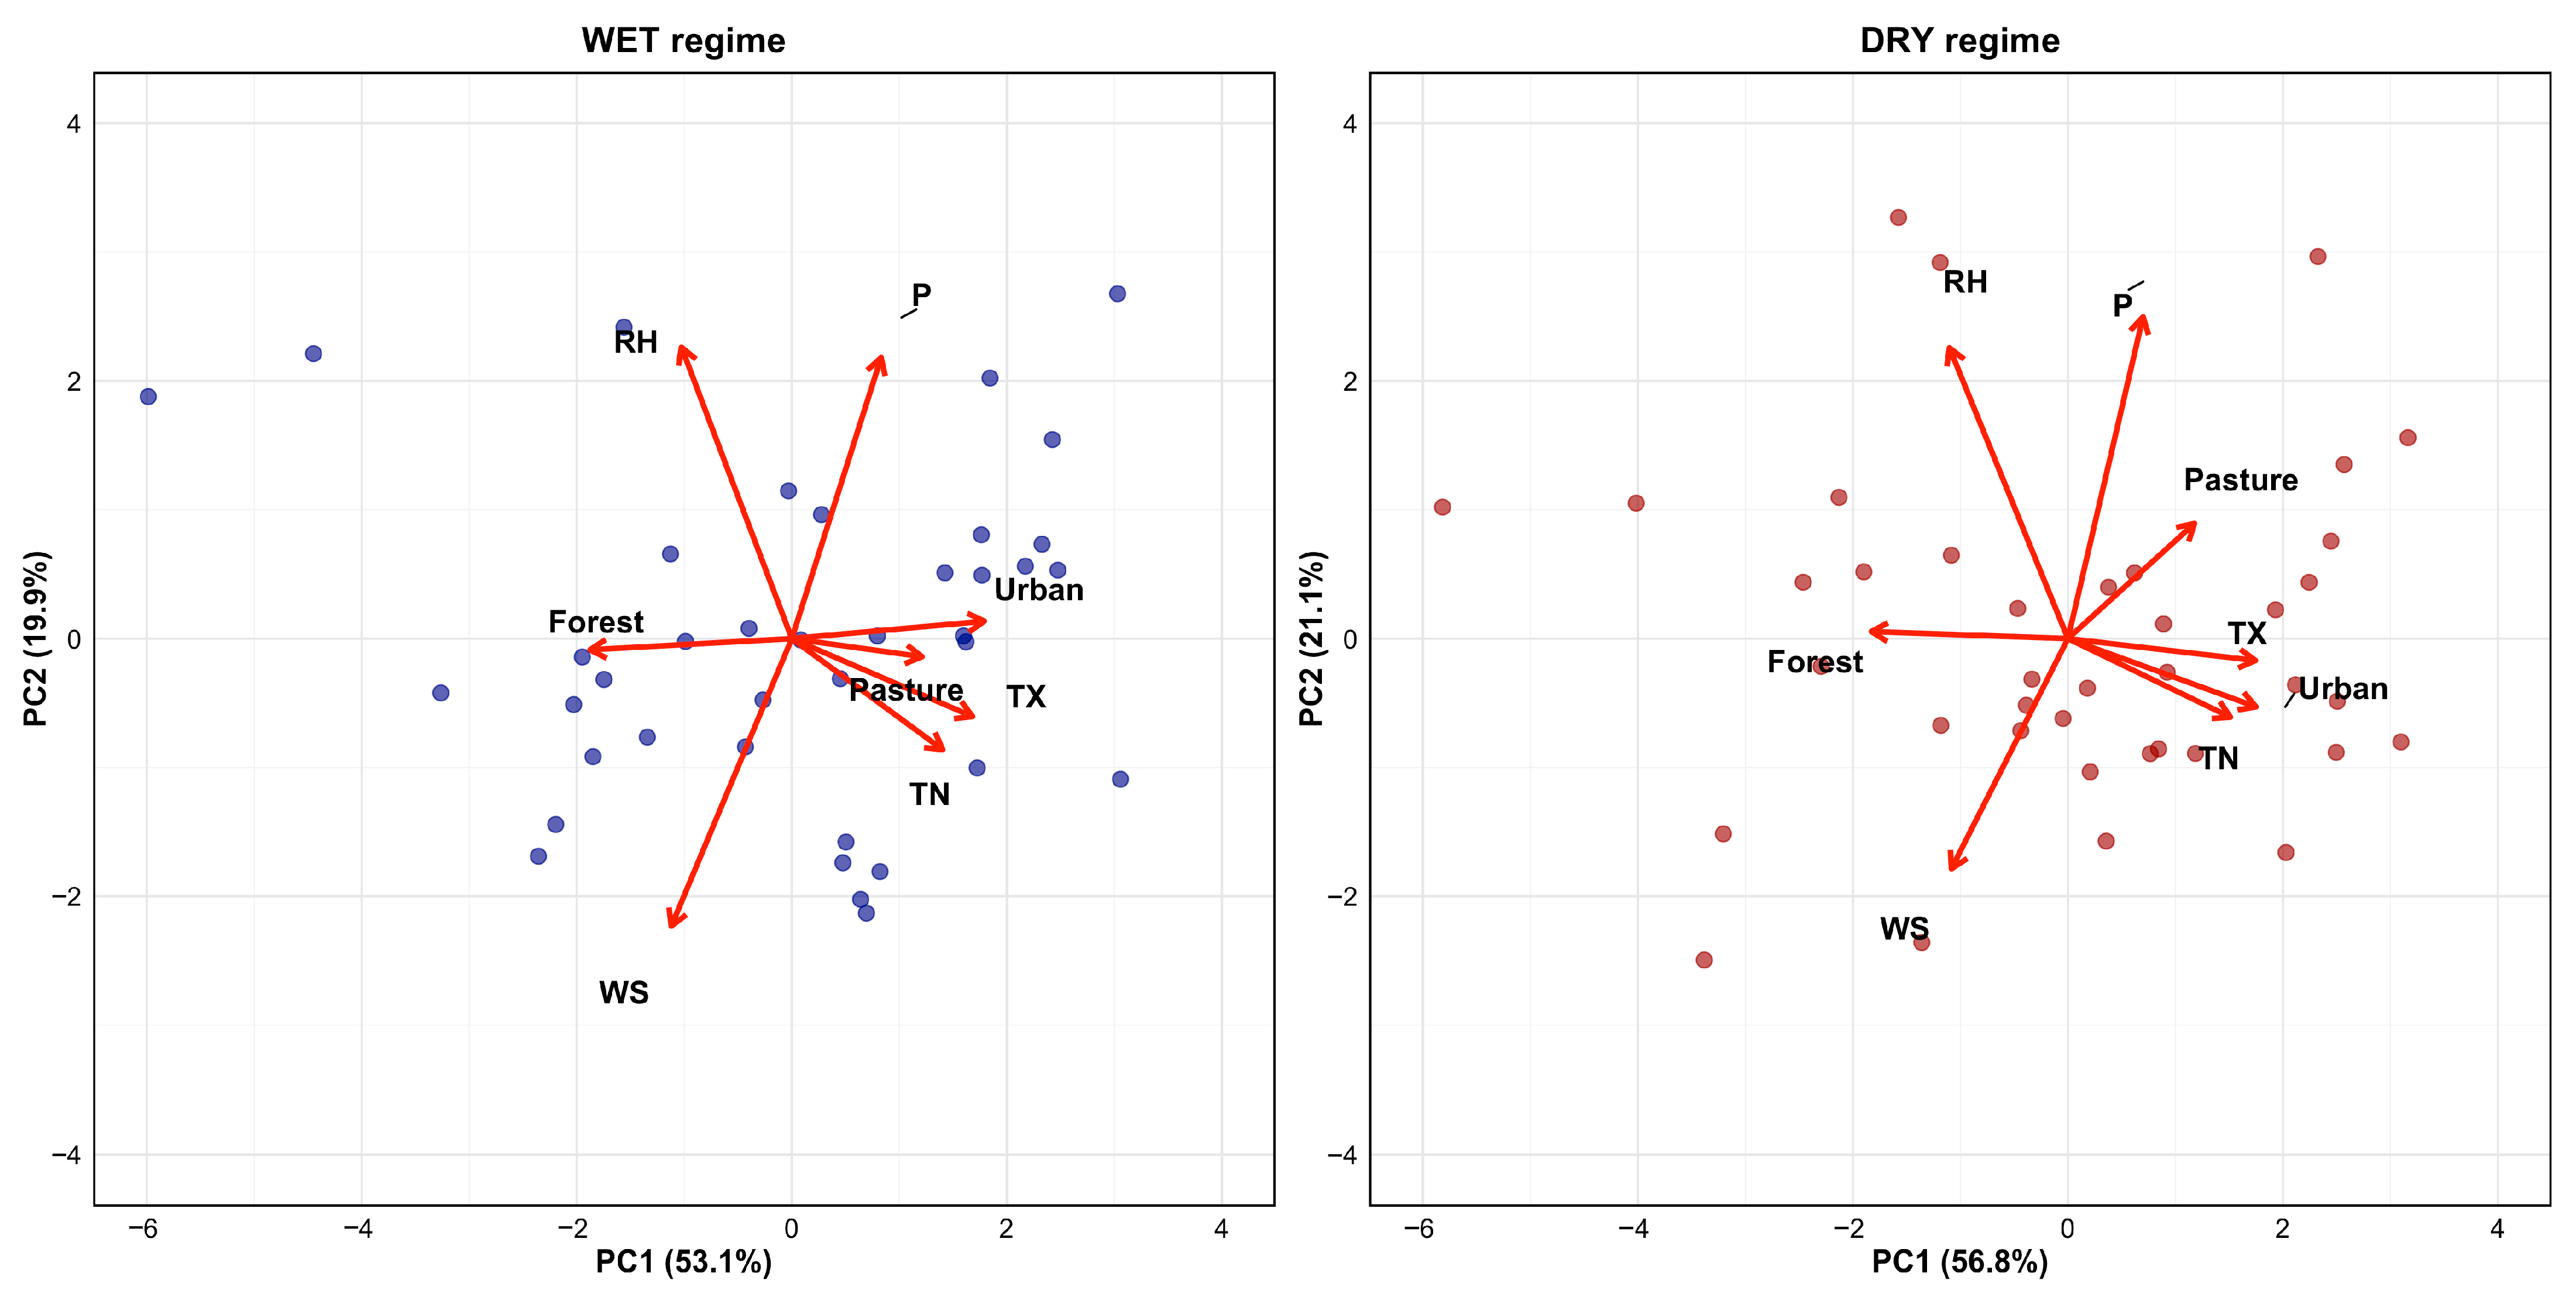
| Variance explained | Wet | Std. deviation | 2.06 | 1.26 | 0.93 | 0.70 | 0.63 | 0.49 | 0.39 |
| Proportion variance | 0.53 | 0.20 | 0.11 | 0.06 | 0.05 | 0.03 | 0.02 | ||
| Cumulative proportion | 0.53 | 0.73 | 0.84 | 0.90 | 0.95 | 0.98 | 1.00 | ||
| Dry | Std. deviation | 2.13 | 1.30 | 0.87 | 0.65 | 0.59 | 0.37 | 0.34 | |
| Proportion variance | 0.57 | 0.21 | 0.09 | 0.05 | 0.04 | 0.02 | 0.01 | ||
| Cumulative proportion | 0.57 | 0.78 | 0.87 | 0.93 | 0.97 | 0.99 | 1.00 | ||
| PCA loadings | Wet | Forest | −0.47 | −0.02 | 0.11 | −0.18 | 0.10 | −0.35 | −0.18 |
| Pasture | 0.30 | −0.04 | −0.77 | 0.11 | −0.43 | −0.18 | −0.05 | ||
| Urban | 0.45 | 0.03 | 0.24 | 0.16 | 0.06 | 0.54 | 0.28 | ||
| P Station | 0.21 | 0.55 | 0.46 | 0.02 | −0.57 | −0.35 | 0.00 | ||
| TX | 0.42 | −0.15 | 0.05 | 0.06 | 0.45 | −0.65 | 0.42 | ||
| TN | 0.35 | −0.22 | 0.06 | −0.89 | −0.09 | 0.05 | −0.15 | ||
| RH | −0.26 | 0.57 | −0.31 | −0.36 | 0.11 | 0.11 | 0.60 | ||
| WS | −0.28 | −0.56 | 0.15 | −0.01 | −0.51 | −0.02 | 0.58 | ||
| Dry | Forest | −0.46 | −0.01 | −0.14 | 0.16 | −0.10 | 0.13 | 0.40 | |
| Pasture | 0.29 | −0.22 | 0.79 | 0.18 | 0.31 | 0.14 | 0.04 | ||
| Urban | 0.44 | 0.13 | −0.19 | −0.30 | −0.05 | −0.23 | −0.50 | ||
| P Station | 0.17 | −0.62 | 0.03 | −0.54 | −0.45 | 0.14 | 0.26 | ||
| TX | 0.44 | 0.04 | −0.18 | 0.08 | 0.22 | −0.55 | 0.64 | ||
| TN | 0.38 | 0.15 | 0.03 | 0.57 | −0.70 | 0.13 | 0.02 | ||
| RH | −0.28 | −0.56 | 0.03 | 0.35 | −0.10 | −0.62 | −0.30 | ||
| WS | −0.27 | 0.45 | 0.53 | −0.33 | −0.37 | −0.44 | 0.10 |
| Regime | Variable | P1 Mean | P2 Mean | Abs. Change | % Change | Uncertainty | Confidence Int. | p-Value |
|---|---|---|---|---|---|---|---|---|
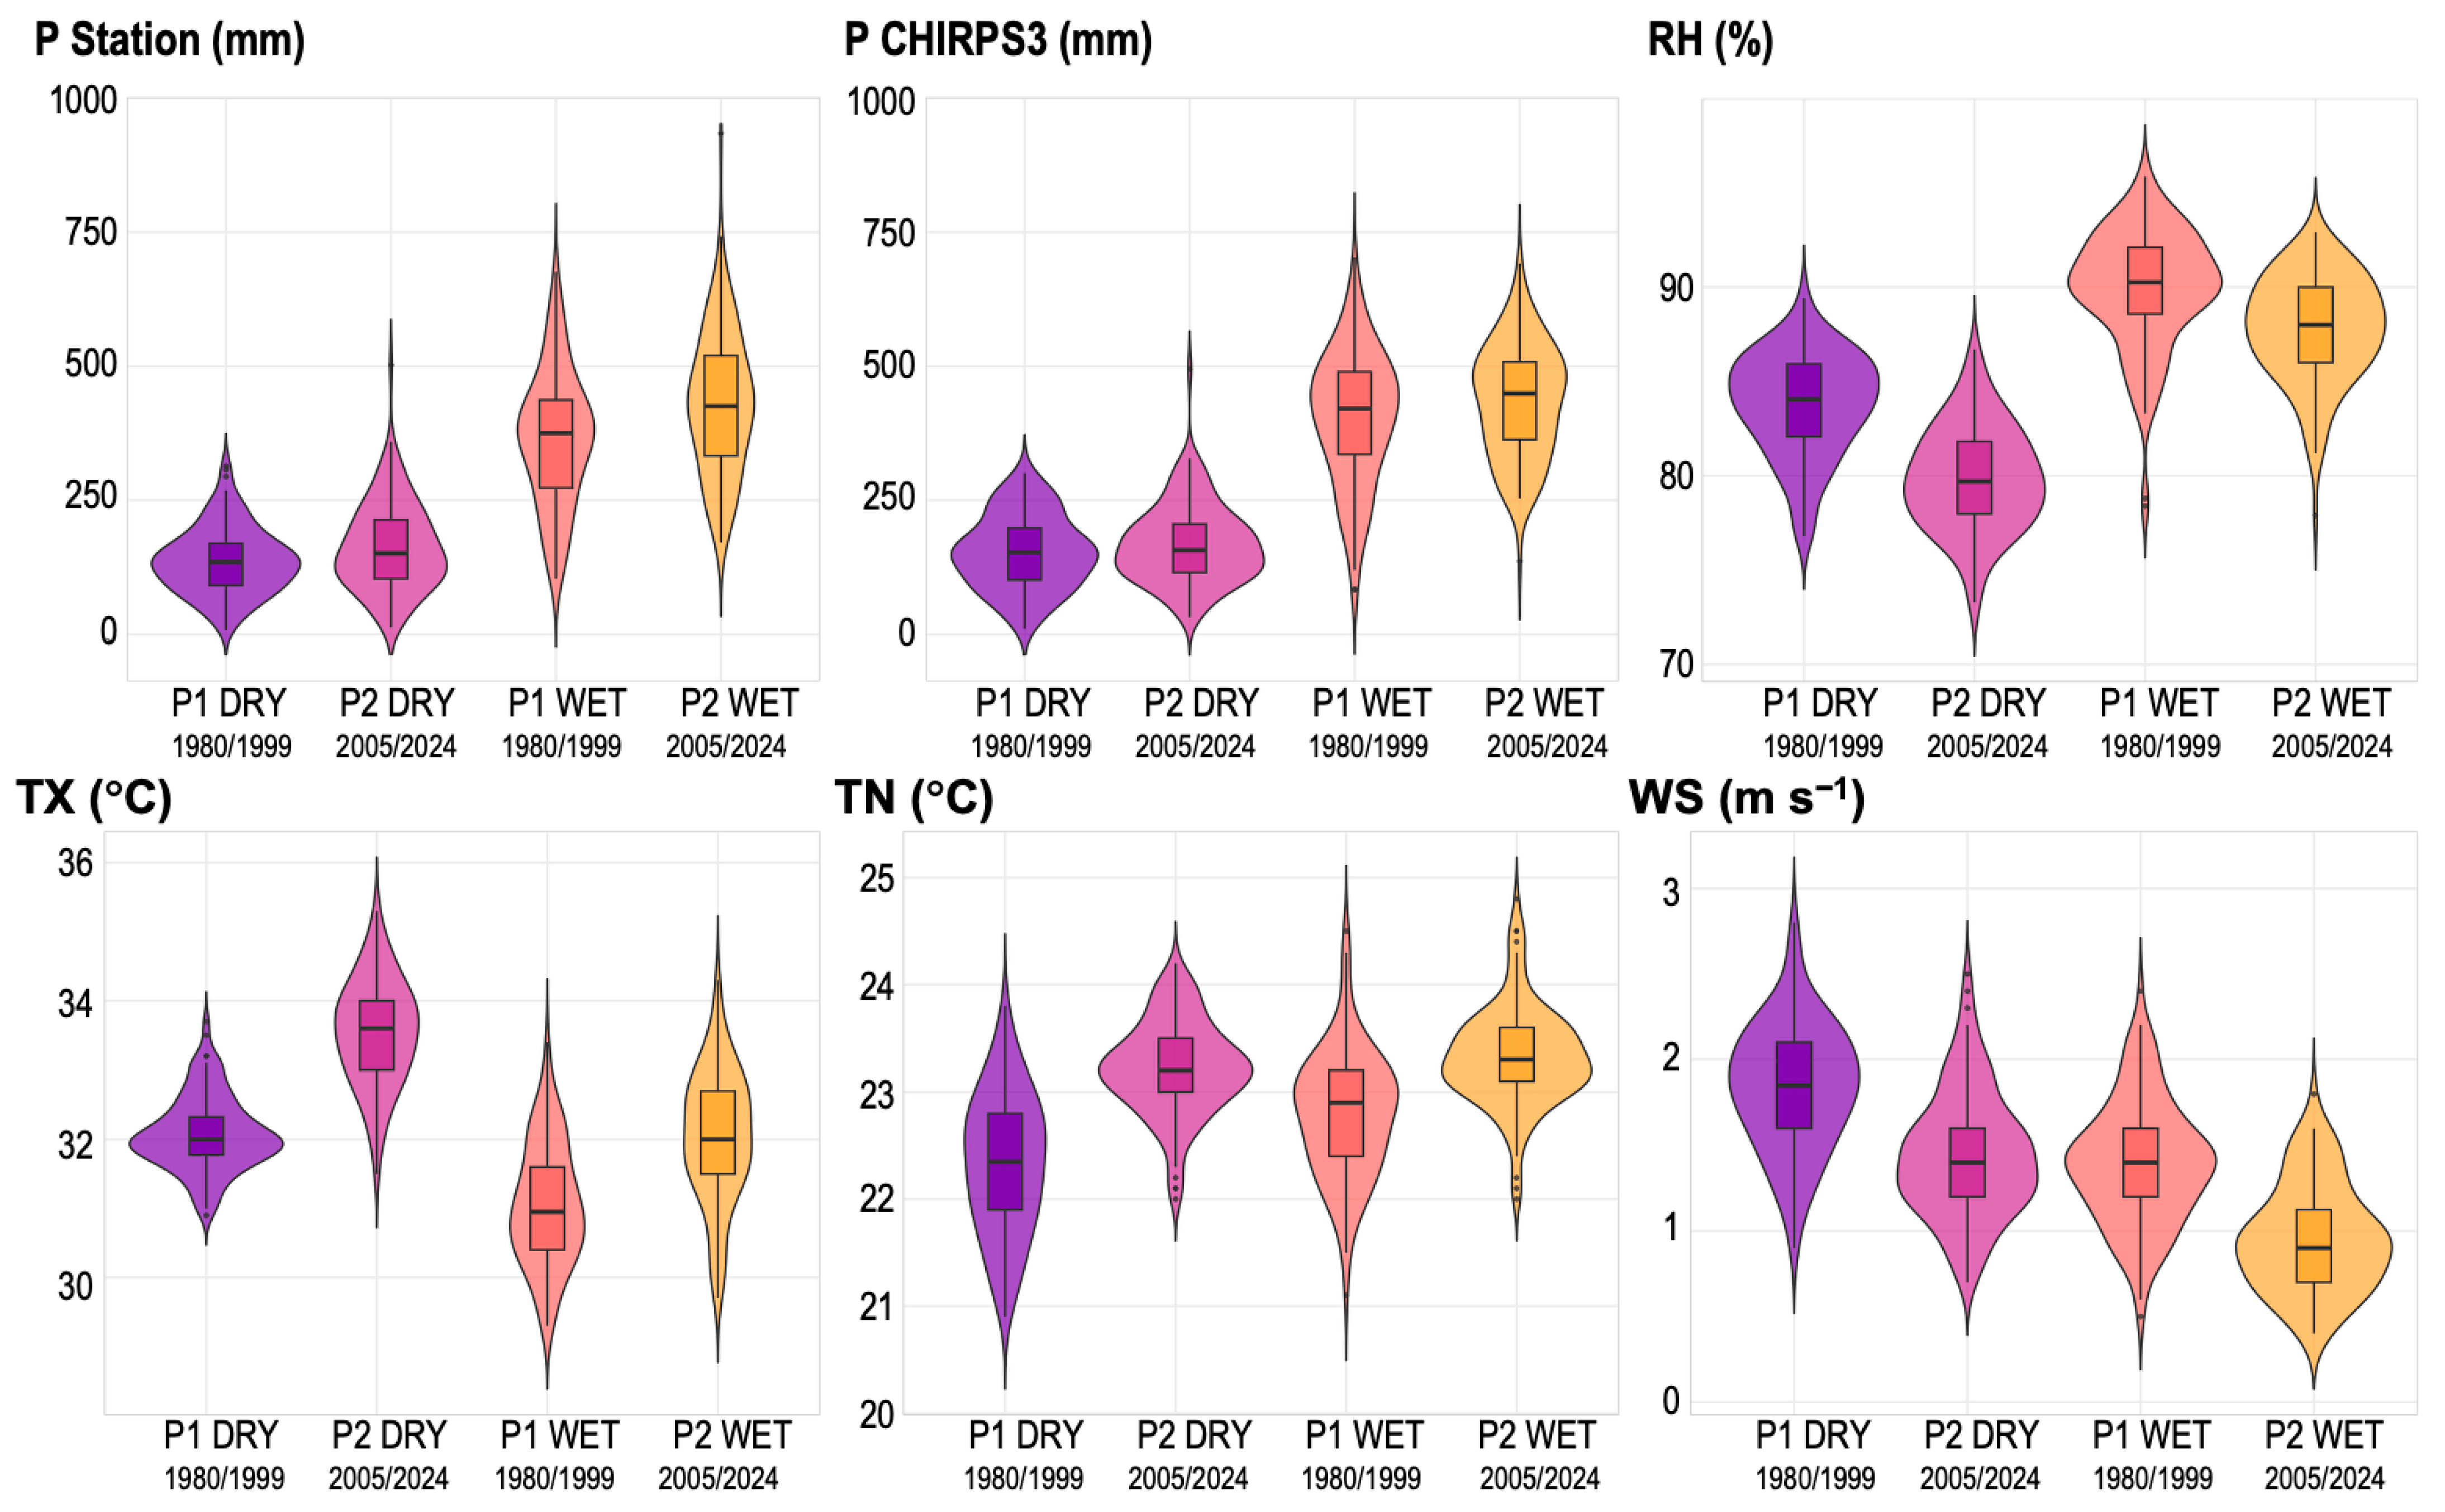
| Wet | P Station (mm) | 364.4 | 431.3 | 66.9 | 18.4 | ±32.6 | 34.2 to 99.5 | 0.001 |
| P CHIRPS3 (mm) | 400.3 | 434.4 | 34.1 | 8.5 | ±29.3 | 1.8 to 60.3 | 0.040 | |
| TX (°C) | 31.05 | 32.03 | 0.98 | ±0.24 | 0.75 to 1.22 | <0.001 | ||
| TN (°C) | 22.79 | 23.33 | 0.54 | ±0.14 | 0.40 to 0.67 | <0.001 | ||
| RH (%) | 89.94 | 87.79 | −2.15 | ±0.75 | −2.90 to −1.40 | <0.001 | ||
| WS (m s−1) | 1.40 | 0.96 | −0.44 | ±0.09 | −0.52 to −0.35 | 0.001 | ||
| Dry | P Station (mm) | 137.1 | 162.8 | 25.7 | 18.7 | ±18.5 | 7.3 to 44.2 | 0.006 |
| P CHIRPS3 (mm) | 149.9 | 168.3 | 18.4 | 12.3 | ±18.1 | −2.6 to 33.5 | 0.037 | |
| TX (°C) | 32.08 | 33.54 | 1.47 | ±0.17 | 1.30 to 1.64 | <0.001 | ||
| TN (°C) | 22.33 | 23.22 | 0.89 | ±0.14 | 0.75 to 1.03 | <0.001 | ||
| RH (%) | 83.77 | 79.86 | −3.91 | ±0.69 | −4.60 to −3.22 | <0.001 | ||
| WS (m s−1) | 1.84 | 1.44 | −0.40 | ±0.09 | −0.49 to −0.31 | <0.001 |
Disclaimer/Publisher’s Note: The statements, opinions and data contained in all publications are solely those of the individual author(s) and contributor(s) and not of MDPI and/or the editor(s). MDPI and/or the editor(s) disclaim responsibility for any injury to people or property resulting from any ideas, methods, instructions or products referred to in the content. |
© 2025 by the authors. Licensee MDPI, Basel, Switzerland. This article is an open access article distributed under the terms and conditions of the Creative Commons Attribution (CC BY) license (https://creativecommons.org/licenses/by/4.0/).
Share and Cite
de Souza, E.B.; Ferreira, D.B.d.S.; Santos, A.P.P.d.; Cunha, A.C.d.; Silva Junior, J.d.A.; do Carmo, A.M.C.; Paca, V.H.d.M.; Dias, T.S.d.S.; Correa, W.P.M.; Ambrizzi, T. Observational Evidence of Intensified Extreme Seasonal Climate Events in a Conurbation Area Within the Eastern Amazon. Earth 2025, 6, 112. https://doi.org/10.3390/earth6040112
de Souza EB, Ferreira DBdS, Santos APPd, Cunha ACd, Silva Junior JdA, do Carmo AMC, Paca VHdM, Dias TSdS, Correa WPM, Ambrizzi T. Observational Evidence of Intensified Extreme Seasonal Climate Events in a Conurbation Area Within the Eastern Amazon. Earth. 2025; 6(4):112. https://doi.org/10.3390/earth6040112
Chicago/Turabian Stylede Souza, Everaldo Barreiros, Douglas Batista da Silva Ferreira, Ana Paula Paes dos Santos, Alan Cavalcanti da Cunha, João de Athaydes Silva Junior, Alexandre Melo Casseb do Carmo, Victor Hugo da Motta Paca, Thaiane Soeiro da Silva Dias, Waleria Pereira Monteiro Correa, and Tercio Ambrizzi. 2025. "Observational Evidence of Intensified Extreme Seasonal Climate Events in a Conurbation Area Within the Eastern Amazon" Earth 6, no. 4: 112. https://doi.org/10.3390/earth6040112
APA Stylede Souza, E. B., Ferreira, D. B. d. S., Santos, A. P. P. d., Cunha, A. C. d., Silva Junior, J. d. A., do Carmo, A. M. C., Paca, V. H. d. M., Dias, T. S. d. S., Correa, W. P. M., & Ambrizzi, T. (2025). Observational Evidence of Intensified Extreme Seasonal Climate Events in a Conurbation Area Within the Eastern Amazon. Earth, 6(4), 112. https://doi.org/10.3390/earth6040112


