Article

The Recent Extinction of the Carihuairazo Volcano Glacier in the Ecuadorian Andes Using Multivariate Analysis Techniques

by
Pedro Vicente Vaca-Cárdenas
1,2,*,
Eduardo Antonio Muñoz-Jácome
2,
Maritza Lucia Vaca-Cárdenas
3,
Diego Francisco Cushquicullma-Colcha
2 and
José Guerrero-Casado
4
1
Programa de Doctorado Recursos Naturales y Gestión Sostenible, Universidad de Córdoba, 14071 Cordoba, Spain
2
Faculty of Natural Resources, Escuela Superior Politécnica de Chimborazo, Panamericana Sur, km 1.5, Riobamba 060155, Ecuador
3
Faculty of Livestock Sciences, Escuela Superior Politécnica de Chimborazo, Panamericana Sur, km 1.5, Riobamba 060155, Ecuador
4
Departamento de Zoología, Universidad de Córdoba, Edificio Charles Darwin, Campus de Rabanales, 14071 Cordoba, Spain
*
Author to whom correspondence should be addressed.
Earth 2025, 6(3), 86; https://doi.org/10.3390/earth6030086 (registering DOI)
Submission received: 22 May 2025 / Revised: 22 July 2025 / Accepted: 25 July 2025 / Published: 1 August 2025

Abstract

Climate change has accelerated the retreat of Andean glaciers, with significant recent losses in the tropical Andes. This study evaluates the extinction of the Carihuairazo volcano glacier (Ecuador), quantifying its area from 1312.5 m2 in September 2023 to 101.2 m2 in January 2024, its thickness (from 2.5 m to 0.71 m), and its volume (from 2638.85 m3 to 457.18 m3), before its complete deglaciation in February 2024; this rapid melting and its small size classify it as a glacierette. Multivariate analyses (PCA and biclustering) were performed to correlate climatic variables (temperature, solar radiation, precipitation, relative humidity, vapor pressure, and wind) with glacier surface and thickness. The PCA explained 70.26% of the total variance, with Axis 1 (28.01%) associated with extreme thermal conditions (temperatures up to 8.18 °C and radiation up to 16.14 kJ m−2 day−1), which probably drove its disappearance. Likewise, Axis 2 (21.56%) was related to favorable hydric conditions (precipitation between 39 and 94 mm) during the initial phase of glacier monitoring. Biclustering identified three groups of variables: Group 1 (temperature, solar radiation, and vapor pressure) contributed most to deglaciation; Group 2 (precipitation, humidity) apparently benefited initial stability; and Group 3 (wind) played a secondary role. These results, validated through in situ measurements, provide scientific evidence of the disappearance of the Carihuairazo volcano glacier by February 2024. They also corroborate earlier projections that anticipated its extinction by the middle of this decade. The early disappearance of this glacier highlights the vulnerability of small tropical Andean glaciers and underscores the urgent need for water security strategies focused on management, adaptation, and resilience.

1. Introduction

Climate change represents the greatest contemporary environmental challenge for glacier conservation, evidenced by the retreat of glacier masses worldwide, with annual glacier length retreat rates of up to 125 m between 1961 and 2011 [1]. This phenomenon, driven by rising global temperatures, has led to a reduction in the extent of glaciers worldwide, including those located in the South American Andes [2]. Despite advances in research on the impact of global warming, current climate models still fail to fully predict changes in recent years [3], partly due to the unprecedented speed and complexity of climate-driven transformations.
Mountain glaciers provide a variety of ecosystem services; however, their accelerated retreat has led to a significant decrease in the value of these services, particularly affecting watershed planning and management [4]. The need to understand and manage these changes is becoming increasingly urgent, given their potential impact on the ecosystems of lowland areas and the hydrological dynamics of mountainous regions [5]. Indeed, the reduction of glacier coverage and the rise of the snow line observed in different mountain areas of the world pose increasing challenges for the sustainable management of water resources for human use and other ecosystem services associated with these cryospheric systems [6].
Andean glaciers, located between Venezuela and Argentina, present one of the most accelerated loss rates worldwide, with a significant contribution to sea level rise [7]. Between 2000 and 2018, the total glacier mass loss from Andean glaciers was −22.9 ± 5.9 Gt/yr, equivalent to −0.72 ± 0.22 m a.s./yr. The most negative mass balances were recorded in the Patagonian Andes (−0.78 ± 0.25 m a.s./yr) and in the Tropical Andes (−0.42 ± 0.24 m a.s./yr), in contrast, the Dry Andes located in northern Argentina presented more moderate losses (−0.28 ± 0.18 m a.s./yr) [7]. Temporal analysis in the south of the continent showed a steady mass loss in tropical regions, in contrast to the center-south, where a transition from slightly positive to strongly negative mass balances was observed, due to extreme drought conditions since 2010 [8]. Although this accelerated glacial melt temporarily contributes to mitigating the hydrological impacts of drought, it compromises the future sustainability of water resources in these regions [7].
This widespread glacial retreat across the Andes is also evident in Ecuador, where high-elevation volcanoes such as Chimborazo (6263 masl) and Carihuairazo (5120 masl) have shown alarming signs of ice loss over recent decades [9]. Chimborazo volcano, located in the center of the country, is the highest mountain in Ecuador, and its glacier has been better studied. It experienced a 21% reduction in its glacier area and a 180 m increase in the average minimum elevation of its glaciers between 1986 and 2013 [10]. The Carihuairazo volcano is located in the same area, only 10 km from Chimborazo, and some studies have been conducted on its glacier, which similarly reveal contractions [11,12]. This reduction highlights the need to investigate the extinction processes of these tropical glaciers, similar to those of neighboring elevations such as Cotacachi (4944 masl), which have already lost their permanent ice cover [13].
Unfortunately, in the Carihuairazo volcano, as well as in other volcanoes of Ecuador, the information available on the current status of its glaciers is limited and discontinuous [14,15]. Data on glacier coverage began with the first aerial photographs taken in 1956 by the Military Geographic Institute (IGM), through the process of photogrammetry and field work [16,17]. These data showed a tendency towards the reduction of glaciers, as a correlation between the measured and modeled surfaces was identified [9].
Monitoring records of the Carihuairazo glacier show a 52.6% reduction of its surface area from 1956 to 2008, according to photogrammetric evaluations [8,9,10]. This accelerated retreat, driven mainly by disruptions in its energy balance, was largely due to sustained increases in atmospheric temperature and further exacerbated by external factors such as the volcanic activity of Tungurahua, which reduced the albedo by ash deposition [9]. As a consequence, communities near Carihuairazo report a decrease in water availability, which coincides with the glacial retreat observed since 2003 [18,19].
Climatic variables determine glacier growth and retreat patterns [20]. Glacier mass balance studies rely on a combination of field data and remote sensing techniques to generate maps of change, demonstrating the usefulness of integrating different data sources for quantification of glacier dynamics [21]. In this context, analysis of glacier melting using Geographic Information System (GIS) and remote sensing techniques has provided a better understanding of glacier dynamics [22]. Expanding upon these developments, automated glacier mapping techniques have enabled the creation of detailed inventories of glaciers in various regions, facilitating the assessment of their extent and characteristics [23]. In addition, the availability of glacier thickness observations in a global, version-controlled database has further improved the capacity to analyze and model glacier dynamics at multiple scales [24,25]. These technological and methodological tools could be particularly valuable for monitoring the dynamics of small glaciers, which are often underrepresented in large-scale glaciological studies despite their high sensitivity to climate change [26].
However, despite these methodological advances, recent studies specifically linking the current state of the Carihuairazo glacier with climatic variables are limited. In light of this gap, the objective of this study was to evaluate the extent and thickness of the Carihuairazo volcano glacier and correlate these parameters with climatic variables to monitor its recent disappearance.

2. Materials and Methods

2.1. Study Area

The Carihuairazo volcano has an elevation of 5120 masl [25]; it is the tenth-highest mountain in Ecuador [27]. It is located in the province of Tungurahua, in the western cordillera in the south-central Andean region of Ecuador, within the Chimborazo Reserve (CR) (Figure 1), which is one of 78 national protected areas [28]. Its name comes from the Quechua language and describes it as the mountain of bad weather, Kari-Huayra-Razu: “Mountain of snow with male wind” [29]. The volcano is the second most visited site in the CR, receiving approximately 300 visitors per month, who are motivated to visit by its small lakes and glacier [30].
As shown in Figure 1A, the field explorations that we conducted in September 2023 determined that the glacier of the Carihuairazo volcano is located in the valley of the west-west flank (Figure 2), in UTM zone 17S, at an elevation of 4,835 m.a.s.l., at coordinates 749,723 m E and 9,844,622 m N. It is catalogued in the global glacier inventories GLIMS and the Randolph Glacier Inventory (RGI) corresponding to code: RGI2000-v7.0-G-16-00011 (latitude: −1.404666, longitude: −78.75571) [31].

2.2. Process

2.2.1. Georeferencing and Measurement

The geometric evaluation of the glacier was carried out in three stages: September 2023, January 2024, and a final verification in February 2024. To georeference the glacier’s contour, a thorough cleaning of the glacier profile was carried out, removing surface snow, rocks, and other elements that could prevent the precise identification of the extreme edge of the ice [31]. The perimeter of the glacier was traversed by marking points every 1 m, and the UTM WGS 84 zone 17S geographic coordinates were recorded with a Juno 3D (Trimble Inc., Sunnyvale, CA, USA, EE. UU.). [32]. Subsequently, the obtained data were processed in QGIS software version 3.40.1, which allowed the generation of cartographic products and the elaboration of thematic maps of the total glacier area [33,34].
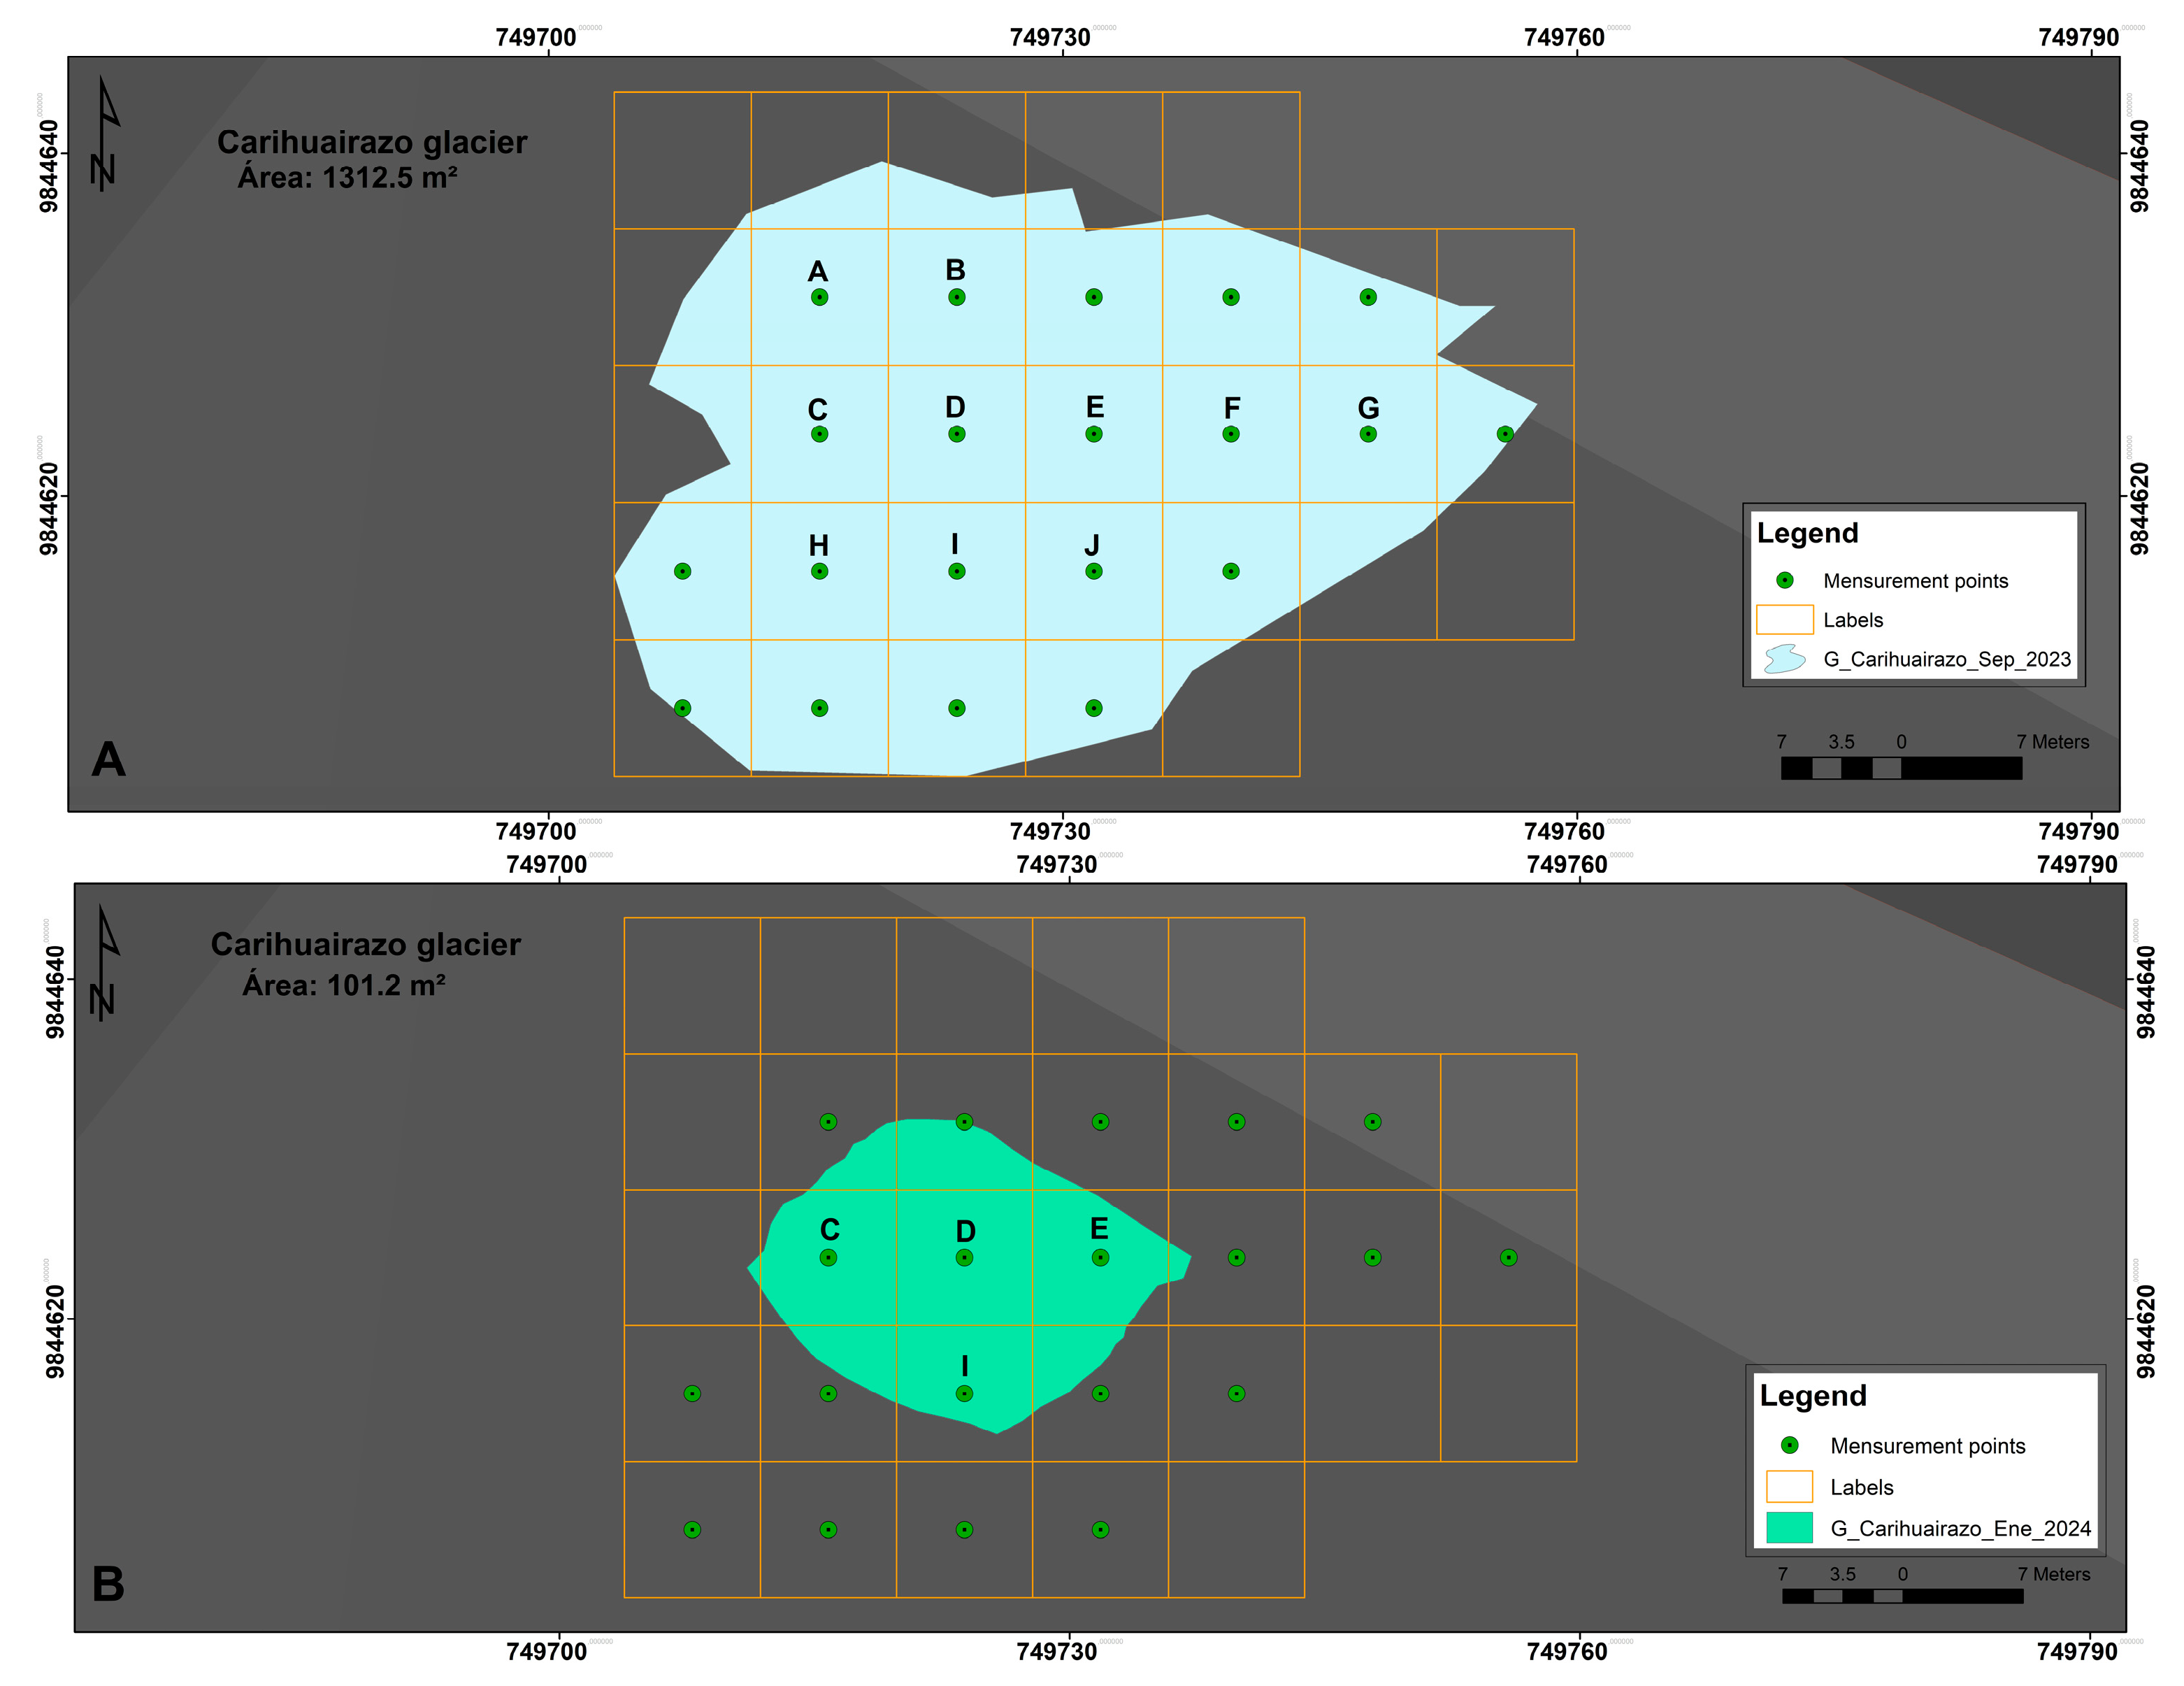
For the measurement of glacier thickness, 8 × 8 m cells were generated on the glacier polygon, marking measurement points in the center of each cell. Only cells whose surface was located completely on the glacier were considered (Figure 3). Ten measurement points were selected for September 2023. In January 2024, the measurements were repeated at only four points due to the reduction of the glacier area, and in February, it was no longer possible to measure because there was no glacier (see Figure 3, which illustrates the arrangement of the cells and points).
The direct thickness measurement procedure at each preset point consisted of (1) removing the surface snow with a shovel to expose the ice; (2) drilling the ice with an auger until reaching the underlying rock or moraine, ensuring the measurement of the total ice thickness; (3) using a rescue probe to measure the depth of the borehole, which corresponds to the thickness of the glacier at that point [35]. Figure 4 visually details this procedure, which was consistently replicated for all measurements to ensure data comparability.
Quantification of glacier mass (volume) was performed from the glacier polygon and average thickness data, and the information was entered into computer-aided design (CAD 3DS Max 2025) software, selected for its three-dimensional modeling capabilities [36,37]. The PROPFIS (physical properties) command, a standard CAD function, was used to calculate the physical properties of the solid model, thus obtaining the glacier volume for September 2023 and January 2024 [38]. Despite the final size of the glacier, this modeling made it possible to accurately visualize and quantify the drastic mass loss.

2.2.2. Climatic Data

Daily average climate data for September 2023 and January and February 2024 obtained from the weather station located at the RC in the Polylepis Forest sector (4300 masl), 19.6 km from the glacier, were analyzed [39,40]. The climatic variables considered in the analysis included air temperature (average, minimum, and maximum in °C, Stat_TA_°C), atmospheric pressure averaged over 1 h intervals (expressed in hectopascals, Stat_PA_1h/hPa), average wind speed (GenWind_m/s), precipitation (mm), solar radiation (kJ m−2 day−1), and water vapor pressure (kPa) [41,42].
To ensure the representativeness and accuracy of the fixed station data, complementary in situ measurements were made with a portable weather station (model no. WH24B) during each day of glacier monitoring. This allowed us to compare the temperature and radiation data to determine any deviations from actual conditions.

2.2.3. Statistical Analysis

To analyze the climatic variables and their correlation with glacier cover, the HJ-biplot diagram of the Principal Component Analysis (PCA) was used with the software MULTBIPLOT version 16.430.0.0.0. This technique was selected for its effectiveness in reducing dimensionality and simplifying complex climate data and transforming interrelated variables for better interpretation of patterns [43], thus improving climate prediction models [44]. This analysis made it possible to identify the influence of climatic variables on glacier surfaces and to establish patterns [45]. PCA assumes linearity and multivariate normal distribution, conditions that climate data might not meet, varying the results [46,47]. Therefore, the distribution and normality of the data were checked to ensure the correct interpretation of the results. The PCA minimized the loss of information and highlighted the interaction between climatic variables and their influence on glacier extent [48].
Then, with relational cluster analysis, the data were grouped according to their interdependencies, measured by correlation coefficients using Ward’s hierarchical method, which minimizes intragroup variance using the squared Euclidean distance, and Pearson’s correlation, common for detecting patterns [49,50]. This allows optimizing dimensionality reduction without losing key information by identifying hyperplanes [51]. It is important that this analysis has a correct correlation structure for the validity of the clusters, being ideal for large data sets [52,53].

3. Results

3.1. Georeferencing and Measurement

The glacier was initially measured on 16 September 2023. As shown in Figure 5 Ait had a white snow cover and was used by tourists for snowboarding. By 27 January 2024, Figure 5B shows changes in the condition of the glacier; it lacked snow, had a dark reddish coloration, and rocks, moraine, and a small runoff appeared at its eastern end. Finally, Figure 5C, taken on 22 February 2024, shows the complete disappearance of the glacier, exposing rocks and moraine. All of these illustrative photographs were accurately captured by an unmanned aerial vehicle (UAV), flying at an elevation of 30 m at 11 o’clock and using a 22 megapixel camera.
Figure 6 compares the glacier area in September 2023 and January 2024. In September, the recorded area was 1312.5 m2, located between the altitudinal heights of 4837 and 4832 masl, while in January 2024, it had decreased to 101.2 m2, between 4835 and 4833 masl. This represents a loss of 92.2% with respect to the initial area.

3.2. Glacier Thickness Measurements

According to Table 1, from the September 2023 measurement, point “d”, in the central zone of the glacier, registers the greatest depth with 2.50 m. Points “c” and “e” show average values of 1.42 m and 1.44 m, respectively. The lowest value, 0.78 m, corresponds to point “g”, located at the eastern end and in the highest area of the glacier. Snow thickness varied between 0.31 m and 0.41 m, with an average of 1.42 m.
In January 2024, data were recorded for four points. Point “D”, in the center of the glacier, showed the greatest depth at 1.32 m, which represents a decrease of 52.8% compared to the maximum depth recorded in September 2023. Point “C” showed an average value of 0.96 m, with a decrease of 67.6%. The lowest value was at point “I”, with 0.71 m, a decrease of 39% compared to September. The mean depth among the four points was 0.81 m.
The results indicate that the glacier contracted predominantly on the eastern flank (points A, B, F, G, H, as shown in Figure 4), which corresponds to the highest zone near the summit. The reduction on the northern and southern flanks was similar, whereas on the western flank, where a small runoff occurs and the lowest elevation is found, the decrease was smaller (Table 1).

3.3. Glacier Modeling

Three-dimensional modeling enabled the visualization of the glacier’s volumetric and geo-metric changes, which is essential to understand its dynamics.
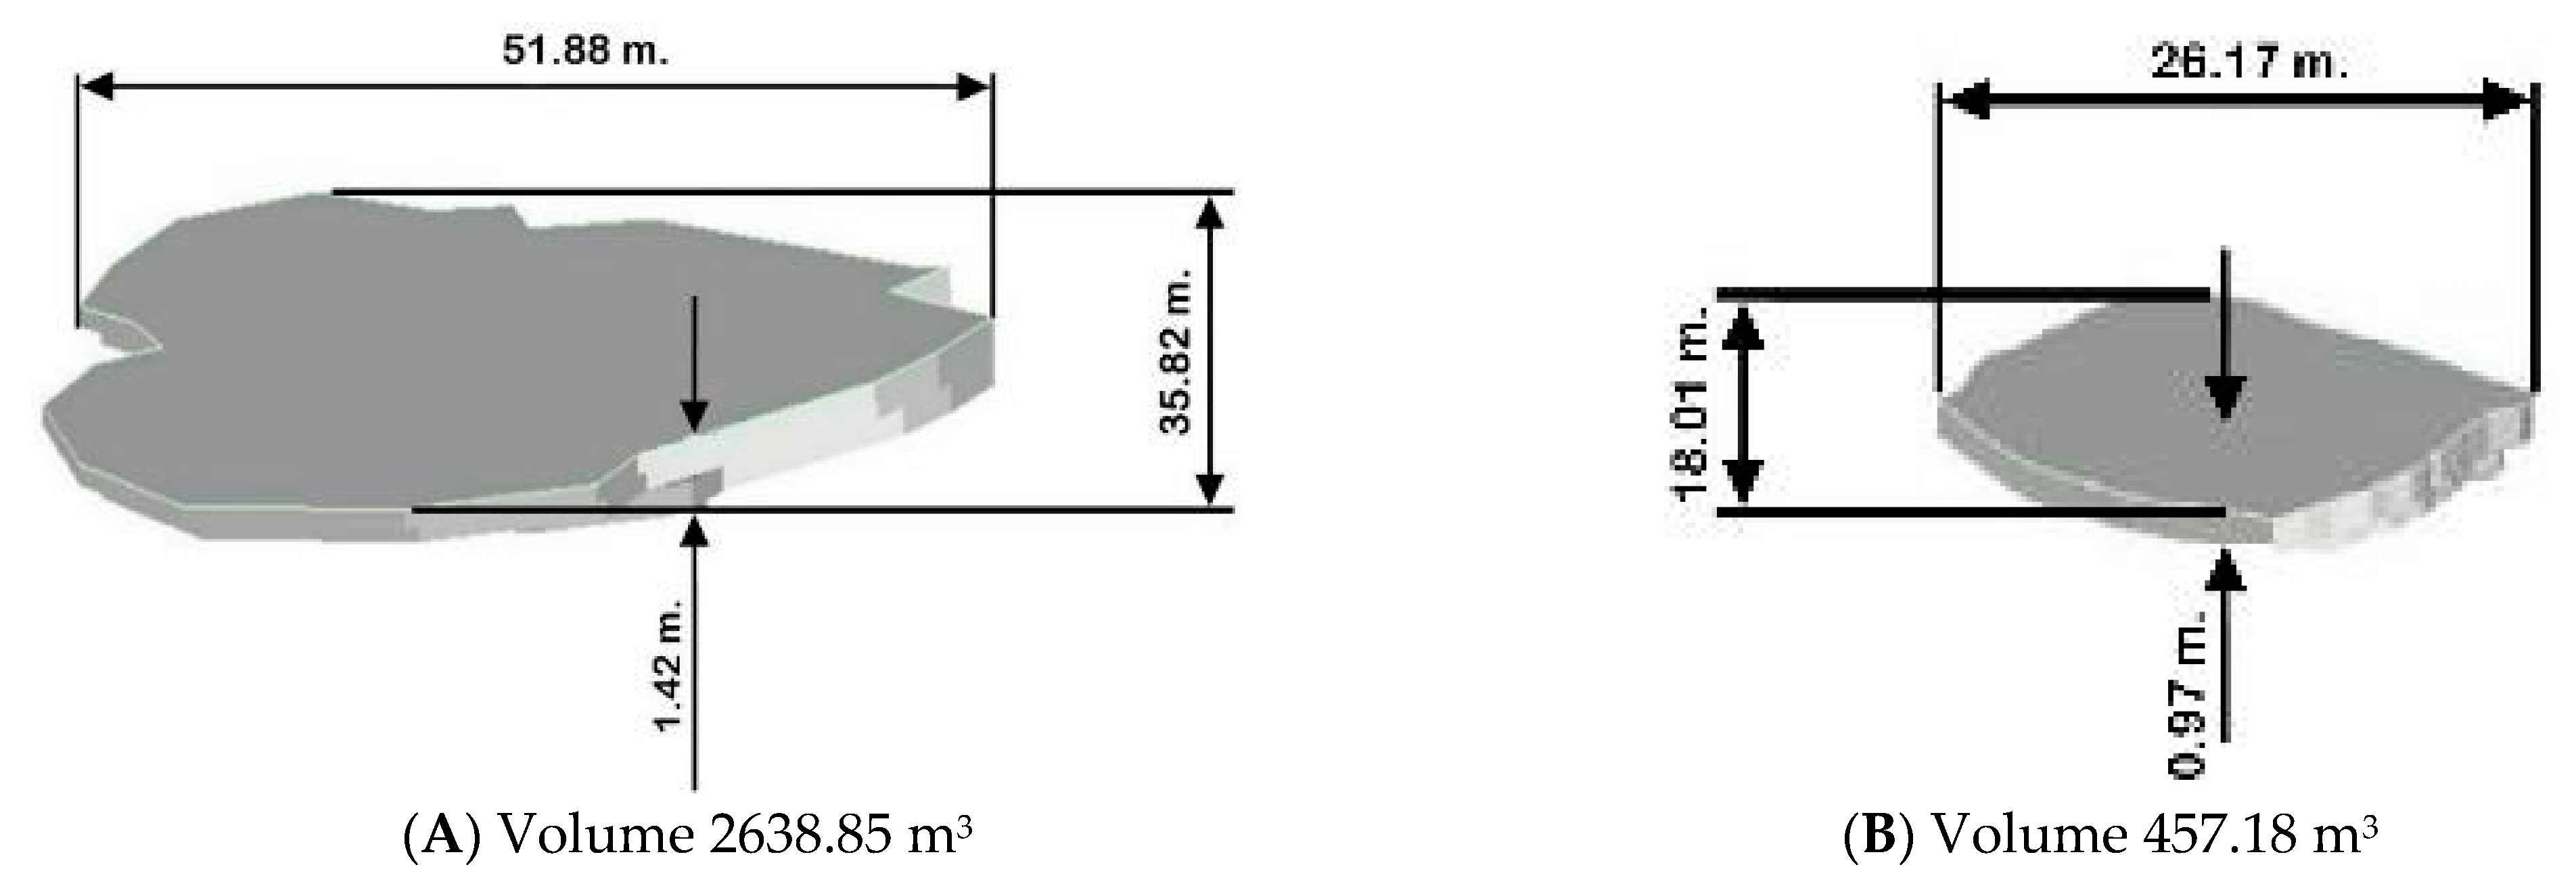
Figure 7 shows a perspective view of the modeled glacier, detailing its dimensions of extent and thickness. In Figure 7A, corresponding to September 2023, the maximum length is 51.88 m, measured horizontally along the longest part of the glacier, and the maximum width is 35.82 m, measured from the front to the back. The average thickness is 1.42 m, measured vertically from the base to the surface of the glacier. In Figure 7B, corresponding to January 2024, the maximum length was reduced to 26.17 m, maintaining the maximum width at 35.82 m, and the average thickness decreased to 0.97 m.
The three-dimensional models reveal the irregular shapes of the glaciers, characteristic of natural formations influenced by terrain variation and climatic conditions. This provides a comprehensive view of their size and shape. The calculated volume in September was 2638.85 m3, while in January it was 457.18 m3, which represents a reduction of 82.7%

3.4. Climate Data

Table 2 shows the weekly averages of seven climatic variables for September 2023 and January and February 2024. The maximum temperature increases progressively, with a notable peak in February (8.18 °C). Precipitation is highest in September (93–94 mm) and decreases in January (47–54 mm) and February (39–40 mm). Solar radiation reaches its maximum in February (16.14 kJ m−2 day−1) and its minimum in September (8.83 kJ m−2 day−1). Water vapor pressure shows moderate variations, with a maximum in January (0.67 kPa). Wind speed is highest in September (up to 14.87 m s−1) and decreases in the following months. Atmospheric pressure remains stable, with values between 606.38 and 617.15 hPa.

3.5. Principal Component Analysis

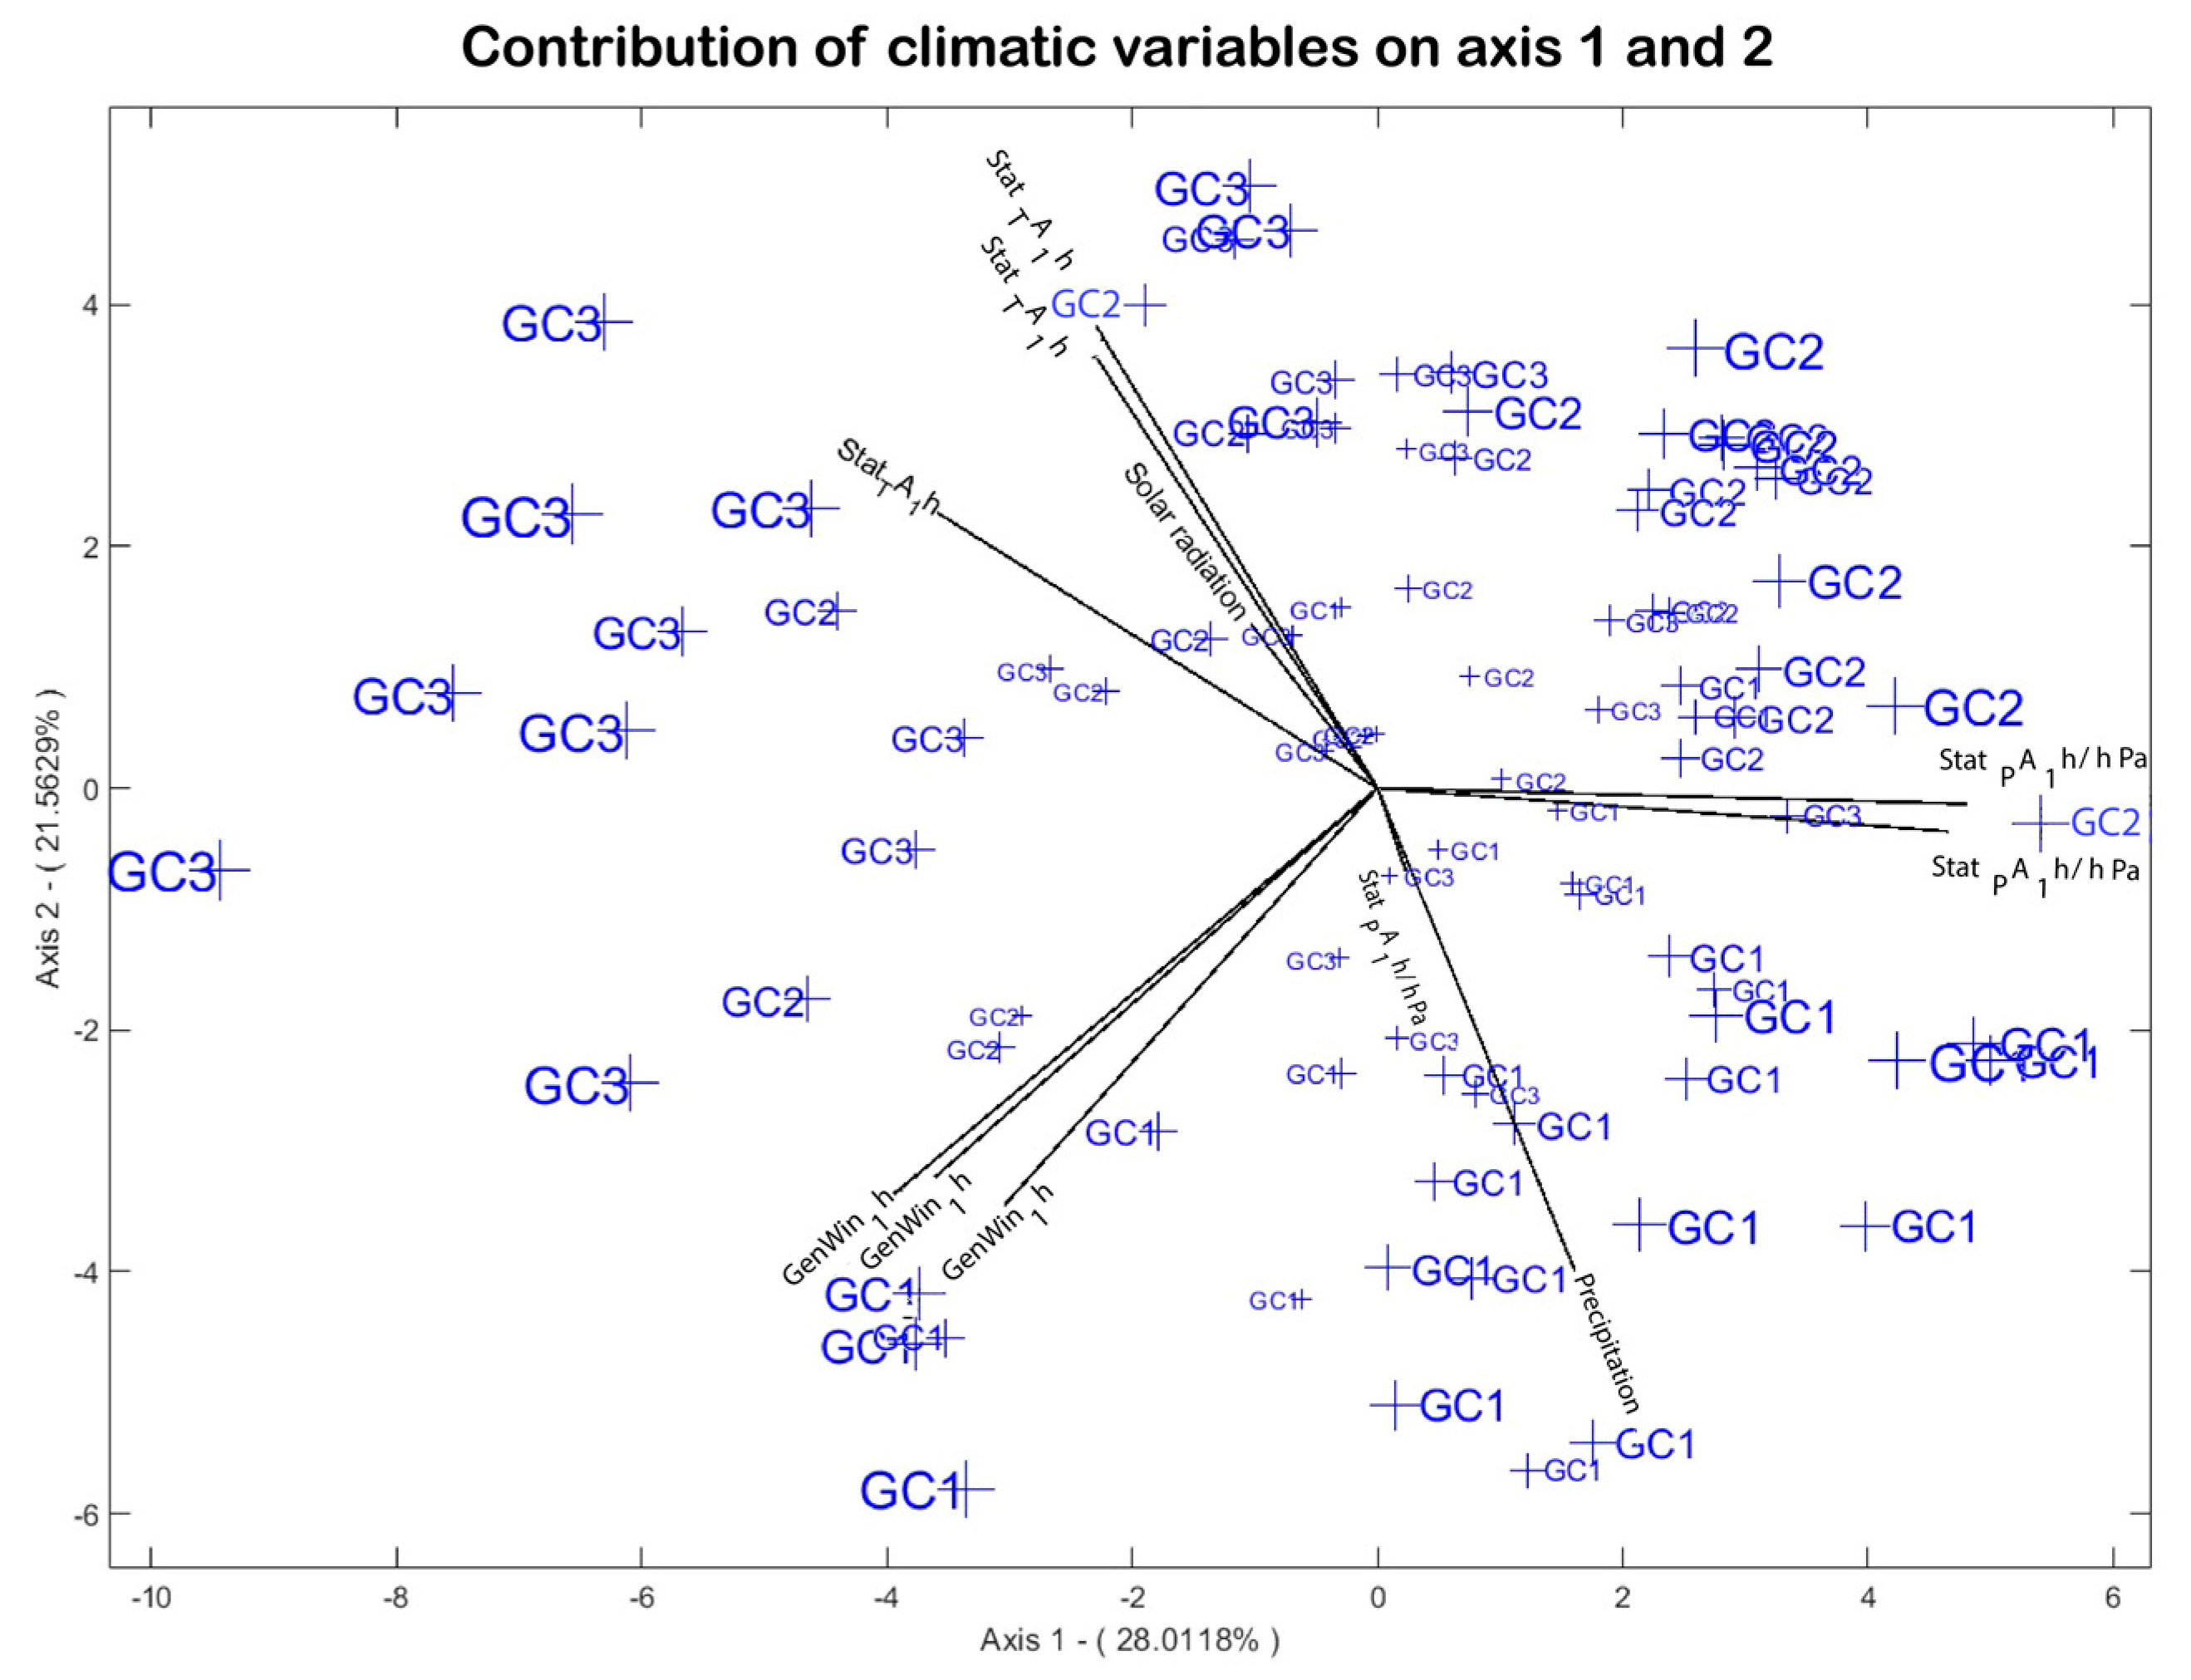
The PCA explains 70.261% of the total variance with the first four axes, which allowed a significant representation of the climatic patterns. PCA of the Carihuairazo glacier shows that axes 1 and 2 explain 49.57% of the total variance (28.012% and 21.563%, respectively). Axis 1 is significantly associated with the disappearance of the glacier (GC3) with high contributions from its rows, suggesting that it captures extreme climatic conditions, with high temperature or solar radiation (Figure 8), which could have led to the loss of the glacier. The rows of GC2 (transition phase) also contribute, but to a lesser extent, while GC1 (initial phase) has lower contributions. Axis 2, on the other hand, differentiates GC1, GC2, and GC3 measurements, with high contributions from GC1 and some from GC3. This indicates that axis 2 reflects more favorable preconditions for the glacier, such as higher precipitation or lower temperature, which characterized GC1 (Table 3).
Axes 3 and 4 contribute to explaining an additional 20.68% of the variance (11.24% and 9.4%, respectively), capturing secondary influences. Axis 3 shows significant contributions from GC2 and GC3, indicating that it reflects climatic variations in the transition phase (GC2) and disappearance (GC3), related to factors such as seasonal changes in precipitation or wind. GC1 has medium contributions, indicating a minor influence on this axis. Axis 4, with more dispersed contributions, seems to capture minor or specific effects of certain measurements, but its interpretation is less clear due to its smaller contribution to the variance (Figure 9). Overall, axes 1 and 2 are the most relevant for understanding glacier climate dynamics, while axes 3 and 4 provide complementary information on secondary variations.

3.6. Cluster Analysis

The correlation biclustering analysis of the Carihuairazo glacier data, covering the GC1, GC2, and GC3 phases, together with the different climatic variables, determines distinctive patterns of association. The heatmap with dendrograms identifies three observation clusters (Figure 10): (i) GC3 is characterized by high values of air temperature, solar radiation and vapor pressure (red tones), indicating a warm and dry environment that accelerated the disappearance of the glacier; (ii) GC1 presents high levels of precipitation and Gen_RH (red tones) with low values of Gen_temp and Solar_radiation (green tones), with cold and humid conditions that helped the stability of the glacier; and (iii) GC2 presents an intermediate pattern, with an increase in Gen_temp and Solar_radiation, and a decrease in precipitation and Gen_RH, reflecting a gradual climatic transition.
Additionally, variable clustering determined three correlated groups: Group 1 (Gen_temp, Solar_radiation, vapor_pressure) exhibits a strong positive correlation, with dominant values in GC3, suggesting that the joint increase in these variables may have been the main driver of melting; Group 2 (precipitation, Gen_RH) is associated with GC1, indicating that precipitation and relative humidity may have been determinants for ice accumulation; and Group 3 (Gen_wind) shows a heterogeneous pattern, having a complementary role in glacier dynamics.

4. Discussion

4.1. Monitoring

This research provides a scientific and empirical basis for the dramatic changes and disappearance of the Carihuairazo volcano glacier. Due to its small size, the glacier allowed the georeferencing and area quantification with a precision GPS, whereas studies in other latitudes, such as Antarctica, generally rely on remote sensing techniques [54] and GNSS to monitor the evolution of the glacier front over time [55,56]. While Kääb et al. [57], Belloni et al. [58], and Che et al. [59] highlighted the great potential of using RPAS for surveillance and direct georeferencing, John et al. [60] and Wang et al. [61] mention that remote sensing data pose difficulties in smaller-scale studies, requiring the integration of in situ data for product validation.
Indeed, globally, data on glacier thickness remain scarce, with only about 1000 of the 215,000 glaciers documented in the Glacier Thickness Database (GlaThiDa) [61]. To address this gap, several methods and tools have been developed to estimate glacier bed topography and thickness, such as GlabTop [62,63], as well as radar surveys along transects [64,65], and remote sensing using satellite data, including volume/area scale methods to generate a global dataset on ice thickness and volume [66]. Additionally, a machine learning algorithm has been used to estimate glacier thickness from surface features and flow dynamics [67]. The estimate made on the Carihuairazo glacier contributes to the availability of current data on the thickness of small tropical glaciers [20]; this information will also serve as a reference point for evaluating other mountain glaciers in the region, such as Illiniza Sur (5248 masl), which is currently nearing a critical tipping point [13].
The data on glacier area reduction obtained in this study complement the results of Cáceres and Cauvy [19], who studied the evolution of the Carihuairazo glacier between 1956 and 2011 using aerial images. Their study reported a decrease in glacier area from 333.422 m2 in 1956 to 234.249 m2 in 2003 (−29.7%), 143.456 m2 in 2010 (−57%), and 72.746 m2 in 2015 (−78.2%). Based on these trends, they projected its complete disappearance by 2025. The projection of these authors was quite accurate, as the results of this research show that the glacier disappeared in February 2024.
The 3D modeling allowed mapping the shape and size of the Carihuairazo glacier, showing irregular changes due to terrain and climatic conditions. This representation is similar to the one applied in the Greater Caucasus, which corrects for errors due to debris cover [68], and to the multispectral satellite mapping in Sikkim, India, to evaluate glacier flood risks [69,70]. In addition, high-resolution digital elevation models (DEMs), such as those used in the Tatra Mountains [71], and advanced techniques such as photogrammetry, laser scanning, and structure-from-motion (SfM) drones [72,73], have proven effective in accurately reconstructing the geometry and dynamics of glacier surfaces.
The analysis of climatic conditions on the Carihuairazo glacier indicates seasonal patterns during September 2023 and January and February 2024. The maximum temperatures, although characteristic of high mountains, favor melting. Precipitation, moderate in September and January, reaches a maximum in February, indicating snow accumulation or melting processes depending on temperatures. Solar radiation, a key factor in ablation, is highest in January and lowest in February, showing a greater thermal impact in January. Water vapor pressure, higher in January and lower in September, determines variations in humidity, while wind speed decreases from September to February, affecting erosion and ablation. The data show conditions that contribute to glacial retreat due to high solar radiation and maximum temperatures, which coincide with Hidalgo [9], who indicates that the months of February and November are the warmest, reaching average maximum temperatures of up to 14 °C [18].
The Carihuairazo glacier experienced a 92.2% reduction in area, decreasing from 1312.5 m2 in September 2023 to 101.2 m2 by January 2024. This aligns with the definition of a “glacierette” as proposed by Rocha and Caro [1], who define these as ice bodies smaller than 15 hectares. Consequently, its dimensions and rapid melt rate suggest the Carihuairazo exhibits glacierette characteristics [74].

4.2. Decrease in the Carihuairazo Glacier and Its Climatic Relationship

Historically, in the Carihuairazo, the mean annual temperature in the period of 1956 to 2022 was ~0.7 °C (range: −0.3 to 1.7 °C). It has shown a remarkable increase since 2012, with values above 1 °C between 2013 and 2017, while minimum temperatures, more frequent in the years 1956 to the 1990s, decreased over time [18]. Precipitation, with high variability (458–1281 mm, average ~770 mm), did not present a clear trend, with intervals of wet (1998, 2008) and dry (2003, 2013) years. Unlike the recent data of the present study, they lack specific mean or minimum temperatures, but the weekly maximum temperatures (peak of 8.18 °C in February 2024) and the decrease in precipitation (from 93–94 mm in September 2023 to 39–40 mm in February 2024) suggest an extreme thermal environment and unfavorable water conditions that intensified the ablation and ultimately the extinction of the glacier [19].
The interaction between climatic variables and glacial dynamics, as observed in the Carihuairazo glacier, highlights the importance of precipitation and relative humidity (Group 2: precipitation, Gen_RH) in ice accumulation during the initial GC1 phase, coinciding with previous studies that emphasize the protective role of precipitation. This occurs in the Chhota Shigri basin, where heavy snowfall during snowmelt increases albedo, reducing surface melting [75], and in the Tibetan Plateau, where snowfall reduces snowmelt [76]. Similarly, alterations in atmospheric circulation, as in the Tuyuksu glacier, modify summer precipitation, affecting ablation [77]. In southern Europe, intense summer rains accelerate ice loss [78], suggesting that the effect of precipitation is different according to the local and seasonal regime. On the other hand, wind (Group 3: Gen_wind) showed a heterogeneous pattern in Carihuairazo, with a complementary role in glacier dynamics, consistent with studies indicating that winds redistribute snow and alter the energy balance, influencing accumulation and melting in a topography-dependent manner [79].

4.3. Climate Patterns, Glacial Retreat, and Limitations of the Study

The correlation biclustering analysis of the Carihuairazo glacier identifies climatic patterns in the GC1, GC2, and GC3 phases, highlighting the influence of thermal and hydric variables. The GC3 cluster, with high values of temperature (Gen_temp), solar radiation (Solar_radiation), and vapor pressure (vapor_pressure), indicates a warm and dry environment, which probably hastened glacial retreat, as happened in the mass reduction of Greenland’s glaciers by an increase of 1.1 °C [80,81]. In contrast, GC1, with higher precipitation and relative humidity (Gen_RH) and low temperatures and radiation, reflects cold and wet conditions that favored ice accumulation, as in Himalayan glaciers, where heavy snowfall mitigates ice melt [82]. GC2 shows a gradual increase in thermal variables and a decrease in hydric variables, defining a climatic transition. Clustering of variables suggests that Group 1 (Gen_temp, Solar_radiation, vapor_pressure) promotes melting in GC3, Group 2 (precipitation, Gen_RH) sustains GC1, and Group 3 (Gen_wind) has a secondary role, related to snow redistribution by wind [83], similar to the phenomena in the Alps, where solar radiation-induced cloudiness reduces glacial melting [84].
The evaluation of the extent and thickness of the Carihuairazo glacier, and correlation with climatic variables, using biclustering and PCA, suggests that its disappearance in February 2024 was mainly driven by the increase in temperature and solar radiation, while precipitation and relative humidity favored its previous stability. There are similar patterns with global glacier retreat trends associated with climate change, such as Suyuparina in Peru [85] and Chacaltaya in Bolivia [86], which have experienced significant losses, with 93% volume retreats between 1940 and 1998 in the case of Chacaltaya, due to temperature increases and changes in precipitation patterns [78]. In Colombia, the glaciers of the Sierra Nevada del Cocuy show a marked decline due to increasing temperatures and alterations in snow accumulation [87], while in Venezuela, the Sierra Nevada de Mérida is on its way to becoming the first Andean region without glaciers, with accelerated retreats since 1952 [74]. The decrease in albedo, observed in the Andes through MODIS images between 2000 and 2015 [85], has promoted melting by reducing the reflectivity of solar radiation, a phenomenon also reported in the Himalayas [83]. In the case of Nevado Cayambe in Ecuador, its high sensitivity to climatic variations projects continued mass loss [18].
Data on rapid glacier changes provide critical insights for understanding and addressing climate change by analyzing past and future impacts through the study of glacier mass balance [88], the evolution of glacial lakes [89], and the reconstruction of historical climate events [90]. This information is essential for short-term water resources planning and the development of risk reduction strategies in the region.
The ecological repercussions of glacier loss significantly impact primary production, sedimentation, and biodiversity, altering aquatic and terrestrial biota, with changes in microbial communities reducing their diversity and disrupting biogeochemical cycles [91]. Although sediment reduction loads can initially benefit primary producers, this often leads to a net loss of biodiversity—particularly among specialized species—and alters food webs [92,93]. Additionally, the decrease in glacial cover modifies diatom and macroinvertebrate assemblages [94], and although local diversity may initially increase, the long-term trend in overall biodiversity is negative [95,96]. Thus, changes in sedimentation impact water quality and habitat availability, which reduces aquatic species richness [97].
Although this study did not include climate reanalysis for long periods prior to glacial contraction, we acknowledge the importance of atmosphere–fera–cryosphere interactions and their implications for local climate regulation as glaciers decrease in size. Studies such as those by Del Gobbo et al. [98] and Wei et al. [99] demonstrate how glacier expansion or contraction can alter patterns of precipitation, temperature, and water vapor fluxes, influencing local climatic conditions. For example, during the last phase of the Last Glacial Maximum, alpine glaciers experienced altered precipitation patterns and lower temperatures that determined summer snowfall at low elevations, coinciding with the estimated extent of glaciers in that period [100]. Something similar occurred on the Tibetan Plateau, where glacier/climate feedbacks may have influenced glacier volume, altering surface temperatures and precipitation by blocking water vapor flow [101].
The limitations of this study are mainly due to the short time window available to correlate glacier thickness and extent variables with climatic variables, which reduces the ability to identify long-term patterns and limits inferences about climate and glacier dynamics. The shortness of the glacier monitoring period could also affect the interpretation of results and the extrapolation of results. However, short-term monitoring of small glaciers could provide data for calibration and validation of remotely sensed observations, given the feasibility of their routing, measurement, and comprehensive assessment. For future work on Andean glaciers such as those of Chimborazo, incorporating climate reanalysis will achieve a deeper understanding of retreat patterns on broader time scales. This approach will contribute to more accurate projections for the conservation of water resources and high mountain ecosystems in the context of climate change.

5. Conclusions

This study of the Carihuairazo volcano glacier in the Ecuadorian Andes provides a disaggregated scientific basis that integrates georeferencing data, thickness measurements, 3D modeling, and multivariate analysis of climate data. In situ measurements confirmed previous projections that anticipated its disappearance by 2025, and with this new evidence, it is determined that the glacier vanished in February 2024. This rapid shrinkage classifies it as a glaciarette, due to its size and rapid rate of melting, and due to its reduced extent.
The rapid disappearance of the Carihuairazo glacier provides further evidence of global patterns of glacier retreat worldwide, alerting us to the vulnerability of small glaciers in the Tropical Andes to climate change, demonstrated by the disappearance of the Carihuairazo glacier, due to increased temperature and solar radiation coupled with decreased precipitation, which threatens the stability of these resources. The continued loss of glacier mass, further influenced by wind and precipitation dynamics, poses a serious risk to regional water security and the integrity of associated ecosystems.
These findings highlight the urgent need for immediate and effective management, resilience, and adaptation measures.

Author Contributions

Conceptualization: P.V.V.-C. and E.A.M.-J.; methodology, P.V.V.-C., E.A.M.-J.; software, D.F.C.-C., P.V.V.-C.; validation, E.A.M.-J. and M.L.V.-C.; formal analysis, D.F.C.-C. and E.A.M.-J.; research, P.V.V.-C., D.F.C.-C., E.A.M.-J., M.L.V.-C., and J.G.-C.; writing—editing of the original draft, P.V.V.-C., D.F.C.-C., and M.L.V.-C.; original drafting—editing, D.F.C.-C. and P.V.V.-C.; drafting—revising and editing, J.G.-C.; visualization, P.V.V.-C.; supervision J.G.-C. All authors have read and agreed to the published version of the manuscript.

Funding

This work was supported by the project “DIPI-003-Evaluation of the Andean glaciers of the Chimborazo and Carihuairazo volcanoes and their environmental, social, and cultural impact, through multivariate analysis”, funded by the Escuela Superior Politécnica de Chimborazo through the Deanery of Research (DDI-ESPOCH).

Data Availability Statement

The data presented in this study are available upon request from the corresponding author.

Conflicts of Interest

The authors declare no conflicts of interest.

References

  1. Quevedo-Tejada, D.; Landeros, E.; Olivares, D.; McPhee, J.; Caro, A.; Berroeta, C.; Fuentes, J. Dinámica de la contribución glaciar a la cuenca alta del río yeso durante el periodo de ablación 2017/2018. Aqua-LAC 2019, 11, 59–70. [Google Scholar] [CrossRef]
  2. Condom, T.; Suárez, W.; Cochachin Rapre, A.; Gómez, J. Variaciones Glaciares y Disponibilidad de Agua en la Cordillera Blanca del Perú Desde Hace 40 Años. Available online: https://hdl.handle.net/20.500.12542/2017 (accessed on 24 June 2025).
  3. Shen, Z.; Zhou, W.; Li, J.; Chan, J.C. A frequent ice-free Arctic is likely to occur before the mid-21st century. npj Clim. Atmos. Sci. 2023, 6, 103. [Google Scholar] [CrossRef]
  4. Zhang, Z.; Liu, L.; He, X.; Li, Z.; Wang, P. Evaluation on glaciers ecological services value in the Tianshan Mountains, Northwest China. J. Geogr. Sci. 2019, 29, 101–114. [Google Scholar] [CrossRef]
  5. Fagre, D.B. Chapter 1 Introduction: Understanding the Importance of Alpine Treeline Ecotones in Mountain Ecosystems. In Developments in Earth Surface Processes; Horáček, I., Ford, D.C., Bosák, P., Glazek, J., Eds.; Elsevier: Amsterdam, The Netherlands, 2009; pp. 1–9. [Google Scholar] [CrossRef]
  6. Clapperton, C.M. Glacial and volcanic geomorphology of the Chimborazo-Carihuairazo Massif, Ecuadorian Andes. Earth Environ. Sci. Trans. R. Soc. Edinb. 1990, 81, 91–116. [Google Scholar] [CrossRef]
  7. Dussaillant, I.; Berthier, E.; Brun, F.; Masiokas, M.; Hugonnet, R.; Favier, V.; Rabatel, A.; Pitte, P.; Ruiz, L. Two decades of glacier mass loss along the Andes. Nat. Geosci. 2019, 12, 802–808. [Google Scholar] [CrossRef]
  8. Vuille, M.; Carey, M.; Huggel, C.; Buytaert, W.; Rabatel, A.; Jacobsen, D.; Soruco, A.; Villacis, M.; Yarleque, C.; Timm, O.E.; et al. Rapid decline of snow and ice in the tropical Andes—Impacts, uncertainties and challenges ahead. Earth-Sci. Rev. 2018, 176, 195–213. [Google Scholar] [CrossRef]
  9. Hidalgo, D.; Domínguez, C.; Villacís, M.; Ruíz, J.C.; Maisincho, L.; Cáceres, B.; Crespo-Pérez, V.; Condom, T.; Piedra, D. Retroceso del glaciar del Carihuairazo y sus implicaciones en la comunidad de Cunucyacu. Granja Rev. Cienc. Vida 2024, 39, 92–115. [Google Scholar] [CrossRef]
  10. La Frenierre, J.; Mark, B.G. Detecting Patterns of Climate Change at Volcán Chimborazo, Ecuador, by Integrating Instrumental Data, Public Observations, and Glacier Change Analysis. Ann. Am. Assoc. Geogr. 2017, 107, 979–997. [Google Scholar] [CrossRef]
  11. Escobar, M.; Lima, N.; Purkey, D.; Yates, D.; Forni, L. Modelación hidrológica y escenarios de cambio climático en cuencas de suministro de agua de las ciudades la paz y el alto, Bolivia. Aqua-LAC 2013, 5, 23–34. [Google Scholar] [CrossRef]
  12. Cáceres, B.; Francou, B.; Favier, V.; Bontron, G.; Tachker, P.; Bucher, R.; Taupin, J.D.; Vuille, M.; Maisincho, L.; Delachaux, F.; et al. El glaciar 15 del Antisana investigaciones glaciológicas y su relación con el recurso hídrico. In Climate Variability and Change-Hydrological Impacts, Proceedings of the Fifth FRIEND World Conference, Havana, Cuba, 27 November–1 December 2006; IAHS Publ.: Oxfordshire, UK, 2006; Volume 308, pp. 479–482. Available online: https://iahs.info/uploads/dms/13707.87-479-482-29-308-BOLIVAR-CACERES.pdf (accessed on 20 June 2025).
  13. Jordan, E.; Ungerechts, L.; Cáceres, B.; Francou, B.; Peñafiel, A.; Francou, B. Estimation by Photogrammetry of the glacier recession on the Cotopaxi Volcano (Ecuador) between 1956 and 1997. Hydrol. Sci. J. 2005, 50, 949–961. [Google Scholar] [CrossRef]
  14. Cáceres, B.; Maisincho, L.; Taupin, J.D.; Francou, B.; Cadier, E.; Delachaux, F.; Bucher, R.; Villacis, M.; Paredes, D.; Chazarin, J.P.; et al. Glaciares del Ecuador: Antisana y Carihuayrazo. Available online: https://horizon.documentation.ird.fr/exl-doc/pleins_textes/divers11-03/010045458.pdf (accessed on 24 June 2025).
  15. Rhoades, R. Desaparición del glaciar Mama Cotacachi: Investigación etnoecológica y cambio climático en los Andes de Ecuador. Pirineos 2008, 163, 37–50. [Google Scholar] [CrossRef]
  16. Hastenrath, S. The Glaciation of Ecuadorian Andes; A.A. Balkema: Rotterdam, The Netherlands, 1981. [Google Scholar]
  17. Rabatel, A.; Machaca, A.; Francou, B.; Jomelli, V. Glacier recession on Cerro Charquini (Bolivia, 16°S) since the maximum of the Little Ice Age (17th Century). J. Glaciol. 2006, 52, 110–118. [Google Scholar] [CrossRef]
  18. Rabatel, A. Reconstruction et Interprétation Paléoclimatique des Fluctuations Glaciaires Dans les Andes de Bolivie (16°S) Depuis le Maximum du Petit Age Glaciaire. Ph.D. Thesis, Joseph Fourier University, Grenoble, France, 2005; 192p. Available online: https://www.persee.fr/doc/bagf_0004-5322_2011_num_88_1_8200 (accessed on 5 June 2025).
  19. Jomelli, V.; Favier, V.; Rabatel, A.; Brunstein, D.; Hoffmann, G.; Francou, B. Fluctuations of glaciers in the tropical Andes over the last millennium and palaeoclimatic implications: A review. Palaeogeogr. Palaeoclimatol. Palaeoecol. 2009, 281, 269–282. [Google Scholar] [CrossRef]
  20. Farinotti, D.; Huss, M.; Fürst, J.J.; Landmann, J.; Machguth, H.; Maussion, F.; Pandit, A. A consensus estimates for the ice thickness distribution of all glaciers on Earth. Nat. Geosci. 2019, 12, 168–173. [Google Scholar] [CrossRef]
  21. Schubert, C. The Glaciation of the Ecuadorian Andes. EOS 1982, 63, 835–836. [Google Scholar] [CrossRef]
  22. Cáceres, B. Evolución de los glaciares del Cotopaxi. In Actualización del Inventario de Tres Casquetes Glaciares del Ecuador; Université Nice Sophia Antipolis: Nice, France, 2010; Available online: https://core.ac.uk/download/pdf/39836084.pdf (accessed on 5 June 2025).
  23. Cáceres, B. Upgrade of the inventory for the Glaciers of Ecuador. In Actualización del Inventario de Tres Casquetes Glaciares del Ecuador; WGMS Fog 9-2000–2005; WGMS-UNESCO-PHI; Université Nice Sophia Antipolis: Nice, France, 2010; Available online: https://core.ac.uk/download/pdf/39836084.pdf (accessed on 24 June 2025).
  24. Sruoga, P.; Yamin, M.; Corvalan, M.; Kaufman, J.; Elissondo, M.; Craig, V.O.; Badi, G.; García, S. Late Pleistocene subglacial fissure-related volcanism at Caviahue-Copahue Volcanic Complex (37° 51° S, 71° 05’ W), South Volcanic Zone. J. S. Am. Earth Sci. 2021, 110, 103309. [Google Scholar] [CrossRef]
  25. Cáceres, B.; Cauvy, S. Carihuayrazo SW a Little Ecuadorian Glacier in the Way to Extinction; C13B-0812; INAMHI: Quito, Equador, 2015. [Google Scholar] [CrossRef]
  26. Francou, B.; Vuille, M.; Favier, V.; Cáceres, B. New evidences of ENSO impacts on glaciers at low latitude: Antizana 15, Andes of Ecuador, 0°28′. J. Geophys. Res. 2004, 109, D18106. [Google Scholar] [CrossRef]
  27. Zhao, F.; Gong, W.; Bianchini, S.; Yang, Z. Linking glacier retreat with climate change on the tibetan plateau through satellite remote sensing. EGUsphere 2024, preprint. [Google Scholar] [CrossRef]
  28. Robbins, E.; Hlaing, T.T.; Webb, J.; Kachouie, N.N. Supervised methods for modeling spatiotemporal glacier variations by quantification of the area and terminus of mountain glaciers using remote sensing. Algorithms 2023, 16, 486. [Google Scholar] [CrossRef]
  29. Scherler, D.; Wulf, H.; Gorelick, N. Global assessment of supraglacial debris-cover extents. Geophys. Res. Lett. 2018, 45, 11798–11805. [Google Scholar] [CrossRef]
  30. Ng, K.; Yap, S.; Cheng, K. Assessment of glacier mass balance in the himalayan-karakoram region. Quantum J. Soc. Sci. Humanit. 2022, 3, 60–71. [Google Scholar] [CrossRef]
  31. Bris, R.; Paul, F.; Frey, H.; Bolch, T. A new satellite-derived glacier inventory for western alaska. Ann. Glaciol. 2011, 52, 135–143. [Google Scholar] [CrossRef]
  32. Welty, E.; Zemp, M.; Navarro, F.; Huss, M.; Fürst, J.J.; Gärtner-Roer, I.; Landmann, J.; Machguth, H.; Naegeli, K.; Andreassen, L.M.; et al. Worldwide version-controlled database of glacier thickness observations. Earth Syst. Sci. Data Discuss. 2020, 12, 3039–3055. [Google Scholar] [CrossRef]
  33. Rivadeneira, S. Carihuairazo la montaña de la nieve con viento macho. Montaña 2011, 100, 12–25. [Google Scholar]
  34. Kabutov, H.; Kayumov, A.; Saks, T.; Navruzshoyev, H.; Vosidov, F.; Nekkadamovaa, N.; Halimov, A. Mass balance of glacier №139 in the eastern pamir’s lake karakul basin. Cent. Asian J. Water Res. 2022, 8, 128–140. [Google Scholar] [CrossRef]
  35. MAATE. Sistema Nacional de Áreas Protegidas SNAP. 2024. Available online: http://ide.ambiente.gob.ec/mapainteractivo/ (accessed on 4 October 2024).
  36. Honorable Gobierno Provincial del Tungurahua. Plan de Desarrollo y Ordenamiento Territorial—Tungurahua, 2019–2023. Available online: https://www.tungurahua.gob.ec/file/2020/07/PDyOT-TUNGURAHUA-2019-2023-Version-2.pdf (accessed on 24 June 2024).
  37. MAE. Borrador del Plan Manejo de la Reserva de Producción de Fauna Chimborazo; Ministerio del Ambiente, Dirección Nacional de Biodiversidad: Riobamba, Ecuador, 2019. [Google Scholar]
  38. Vaca, P.; Moscoso, M.; Vaca-Cárdenas, M. Analysis of Spectral Indices of Images Captured from an Unmanned Aerial Vehicle at the ANA Moyocancha Altitude Station. J. Surv. Fish. Sci. 2023, 10, 2979–2990. Available online: https://www.afjbs.com/uploads/paper/d3fde83e9178ed3e51b3a4fbb6c58772.pdf (accessed on 5 June 2025).
  39. Chang, K. Geographic Information System. In International Encyclopedia of Geography: People, the Earth, Environment and Technology; John Wiley & Sons: Hoboken, NJ, USA, 2017; pp. 1–9. [Google Scholar] [CrossRef]
  40. Ning, F. Site selection for offshore wind power farms with natural disaster risk assessment: A case study of the waters off taiwan’s west coast. Energies 2024, 17, 2711. [Google Scholar] [CrossRef]
  41. Gordon, S.; Sharp, M.; Hubbard, B.; Willis, I.; Smart, C.C.; Copland, L.; Ketterling, B. Borehole drainage and its implications for the investigation of glacier hydrology: Experiences from haut glacier d’arolla, switzerland. Hydrol. Process. 2001, 15, 797–813. [Google Scholar] [CrossRef]
  42. Mieloszyk, J.; Tarnowski, A.; Goetzendorf-Grabowski, T.; Kowalski, M.; Goliszek, B. Comparison of different fidelity mass analyses. Aircr. Eng. Aerosp. Technol. 2021, 93, 1229–1235. [Google Scholar] [CrossRef]
  43. Shin, D.; Park, J.; Shin, B.; Chung, M. Surface models of the male urogenital organs built from the visible korean using popular software. Anat. Cell Biol. 2011, 44, 151. [Google Scholar] [CrossRef]
  44. Ji, X.; Chen, Y.; Jiang, W.; Liu, C.; Yang, L. Cambios en el área de los glaciares en la cuenca del río Nu-jiang-Salween durante los últimos 45 años. J. Geogr. Sci. 2022, 32, 1177–1204. [Google Scholar] [CrossRef]
  45. Zhang, X.; Liu, L.; Zhang, Z.; Kang, Z.; Tian, H.; Wang, T.; Chen, H. Spatial and temporal variation characteristics of glacier resources in Xinjiang over the past 50 years. Water 2022, 14, 1057. [Google Scholar] [CrossRef]
  46. Lépez, H.R. Técnica de extracción, transformación y carga de datos de estaciones meteorológicas. Rev. Cienc. Tecnol. 2019, 32, 28–32. [Google Scholar] [CrossRef]
  47. Huang, X.; Bao, A.; Guo, H.; Meng, F.; Zhang, P.; Zheng, G.; Du, W. Cambios espaciotemporales de los glaciares típicos y sus respuestas al cambio climático en Xinjiang, noroeste de China. J. Arid Land 2022, 14, 502–520. [Google Scholar] [CrossRef]
  48. Pincebourde, S.; Sallé, A. On the importance of getting fine-scale temperature records near any surface. Glob. Change Biol. 2020, 26, 6025–6027. [Google Scholar] [CrossRef]
  49. Diaz, R.D.; Machaca, A.D.; Belizario, G.; Lujano, E. Effects of Climate Change on Mountain Ecosystems in the Carabaya Mountain Range-Peru. Rev. Bras. Meteorol. 2023, 38, e38230088. [Google Scholar] [CrossRef]
  50. Li, H.; Lin, C.; Wan, X.; Li, Z. Feature representation and similarity measure based on covariance sequence for multivariate time series. IEEE Access 2019, 7, 67018–67026. [Google Scholar] [CrossRef]
  51. Wu, J.; Zhang, M.; Chen, L. Mk-dcca-based fault diagnosis for incipient faults in nonlinear dynamic processes. Processes 2023, 11, 2927. [Google Scholar] [CrossRef]
  52. Guo, Y.; Schuurmans, D. Efficient global optimization for exponential family pca and low-rank matrix factorization. In Proceedings of the 2008 46th Annual Allerton Conference on Communication, Control, and Computing, Monticello, IL, USA, 23–26 September 2008; pp. 1100–1107. [Google Scholar] [CrossRef]
  53. Zhang, C.; Gai, K.; Zhang, S. Matrix normal pca for interpretable dimension reduction and graphical noise modeling. arXiv 2019, arXiv:1911.10796. [Google Scholar] [CrossRef]
  54. Palacio, F.X.; Apodaca, M.J.; Crisci, J.V. Análisis Multivariado Para Datos Biológicos: Teoría y su Aplicación Utilizando el Lenguaje R; Fundación de Historia Natural Félix de Azara: Buenos Aires, Argentina, 2020. [Google Scholar]
  55. Dağtekin, G.; Kılınç, A.; Çolak, E.; Ünsal, A.; Arslantaş, D. Classification of oecd countries in terms of medical resources and usage with hierarchical clustering analysis. Osman. J. Med. 2021, 44, 487–492. [Google Scholar] [CrossRef]
  56. Singh, A.; Sisley, K.; Xu, Y.; Li, J.; Faber, P.; Plummer, S.; Williams, B. Reduced expression of autotaxin predicts survival in uveal melanoma. Br. J. Ophthalmol. 2007, 91, 1385–1392. [Google Scholar] [CrossRef]
  57. Pandove, D.; Malhi, A. A correlation-based recommendation system for large data sets. J. Grid. Comput. 2021, 19, 42. [Google Scholar] [CrossRef]
  58. Stedman, M.; Lew, R.; Losina, E.; Gagnon, D.; Solomon, D.; Brookhart, M. A comparison of statistical approaches for physician-randomized trials with survival outcomes. Contemp. Clin. Trials 2012, 33, 104–115. [Google Scholar] [CrossRef]
  59. Tian, L.; Liu, Y.; Yi, Z.; Yan, L.; Gui, Z.; Li, H. Comparative research on the impact of correlation between clustering factors on land use zoning: A case study of linxiang, china. Appl. Mech. Mater. 2013, 295–298, 2481–2485. [Google Scholar] [CrossRef]
  60. Conway, J.; Abermann, J.; Andreassen, L.; Azam, M.; Cullen, N.; Fitzpatrick, N.; Sicart, J. Cloud forcing of surface energy balance from in situ measurements in diverse mountain glacier environments. Cryosphere 2022, 16, 3331–3356. [Google Scholar] [CrossRef]
  61. Andreassen, L.; Paul, F.; Kääb, A.; Hausberg, J. Landsat-derived glacier inventory for jotunheimen, norway, and deduced glacier changes since the 1930s. Cryosphere 2008, 2, 131–145. [Google Scholar] [CrossRef]
  62. Cielos, R.; Mata, J.; Galilea, A.; Alonso, M.; Cielos, P.; Navarro, F. Geomatic methods applied to the study of the front position changes of the front position changes of Johnsons and Hurd Glaciers, Livingston Island, Antarctica, between 1957 and 2013. Earth Syst. Sci. Data 2016, 8, 341–353. [Google Scholar] [CrossRef]
  63. Kääb, A.; Winsvold, S.; Altena, B.; Nuth, C.; Nägler, T.; Wuite, J. Glacier remote sensing using sentinel-2. part i: Radiometric and geometric performance, and application to ice velocity. Remote Sens. 2016, 8, 598. [Google Scholar] [CrossRef]
  64. Belloni, V.; Fugazza, D.; Rita, M. UAV-based glacier monitoring: GNSS kinematic track post-processing and direct georeferencing for accurate reconstructions in challenging environments. Int. Arch. Photogramm. Remote Sens. Spat. Inf. Sci. 2022, XLIII-B1-2022, 367–373. [Google Scholar] [CrossRef]
  65. Che, Y.; Wang, S.; Yi, S.; Wei, Y.; Cai, Y. Summer mass balance and surface velocity derived by unmanned aerial vehicle on debris-covered region of baishui river glacier no. 1, yulong snow mountain. Remote Sens. 2020, 12, 3280. [Google Scholar] [CrossRef]
  66. John, C.; Shilling, F.; Post, E. drptoolkit: An automated workflow for aligning and analysing vegetation and ground surface time-series imagery. Methods Ecol. Evol. 2021, 13, 54–59. [Google Scholar] [CrossRef]
  67. Wang, J.; Sun, W.; Zhang, J. Sea surface salinity products validation based on triple match method. IEEE J. Sel. Top. Appl. Earth Obs. Remote Sens. 2019, 12, 4361–4366. [Google Scholar] [CrossRef]
  68. Pozada Rengifo, R.; Bravo Toledo, L.; Iparraguirre Ayala, J.E. Retroceso glaciar y el valor de los servicios ecosistémicos asociados con el recurso hídrico en la cuenca Parón-Parque Nacional Huascarán (Cordillera Blanca), 2009–2018. Tecnol. Cienc. Agua 2023, 14, 76–121. [Google Scholar] [CrossRef]
  69. Campos, N. Revisión de procedimientos metodológicos para la reconstrucción glaciar y el cálculo de la altitud de la línea de equilibrio. Rev. De Geogr. Norte Gd. 2020, 76, 321–350. [Google Scholar] [CrossRef]
  70. Binder, D.; Brückl, E.; Roch, K.; Behm, M.; Schöner, W.; Hynek, B. Determination of total ice volume and ice-thickness distribution of two glaciers in the hohe tauern region, eastern alps, from gpr data. Ann. Glaciol. 2009, 50, 71–79. [Google Scholar] [CrossRef]
  71. Li, J.; Li, Z.; Zhu, J.; Li, X.; Xu, B.; Wang, Q.; Hu, J. Early 21st century glacier thickness changes in the central tien shan. Remote Sens. Environ. 2017, 192, 12–29. [Google Scholar] [CrossRef]
  72. Pelto, M.; Kavanaugh, J.; McNeil, C. Juneau Icefield Mass Balance Program 1946–2011. Earth Syst. Sci. Data Discuss. 2013, 6, 119–151. [Google Scholar] [CrossRef]
  73. Gacitúa, G.; Schneider, C.; Arigony, J.; Gonzalez, I.; Jaña, R.; Casassa, G. First ice thickness measurements in Tierra del Fuego at Schiaparelli Glacier, Chile. Earth Syst. Sci. Data. 2021, 13, 231–236. [Google Scholar] [CrossRef]
  74. Huss, M.; Farinotti, D. Distributed ice thickness and volume of all glaciers around the globe. J. Geophys. Res. Atmos. 2012, 117, F04010. [Google Scholar] [CrossRef]
  75. Steidl, V. Physics-aware machine learning for glacier ice thickness estimation: A case study for svalbard. EGUsphere, 2024; preprint. [Google Scholar] [CrossRef]
  76. Kutuzov, S.; Thompson, L.G.; Lavrentiev, I.; Tian, L. Ice thickness measurements of Guliya ice cap, western Kunlun Mountains (Tibetan Plateau), China. J. Glaciol. 2018, 64, 977–989. [Google Scholar] [CrossRef]
  77. Holobâcă, I.; Tielidze, L.; Ivan, K.; Elizbarashvili, M.; Alexe, M.; Germain, D.; Gaprindashvili, G. Multi-sensor remote sensing to map glacier debris cover in the greater caucasus, georgia. J. Glaciol. 2021, 67, 685–696. [Google Scholar] [CrossRef]
  78. Aggarwal, A.; Jain, S.; Lohani, A.; Jain, N. Glacial lake outburst flood risk assessment using combined approaches of remote sensing, gis and dam break modelling. Geomat. Nat. Hazards Risk 2013, 7, 18–36. [Google Scholar] [CrossRef]
  79. Thakuri, S.; Salerno, F.; Smiraglia, C.; Bolch, T.; D’Agata, C.; Viviano, G.; Tartari, G. Tracing glacier changes since the 1960s on the south slope of mt. everest (central southern himalaya) using optical satellite imagery. Cryosphere 2014, 8, 1297–1315. [Google Scholar] [CrossRef]
  80. Jiang, S.; Nie, Y.; Liu, Q.; Wang, J.; Liu, L.; Hassan, J.; Xia, X. Glacier change, supraglacial debris expansion and glacial lake evolution in the gyirong river basin, central himalayas, between 1988 and 2015. Remote Sens. 2018, 10, 986. [Google Scholar] [CrossRef]
  81. Rocha, A.S.; Caro, C.A. Análisis de señales de flujo en glaciares menores de 25 hectáreas: Propuesta de un nuevo umbral de área para glaciaretes. Rev. Geográfica Sur 2025, 11, 18–34. [Google Scholar] [CrossRef]
  82. Gan, R.; Luo, Y.; Zuo, Q.; Sun, L. Effects of projected climate change on the glacier and runoff generation in the naryn river basin, central asia. J. Hydrol. 2015, 523, 240–251. [Google Scholar] [CrossRef]
  83. Ali, S.; Shukla, A. An exigency for ice core studies to determine spatio-temporal variability in moisture sources and impact of black carbon-mineral aerosols on the himalayan glaciers. J. Atmos. Sci. Res. 2021, 4, 60–62. [Google Scholar] [CrossRef]
  84. Alexander, D.; Davies, T.; Shulmeister, J. Basal melting beneath a fast-flowing temperate tidewater glacier. Ann. Glaciol. 2013, 54, 265–271. [Google Scholar] [CrossRef]
  85. Fujita, K.; Hiyama, K.; Iida, H.; Ageta, Y. Self-regulated fluctuations in the ablation of a snow patch over four decades. Water Resour. Res. 2010, 46, W11541. [Google Scholar] [CrossRef]
  86. Leclercq, P.; Weidick, A.; Paul, F.; Bolch, T.; Citterio, M.; Oerlemans, J. Brief communication: Historical glacier length changes in west greenland. Cryosphere 2012, 6, 1339–1343. [Google Scholar] [CrossRef]
  87. Huss, M.; Funk, M.; Ohmura, A. Strong alpine glacier melts in the 1940s due to enhanced solar radiation. Geophys. Res. Lett. 2009, 36, L23501. [Google Scholar] [CrossRef]
  88. Tian, H.; Yang, T.; Liu, Q. Climate change and glacier area shrinkage in the qilian mountains, china, from 1956 to 2010. Ann. Glaciol. 2014, 55, 187–197. [Google Scholar] [CrossRef]
  89. Moon, T.; Joughin, I. Changes in ice front position on greenland’s outlet glaciers from 1992 to 2007. J. Geophys. Res. Atmos. 2008, 113, F02022. [Google Scholar] [CrossRef]
  90. Zhang, M.; Chen, F.; Guo, H.; Yi, L.; Zeng, J.; Li, B. Glacial lake area changes in high mountain asia during 1990–2020 using satellite remote sensing. Research 2022, 2022, 9821275. [Google Scholar] [CrossRef]
  91. Wang, H.; Chen, X.; Chen, J.; Yi, M. Arctic glacial lake area changes and its influencing factors under climate change: A case study of southwest greenland ice sheet. J. Phys. Conf. Ser. 2025, 2941, 012074. [Google Scholar] [CrossRef]
  92. Liu, K.; Yan, Q.; Guo, X.; Wang, W.; Zhang, Z.; Ji, M.; Wang, F.; Liu, Y. Glacier retreat induces contrasting shifts in bacterial biodiversity patterns in glacial lake water and sediments. Microb. Ecol. 2024, 87, 128. [Google Scholar] [CrossRef]
  93. Fodelianakis, S.; Washburne, A.D.; Bourquin, M.; Pramateftaki, P.; Kohler, T.J.; Styllas, M.; Tolosano, M.; De Staercke, V.; Schön, M.; Busi, S.B.; et al. Microdiversity characterizes prevalent phylogenetic clades in the glacier-fed stream microbiome. Isme J. 2021, 16, 666–675. [Google Scholar] [CrossRef]
  94. Milner, A.M.; Khamis, K.; Battin, T.J.; Brittain, J.E.; Barrand, N.E.; Füreder, L.; Cauvy-Fraunié, S.; Gíslason, G.M.; Jacobsen, D.; Hannah, D.M. Glacier shrinkage driving global changes in downstream systems. Proc. Natl. Acad. Sci. USA 2017, 114, 9770–9778. [Google Scholar] [CrossRef] [PubMed]
  95. Losapio, G.; Cerabolini, B.; Maffioletti, C.; Tampucci, D.; Gobbi, M.; Caccianiga, M. The consequences of glacier retreat are uneven between plant species. Front. Ecol. Evol. 2021, 8, 616562. [Google Scholar] [CrossRef]
  96. Fell, S.; Carrivick, J.; Brown, L. The multitrophic effects of climate change and glacier retreat in mountain rivers. Bioscience 2017, 67, 897–911. [Google Scholar] [CrossRef]
  97. Stibal, M.; Bradley, J.A.; Edwards, A.; Hotaling, S.; Zawierucha, K.; Rosvold, J.; Lutz, S.; Cameron, K.A.; Mikucki, J.A.; Kohler, T.J. Glacial ecosystems are essential to understanding biodiversity responses to glacier retreat. Nat. Ecol. Evol. 2020, 4, 686–687. [Google Scholar] [CrossRef] [PubMed]
  98. Tu, B.N.; Khelidj, N.; Cerretti, P.; de Vere, N.L.; Ferrari, A.; Paone, F.; Polidori, C.; Schmid, J.; Sommaggio, D.; Losapio, G. Glacier retreat erodes plant–insect interaction diversity. Alp. Bot. 2023, 134, 171–182. [Google Scholar] [CrossRef]
  99. Bosson, J.B.; Huss, M.; Cauvy-Fraunié, S.; Clément, J.C.; Costes, G.; Fischer, M.; Poulenard, J.; Arthaud, F. Future emergence of new ecosystems caused by glacial retreat. Nature 2023, 620, 562–569. [Google Scholar] [CrossRef]
  100. Del Gobbo, C.; Colucci, R.R.; Monegato, G.; Žebre, M.; Giorgi, F. Atmosphere–cryosphere interactions during the last phase of the Last Glacial Maximgum (21 ka) in the European Alps. Clim. Past 2023, 19, 1805–1823. Available online: https://cp.copernicus.org/articles/19/1805/2023/cp-19-1805-2023.html (accessed on 5 June 2025). [CrossRef]
  101. Wei, Q.; Liu, Y.; Yan, Q.; Yao, T.; Wang, M.; Huang, H.; Hu, Y. The Glacier-Climate Interaction Over the Tibetan Plateau and Its Surroundings During the Last Glacial Maximum. Geophys. Res. Lett. 2023, 50, e2023GL103538. [Google Scholar] [CrossRef]
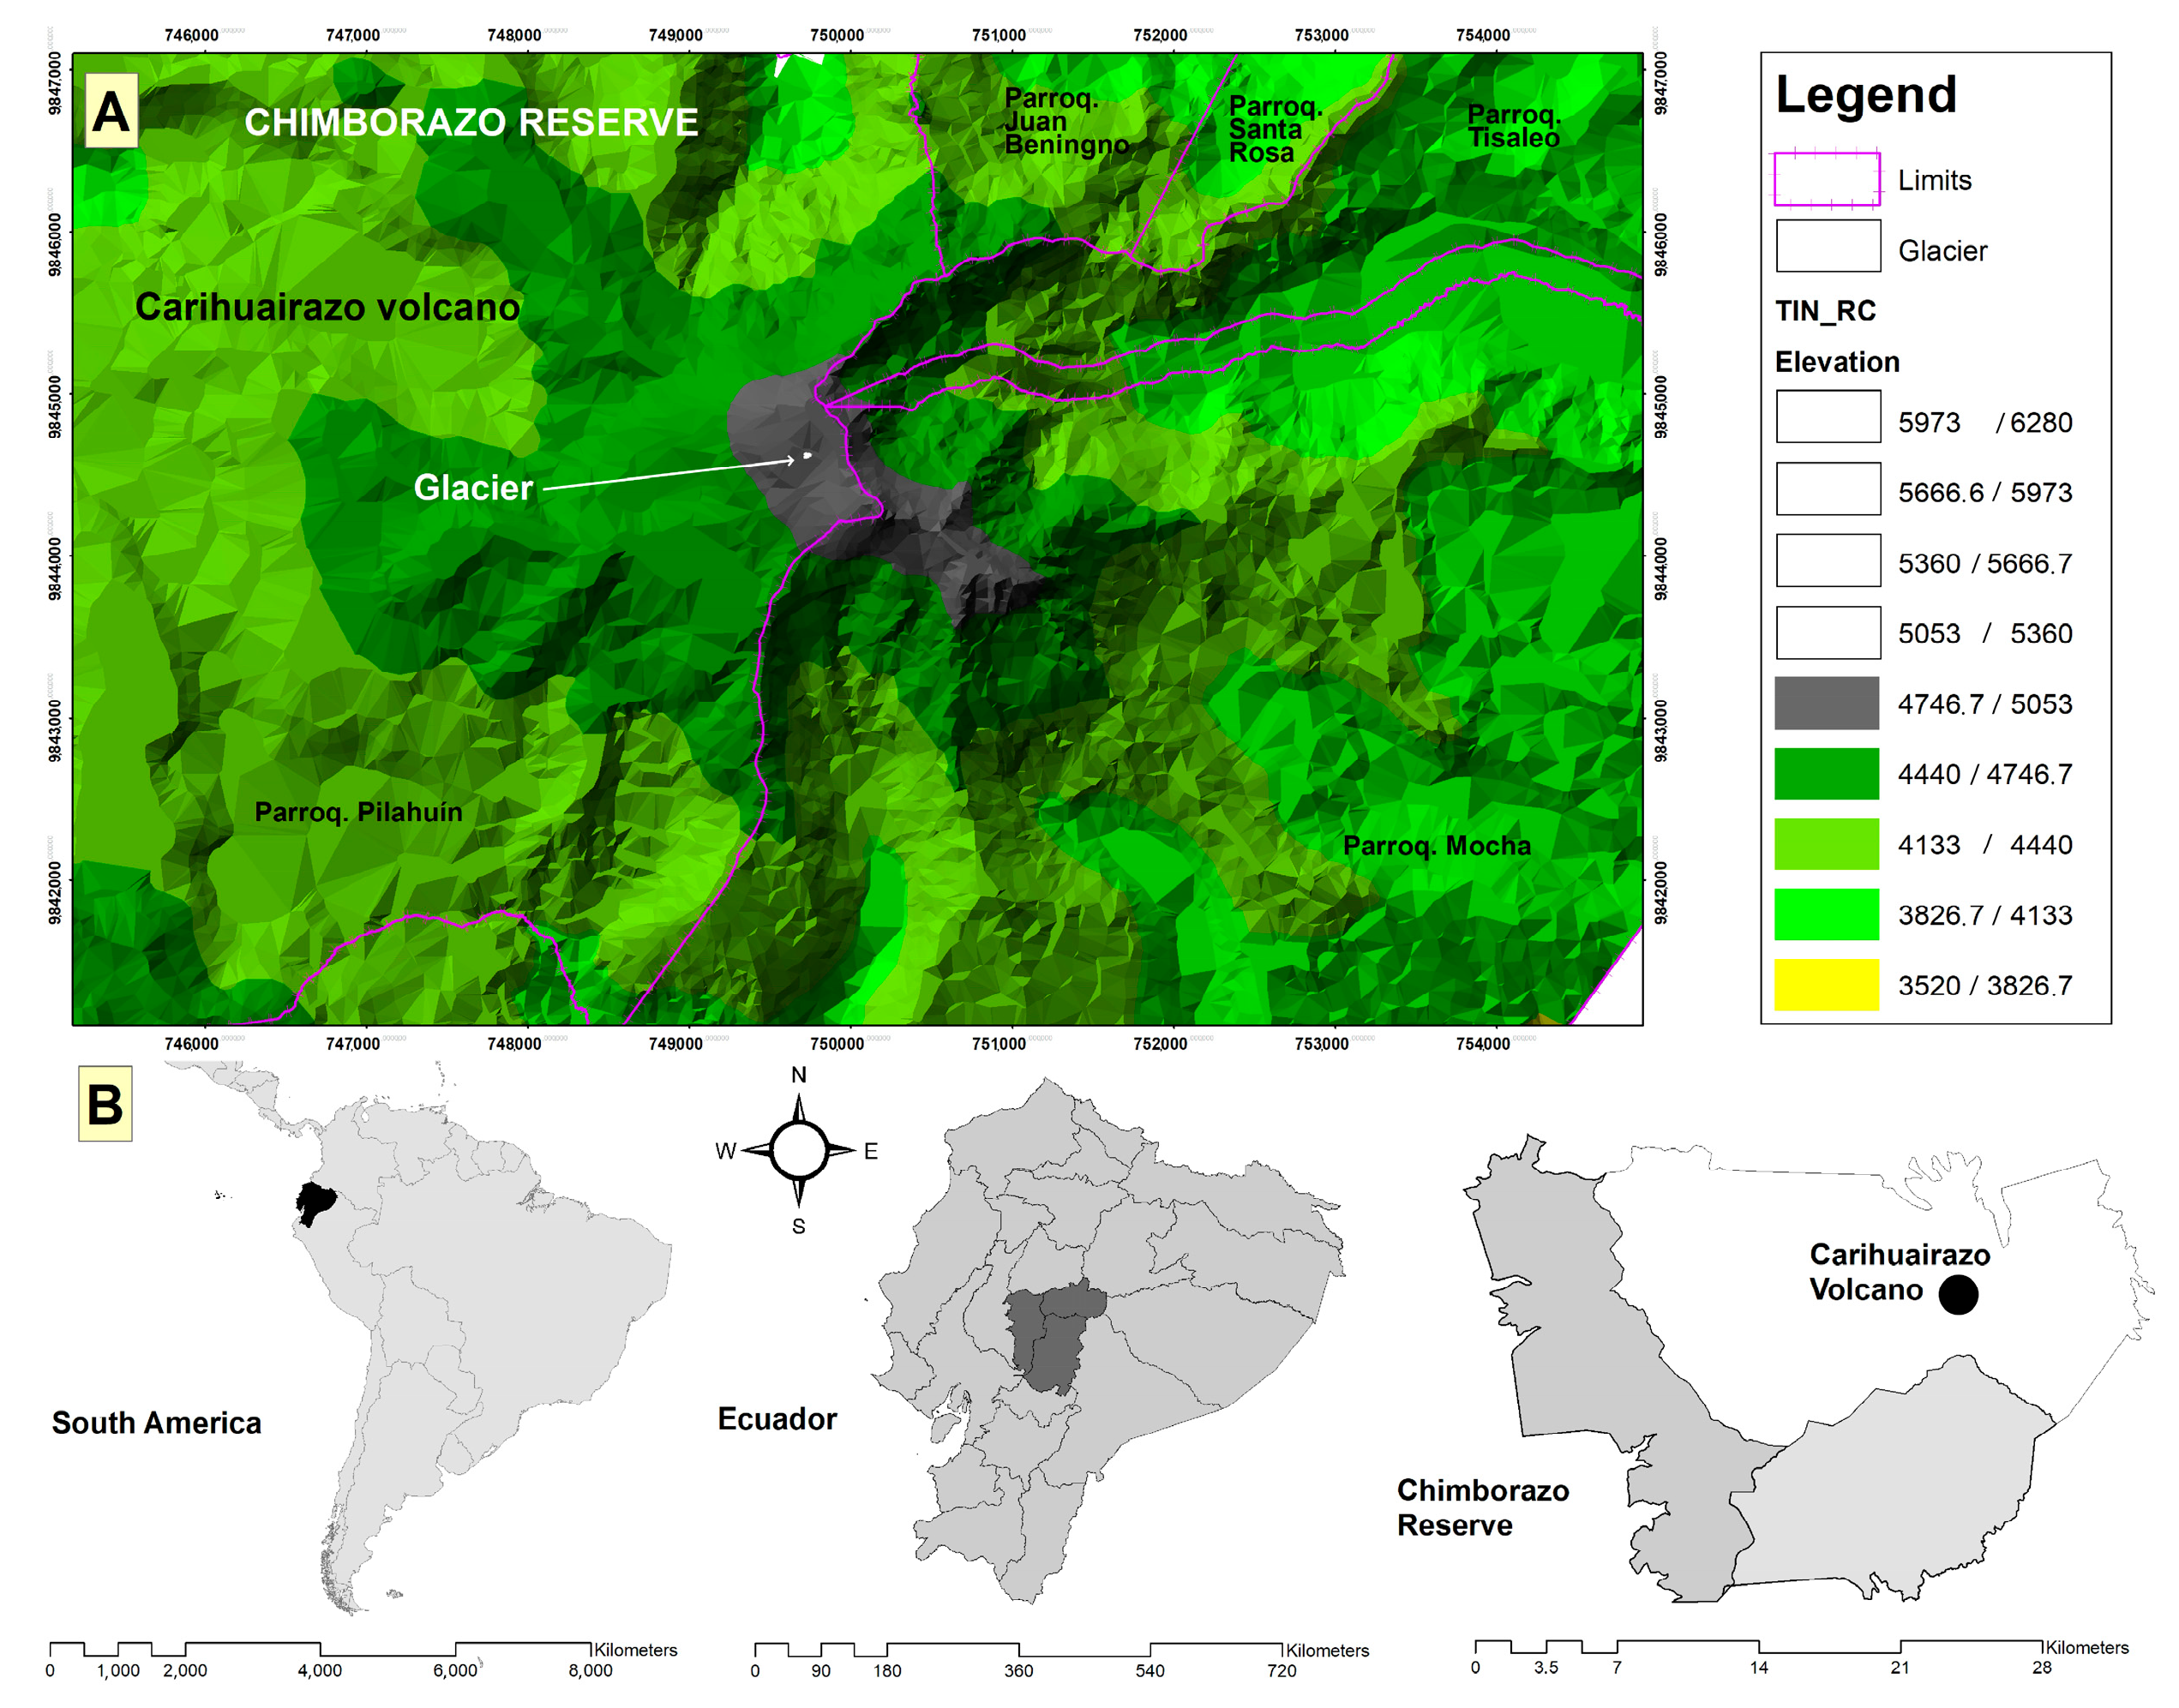
Figure 1. (A) Geographical location of the glacier in reference to the volcanic edifice; (B) Location of the study area in South America (black area: country Ecuador), the territory of Ecuador (gray area: provinces of Chimborazo, Tungurahua, and Bolivar; black area: Chimborazo Reserve) and the Chimborazo Reserve (gray areas: territory of the provinces of Chimborazo and Bolivar in the protected area and white area: province of Tungurahua where Carihuairazo is located).
Earth 06 00086 g001
Figure 2. Panoramic view of the southwest face of the Carihuairazo volcano, showing the different summits and the location of the glacier under study (circled in blue).
Earth 06 00086 g002
Figure 3. (A) Map of sampling 8 × 8 m cells on the glacier in September 2023. Only 10 cells whose surface is completely on the glacier were assigned letters as measurement points; (B) Map of the cells with the 4 measurement points corresponding to January 2024. Map of sampling cells on the glacier in January 2024. Only 4 cells whose surface is completely on the glacier were assigned letters as points for the second measurement.
Earth 06 00086 g003
Figure 4. Glacier profile and thickness measurement process in September 2023.
Earth 06 00086 g004
Figure 5. (A) Area of the glacier in the September 2023 measurement (blue line), (B) aerial view of the glacier during the January 2024 measurement, and (C) same location of the glacier in February 2024.
Earth 06 00086 g005
Figure 6. Georeferenced glacier areas September 2023 (light green) and January 2024 (dark green).
Earth 06 00086 g006
Figure 7. Three-dimensional modeling of the glacier for September 2023 (A) and January 2024 (B).
Earth 06 00086 g007
Figure 8. Analysis of the contribution of climatic variables on axes 1 and 2. GC1, GC2, and GC3 represent the glacier cover in September 2023, January 2024, and February 2024, respectively.
Earth 06 00086 g008
Figure 9. Analysis of the contribution of climatic variables on axes 3 and 4. GC1: glacier cover 1; GC2: glacier cover 2; GC3: glacier cover 3, which represent the glacier cover in September 2023, January 2024, and February 2024, respectively.
Earth 06 00086 g009
Figure 10. Cluster analysis, phases: GC1 (initial), GC2 (transition), and GC3 (disappearance), where red (+2) indicates high values (warm/dry conditions, predominant in GC3); green (−3) indicates low values (cold/wet conditions, prominent in GC1). The x-axis represents glacial phases and associated conditions; the y-axis shows climatic variables grouped by correlation.
Earth 06 00086 g010
Table 1. Measurement of the area, snow cover (%), and glacier depth of the Carihuairazo volcano from September 2023 and February 2024. A–J represents the different points where the variables were calculated, as shown in Figure 3.
Glacier Monitoring of the Carihuairazo Volcano
Date Área (m2)Snow Cover %Depth (m)
ABCDEFGHIJ
M1SeptemberGlacier1312.51001.211.181.422.501.441.050.781.392.091.14
Snow 0.410.350.370.400.360.340.330.400.360.31
M2JanuaryGlacier101.27.8--0.961.320.89---0.71-
Table 2. Climate variables. A weekly summary of the climate and glacier data monitored is presented. Although the analysis was based on daily averages, the weekly compilation facilitates the visualization of temporal trends by variable. The columns details are air temperature (Stat_TA; hourly mean, maximum and minimum in °C); atmospheric pressure (Stat P; hourly mean, maximum and minimum in hpa); wind speed (GenWi; hourly minimum, mean and maximum in km/h); precipitation (PP; mm); solar radiation (SR; kj m−2 day−1); water vapor pressure (WVP; kpa); and glacier coverage (GC; m2).
DateStat_TA_1hStat_TA_1hStat_TA_1hStat_P
1 h/hPa
Stat_P
1 h/hPa
Stat_P
1 h/hPa
GenWind_1h (km/h)GenWind_1h (km/h)GenWind_1h (km/h)PPSRWVP GC
Avg/C°Max
/C°
Min
/C°
AvgMaxMinMinAvgMax(mm)(kj m−2
day−1)
(kPa)(m2)
23 SeptemberW11.323.231.29617.15607.67607.017.8114.718.2193.719.500.431312.50
W20.12.931.21608.36608.24607.727.3810.9015.4394.2912.040.51
W31.652.030.86608.12608.22607.732.916.5917.3693.7111.930.49
W41.232.271.15607.61608.01607.493.898.5113.3494.2913.260.57
W51.982.201.04607.92608.17607.712.263.448.7693.338.830.30
24 JanuaryW12.282.351.94608.19608.40607.880.782.466.8247.1410.000.43101.20
W22.443.461.47608.36608.33607.800.702.606.7347.8612.430.62
W31.583.191.66607.09607.48606.971.254.747.8947.1413.140.50
W41.863.151.05606.38606.77606.093.408.5014.1147.1414.450.57
W52.533.432.34607.14607.42606.901.133.296.7954.339.000.67
24 FebruaryW12.034.211.48606.85606.96606.337.8912.4918.1839.7111.020.430
W23.955.713.11615.31606.91606.286.2711.3416.2840.2913.230.52
W33.783.853.18607.30607.59607.081.603.806.9039.7116.140.51
W42.453.352.21608.23608.34607.813.968.4612.4040.2914.580.57
W51.368.180.43607.46607.53606.991.316.709.8540.0011.000.40
Table 3. Contributions of the variables to the 4 axes.
VariablesAxis 1Axis 2Axis 3Axis 4
Stat_TA_1h1614481446
Stat_TA_1h396160822
Stat_TA_1h16038717565
Stat_PA_1h/hPa21559351
Stat_PA_1h/hPa66342333
Stat_PA_1h/ hPa70912143
GenWind_1h399318907
GenWind_1h476346190
GenWind_1h2843652521
Precipitation (PP)79489901
Solar radiation (SR)33570473
Water vapor pressure (WVP) 00219201
Disclaimer/Publisher’s Note: The statements, opinions and data contained in all publications are solely those of the individual author(s) and contributor(s) and not of MDPI and/or the editor(s). MDPI and/or the editor(s) disclaim responsibility for any injury to people or property resulting from any ideas, methods, instructions or products referred to in the content.