Abstract
The Port of Veracruz, the main port in the Gulf of Mexico, has experienced a significant increase in its import and export operations, such as petroleum coke (Petcoke), a solid waste, mainly used in the steel industry. During the period of 2010–2023, approximately 7,401,594 tons of coke were stored outdoors, generating PM10 particulate emissions due to wind erosion. These particles were dispersed to urban areas, reaching an estimated total emission of 5077 tons. The study used geospatial analysis and environmental modeling tools (ALOHA®) to evaluate the dispersion and concentration of PM10 in the atmosphere, comparing them with the limits established by the Mexican Official Standard NOM-025-SSA1-2021. The results indicate that in years with high port activity, such as 2014, PM10 concentrations exceeded the normative values, representing a potential risk to public health and urban infrastructure. This study provides critical evidence on the environmental impacts of coke handling in ports and suggests mitigation strategies, including processes for the confinement of materials and the implementation of advanced emissions monitoring systems.
1. Introduction
In Mexico, the port of Veracruz is part of the National Port System, and is considered the largest port in the Gulf of Mexico. It is the main entry and exit point for imports and exports to Europe, the southern United States and South America, and is the most important port for handling agricultural bulk, mineral bulk, automobiles, and fluids, such as petroleum and its derivatives [1].
Petroleum coke is a solid black waste, with high carbon content, and residual compounds, such as sulfur, and trace metals; it is widely used in the steel industry, steel production, power generation, and cement production [2,3]. By the effect of winds, it is eroded and generates particles smaller than 10 µm that have the potential to enter the respiratory system and cause risks to human health, especially in populations near storage areas [4].
Coke handling in the port of Veracruz is performed with open-air storage in the form of piles, which, during periods of dry weather conditions and perennial winds, generates volatile PM10 particles that move into the surrounding urban areas, increasing air pollution [5].
The Mexican Official Standard [6] establishes concentration limits for PM10 in ambient air to protect public health, suggesting that exposures above concentrations of 70 µg/m3 in a 20 h period or 36 µg/m3 in annual average may have adverse consequences and relevant actions must be taken to safeguard the population [6].
In recent years, the use of Geographic Information Systems (GISs) and remote sensing techniques have made it possible to analyze and monitor environmental changes in coastal and port areas, provide data on coke storage and its volatile particulate emissions [7,8].
The ALOHA® (Area Locations of Hazardous Atmospheres) software generated by the Environmental Protection Agency of the United States of America (US-EPA) has been used to evaluate the risks posed by chemical leaks in containers and tanks in hydrocarbon storage and deposit stations, contaminating plumes from fixed sources, as well as to establish safety perimeters for the population and the environment [9].
This program is based on the solution of the general convection–diffusion–deposition equation, in which all the mechanisms of the atmosphere acting on a release of a pure substance or mixture can be used to determine the concentration at a given distance, as well as its expected direction in time [10]; this tool facilitates the evaluation of the environmental impact of industrial operations [11].
The ALOHA® is a tool used in vulnerability and environmental impact assessment for risks and emergencies, as well as for emergency planning at the municipal, regional, and national levels. It achieves the development of adequate planning, facilitates the identification of potential risks, evaluates risk control measures, and adequate treatment of waste products, and provides technical analysis support in decision making [12].
The calculation of the toxic cloud takes into account key characteristic elements: at what height the toxic substance is released into the air, the wind direction and speed, and the meteorological conditions at the site of the emergency. The most common elevation is 0 m. If the actual use case contemplates movement of a tanker truck around a building, the most conservative approach can be taken as to where the point of release is located based on the geographic point through which the truck is traveling. There are two alternatives: (a) the gas is released on the southeast side of the building and (b) the gas is released on the west side of the building. The scenario of where to deploy ALOHA® is generic and therefore can be applied equally for all latitudes and longitudes of the world. The program will evaluate the location where the event occurs [13].
ALOHA® uses behavioral criteria of gas emission components in the air, considering the local weather conditions, and determines the emission rate and establishes the safety parameters through the Protective Action Criteria (PAC) in which three levels are managed:
- PAC 1: Level that could cause only transitory or temporary effects.
- PAC 2: Level that could have permanent effects.
- PAC 3: Level that could cause death.
This facilitates the evaluation of the environmental impact of port operations and makes it possible to identify the relationship between the volume of emissions and their concentration at a given time [10].
The main objective of this study is to quantify the volume of PM10 particulate matter emissions derived from petroleum coke storage in the port of Veracruz and to analyze their impact on the surrounding urban environment. To do so, geospatial analysis and environmental modeling tools were used, comparing emission levels and concentrations with the limits established by the Mexican Official [6]. This research provides a baseline, which contributes to scientific knowledge on port environmental management in Mexico, and also provides the design of mitigation strategies to minimize the risks associated with the handling of bulk materials.
By proposing a methodology based on the use of advanced tools such as ALOHA® (Version 5.4.7) and Google Earth Pro® (Version 7.3.6.10201 (64-bit)), this study seeks to establish a replicable approach for emissions monitoring and environmental management in high-activity ports. The relevance of the findings lies in their potential to inform public policy and promote the adoption of sustainable practices in port operations, protecting both local communities and the environment.
2. Materials and Methods
2.1. Study Area
The port of Veracruz is located on the central coast of the state of Veracruz, Mexico, and is divided into two main operational areas (Figure 1).
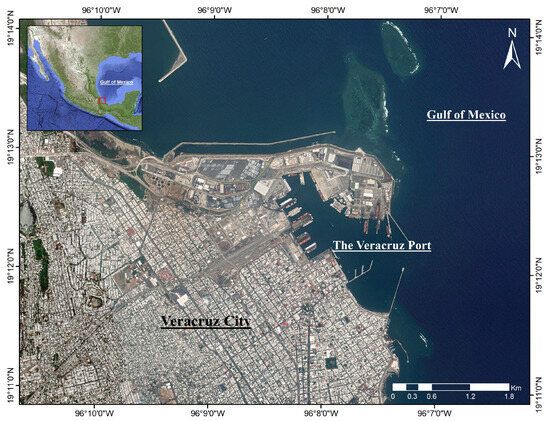
Figure 1.
The Port of Veracruz in the Gulf of Mexico.
South Bay with 18 berths at coordinates 19°12′40.68″ North latitude and 96°8′11.19″ West longitude, North Bay or Vergara Bay, whose expansion is projected to be completed by the year 2030, and which will have 35 new berths at coordinates 19°14′05.16″ North Latitude and 96°10′02.75″ West Longitude.
The purpose of defining the study area and locating it at the coordinates described is because the bulk mineral unloading port is located there, where petroleum coke is considered within this classification. It is left exposed to the elements. Residents of the surrounding areas have noted that it contains, as they describe it, a black, itchy powder that is difficult to remove and stains floors, clothing, and other exposed items. Therefore, the purpose of the investigation was to determine which material, or bulk mineral fell within this description. This perception, on the part of the nearby population, allowed us to identify and thus determine our object of study [14].
The predominant climate in the region, according to Köeppen’s classification modified by E. Garcia for the climates of Mexico, the climate of the municipality of Veracruz is A(w1), warm and sub-humid with abundant and intense rainfall in summer, in the order of 1500 mm where there is a short dry season and its average annual temperature oscillates around 26 °C, with an average atmospheric pressure of 1013 hPa and relative humidity of 54% and an average air volume of 3500 m3/h [15,16].
2.2. Methodology
2.2.1. Data Collection
For this study, a historical database on the volume of coke imported through the port of Veracruz in the period from 2010 to 2023, from the National Port System Administration (ASIPONA), available from public sources, was used. Historical images from Google Earth Pro® were used to identify coke storage areas in the port terminals. These images were analyzed to measure the extent of the storage piles for a 13-year period. Historical data on temperature, wind speed and air flow were obtained from the Meteoblue® platform, ensuring consistency and validity in the models used.
2.2.2. Geospatial Analysis
Geographic Information Systems (GIS) and Google Earth Pro® tools were used to map the location, extent and temporal changes in the coke storage areas. This analysis allowed us to observe land occupation and its correlation with emission levels in specific years.
2.2.3. Calculation of PM10 Particulate Emissions
The estimation of PM10 particulate emissions used the emission equation of the United States Environmental Protection Agency [17], adapted to the international system:
where
E: PM10 emission rate in ton/year.
D: Active days of the pile
A: Pile area (m2)
F: Control factor (0.5 for wet material, 0.3 for pulverized material and a value of 1 for dry material).
For this study, a control factor of 0.5 was assumed, assuming that the coke piles are watered periodically to reduce dust emission.
2.2.4. Calculation of Particulate Matter Concentration
The following equation was used to determine the concentration of PM10 particles in the air:
where
C: PM10 particulate matter concentration in mg/m3.
Qa: Average air flow (m3/h), estimated at 3500 m3/h based on local climatological data.
2.3. Simulation with ALOHA®
The ALOHA® (Locations of Areas with Hazardous Atmospheres) simulator is a software program in the CAMEO® package used to predict threat areas caused by the dispersion of toxic gases, fire clouds, or explosions, to aid in planning and response to chemical or hazardous materials emergencies. By simulating chemical release, ALOHA® generates rapid estimates of the extent of the hazards.
Some of the tasks that can be performed with this simulator are:
- -
- Modeling the dispersion of particles and toxic clouds: allows you to simulate the release of chemicals and estimate the hazard zones they can form, such as toxic gas clouds dispersing in the atmosphere.
- -
- Chemical Emergency Risk Assessment: this is a fundamental tool for planning and responding to incidents involving hazardous materials, as it predicts where and how far the hazard will spread.
- -
- Emergency Response Planning: simulation results help determine safety measures, such as evacuation zones and containment procedures, that must be implemented to protect the population.
- -
- Predict Various Risk Scenarios: the program can model not only the dispersion of toxic substances but also other types of risks such as fires and explosions, thanks to its ability to simulate different release scenarios.
Considering the range of tools available, and in addition to being an EPA-validated simulator, it is free to use. This software allows you to predict the rates at which chemical vapors can escape into the atmosphere and observe their behavior as they disperse in the atmosphere. Its chemical library contains information on the physical properties of approximately 900 common hazardous chemicals and is also linked to CAMEO®, allowing for the possibility of modifying or creating the chemical compound being studied.
For the simulation in ALOHA® of Pet Coke PM10 particles, the Protective Action Criteria (PAC-1, PAC-2, PAC-3) values available in the CAMEO® Chemicals database were used, as well as the Emergency Response Planning Guidelines (ERG). For these points, the CO values were modified, which is the gas that most closely approximates the migration behavior of these particles. For the simulation in ALOHA®, version 5.4.7 downloaded from the US-EPA web page was used.
3. Results
3.1. Characterization of the Coke Storage Areas in the Port of Veracruz
The analysis of Google Earth Pro® satellite images allowed the identification of the two main coke storage areas in the port of Veracruz: the Bahía Sur Port Terminal and the Bahía Norte Specialized Terminal. These areas present significant differences in terms of extension and operational use. The South Bay, operational since 2010, has an area of approximately 57,100 m2. It is mainly used for outdoor storage of coke and scrap, sharing space with other materials. This area is adjacent to residential areas, such as ‘Fraccionamiento Los Pinos’, which increases the population’s potential exposure to PM10 particles. The Specialized Terminal at Bahia Norte, inaugurated in 2020, includes a specialized terminal for bulk minerals, with a total area of 98,000 m2, of which 40,000 m2 are for coke storage. This terminal incorporates a covered warehouse, which significantly reduces atmospheric emissions of particulate matter (Table 1).

Table 1.
Characteristics of coke storage areas in the Veracruz Port.
The use of remote sensing tools facilitated the identification of temporal variations in storage areas and their relationship with local meteorological conditions, such as wind speed and temperature [7].
3.2. Coke Imports and Annual Variability in PM10 Emissions
During the period 2010–2023, 7,401,594 tons of coke were imported through the port of Veracruz, with peaks in the years 2011, 2018, and 2022. These increases coincide with increased activity in the domestic steel industry (Table 2). Imports were distributed in 593 port operations with an average of 570 tons per year. This growth in coke handling coincides with the increase in PM10 particulate matter emissions observed in the years with the largest operations [18].

Table 2.
Annual change in coke imports (2010–2023).
3.3. Calculation of PM10 Particle Emissions
Based on the EPA equation (AP-42), the annual PM10 particle emission rate was estimated. The calculated values show a significant increase in years with higher storage and outdoor exposure. For example: Year 2014: The emission rate peaked at 3.52 tons/year in the South Bay. Year 2020: An emission of 0.53 tons/year was recorded, due to the use of irrigation measures and the opening of the North Bay, which incorporated a partial confinement of materials. The emission peaks reflect the variability in the handling of coke and its storage in exposed piles (Table 3) and (Figure 2). However, we must clarify the data presented in Table 3. The new confinement construction is considered for components classified by ASIPONA as mineral bulk. This was possible thanks to the trace located through the geolocation application, Google Earth Pro, which showed that in 2022, the concentration of petroleum coke was no longer the same in South Bay. Traces of this bulk were also found in the new confinement area, known as the North Bay. This does not indicate that confinement of this material has reduced dispersion; rather, it is considered as part of the emission radius.

Table 3.
Emission rate in tons per year of PM10 particulate matter at the port terminals.
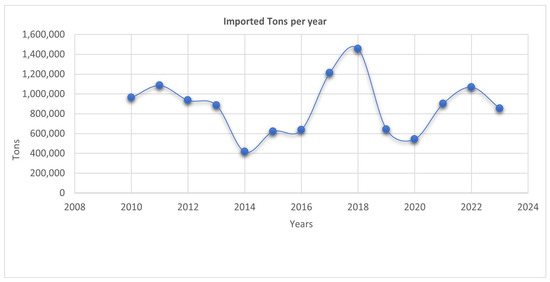
Figure 2.
Annual variation in tons of coke imports in the Veracruz Port, Mexico.
3.4. PM10 Concentration in the Environment and Comparison with Regulations
PM10 particulate matter concentration was calculated using the dispersion equation. The highest values were recorded in 2014, when the average annual concentration in the South Bay reached 114.9 µg/m3, exceeding the limit established by NOM-025-SSA1-2021 (70 µg/m3). In contrast, in the North Bay, concentration levels remained below the regulatory limit as a result of coke confinement. This finding suggests that, although the port implements irrigation measures in the coke piles, the concentration of particulate matter in high import years may pose a health risk to the surrounding population (Table 4) and (Figure 3).

Table 4.
Concentration of PM10 particulate matter in the coke piles.
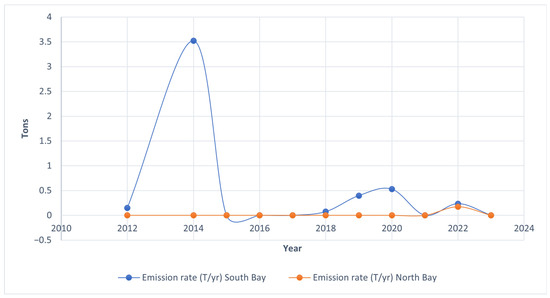
Figure 3.
Annual behavior of the PM10 particle emission rate from petroleum coke, according to the data in Table 3.
3.5. Geospatial Analysis of Storage and Dispersion
The geospatial analysis showed that the most intensive storage areas coincided with peaks of PM10 emissions and concentrations. In particular, in the South Bay in the years 2014 and 2019, the area used reached 14,000 m2, increased exposure to dry wind conditions. For its part, the North Bay, from 2020, storage in this area showed lower emissions due to partial confinement. This confirms the relationship between the extent of the storage area and the increase in PM10 particulate matter emissions.
Using the Google Earth Tool, it was determined that there are two different storage areas for Bulk Ore (Coke) in the Veracruz Port Terminal facilities, the first (Figure 4) is located in the South Bay Port Terminal, located next to the North Wastewater Treatment Plant and close to the Los Pinos Development, and the specialized Bulk Ore Terminal (Figure 4) is located in the New Port of Veracruz in Vergara Bay.
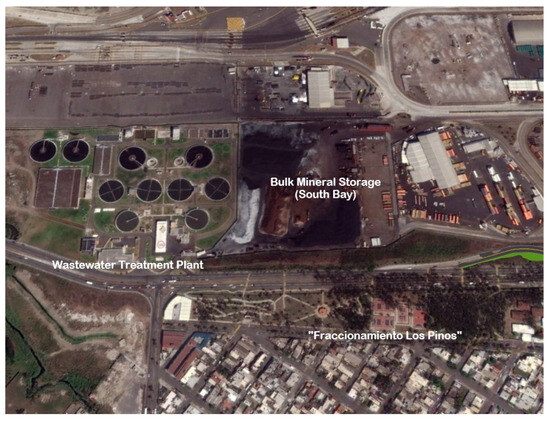
Figure 4.
Mineral bulk storage area at the Veracruz Port terminal facilities.
There are differences between the two bulk ore storage areas; the southern area is used for outdoor coke and scrap piles (Figure 5), has an area of approximately 57,100 m2 and has a railroad spur; the North Bay Specialized Terminal has 98,000 m2 and has a dock and a storage building as well as space for bulk ore piles, which began to be used in January 2020.
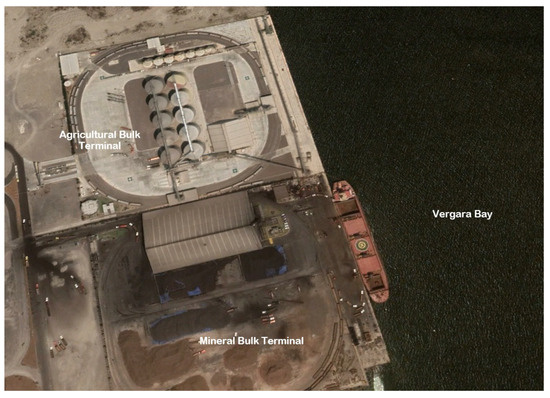
Figure 5.
Specialized bulk ore terminal at the Veracruz Port terminal facilities.
By performing a time lapse with the Google Earth tool (Figure 6), the area of occupation of the coke storage piles was measured in the period between 2012 and 2023 in order to use this information to calculate the PM10 emission rate of the Veracruz Port Terminals (Table 4).
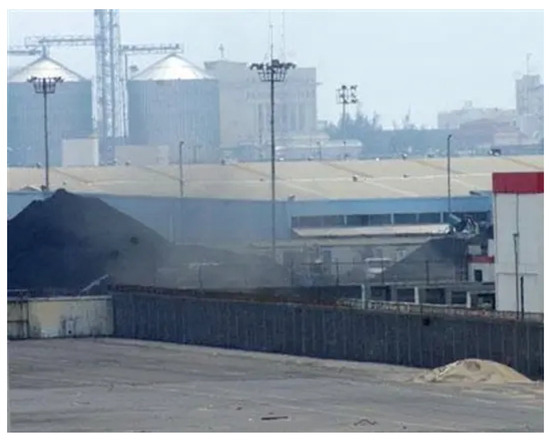
Figure 6.
Petroleum Coke piles at the Port of Veracruz Mexico [19].
As can be seen in Figure 7 the South Bay storage area in addition to Coke in Piles was used for Iron and other minerals.
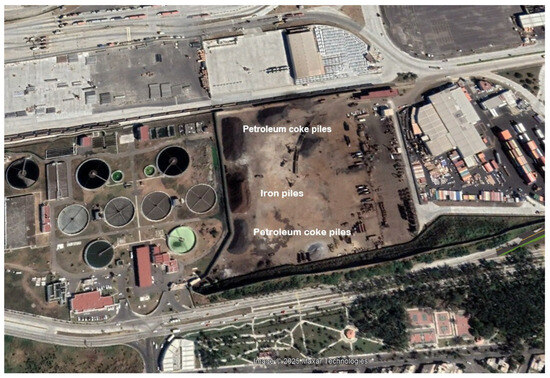
Figure 7.
Bulk ore piles (January 2018) at the Veracruz Port Terminal facilities.
For the emission rate of PM10 particles originating from coke at the Veracruz Port Terminals (Table 5), Equation (1) was used with a control factor of 0.5, since the piles are constantly watered in order to try to avoid dust migration.

Table 5.
Size of coke storage piles and days of use.
3.6. Chemical Composition of Coke and Its Relationship with PM10
In reports on the chemical composition of petroleum coke, carbon (84%) and sulfur (6%) predominate, which makes it highly pulverizable and susceptible to the generation of PM10 particles. It also contains trace metals such as vanadium and nickel. The chemical analyses are shown in Table 6.

Table 6.
Petroleum coke composition according to proximate and elemental analysis [20].
3.7. PM10 Dispersion Simulation
Considering that the behavior of petroleum coke particles, in its composition percentages, 84.24% is Carbon, and 4.68% Oxygen, and that petroleum coke by its molecular weight, presents similarity with Carbon Monoxide (CO), we proceeded to use, to perform this simulation, considering the PAC (Protective Action Criteria or Protective Action Criteria) shown in Table 7.

Table 7.
Data obtained from CAMEO® Chemical with reference to active carbon, where the measure used is parts per million (ppm) [21].
Also considered are the ERPGs (Emergency Response Planning Guidelines), which are as follows, as mentioned in Table 8.

Table 8.
ERPGs obtained from CAMEO® Chemicals [22].
3.8. Results of the Petroleum Coke ppm Dispersion Simulation Using the ALOHA® Simulator
With these data, we proceeded to modify the corresponding section in order to observe the fluidization of the coke. Since, as mentioned in the previous paragraph, the closest behavior of the component close to petroleum coke is carbon monoxide (CO), one of the flexibilities of the ALOHA® simulator is that it allows creating and/or modifying the data needed to approximate the behavior of the component to be studied. Likewise, the winds and conditions of the port of Veracruz were considered, to obtain the temperature and wind averages, with the data we were able to feed the ALOHA® simulator. These data were applied in the points for the calculated and visualized in Table 3, where the movement of emissions in the years 2012, 2014, 2018, 2019, 2020 and 2022 were shown (Table 9).

Table 9.
Coke PM10 particulate matter emission rate, based on data calculated by Google Earth Pro® in time lapse, omitting zero years at the time of calculation.
The simulation was carried out with average winds, for each year mentioned, the historical data of the years where the tons per year of petroleum coke particle emissions were calculated were taken, both for temperatures and wind speed, Meteoblue provides daily data on this information, with which it was possible to calculate the annual averages.
The following data were considered for the study: wind speeds within the range of ≤5.5 m/s, and an average temperature ≥ 29 °C depending on the year. These data were taken from historical data published by Meteoblue, this information can be seen in Figure 8, where we can observe wind behavior within the annual study ranges. A stacked line graph shows the maximum and minimum winds, along with the average calculated from these two data points. This is based on the data available in Meteoblue.
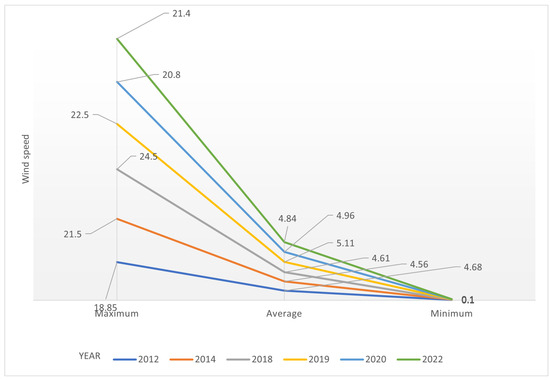
Figure 8.
Wind Behavior, in annual range, between 2012 and 2022, in Veracruz, Veracruz. within the range of ≦5.5 m/s, and an average temperature ≧ 29 °C depending on the year.
From the above, shown in Figure 8, the average winds for the simulation in ALOHA® were used for consideration, and are described in Table 10.

Table 10.
Environmental conditions considered for the study carried out with ALOHA®, considering average data published by Meteoblue [23].
When considering the data of the environmental conditions and the tons per hour (Ton/h) in the years where the coke piles were present, within the simulation carried out, the behavior of the ppm of the ranges of 75, 83 and 330 was observed, the dispersion range could be obtained, this in accordance with the coke piles that were calculated previously, and that depending on the hazard area, data that are described in Table 11.

Table 11.
Concentration of particle emission conditions according to environmental conditions, obtained through ALOHA®, Gaussian Model.
The chronological data shown in Table 11 and the behavior of the ppm allow us to visually observe the changes in the dispersion of ppm coke, taking as a starting point the observation site geolocated using Google Earth Pro, from the initial piles per year. Each figure obtained guarantees the behavior of the particle as a function of the piled quantity.
This demonstrates that the dispersion of these particles does not necessarily have to occur during strong winds, which is an essential monitoring point required on any day under normal conditions. Below are images in chronological order with respect to the data used for particle simulation.
Each image describes their concentration inside and outside, as well as the winds and the distance of particle dispersion. Where item a is the image of the dispersion hood, and item b is the concentration inside and outside in minutes.
Figure 9, Figure 10, Figure 11, Figure 12, Figure 13 and Figure 14, shown below, are each divided into two sections, which are indicated by section (a), which refers to the dispersion plume of petroleum coke particles considering the PACs applicable to each case ranging from 75 ppm to 330 ppm. And section (b), which shows the concentration in mg/cm3 of petroleum coke particles outside and inside the radius, taking as dispersion downwind 6.4 yards (5.85 m) and outside the center line 1.6 yards (1.46 m) per PAC, under the behavior of Carbon Monoxide, these figures are in the chronological order of the study carried out. Each of these figures has a chronological order, in which the variation in the dispersion is observed.
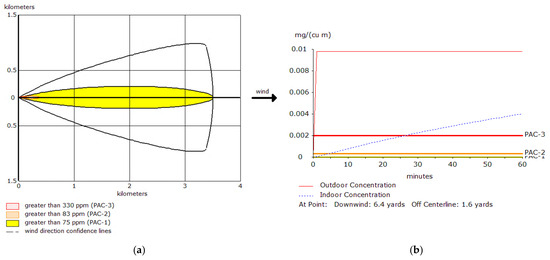
Figure 9.
Calculation made for the year 2012 with dispersion plume (a) and concentration in mg/cm3 of petroleum coke particles outside and inside the radius (b).
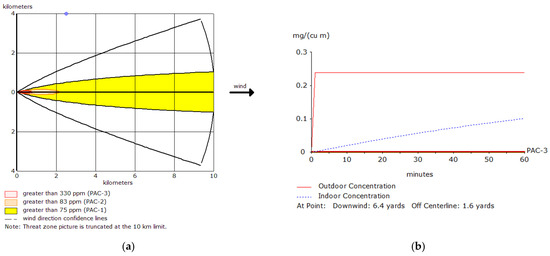
Figure 10.
Calculation made for the year 2014 with dispersion plume (a) and concentration in mg/cm3 of petroleum coke particles outside and inside the radius (b).
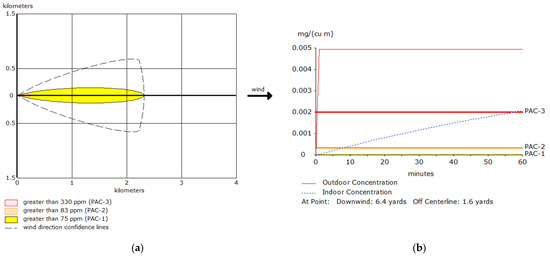
Figure 11.
Calculation made for the year 2018 with dispersion plume (a) and concentration in mg/cm3 of petroleum coke particles outside and inside the radius (b).
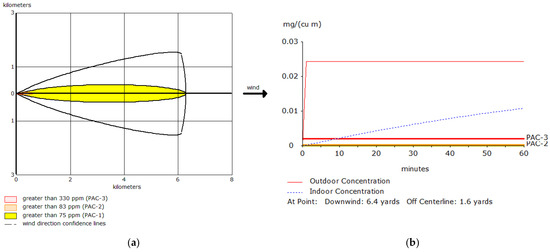
Figure 12.
Calculation made for the year 2019 with dispersion plume (a) and concentration in mg/cm3 of petroleum coke particles outside and inside the radius (b).
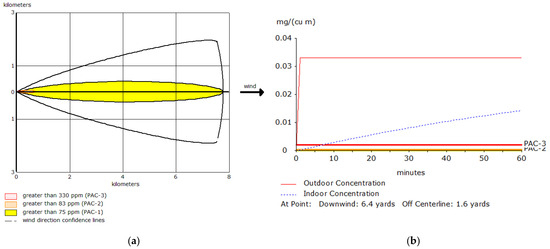
Figure 13.
Calculation made for the year 2020 with dispersion plume (a) and concentration in mg/cm3 of petroleum coke particles outside and inside the radius (b).
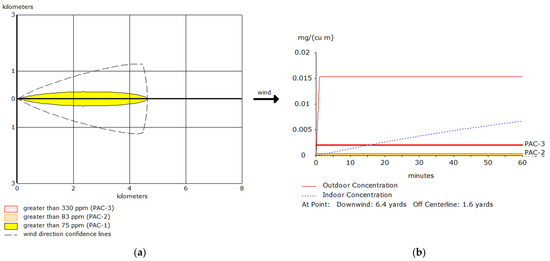
Figure 14.
Calculation made for the year 2022 with dispersion plume (a) and concentration in mg/cm3 of petroleum coke particles outside and inside the radius (b).
4. Discussion
The handling and storage of petroleum coke in the port terminals of Veracruz, being one of the busiest ports in Mexico, poses significant environmental challenges, particularly due to the emission of PM10 particles into nearby urban areas. This study provided a quantitative assessment of the impact generated by these emissions, based on geospatial simulations, environmental modeling and chemical analysis.
The results confirm that PM10 emissions are directly related to the storage area, climatic conditions and management practices. Although irrigation measures have partially reduced emissions, the levels recorded in years of high port activity may pose a risk to public health and the environment. As a strategy, it is recommended to implement a complete confinement system to reduce particulate matter dispersion, as well as to continuously monitor PM10 levels in the areas surrounding the port. With this, we can analyze the perception of the population in the radius obtained, with the use of simulation with ALOHA®, this will allow us to obtain more accurate data on the extent of emissions of these particles.
PM10 emissions and their relationship with regulations
The results reveal that PM10 concentrations in the South Bay during 2014 exceeded the annual limit of 70 µg/m3 established by NOM-025-SSA1-2021, reaching levels of 114.9 µg/m3. This finding is consistent with studies conducted in industrial ports such as Chicago and Detroit, where exposure to petroleum coke storage generated similar air pollution peaks [4,5]. In contrast, years with less port activity and mitigation measures, such as constant stack watering in 2020, resulted in controlled emissions that met regulatory limits. These results underscore the importance of implementing additional strategies such as total confinement of materials, already observed in the North Bay since 2020, which significantly reduced emissions.
Geospatial analysis and particle behavior
The use of tools such as Google Earth Pro® and ALOHA® allowed for accurate assessment of storage areas and particle dispersion. It is worth mentioning that the ALOHA® simulator is typically used for gases, that is, for particles of low density and weight. The decision to use ALOHA® was due to the software’s ability to handle similarities in chemical compounds, as well as the management of PACs. Therefore, within CAMEO®, a subprogram it uses, a search was conducted for the petroleum coke component, which is not yet defined. However, upon seeing the percentage composition of its elements and its behavior in microparticles, the similarity within the compounds defined in ALOHA® allowed CO to be used as a reference and the ppm used in petroleum coke to be considered. Since the study does not refer to a visible-sized particle, the perception of the population and the surrounding area is that it is described as a light dust that reaches various parts of the defined study area. Another reason why the use of ALOHA® was considered is the use of the Gaussian Model, on which the calculations are based using the formulas used for the initial development of this research.
Perhaps the simulator is not the most suitable to use, but it allows us to have an idea of a dispersion range, and with an additional study to the one presented, we can survey people who, according to the calculation obtained from the dispersion plume, and reflected in Google Earth Pro, can observe the places that would be the object to confirm what was projected with this work.
The maximum extent of storage in the South Bay in 2014 (14,000 m2) coincided with the highest calculated emission rates (3.52 tons/year), demonstrating a direct relationship between the exposed surface area and the magnitude of emissions. Previous studies in ports with similar climates have indicated that specific conditions, such as wind speeds greater than 4.5 m/s and temperatures above 30 °C, exacerbate particle dispersion [7,21]. This pattern was evident in Veracruz, especially in high import years such as 2014 and 2020. However, the partial confinement implemented in the North Bay mitigated this impact.
The results obtained in this study are consistent with international research that highlights the need for advanced tools to model emissions and plan mitigation strategies. For example, studies on the California coast used similar methodologies, such as CAP-based simulations, to establish safety perimeters and reduce human exposure [13,24]. However, compared to other international contexts, the implementation of confinement measures in Veracruz is still limited. While countries such as the United States have adopted covered storage policies in almost all major ports, the infrastructure in Veracruz shows a partial transition towards this model, especially in the North Bay.
Simulations performed with ALOHA® revealed that particle concentrations are amplified in scenarios of constant wind and exposed areas. This is in agreement with previous studies using Gaussian models to predict pollutant dispersion [9]. In this study, the calculated values showed that particulate matter dispersion during 2014 exceeded urban areas by a radius of 2.2 km, potentially affecting adjacent communities such as Fraccionamiento Los Pinos, located in the city of Veracruz.
Imports in recent years have been variable, they are accentuated in the graphs (Figure 2 and Figure 3), they show peaks that coincide with the emissions calculated in certain years. With this it is shown that, an investigation of the environment where there is population should be performed, to obtain statistics to obtain more data on petroleum coke, and thus determine the radius of toxicity that exists, cases that support the data obtained from PM10 emissions [25].
The results obtained in this work indicate that the longer the coke storage time, the higher the PM10 emissions, given that it was placed in the form of piles outdoors, in a port area where at certain times of the year there are winds with gusts, which allow the erosion of dust particles, and these migrate to the surrounding areas; At certain times the values are higher than the limits established by NOM-025-SSA1-202, in the Pilas area, which is attenuated by the deposit of these particles in the surrounding area. Also, and according to the ALOHA® simulator, in the normal daily wind, the eventuality of particle dispersion and concentration is greater, due to the behavior it has, the same as carbon monoxide [11].
Prolonged exposure to high concentrations of PM10 have been associated with respiratory and cardiovascular problems, especially in vulnerable populations [2]. Although petroleum coke has low levels of volatile and carcinogenic compounds [4], PM10 particles pose a significant risk by penetrating the respiratory system. The case of Veracruz is similar to the findings of Caruso et al. [5], who reported an increase in respiratory diseases in communities near ports with coke handling. This study reinforces the need for complementary assessments, to estimate the real impact on the health of communities near the port. This is defined by the findings of this study, where it is evident that outdoor storage of coke in piles exposed to dry and windy weather conditions favors the dispersion of PM10 particles, which are transported to nearby urban areas.
One of the most important points to mention about this work is that there are no protocols, regulations, or laws for the handling of this mineral. Clearly, there is no information to ensure its proper handling. Only through publications on the websites of companies working within the Port of Veracruz or through observation through satellite images do we have information about the measures that have been adopted. One was the transfer of this material to another containment area within the port, known as the South Bay, leaving it at ground level, partly open to the air and partly in a covered area without vents. We know this because, using Google Earth Pro, we were able to view satellite images of the current location. It is unknown whether the storage area contains a cement slab or if a structure was simply built to cover it. The measures applied to contain this material consist of moistening the surface of the piles of petroleum coke stored on the ground with cement material with water; However, when dried by air currents, it spreads. As a complement to this measure, through leaching, the water it is moistened with runs off toward unpaved areas and the maritime zone.
This study provides a framework for environmental impact assessment at busy ports and is a useful tool for decision making aimed at environmental sustainability and social welfare.
5. Conclusions
The Port of Veracruz, being the oldest in Mexico, has evolved and expanded to receive a greater amount of specialized cargo. This is why, since 2018, with the prior construction of new berthing areas and a specialized terminal, the handling of bulk minerals has increased. However, according to the data taken from the statistics that the current port administration has on its transparency page, the importation of bulk minerals, specifically petroleum coke, has varied. Nevertheless, this allowed for the analysis of this data and the definition of the years to be studied when measuring PM10 particle emissions and accumulating the data. This showed that 2014 had the highest variation, but in the following years, although emissions were lower, they were not zero. This was demonstrated by the simulation carried out in ALOHA®, which allows us to observe the behavior of particle dispersion and how far they travel.
The results obtained indicate that the longer the coke is stored, the higher the PM10 emissions, given that it was placed in piles outdoors in a port area where at certain times of the year, there are gusty winds that cause the dust particles to erode and migrate to surrounding areas, sometimes with values well above those established by standard NOM-025-SSA1-2021 in the pile area, which is mitigated by the deposition of these particles in the environment. Another factor, according to the ALOHA® simulation, is that with normal daily winds, the possibility of particle dispersion and concentration is greater due to their behavior, which is similar to that of carbon monoxide, the compound used as a reference for the simulation.
In addition to the simulation, graphs of the data obtained show maximum points that coincide with the emissions calculated in certain years. This allows us to observe the behavior of these emissions. Therefore, we can say that it is necessary to monitor the behavior of these PM10 particles, mainly in northern events, when the particles are dispersed more widely. These types of events are not recurrent in the port, but rather sporadic and variable. If this event were analyzed more frequently over the years, it could be verified that concentrations are lower during minimal air events.
This work serves as an initial reference for gathering further information from the team currently addressing this issue. The research focuses on understanding the effects of particles, their behavior under low wind conditions, and the climate characteristics of the area in which petroleum coke piles are situated. Within the simulation, in the dispersion graphs obtained by ALOHA®, if linked through Google Earth Pro®, it would be possible to observe and define the populated areas affected by these emissions. With this, a study of the population’s perception could be applied, using a survey as a means of research, which would allow the variables to be identified and compared with the data obtained in this work. This would make it possible to determine the real impact of these petroleum coke emissions.
Another aim of this research is to design public policies based on empirical data to reduce the environmental impact of petroleum coke handling in port areas. The existing baseline information only refers to levels that should not be exceeded. However, there are no regulations, environmental laws, or any official documents, as in other countries, where unforeseen events have occurred that damage everything from flora and fauna to human beings. That is why the aim of this study is to raise awareness of what is happening and, if there is no major damage yet, to contain the existing damage and remedy future damage.
This research aims to raise awareness of a problem that, although not new, has not been given the importance it deserves and could cause irreversible damage not only to the affected areas but also to everything within the vicinity of these piles, which is already undergoing changes that have not yet been visualized. Therefore, the exploration and development of sustainable technologies for the confinement and handling of bulk materials, with an emphasis on their integration into environmental management systems inside and outside the port of Veracruz, would be a solution and a means of preventing the problem from escalating. With this, all the data obtained and shown here would be the beginning of a study and application not only of the correct handling of petroleum coke but of all bulk materials that could become a source of damage to the population, fauna, and flora found near the places where these materials are stored.
Author Contributions
Conceptualization, M.d.R.C.-C. and X.C.H.-S.; formal analysis, M.d.R.C.-C. and X.C.H.-S.; investigation, X.C.H.-S.; methodology, M.D.G. and X.C.H.-S.; project administration, M.d.R.C.-C.; resources, Á.M.-S., F.L.-R. and O.P.C.-O.; software, X.C.H.-S.; supervision, M.d.R.C.-C.; validation, M.D.G.; visualization, Á.M.-S., F.L.-R. and O.P.C.-O.; writing—original draft, X.C.H.-S., M.D.G., Á.M.-S. and O.P.C.-O.; writing—review and editing, M.d.R.C.-C. and F.L.-R. All authors have read and agreed to the published version of the manuscript.
Funding
This research received no external funding.
Data Availability Statement
The original data presented in the study are openly available in [National Port System Administration (ASIPONA)] at [https://en.puertoveracruz.com.mx].
Acknowledgments
The authors express their gratitude to the Secretariat of Science, Humanities, Technology, and Innovation of Mexico for granting a scholarship that is enabling this dissemination; as well as to the National Technological of Mexico, which is bringing this research to completion through the scholarship-commission granted.
Conflicts of Interest
The authors declare no conflicts of interest.
Correction Statement
This article has been republished with a minor correction to the Data Availability Statement. This change does not affect the scientific content of the article.
References
- González-Rivera, A.; Mugica-Álvarez, V.; Sosa-Echeverría, P.; Sánchez-Álvarez, V.; Magaña-Rueda, G.; Vázquez-Cruz, A.; Retama, A. Air Quality and Atmospheric Emissions from the Operation of the Main Mexican Port in the Gulf of Mexico from 2019 to 2020. J. Mar. Sci. Eng. 2023, 11, 265. [Google Scholar] [CrossRef]
- Dourson, M.; Chinkin, L.; MacIntosh, D.; Finn, J.; Brown, K.; Reid, S.; Martinez, J. A case study of potential human health impacts from petroleum coke transfer facilities. J. Air Waste Manag. Assoc. 2016, 66, 1061–1076. [Google Scholar] [CrossRef] [PubMed]
- Predel, H.; Srivatsan, S. 6.1.2 Petroleum Coke *. In Industrial Carbon and Graphite Materials; Wiley-VCH: Berlin, Germany, 2021; Volume I, pp. 122–149. [Google Scholar] [CrossRef]
- EPA (2020) Health Effects of Petroleum Coke. United States Environmental Protection Agency Consultado el 23 de Mayo del 2024 de. Available online: https://archive.epa.gov/epa/petroleum-coke-chicago/health-effects-petroleum-coke.html (accessed on 3 March 2024).
- Caruso, J.; Zhang, K.; Schroeck, N.; McCoy, B.; McElmurry, S. Petroleum coke in the urban environment: A review of potential health effects. Int. J. Environ. Res. Public Health 2015, 12, 6218–6231. [Google Scholar] [CrossRef] [PubMed]
- NOM-025-SSA-2021; Salud ambiental. Criterio para evaluar la calidad del aire ambiente, con respecto a las partículas suspendidas PM10 y PM2.5. Valores normados para la concentración de partículas suspendidas PM10 y PM2.5 en el aire ambiente, como medida de protección a la salud de la población. Secretaria de Salud [SSA]: Ciudad de Mexico, Mexico, 2021.
- Reyna-González, P.; Paredes-Lizama, D.; Lango-Reynoso, F.; Castañeda-Chávez, M.; Montoya, J. Incorporación del análisis espacial para la caracterización de residuos SLICV. Rev. Int. De Contam. Ambient. 2022, 38, 521–533. [Google Scholar] [CrossRef]
- Chen, D.; Wang, Y.; Shen, Z.; Liao, J.; Chen, J.; Sun, S. Long Time-Series Mapping and Change Detection of Coastal Zone Land Use Based on Google Earth Engine and Multi-Source Data Fusion. Remote Sens. 2022, 14, 1. [Google Scholar] [CrossRef]
- Balbi, K.B.; Massolo, L.A. Modelos de Dispersión Y Distribución de Contaminantes en El Ambiente; Editorial de la UNLP: La Plata, Argentina, 2022; pp. 94–108. ISBN 978-950-34-2160-4. [Google Scholar]
- US-EPA (2024) ALOHA® Software. Available online: https://www.epa.gov/cameo/aloha-software (accessed on 2 March 2024).
- Galaviz, M.A.A. Metodología para simulaciones de liberación de sustancias peligrosas empleando el programa Aloha. In Métodos Cuantitativos Aplicados a Recursos Naturales, Medioambiente y la Sostenibilidad; Astra Editorial: New York, NY, USA, 2024; pp. 125–212. [Google Scholar] [CrossRef]
- Camejo, A.Y. Assessment of Technological Risks at the Crude Oil Processing Plant of the Central Oil Drilling and Extraction Company. Bachelor’s Thesis, Universidad de Matanzas, Matanzas, Cuba, 2021. [Google Scholar]
- Ramos Valdiviezo, D.K.; Gutiérrez Guamán, L.A. Análisis de riesgo de explosión por transporte de GLP y modelamiento gráfico de exposición con el método ALOHA® para reducir consecuencias en el área urbana del cantón Guaranda. Periodo noviembre 2022–febrero 2023. In Proyecto de Investigación; Universidad Estatal de Bolivia: Guanujo, Ecuador, 2023. [Google Scholar]
- Marco, A.; Marco, A.G. Metodología para simulaciones de liberación de sustancias peligrosas empleando el programa Aloha. In Métodos Cuantitativos Aplicados a Recursos Naturales, Medioambiente Y La Sostenibilidad; Astra Editorial: Ciudad de Mexico, Mexico, 2024. [Google Scholar] [CrossRef]
- INEGI (2024) Climatología, Consultado el 30 de Mayo del 2024 de. Available online: https://www.inegi.org.mx/temas/climatologia/ (accessed on 2 December 2024).
- Fuentes García, G.; Sosa-Echeverría, R.; Baldasano, J.; Kahl, J.; Antoonio-Durán, R. Review of Top-Down Method to Determine Atmospheric Emissions in Port. Case of Study: Port of Veracruz, Mexico. J. Mar. Sci. Eng. 2022, 10, 96. [Google Scholar] [CrossRef]
- EPA (2006) AP-42, CH 13.2.5: Industrial Wind Erosion Updated 2006 Consultado el 15 de Mayo del 2024 de. Available online: https://www3.epa.gov/ttnchie1/ap42/ch13/final/c13s0205.pdf (accessed on 2 December 2024).
- Ubieta, S.; Martínez-Tencio, G.; Salazar, C. Sistematización de Bases de Datos Sobre Comercio Internacional: Una Revisión Sobre Su Estado Actual. 001-2018. consultado el 15 de mayo del 2024. 2018. Available online: https://www.researchgate.net/publication/354309091_Sistematizacion_de_bases_de_datos_sobre_comercio_internacional_una_revision_sobre_su_estado_actual?enrichId=rgreq-ec85b61a72ea1a7700c196ecf081f2e5-XXX&enrichSource=Y292ZXJQYWdlOzM1NDMwOTA5MTtBUzoxMDYzMzk3ODc3NjM3MTIwQDE2MzA1NDUyMTk3OTM%3D&el=1_x_2&_esc=publicationCoverPdf (accessed on 3 December 2024).
- Toriz, V. “Coque” Daña Salud de Habitantes del Puerto de Veracruz, E-Consulta.com Veracruz, Consultado El 30 de Mayo del 2024 de. 2019. Available online: https://e-veracruz.mx/nota/2019-07-24/veracruz/coque-dana-salud-de-habitantes-del-puerto-de-veracruz (accessed on 2 December 2024).
- Gonzalez-Rocha, J.C.; Longoria-Ramírez, R.; Urquiza-Beltrán, G. Resultados de la simulación de gasificación del coque de petróleo mexicano de las refinerías de Ciudad Madero y Cadereyta. Ing. Investig. Y Tecnol. 2008, 9, 99–111. [Google Scholar]
- DOE. Protective Action Criteria (PAC) with AEGLs, ERPGs, & TEELs; U.S. Department of Energy: Washington, DC, USA, 2024. [Google Scholar]
- AIHA. ERPGs (Emergency Response Planning Guidelines™); American Industrial Hygiene Association: Falls Church, VA, USA, 2022. [Google Scholar]
- Meteoblue, Historial Meteorológico de Vientos y Temperaturas en El Veracruz, Consultado el 01 de Diciembre de 2024. Available online: https://www.meteoblue.com/es/tiempo/historyclimate/climatemodelled/veracruz_m%c3%a9xico_3514783 (accessed on 1 December 2024).
- City of Chicago (2014) Fugitive Dust Study. Report, Consultado el 12 de Mayo del 2024 de. Available online: https://www.chicago.gov/content/dam/city/depts/cdph/environmental_health_and_food/PetCoke_Public_Comments/102512DustReport031314.pdf (accessed on 28 November 2024).
- EPA (2016) Health Effects of Petroleum Coke, United States Environmental Protection Agency. Consultado el 23 de Abril del 2024 de. Available online: https://19january2017snapshot.epa.gov/petroleum-coke-chicago/health-effects-petroleum-coke_.html (accessed on 1 December 2024).
Disclaimer/Publisher’s Note: The statements, opinions and data contained in all publications are solely those of the individual author(s) and contributor(s) and not of MDPI and/or the editor(s). MDPI and/or the editor(s) disclaim responsibility for any injury to people or property resulting from any ideas, methods, instructions or products referred to in the content. |
© 2025 by the authors. Licensee MDPI, Basel, Switzerland. This article is an open access article distributed under the terms and conditions of the Creative Commons Attribution (CC BY) license (https://creativecommons.org/licenses/by/4.0/).