Article

Applying Satellite-Based and Global Atmospheric Reanalysis Datasets to Simulate Sulphur Dioxide Plume Dispersion from Mount Nyamuragira 2006 Volcanic Eruption

by
Thabo Modiba
1,
Moleboheng Molefe
1 and
Lerato Shikwambana
1,2,*
1
Earth Observation Directorate, South African National Space Agency, Pretoria 0001, South Africa
2
School of Geography, Archaeology and Environmental Studies, University of the Witwatersrand, Johannesburg 2050, South Africa
*
Author to whom correspondence should be addressed.
Earth 2025, 6(3), 102; https://doi.org/10.3390/earth6030102
Submission received: 22 July 2025 / Revised: 29 August 2025 / Accepted: 31 August 2025 / Published: 1 September 2025

Abstract

Understanding the dispersion of volcanic sulphur dioxide (SO2) plumes is crucial for assessing their environmental and climatic impacts. This study integrates satellite-based and reanalysis datasets to simulate as well as visualise the dispersion patterns of volcanic SO2 under diverse atmospheric conditions. By incorporating data from the MERRA-2 (Modern-Era Retrospective Analysis for Research and Applications, version 2), CALIPSO (Cloud-Aerosol Lidar and Infrared Pathfinder Satellite Observations), and OMI (Ozone Monitoring Instrument) datasets, we are able to provide comprehensive insights into the vertical and horizontal trajectories of SO2 plumes. The methodology involves modelling SO2 dispersion across various atmospheric pressure surfaces, incorporating wind directions, wind speeds, and vertical column mass densities. This approach allows us to trace the evolution of SO2 plumes from their source through varying meteorological conditions, capturing detailed vertical distributions and plume paths. Combining these datasets allows for a comprehensive analysis of both natural and human-induced factors affecting SO2 dispersion. Visual and statistical interpretations in the paper reveal overall SO2 concentrations, first injection dates, and dissipation patterns detected across altitudes of up to ±20 km in the stratosphere. This work highlights the significance of combining satellite-based and global atmospheric reanalysis datasets to validate and enhance the accuracy of plume dispersion models while having a general agreement that OMI daily data and MERRA-2 reanalysis hourly data are capable of accurately accounting for SO2 plume dispersion patterns under varying meteorological conditions.

1. Introduction

Volcanic eruptions possess the explosive power to lift gases and aerosols to altitudes exceeding thirty kilometres (30 km) into the sky [1]. A vast majority of inland volcanic eruptions are typified by pyroclastic flows (ash clouds) and surges during the emissive/eruptive phases of the volcano [2]. The eruptions eject aerosols and gases composed of vapor, carbon dioxide, sulphur dioxide, hydrogen sulphide, hydrogen chloride, and solid matter into the atmosphere’s troposphere during minor events and further into the stratosphere during major events [3,4]. Generally, volcanoes can inject gases and particles directly into the stratosphere during major events, which tend to have high residence times [2]. These are gases which are injected into the atmosphere in a form of fast-moving clouds of hot gases, and ashes that rush downwind and almost instantly result in far-reaching effects on the climate over longer time horizons [2,5,6]. One such event is the 28th of November 2006 eruption, which contributed to major natural emissions [1].
Sulphur dioxide (SO2) is one of the most prevalent gases which can distinguish volcanic eruptions, and it is commonly used as a tracer for volcanic plume evolutions which can be tracked for up to several days after the eruption date [7]. As a reactive gas pollutant, Sulphur dioxide (SO2) can be oxidised in the atmosphere to produce sulphate aerosols [8]. The gaseous phase oxidation of SO2 products (sulphuric acid and sulphates) can adversely affect the Earth’s climate system, air quality, human health, and aquatic systems [8]. Exposure to SO2 affects human health usually by increasing the risk of respiratory illnesses and cardiovascular diseases [9,10]. Atmospheric SO2 is commonly oxidised by OH radical reactions in its gaseous phase, or by bonding with H2O2 (Hydrogen peroxide) and O3 (Ozone) in its aqueous phase, which will form sulphuric acid, which could lead to acid rain formations and particulate SO42− (sulphate) [11]. SO2 as a tracer is visualised in the paper using remote sensing datasets, assimilated reanalysis data, and ensemble calculations to track the movement, dispersion, column density, and evolution of volcanic SO2 to completely understand the extinction and evolution of volcanic emissions at high altitudes.
Numerous studies have evaluated on how volcanic emissions are transported and distributed over various heights and altitudes [1,4,7,12]. Lovejoy and Varotsos [13] systematically compare the statistical properties of solar-only, volcanic-only, and combined solar and volcanic forcings over the range of timescales from 1 to 1000 years. Their main findings were that (a) the variability in both the Zebiak–Cane (ZC) model and general circulation model (GCM) models are too weak at centennial and longer timescales; (b) beyond approximately 50 years, solar and volcanic forcings interact sub-additively (i.e., nonlinearly), further reducing the strength of the model response; and (c) at shorter timescales, the models exhibit another nonlinear behaviour—showing greater sensitivity to weak forcing than to strong forcing, due to differences in their intermittency, which we quantify using statistical scaling exponents.
The aim of this work is to assess how well global reanalysis atmospheric datasets derived from satellites can predict daily volcanic aerosol dispersion and extinction rates downwind as a function of different meteorological variables. As such, we will evaluate the movement of tropospheric and stratospheric SO2 emitted during the November 2006, Mount Nyamuragira volcanic eruption (1.41° S, 29.2° E, altitude 3058 m) and map its extinction downwind. In this paper, MERRA-2 reanalysis (Modern-Era Retrospective Analysis for Research and Applications, version 2) [14], CALIPSO (Cloud-Aerosol Lidar and Infrared Pathfinder Satellite Observations) [15], and the Hybrid Single-Particle Lagrangian Integrated Trajectory (HYSPLIT) model [16] are utilised to model SO2 plume dispersions, transport, and trajectories from the source while experiencing different atmospheric pressure surfaces and wind speeds along its path. By comparing modelled trajectories with satellite observations and global atmospheric reanalysis datasets, this study advances the understanding of SO2 dispersion dynamics and provides valuable insights for atmospheric science and pollution management.
The objective of this study is to investigate the dispersion and transport of volcanic SO2 plumes from the surface to the stratosphere by analysing variations in atmospheric pressure, wind direction, and wind speed, independent of surface-level SO2 concentrations, and to assess how these meteorological factors influence SO2 vertical column densities as observed by remote sensing instruments.

2. Study Area

Mount Nyamuragira is a significantly active volcano that is located in the Virunga National Park, in the North/Nord Kivu Province of the Democratic Republic of Congo (DRC) (see Figure 1) [17]. Situated at 1°24′36.36″ S and 29°12′15.40″ E of the Masisi Territory, Mount Nyamuragira is known as the most active volcano in Africa. It has frequent eruptions, contributing significantly to the region’s volcanic activity. The region is characterised by tropical forests and agricultural farmlands, with a tropical climate and temperatures averaging between 15 °C and 25 °C subject to altitude [18,19]. The region experiences its highest rainfall between April and October, reaching an annual average of 1508.3 mm [20]. In a comparative study investigating various factors causing landscape changes during volcanic activity at Virunga National Park, Udahogora, et al. [21] found that volcanic plumes and persistent gas emissions from these volcanoes significantly disrupted the natural ecosystems, hence the need for advanced visualisations of volcanic plume behaviours.
The volcano results from the formation of the East African Rift System and normal faulting along the rift [22]. Nyamuragira (3058 m a.s.l.), with a diameter of 2 to 2.3 km, is a shield volcano with eruptions occurring every 2–4 years [23]. It is characterised by its potassium-rich basanites, producing low-viscosity lavas that flow laterally for approximately 1100 km2. Additionally, it has a high eruptivity, with about 44 eruptions recorded since 1882 [24,25]. The study period is 15 November to 16 December 2006.

3. Data Sources

The description of the datasets used in this study are summarised in Table 1. A brief description of the datasets is given in Section 3.1, Section 3.2, Section 3.3 and Section 3.4.

3.1. OMI

The Ozone Monitoring Instrument (OMI), a nadir-viewing spectrometer, was launched aboard the NASA Earth Observing Satellite Aura on 15 July 2004, into a Sun-synchronous orbit. The OMI offers comprehensive global coverage of key atmospheric trace gases such as ozone (O3), SO2, nitrogen dioxide (NO2), and formaldehyde (HCHO), along with data on clouds and aerosols. Using hyperspectral imaging in a push-broom configuration, the OMI observes solar backscatter radiation in the visible and ultraviolet spectra. These advanced capabilities enhance the precision and accuracy of measuring total ozone levels and enable reliable radiometric and wavelength self-calibration over extended periods. The OMI operates with two UV channels (264–311 nm and 307–383 nm) and one visible light spectrometer channel (349–504 nm), achieving spectral resolutions between 0.42 and 0.63 nm, and spatial resolutions of up to 13 km × 24 km. The OMI’s capabilities include detecting volcanic ash and sulphur dioxide emissions resulting from volcanic activity. For further information on the OMI, refer to Levelt et al. [26], Liu et al. [27], Kroon et al. [28], and Levelt et al. [29].

3.2. MERRA-2

Modern-Era Retrospective Analysis for Research and Applications, version 2 (MERRA-2) provides data from 1980 onwards. It was developed to replace the original MERRA dataset due to advancements in the assimilation system, which now allows the inclusion of modern hyperspectral radiance and microwave observations, as well as GPS–Radio Occultation datasets. MERRA-2 incorporates aerosol data assimilation, enabling a comprehensive multidecadal reanalysis where both aerosol and meteorological observations are assimilated within a global data assimilation system. The atmospheric general circulation model (AGCM) of MERRA-2 was computed on a cubed sphere grid to ensure consistent grid spacing across all latitudes. Its main strengths include the following: (1) high spatial resolution (0.5° latitude by 0.25° longitude with 72 model levels), and temporal resolution (hourly data); (2) integration of observations from recent satellite instruments; and (3) enhanced estimates of surface mass balance and surface temperatures over ice sheets. For further details on MERRA-2, please refer to Randles et al. [30], Buchard et al. [31], and Gelaro et al. [32].

3.3. CALIPSO

The CALIPSO satellite was launched on 28 April 2006, with the objective of gaining new insights into aerosols and clouds, their interactions, and their roles in the climate system [33]. The CALIPSO payload consists of three nadir-viewing instruments: the Cloud-Aerosol Lidar with Orthogonal Polarization (CALIOP), an elastic backscatter lidar with a wide field-of-view camera (WFC), and an imaging infrared radiometer (IIR) [34]. The CALIOP is designed to examine the vertical structure of the atmosphere, categorising each layer as either cloud or aerosol [35]. At level 1, CALIOP data products provide detailed measurements including vertically resolved total atmospheric backscatter intensity at 532 nm and 1064 nm, as well as the perpendicular polarisation component of the 532 nm backscatter relative to the laser’s polarisation plane. Level 2 cloud and aerosol products are derived from level 1 data and stored in two distinct file types: cloud, aerosol, and merged layer product files, and cloud and aerosol profile product files. Data products derived from CALIOP measurements are distributed globally from the Atmospheric Science Data Center (ASDC) at NASA’s Langley Research Center. For additional information on CALIPSO, refer to Winker et al. [33], Tackett et al. [36], and Zeng et al. [37].

3.4. HYSPLIT Model

The Hybrid Single-Particle Lagrangian Integrated Trajectory (HYSPLIT) model is designed to perform computations for both straightforward air parcel trajectories and intricate simulations involving dispersion and deposition. It is widely utilised for establishing the source–receptor relationships of air pollutants through trajectory analysis. Additionally, the model is employed to forecast plume dispersion in various scenarios such as nuclear incidents, volcanic eruptions, wildfire smoke transport, and dust storm events. Being a Lagrangian model, HYSPLIT calculates dispersion by tracing the movement of particles along their transport vectors, requiring only meteorological data from the specific computational point. The model is extensively applied to analyse both forward and backward transport pathways of aerosols originating from biomass burning, industrial emissions, and volcanic eruptions [38]. For further insights into the HYSPLIT model, refer to Draxler and Hess [39], Stein et al. [40], and Rolph et al. [41].

4. Results and Discussion

4.1. Timeseries of Observed SO2 Column Mass Densities

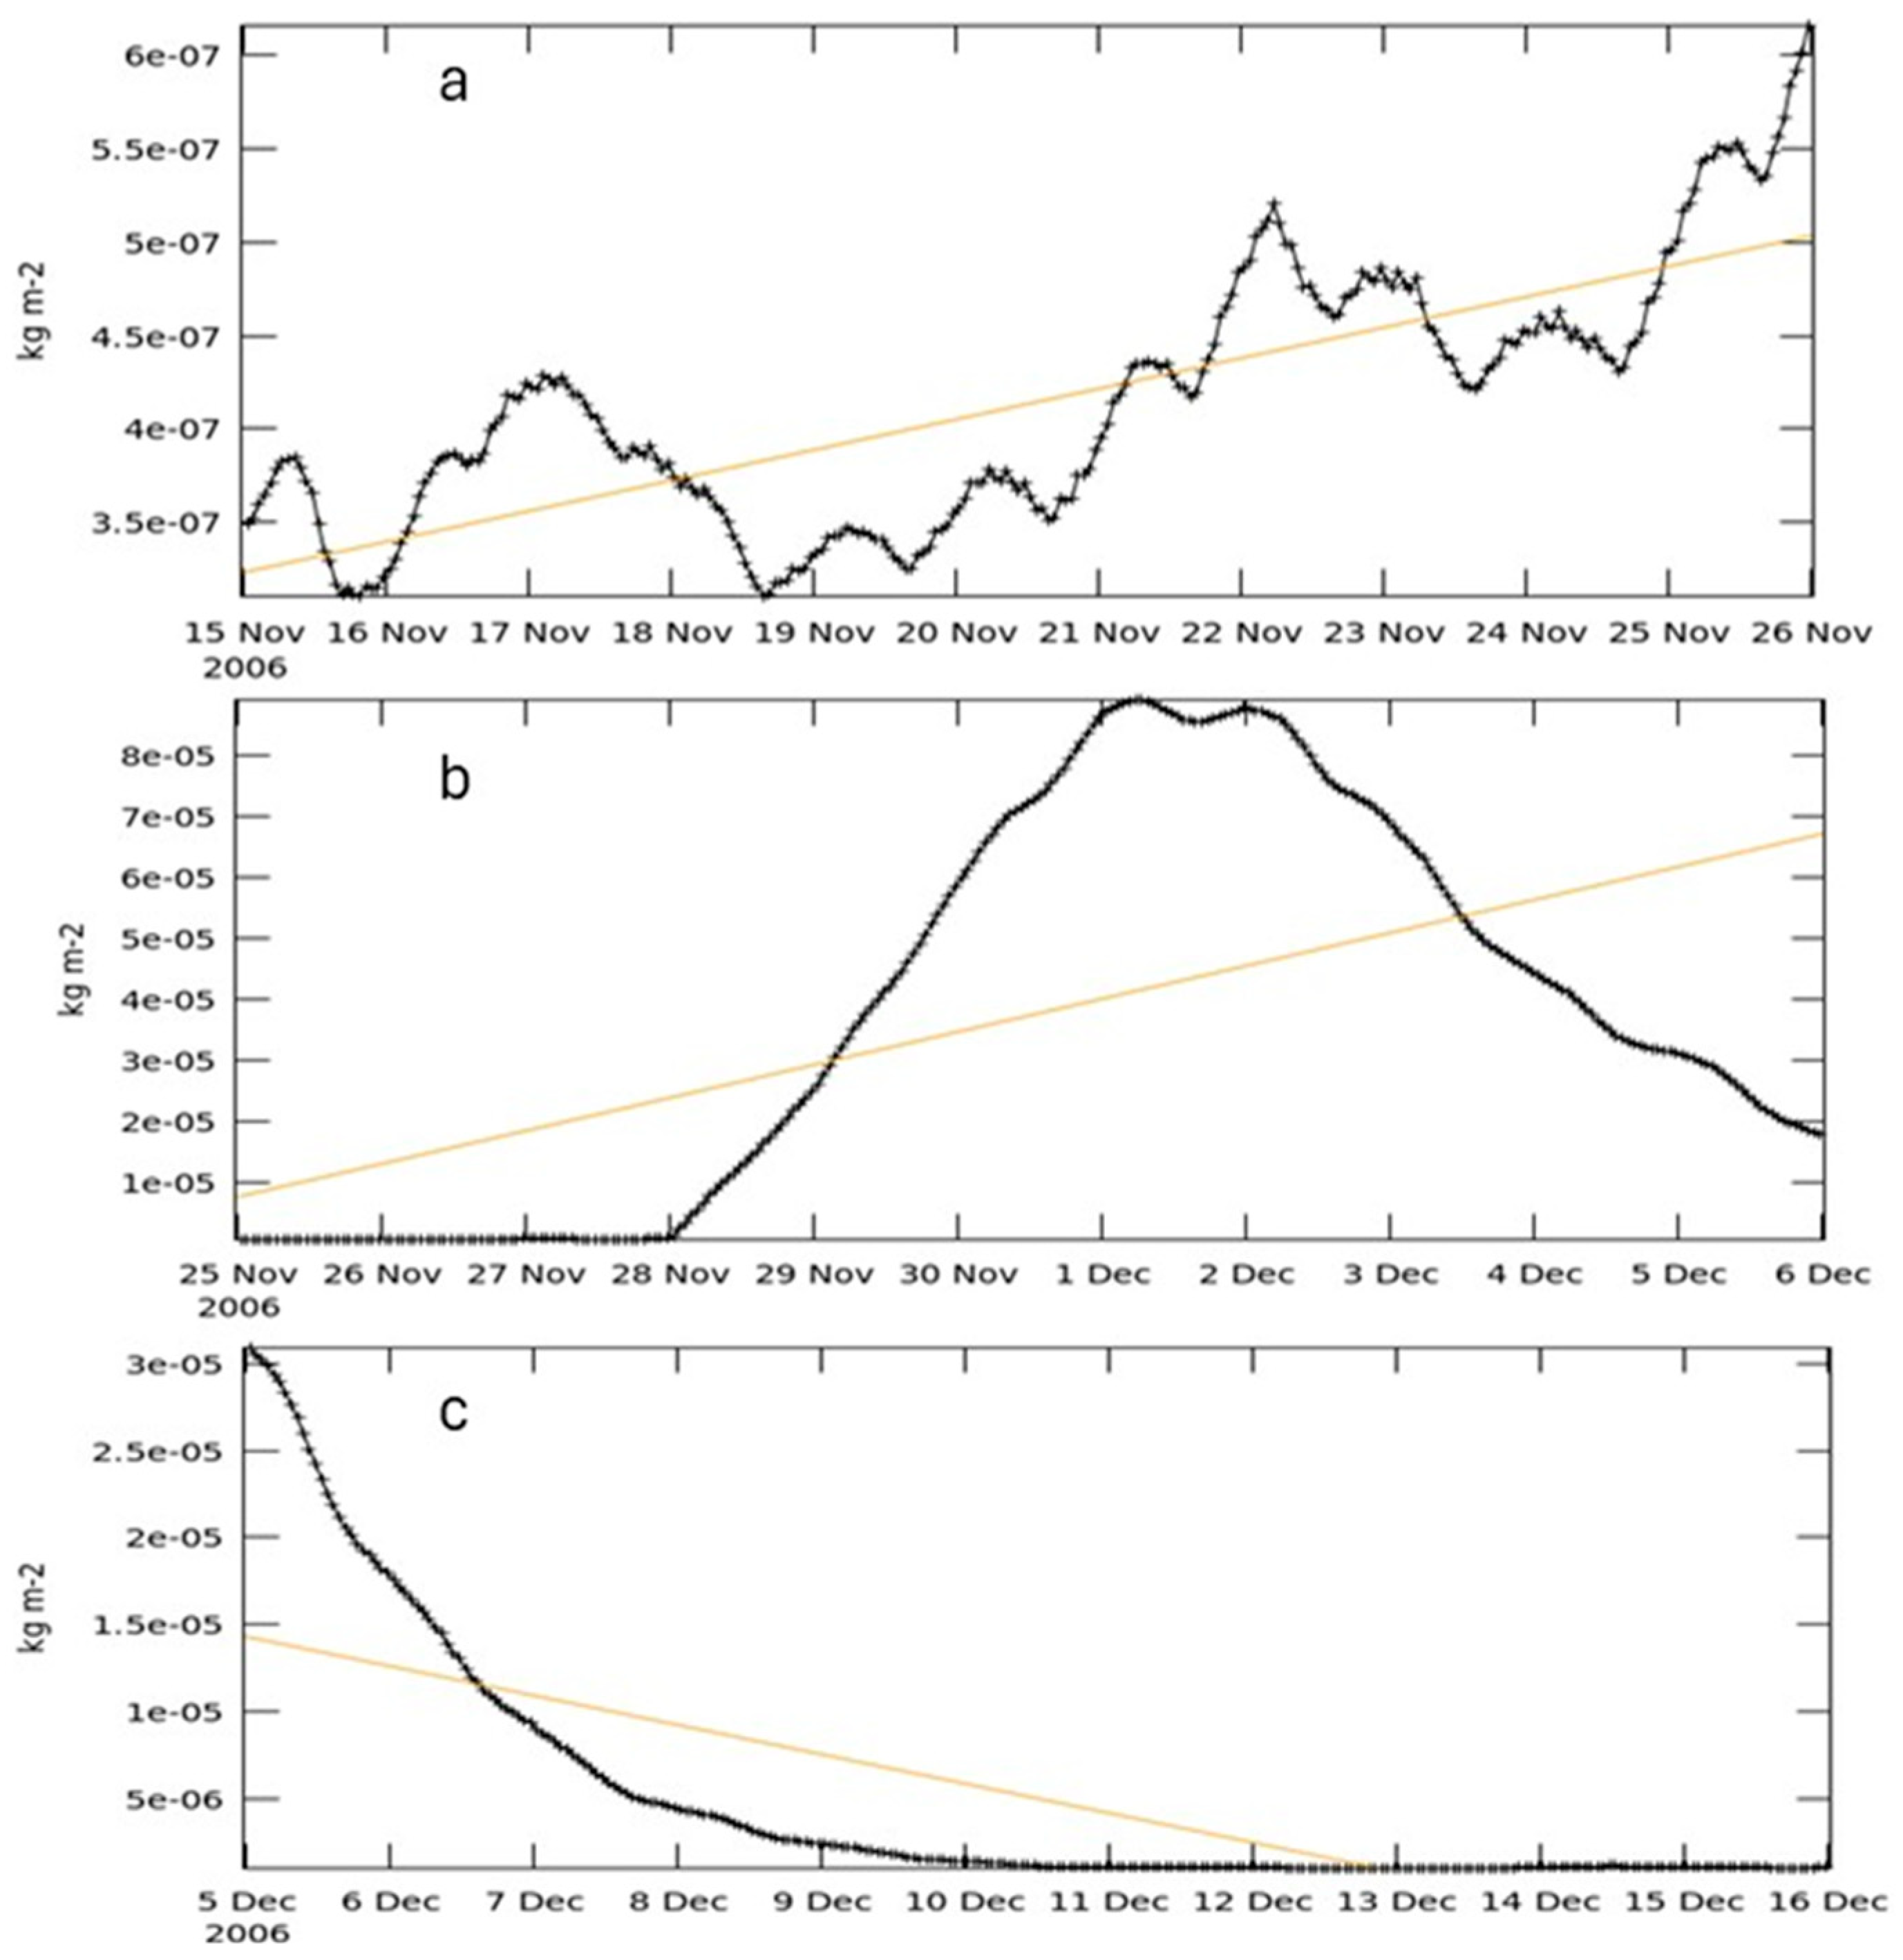
Estimating quantities like the production of SO2 throughout the period of emissions is difficult using satellite sensors alone even when having obtained hourly measurements of SO2. The MERRA-2 reanalysis hourly data in Figure 2 provide an advantage when assimilating aerosol diagnostics such as the SO2 column mass densities measured in kg·m−2 [13]. One-day observations are in this case distinct because, under the assumption of negligible satellite aliasing, each sample corresponds to a distinct region of the SO2 plume. It uses modern hyperspectral radiance and microwave observations, along with GPS–Radio Occultation datasets, to represent spatially the detection of SO2 and its evolved sulphates (SO4) [42]. In Figure 2, the highest emissions are shown to be starting from the 28th of November to the 2nd of December, with the satellite sensor detecting a high of 8 × 10⁻⁵ kg·m−2 on the four days. As can be seen in Figure 2, the peak emissions occurred between November 28th and December 2.
During these four days, the satellite sensor records the highest emissions of the Nyamuragira volcano at approximately ±8 × 10⁻⁵ kg·m−2. Beginning on the morning of December 2nd 2006, the sensor notes a rapid decline in SO2, which continues to decrease significantly until it reaches minimal observable atmospheric SO2 of <5 × 10⁻⁶ kg·m−2 starting on 9th December onwards. The straight-line fit is not statistically significant; it is simply intended to illustrate the general increasing and decreasing trends in SO2 levels across the different periods shown in Figure 2a–c.

4.2. Spatial Distribution of SO2 over Some Period

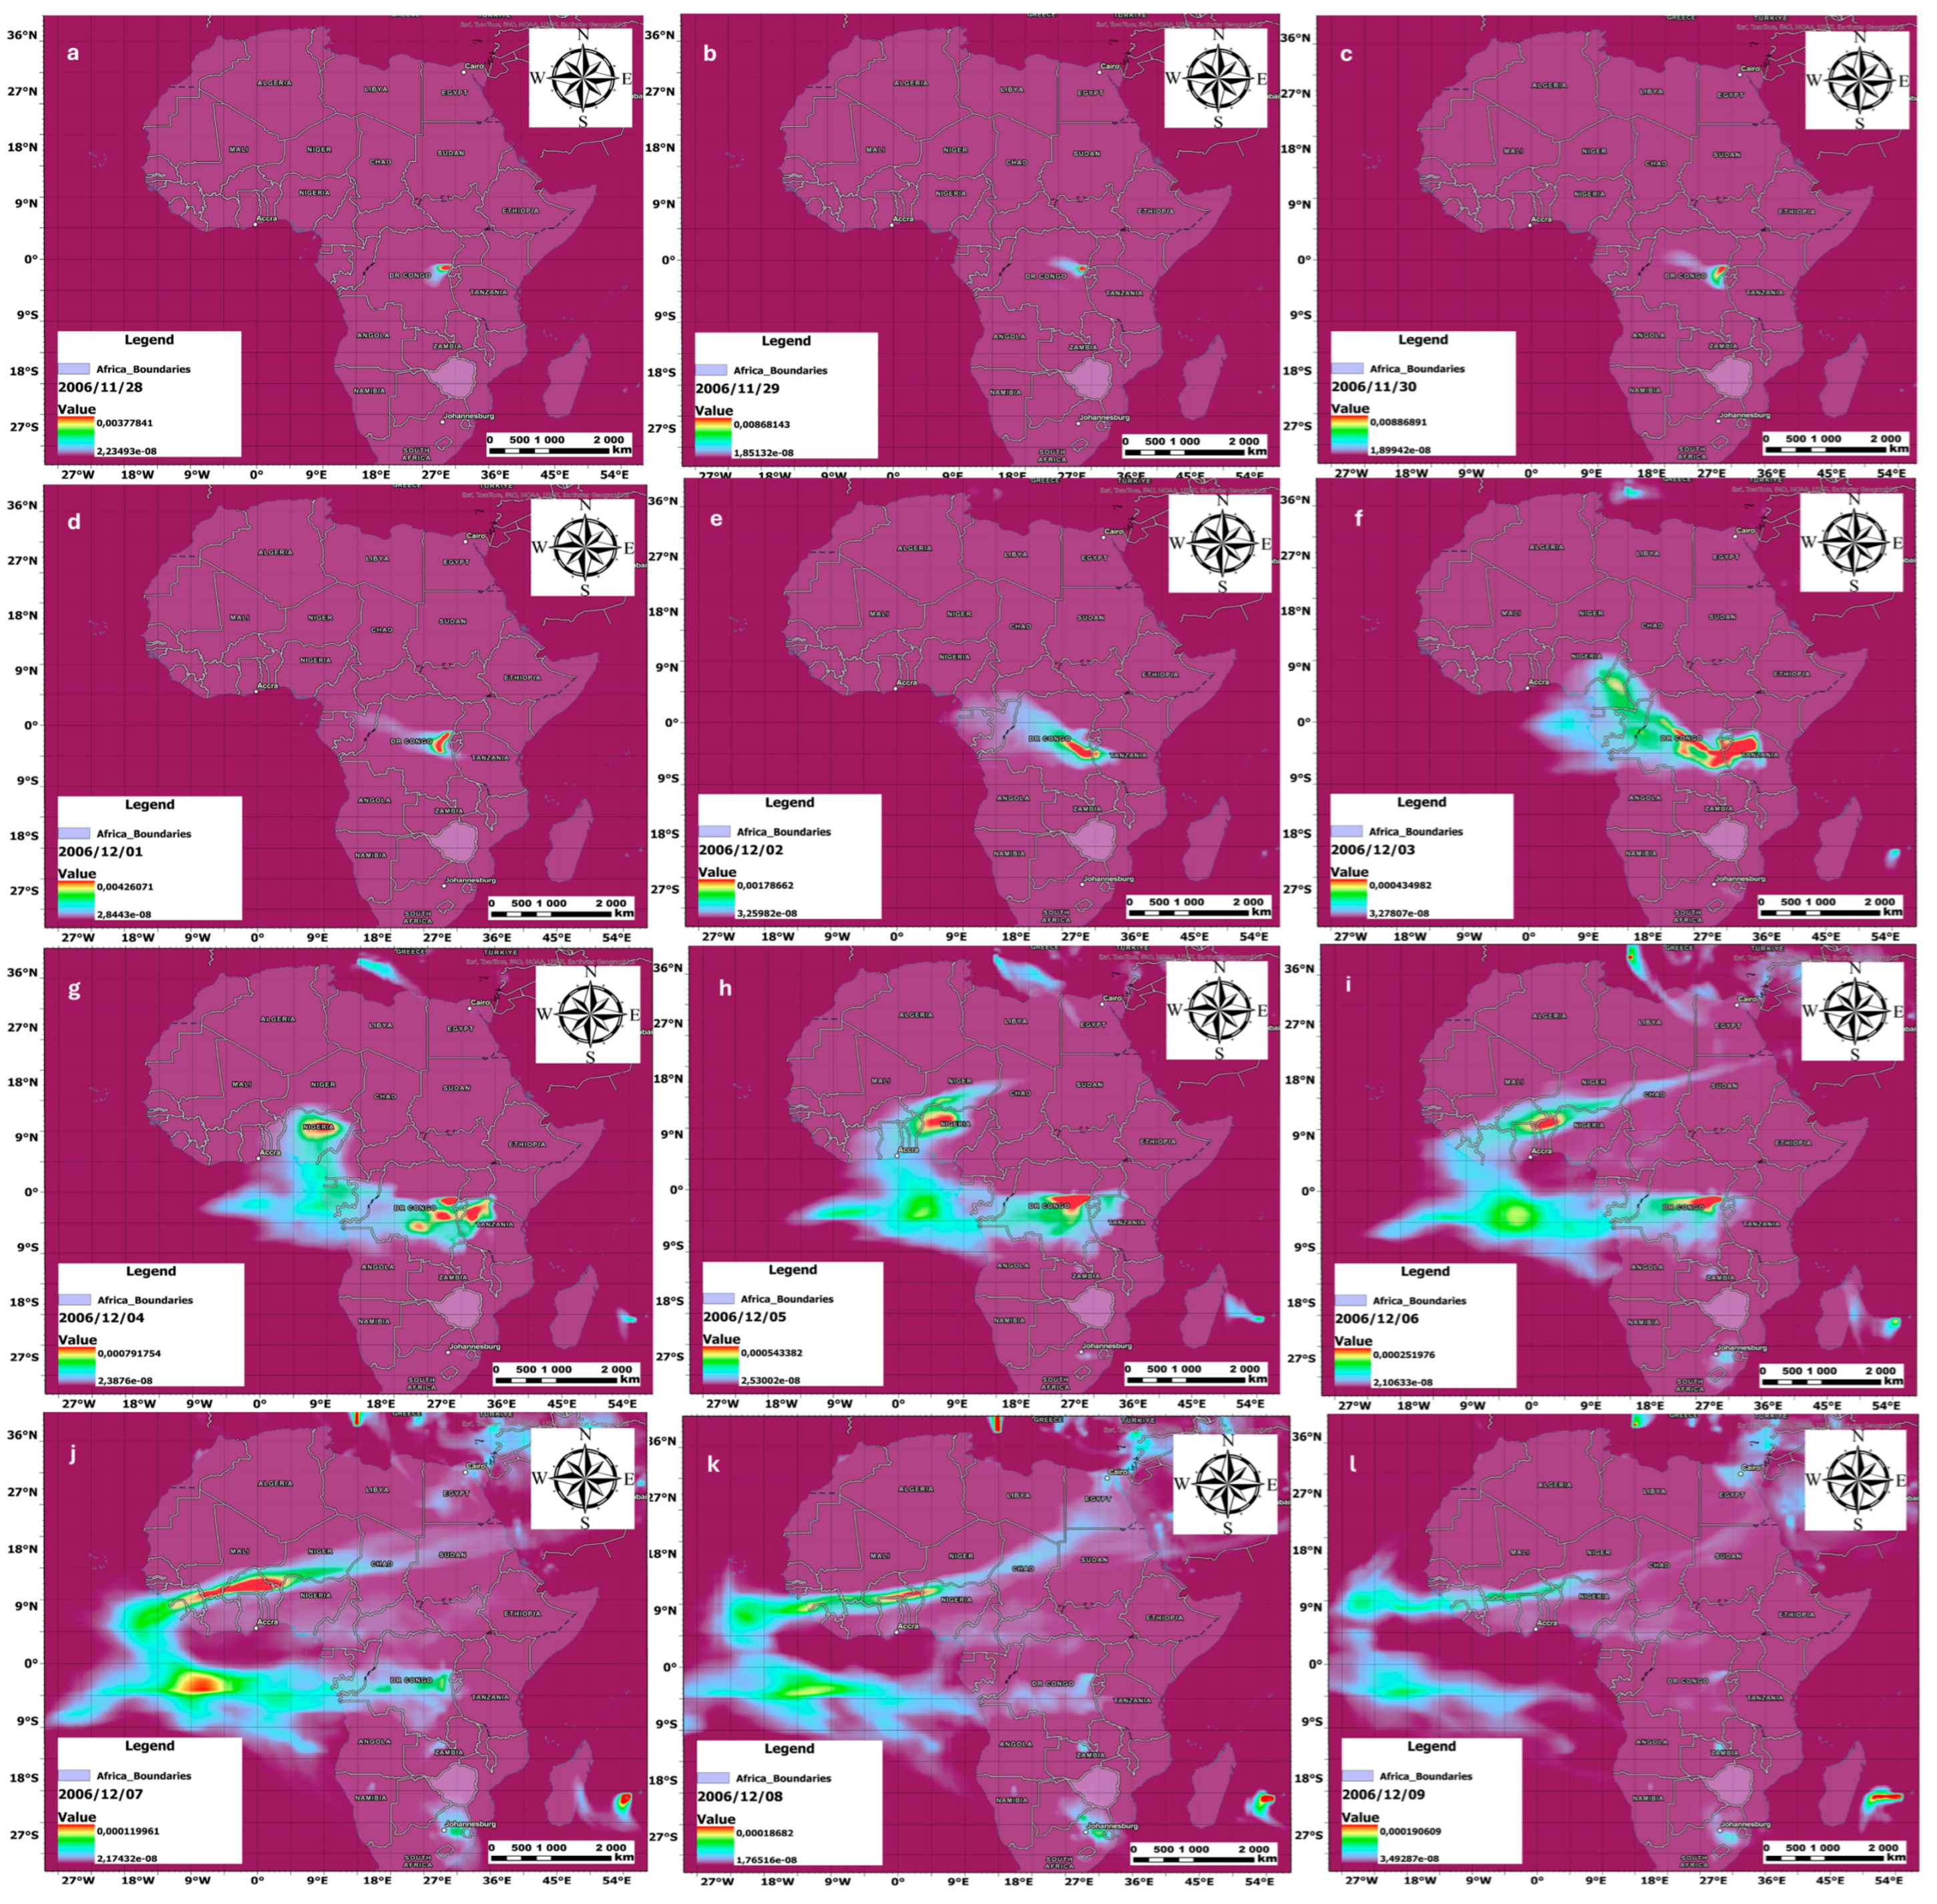
On the morning of the 28th of November 2006, early signs of SO2 from the Nyamuragira eruption were evident, measured hourly by the MERRA-2 reanalysis datasets (Figure 3). The rapid injection of SO2 in the atmosphere is evident on the sensor with the time series, area-averaged graph in Figure 2b, showing a rapid increase in SO2 concentrations measured hourly by the sensor. The Nyamuragira eruption lasted for several days, during which it injected large plumes of SO2 in the atmosphere, some directly into the stratosphere, which were influenced by the different vertical pressure surfaces at each column height along its swath (Figure S1) [43,44,45]. On the 27th and 28th of November, the SO2 in the atmosphere was experiencing 1000–850 Millibars (mb) surface pressures. Where 1000 mb is the surface in the atmosphere, the pressure at every point along that surface is 1000 mb. The SO2 emissions from the eruption have the potential to impact on human health and air quality [46,47]. Uncertainties in MERRA-2 SO2 data arise from constraints in the reanalysis model, its emission inventories, and assimilation methods, resulting in notable discrepancies when compared to ground-based observations [14].
However, SO2 injected into the stratosphere has profound climatic and chemical effects. It transforms into sulphate aerosols, which reflect sunlight, temporarily cooling the Earth’s surface for months to years, as seen after the 1991 Mount Pinatubo eruption. However, these aerosols also trigger chemical reactions that deplete ozone, thinning the ozone layer and increasing harmful UV radiation at the surface. Thus, while stratospheric SO2 can briefly lower global temperatures, it poses significant risks to climate stability, atmospheric chemistry, and public health, making it a complex element in natural events and potential climate interventions.

4.3. Transport and Dispersion of SO2

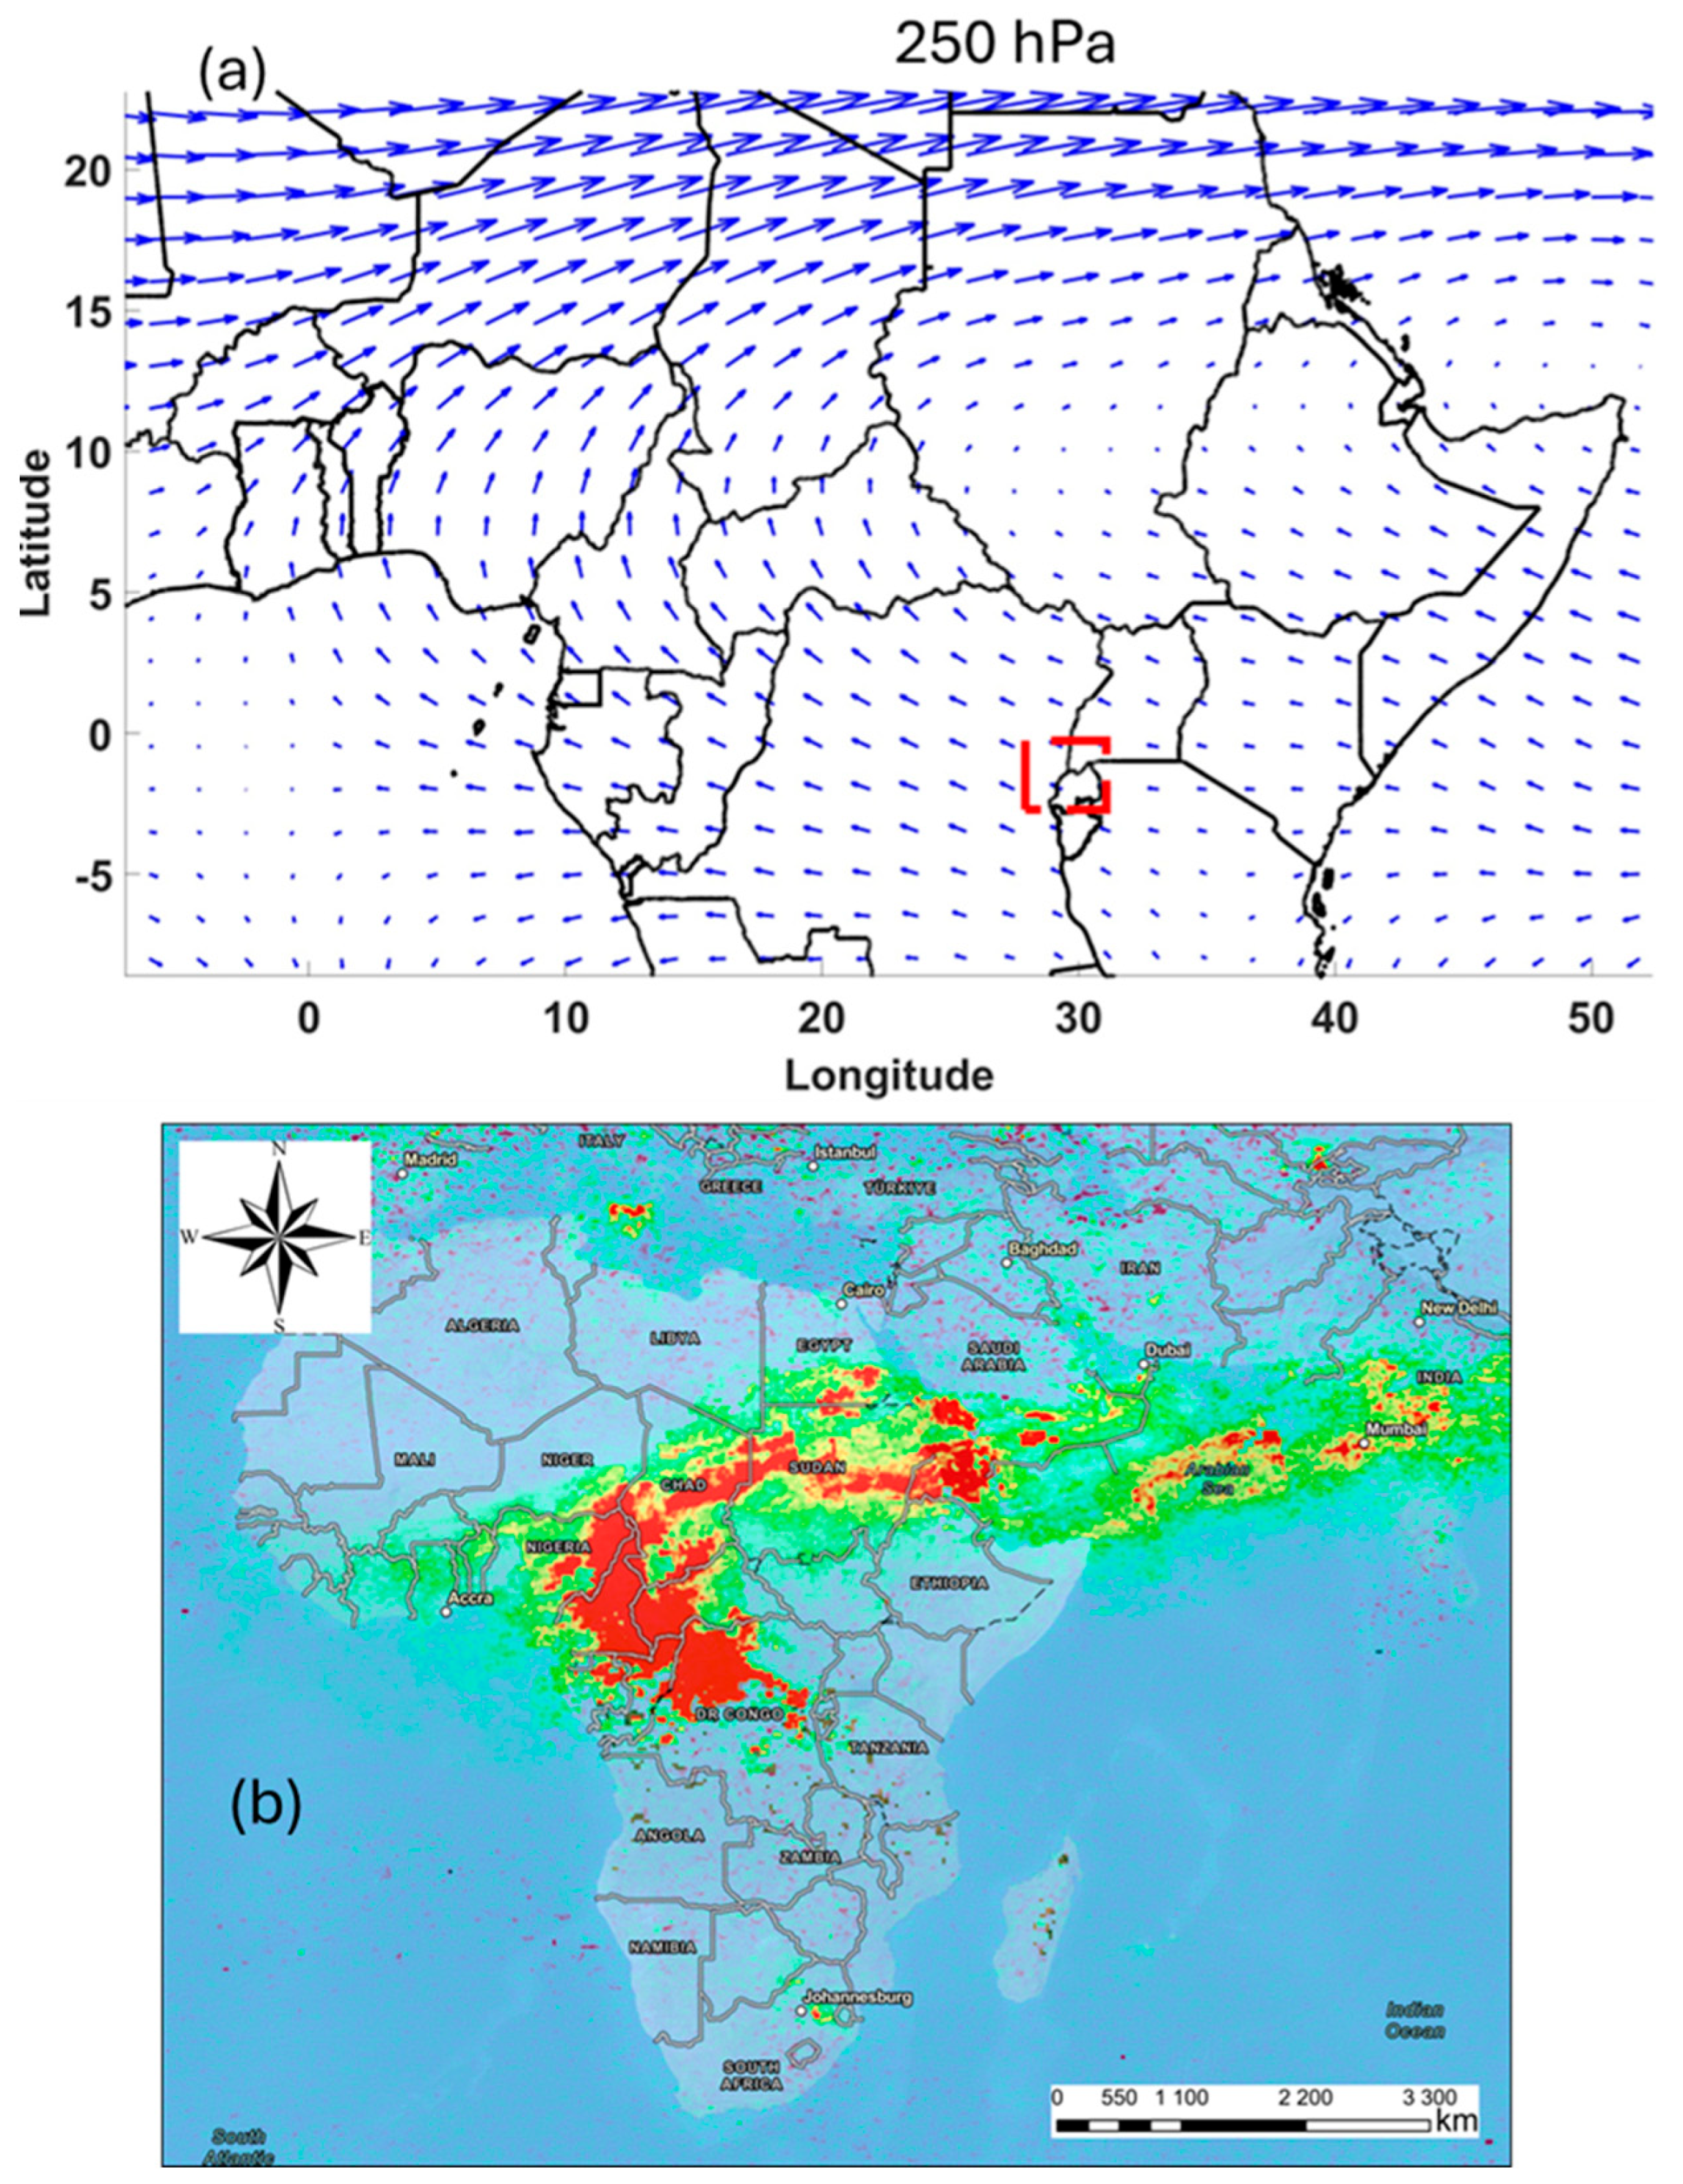
Figure 4a depicts the monthly averaged wind direction at 250 hPa or 250 mb for November 2006. During both months, northeasterly trade winds originating from the east are evident over the volcanic site (marked in red). These winds subsequently shift direction gradually from east to west. They carry volcanic aerosols from the DRC across northern African countries, reaching as far as Chad and Niger. These winds play a crucial role in dispersing and transporting volcanic aerosols throughout northern Africa. Figure 4b shows the OMI area-averaged SO2 plume dispersion data, illustrating the dispersion pattern over 20 days during the 28th of November 2006 eruption.

4.3.1. HYSPLIT Model

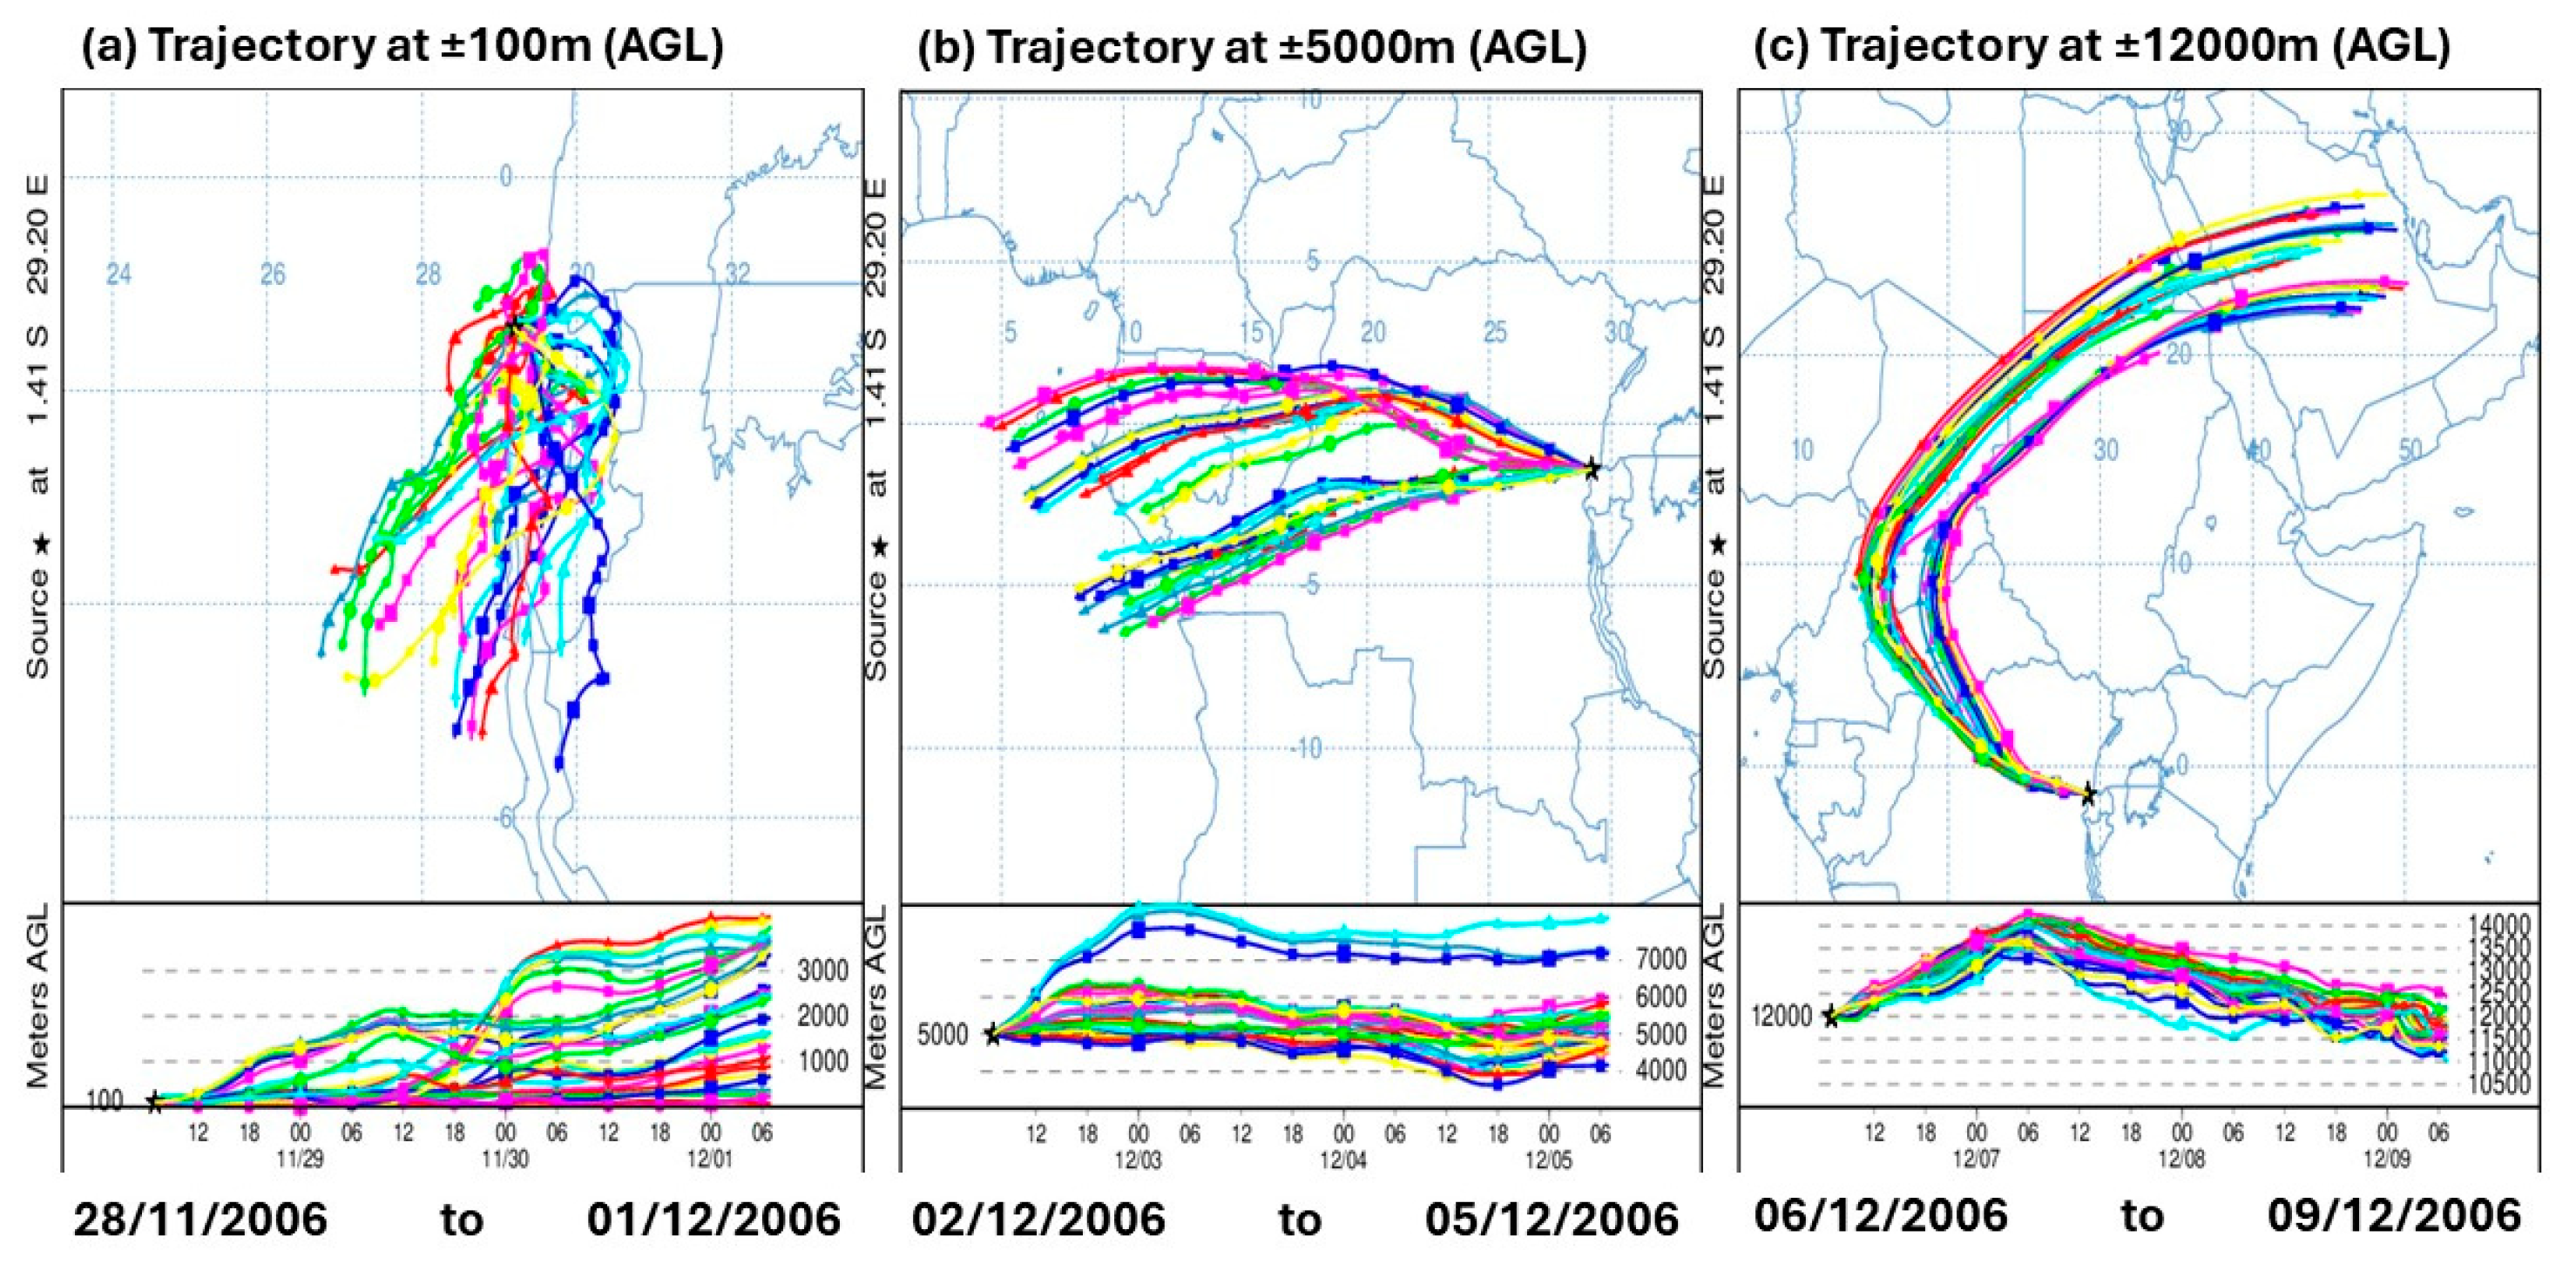
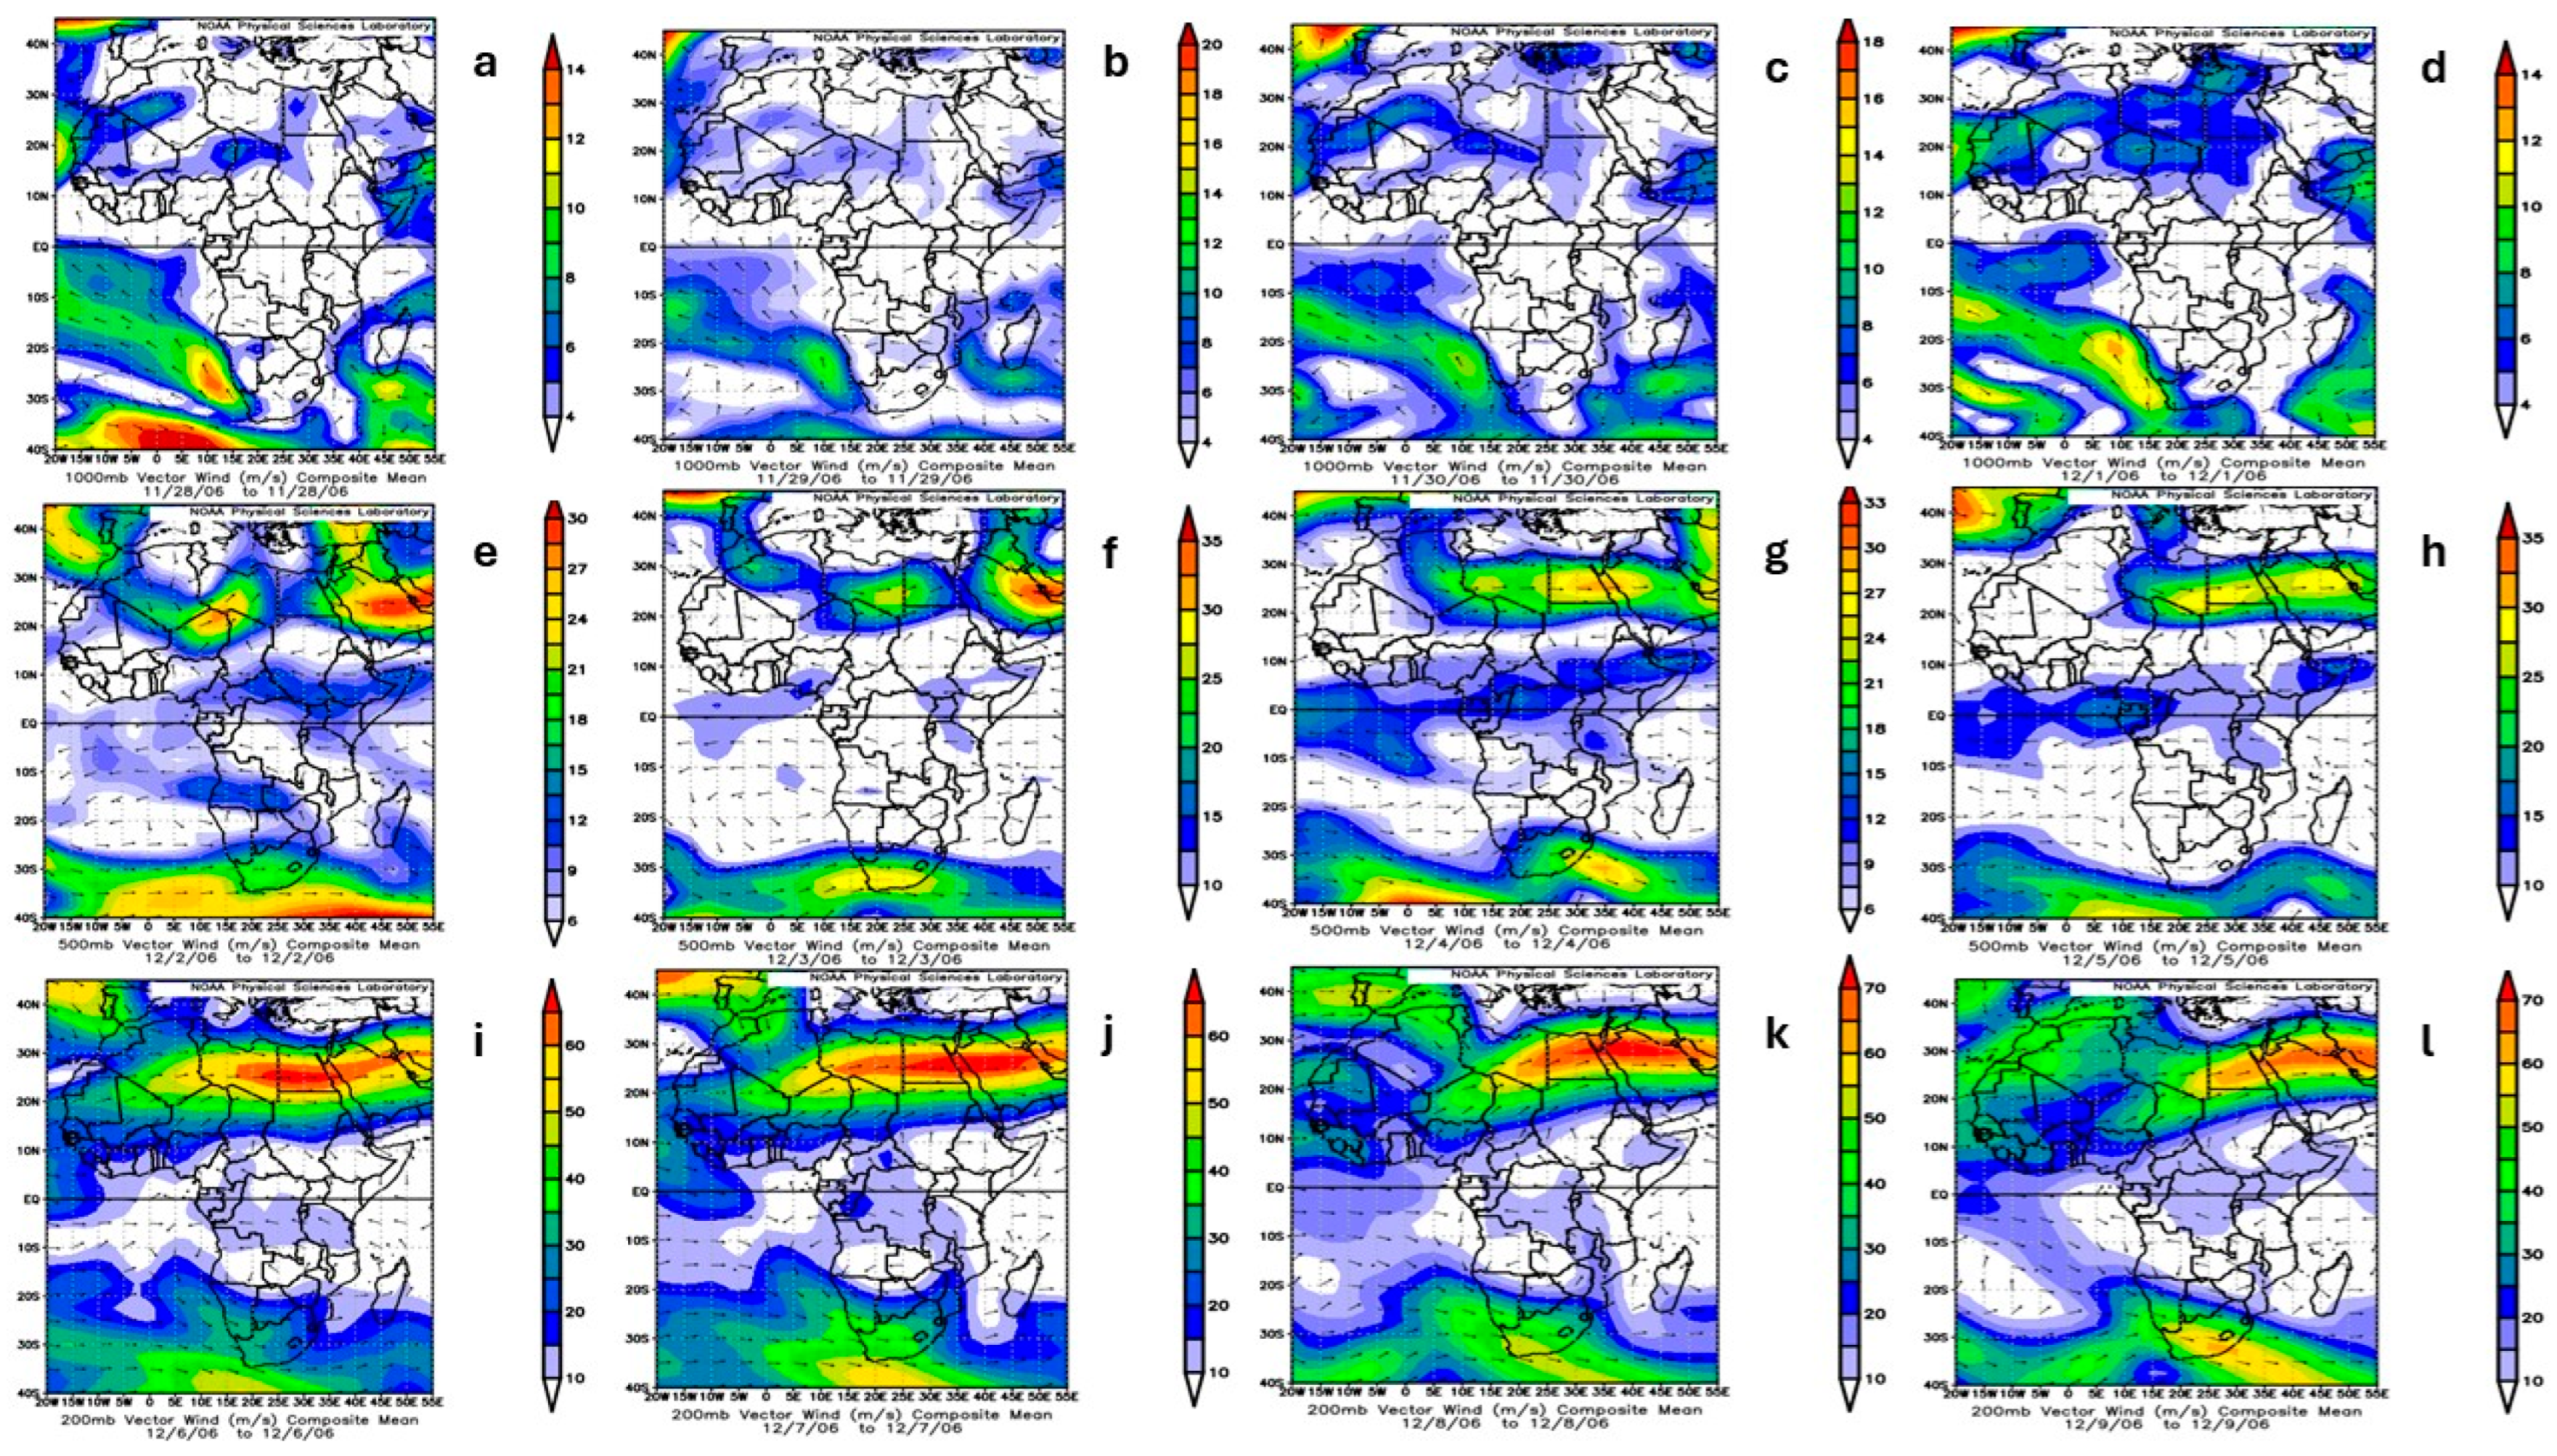
The HYSPLIT (Hybrid Single-Particle Lagrangian Integrated Trajectory) model allows us to create simulations of transport and dispersion of SO2 at multiple vertical levels affected by different conditions in the atmosphere, typically extending from the surface up to the several kilometres in stratosphere. The HYSPLIT trajectory model generates data on the SO2 plume trajectory by tracking an air parcel moved by the mean three-dimensional wind field of the meteorological model from the source. The altitudes shown in Figure 5, 100 m, 5000 m, and 12,000 m, represent different heights Above Ground Level (AGL) where transport and dispersion begin on those dates, corresponding to atmospheric pressure surfaces of 1200 mb, 500 mb, and 200 mb, respectively. Figure 5a shows how the 100 mb affected air parcel is transported from the source during the first four days of the eruption. Figure 5b illustrates 500 mb affected air parcel commencement at the source at 5000 m altitude above ground level, meaning that the SO2 at 5000 m altitude experiences a general westward direction. Figure 5b shows a mean general directional change being westwards at 5000 m affected by 500 mb surface pressure and increased wind speeds. Figure 5c shows the 200 mb pressure surface general trajectory at 12,000 m AGL is curved north-eastwards due to the subtropical jet stream effect which is seen to arrive significantly during the same time of the 6th of December 2006 (as seen in Figure 6i).
In this case, the air parcel is released from various atmospheric heights, namely, 100 m, 5000 m, and 12,000 m to demonstrate the effects of different altitudes on air parcel behaviour. The trajectories extend for 96 h per image, from 28th of November to 09th of December 2006, with measurements taken at 6 h intervals along the trajectory. Each point marks the start of a new hour. The HYSPLIT dispersion model effectively visualises SO2 plume transport across different release heights and pressure levels, highlighting the subtropical jet stream effects observed at 12,000 m AGL/200 mb surface from 06th to 09th of December 2006, which can also be observed with their corresponding wind speeds and directions in Figure 6i–l.
A key limitation of HYSPLIT is its simplified handling of chemical transformations, as it does not fully account for the complex atmospheric chemistry involved in converting SO2 into sulphate aerosols. This process depends on factors like humidity, temperature, and oxidant availability, which are not modelled in detail. Consequently, HYSPLIT may underestimate sulphate aerosol formation and persistence, critical for assessing SO2’s climate and health impacts. Additionally, the model underestimates long-term SO2 effects by neglecting secondary aerosol processes and extended atmospheric residence times. Its coarse vertical resolution and limited depiction of vertical mixing also lead to inaccuracies in simulating pollutant transport, especially in the upper troposphere or across stratified atmospheric layers. While HYSPLIT is effective for short-term, near-surface dispersion studies, caution is needed when using it to evaluate the broader, long-term effects of SO2 emissions on atmospheric chemistry and climate.

4.3.2. Jet Stream

The jet stream is typically identified on maps as regions where wind speeds increase towards the core of maximum strength, meaning that the wind intensifies as it approaches the core and weakens as it moves outward [48]. In Figure 6, the jet stream is depicted by the locations of highest or strongest wind velocities along the northern hemisphere of the map. This subtropical jet stream effect is observed beginning on the 2nd of December 2006 at the 500 mb, approximately ±5000 m in altitude, and it strengthens with increasing wind speeds until December 9th at the 200 mb level (see Figure 6l), roughly ±12,000 m above sea level, where the wind speeds begin to decrease.
After the injection period, as shown in Figure 3a–d, there is a discernible movement of the SO2 in a north-westerly direction, where the SO2 gets caught in the subtropical jet from the 4th December 2006.
On the 2nd to 5th of December, Figure 3e–h, the SO2 experiences lower atmospheric pressure at ±500 mb pressure surface, and rapidly increasing wind speeds, which lead to strong wind shears that create the initial stages of a curve between the SO2 plume. This can evidently be observed from the 5th of December 2006 onwards, where the SO2 plume is being redirected north-eastwards. On the 8th and 9th December (see Figure 6k,l), the mean wind speeds can be observed to be at a high of ±70 m·s−1, owing to the rapid rates of SO2 dispersion experiencing the ±200 mb pressure surfaces. With this, low observable SO2 densities can be seen on these days averaging <5 × 10⁻⁶ kg·m−2 (see Figure 2c).
The strong wind shearing effects of the subtropical jet stream can evidently be seen dispersing the SO2 cloud in Figure 3g–l above, from the 4th of December to the 9th of December. The SO2 dispersion at ±200 mb surface experiences a subtropical jet located at 30° latitude. It should be noted that the jet stream does not reside at any one particular height, but it is rather extended randomly across the swath area and column at different heights.
This explains further dispersion of SO2 along the north-westward trajectory with a decrease in SO2 column mass densities in the stratosphere measured in kg·m−2 depicted by the MERRA-2 reanalysis dataset from the 3rd of December 2006 as seen in Figure 2, of the hourly measured time series, area-averaged graphs. The 2nd of December indicated a sudden decay in detectable SO2 per kg·m−2 in the atmosphere and coherently indicates the arrival of the subtropical jet stream.

4.4. Vertical Distribution of Volcanic Aerosols

Figure 7 illustrates the latitude–altitude extinction coefficient profile across the Democratic Republic of Congo (DRC). On 28 November 2006, Figure 7a depicts a notable extinction coefficient exceeding 2 Mm−1 around latitudes −5° to 5°, attributed to volcanic aerosols from an eruption. These aerosols were identified in the stratosphere, spanning altitudes of 15 to 21 km, clearly classified as volcanic ash (subplot in Figure 7a). Figure 7b further delineates two distinct volcanic aerosol plumes: one between 15 and 18 km (lower plume) and another between 19 and 21 km (upper plume). The lower plume exhibited a higher concentration of volcanic aerosols compared to the upper plume, indicating heavier aerosols that tend to settle closer to the Earth’s surface. One implication of volcanic aerosols in the stratosphere is their absorption of longwave radiation emitted by the Earth’s surface, resulting in cooling of the troposphere below.
Sulphate aerosols in the troposphere influence Earth’s climate by reflecting incoming sunlight and increasing the planet’s albedo, thereby reducing the amount of solar energy that reaches the surface. This scattering of solar radiation results in a cooling effect on both the troposphere and the surface. Additionally, these aerosols diffuse sunlight, diminishing direct solar input at the surface, which can affect local climate dynamics, rates of evaporation, and photosynthetic activity. However, because sulphate aerosols remain in the troposphere for only a short period (ranging from days to weeks), their climatic effects are relatively short-lived compared to those of stratospheric aerosols [49].

5. Conclusions

This study demonstrates the effective integration of satellite-based and global atmospheric reanalysis datasets to simulate the dispersion of SO2 plumes from the Mount Nyamuragira 2006 volcanic eruption. By combining data from the OMI and MERRA-2, we have developed a comprehensive model that captures the complexities of SO2 plume dynamics under varying meteorological conditions.
Our findings highlight the strengths of integrating high-resolution satellite observations with extensive reanalysis datasets. While satellite sensors provide precise measurements of SO2 concentrations, they alone are limited in capturing the full extent of plume dispersion and production rates over time. The combination of the MERRA-2 and OMI datasets derived from hourly data are distinctive in that they sample distinct regions of the SO2 plume (presuming minimal satellite aliasing) and take into account additional factors like wind directions, speeds, and heights in order to explain the dispersion pattern. MERRA-2 fills this gap by offering a robust record of atmospheric conditions, including wind speeds, directions, temperatures, and pressures, which are critical for accurate dispersion simulations. These reanalysis data support a broader and more integrated view of atmospheric processes, making it invaluable for understanding natural or anthropogenic SO2 pollutant transport on larger scales.
The synergy between the OMI’s detailed atmospheric composition measurements and MERRA-2’s global atmospheric conditions allows for an enhanced visualisation of SO2 dispersion patterns and extinction rates. The observed simulations reveal a consistent north-eastward curvature in the SO2 plume trajectory, influenced by the subtropical jet stream, which aligns well with observed patterns from both the OMI and MERRA-2 datasets. This alignment underscores the efficacy of our combined approach in elucidating SO2 plume behaviour and supports the accuracy of our models/concepts for simulating plume dynamics under various meteorological conditions. This approach not only enhances the simulation of aerosol transport but also provides a valuable framework for assessing volcanic emissions and their environmental impacts over extended temporal and spatial scales. This study of volcanic eruption emissions is essential for understanding their significant and widespread effects on climate, the environment, human health, and aviation. Furthermore, for several decades, remotely sensed Earth observation (EO) data and traditional environmental measurements have provided the climate community with valuable datasets that contribute to addressing the United Nations 2030 Sustainable Development Goals [50].
In general, several key factors influence the amount of SO2 released during a volcanic eruption. The eruption’s size and nature are significant—explosive eruptions generally discharge more SO2 than smaller, less violent ones. The sulphur content of the magma also plays a major role, as magma with higher sulphur levels emits more SO2 when it erupts. Atmospheric conditions, including wind speed and direction, temperature, and humidity, affect how far and fast SO2 disperses, impacting air quality across wide areas. The height of the eruption column determines how high the gas reaches in the atmosphere; if it enters the stratosphere, it can lead to longer-term climate effects. Lastly, the volcano’s location—particularly its distance from populated regions and local weather patterns—affects the extent of environmental and public health consequences.
Future work will include research into how increased volcanic activity influences regional and global weather/climate patterns.

Supplementary Materials

The following supporting information can be downloaded at https://www.mdpi.com/article/10.3390/earth6030102/s1. Figure S1: Showing the different pressure surfaces in the atmosphere, troposphere and stratosphere.

Author Contributions

Conceptualisation, T.M., M.M., and L.S.; methodology, T.M., M.M., and L.S.; validation, T.M. and M.M.; formal analysis, T.M. and M.M.; investigation, T.M.; writing—original draft preparation, T.M.; writing—review and editing, M.M. and L.S. All authors have read and agreed to the published version of the manuscript.

Funding

This research received no external funding.

Institutional Review Board Statement

Not applicable.

Informed Consent Statement

Not applicable.

Data Availability Statement

The data used in this study are freely accessible and available. The MERRA-2 and OMI data are accessible at https://giovanni.gsfc.nasa.gov/ (last accessed on 25 May 2025), HYSPLIT model data were accessed at https://www.ready.noaa.gov/HYSPLIT.php, (last accessed on 12 June 2025) and the CALIPSO data were accessed at https://asdc.larc.nasa.gov/project/CALIPSO (last accessed on 20 June 2025).

Acknowledgments

The authors would like to thank all the institutions and organisation that made the data free accessible to use. The CALIPSO data were obtained from the NASA Langley Atmospheric Sciences Data Center. The OMI and MERRA-2 data were obtained from Giovanni, a web application developed by NASA’s Goddard Earth Science Data and Information Services Center (GES DISC), while the HYSPLIT model. The authors also gratefully acknowledge the NOAA Air Resources Laboratory (ARL) for the provision of the HYSPLIT model data.

Conflicts of Interest

The authors declare no conflicts of interest.

References

  1. Hughes, E.J.; Sparling, L.C.; Carn, S.A.; Krueger, A.J. Using horizontal transport characteristics to infer an emission height time series of volcanic SO2. J. Geophys. Res. Atmos. 2012, 117, D18301. [Google Scholar] [CrossRef]
  2. Fisher, R.V. Models for pyroclastic surges and pyroclastic flows. J. Volcanol. Geotherm. Res. 1979, 6, 305–318. [Google Scholar] [CrossRef]
  3. Robock, A.; Oppenheimer, C. (Eds.) Volcanism and the Earth’s Atmosphere; Geophysical Monograph 139; American Geophysical Union: Washington, DC, USA, 2003; 360p. [Google Scholar]
  4. Paez, P.A.; Cogliati, M.G.; Caselli, A.T.; Monasterio, A.M. An analysis of volcanic SO2 and ash emissions from Copahue volcano. J. S. Am. Earth Sci. 2021, 110, 103365. [Google Scholar] [CrossRef]
  5. Valentine, G.A. Stratified flow in pyroclastic surges. Bull. Volcanol. 1987, 49, 616–630. [Google Scholar] [CrossRef]
  6. Druitt, T.; Calder, E.S.; Cole, P.; Hoblitt, R.; Loughlin, S.; Norton, G.; Ritchie, L.; Sparks, R.; Voight, B. Small-volume, highly mobile pyroclastic flows formed by rapid sedimentation from pyroclastic surges at Soufrière Hills Volcano, Montserrat: An important volcanic hazard. Geol. Soc. Lond. Mem. 2002, 21, 263–279. [Google Scholar] [CrossRef]
  7. Prata, A.J.; Kerkmann, J. Simultaneous retrieval of volcanic ash and SO2 using MSG-SEVIRI measurements. Geophys. Res. Lett. 2007, 34, L05813. [Google Scholar] [CrossRef]
  8. Liu, T.; Chan, A.W.; Abbatt, J.P. Multiphase oxidation of sulphur dioxide in aerosol particles: Implications for sulfate formation in polluted environments. Environ. Sci. Technol. 2021, 55, 4227–4242. [Google Scholar] [CrossRef] [PubMed]
  9. Chen, S.Y.; Chan, C.C.; Su, T.C. Particulate and gaseous pollutants on inflammation, thrombosis, and autonomic imbalance in subjects at risk for cardiovascular disease. Environ. Pollut. 2017, 223, 403–408. [Google Scholar] [CrossRef] [PubMed]
  10. Rodríguez-Villamizar, L.A.; Rojas-Roa, N.Y.; Fernández-Niño, J.A. Short-term joint effects of ambient air pollutants on emergency department visits for respiratory and circulatory diseases in Colombia, 2011–2014. Environ. Pollut. 2019, 248, 380–387. [Google Scholar] [CrossRef]
  11. Seinfeld, J.H.; Pandis, S.N. Atmospheric Chemistry and Physics: From Air Pollution to Climate Change, 3rd ed.; John Wiley & Sons: Hoboken, NJ, USA, 2016. [Google Scholar]
  12. Spinei, E.; Carn, S.A.; Krotkov, N.A.; Mount, G.H.; Yang, K.; Krueger, A. Validation of Ozone Monitoring Instrument SO2 measurements in the Okmok volcanic cloud over Pullman, WA, July 2008. J. Geophys. Res. Atmos. 2010, 115, D00L08. [Google Scholar] [CrossRef]
  13. Lovejoy, S.; Varotsos, C. Scaling regimes and linear/nonlinear responses of last millennium climate to volcanic and solar forcings. Earth Syst. Dynam. 2016, 7, 133–150. [Google Scholar] [CrossRef]
  14. Ukhov, A.; Mostamandi, S.; Krotkov, N.; Flemming, J.; da Silva, A.; Li, C.; Fioletov, V.; McLinden, C.; Anisimov, A.; Alshehri, Y.M.; et al. Study of SO2 Pollution in the Middle East Using MERRA-2, CAMS Data Assimilation Products, and High-Resolution WRF-Chem Simulations. J. Geophys. Res. Atmos. 2020, 125, e2019JD031993. [Google Scholar] [CrossRef]
  15. Shikwambana, L.; Sivakumar, V.; Xongo, K. Tracking the transport of SO2 and sulphate aerosols from the Tonga volcanic eruption to South Africa. Atmosphere 2023, 14, 1556. [Google Scholar] [CrossRef]
  16. Chai, T.; Crawford, A.; Stunder, B.; Pavolonis, M.J.; Draxler, R.; Stein, A. Improving volcanic ash predictions with the HYSPLIT dispersion model by assimilating MODIS satellite retrievals. Atmos. Chem. Phys. 2017, 17, 2865–2879. [Google Scholar] [CrossRef]
  17. Michellier, C.; Katoto, P.d.; Dramaix, M.; Nemery, B.; Kervyn, F. Respiratory health and eruptions of the Nyiragongo and Nyamulagira Volcanoes in the Democratic Republic of Congo: A time series analysis. Environ. Health 2020, 19, 62. [Google Scholar] [CrossRef]
  18. Li, L.; Kervyn, M.; Canters, F. Mapping the vegetation colonization on recent lava flows using spectral unmixing of moderate spatial resolution satellite images: Nyamuragira volcano, D.R. Congo. In Proceedings of the EGU General Assembly Conference Abstracts, Vienna, Austria, 27 April–2 May, 2014; p. 3773. [Google Scholar]
  19. Kayiranga, A.; Kurban, A.; Nahayo, L.; Ndayisaba, F. Assessing Forest cover changes in Volcanoes Parks Region of East-Central Africa using Landsat imagery. J. Environ. Prot. Sustain. Dev. 2018, 4, 16–25. [Google Scholar]
  20. Verbeken, J.; De Temmerman, L.; Goossens, R.; Lavreau, J.; De Maeyer, P. Classification of the vegetation in the Virunga National Park (D.R. Congo) by integrating past mission reports into Landsat-TM and Terra ASTER sensors. New Strateg. Eur. Remote Sens. 2005, 11, 11–16. [Google Scholar]
  21. Udahogora, M.; Yang, Z.; Nzabarinda, V.; Akbar, I.; Mindje, R.; Umwali, E.D. Comparing factors conditioning landscape change during volcanic eruption at Virunga National Park, East Africa. Appl. Ecol. Environ. Res. 2021, 19, 3789–3803. [Google Scholar] [CrossRef]
  22. Pouclet, A.; Bram, K. Nyiragongo and Nyamuragira: A review of volcanic activity. Bull. Volcanol. 2021, 83, 35. [Google Scholar] [CrossRef]
  23. Benoît, S.; Wauthier, C.; d’Oreye, N. A new map of the lava flow field of Nyamulagira (D.R. Congo) from satellite imagery. J. Afr. Earth Sci. 2010, 58, 778–786. [Google Scholar] [CrossRef]
  24. Head, E.M.; Shaw, A.M.; Wallace, P.J.; Sims, K.W.; Carn, S.A. Insight into volatile behavior at Nyamuragira volcano (D.R. Congo, Africa) through olivine hosted melt inclusions. Geochem. Geophys. Geosyst. 2011, 12, Q10013. [Google Scholar] [CrossRef]
  25. Balagizi, C.M.; Kasereka, M.M.; Cuoco, E.; Liotta, M. Rain-plume interactions at Nyiragongo and Nyamulagira volcanoes and associated rainwater hazards, East Africa. Geophys. Res. 2017, 81, 76–89. [Google Scholar] [CrossRef]
  26. Levelt, P.F.; van den Oord, G.H.J.; Dobber, M.R.; Malkki, A.; Visser, H.; de Vries, J.; Stammes, P.; Lundell, J.O.V.; Saari, H. The Ozone Monitoring Instrument. IEEE Trans. Geosci. Remote Sens. 2006, 44, 1093–1101. [Google Scholar] [CrossRef]
  27. Liu, X.; Bhartia, P.K.; Chance, K.; Spurr, R.J.D.; Kurosu, T.P. Ozone profile retrievals from the Ozone Monitoring Instrument. Atmos. Chem. Phys. 2010, 10, 2521–2537. [Google Scholar] [CrossRef]
  28. Kroon, M.; de Haan, J.F.; Veefkind, J.P.; Froidevaux, L.; Wang, R.; Kivi, R.; Hakkarainen, J.J. Validation of operational ozone profiles from the Ozone Monitoring Instrument. J. Geophys. Res. Atmos. 2011, 116, D18305. [Google Scholar] [CrossRef]
  29. Levelt, P.F.; Joiner, J.; Tamminen, J.; Veefkind, J.P.; Bhartia, P.K.; Stein Zweers, D.C.; Duncan, B.N.; Streets, D.G.; Eskes, H.; van der A, R.; et al. The Ozone Monitoring Instrument: Overview of 14 years in space. Atmos. Chem. Phys. 2018, 18, 5699–5745. [Google Scholar] [CrossRef]
  30. Randles, C.A.; Silva, A.M.d.; Buchard, V.; Colarco, P.R.; Darmenov, A.; Govindaraju, R.; Smirnov, A.; Holben, B.; Ferrare, R.; Hair, J.; et al. The MERRA-2 aerosol reanalysis, 1980 onward. Part I: System description and data assimilation evaluation. J. Clim. 2017, 30, 6823–6850. [Google Scholar] [CrossRef]
  31. Buchard, V.; Randles, C.A.; da Silva, A.M.; Darmenov, A.; Colarco, P.R.; Govindaraju, R.; Ferrare, R.; Hair, J.; Beyersdorf, A.J.; Ziemba, L.D.; et al. The MERRA-2 aerosol reanalysis, 1980 onward. Part II: Evaluation and case studies. J. Clim. 2017, 30, 6851–6872. [Google Scholar] [CrossRef] [PubMed]
  32. Gelaro, R.; McCarty, W.; Suárez, M.J.; Todling, R.; Molod, A.; Takacs, L.; Randles, C.A.; Darmenov, A.; Bosilovich, M.G.; Reichle, R.; et al. The Modern-Era Retrospective Analysis for Research and Applications, Version 2 (MERRA-2). J. Clim. 2017, 30, 5419–5454. [Google Scholar] [CrossRef] [PubMed]
  33. Winker, D.M.; Pelon, J.; Coakley, J.A.; Ackerman, S.A.; Charlson, R.J.; Colarco, P.R.; Flamant, P.; Fu, Q.; Hoff, R.M.; Kittaka, C.; et al. The CALIPSO mission: A global 3D view of aerosols and clouds. Bull. Am. Meteorol. Soc. 2010, 91, 1211–1230. [Google Scholar] [CrossRef]
  34. Hunt, W.H.; Winker, D.M.; Vaughan, M.A.; Powell, K.A.; Lucker, P.L.; Weimer, C. CALIPSO Lidar description and performance assessment. J. Atmos. Ocean. Technol. 2009, 26, 1214–1228. [Google Scholar] [CrossRef]
  35. Vaughan, M.A.; Powell, K.A.; Kuehn, R.E.; Young, S.A.; Winker, D.M.; Hostetler, C.A.; Hunt, W.H.; Liu, Z.Y.; McGill, M.J.; Getzewich, B.J. Fully automated detection of cloud and aerosol layers in the CALIPSO lidar measurements. J. Atmos. Ocean. Technol. 2009, 26, 2034–2050. [Google Scholar] [CrossRef]
  36. Tackett, J.L.; Winker, D.M.; Getzewich, B.J.; Vaughan, M.A.; Young, S.A.; Kar, J. CALIPSO lidar level 3 aerosol profile product: Version 3 algorithm design. Atmos. Meas. Tech. 2018, 11, 4129–4152. [Google Scholar] [CrossRef] [PubMed]
  37. Zeng, S.; Vaughan, M.; Liu, Z.; Trepte, C.; Kar, J.; Omar, A.; Winker, D.; Lucker, P.; Hu, Y.; Getzewich, B.; et al. Application of high-dimensional fuzzy K-means cluster analysis to CALIOP/CALIPSO version 4.1 cloud-aerosol discrimination. Atmos. Meas. Tech. 2019, 12, 2261–2285. [Google Scholar] [CrossRef]
  38. Nawaz, H.; Tariq, S.; Haq, Z.u.; Mehmood, U. Identifying the natural and anthropogenic drivers of absorbing aerosols using OMI data and HYSPLIT model over South Asia. Air Qual. Atmos. Health 2023, 16, 2553–2577. [Google Scholar] [CrossRef]
  39. Draxler, R.R.; Hess, G.D. An Overview of the HYSPLIT_4 Modeling System of Trajectories, Dispersion, and Deposition. Aust. Meteorol. Mag. 1998, 47, 295–308. [Google Scholar]
  40. Stein, A.F.; Draxler, R.R.; Rolph, G.D.; Stunder, B.J.B.; Cohen, M.D.; Ngan, F. NOAA’s HYSPLIT atmospheric transport and dispersion modeling system. Bull. Am. Meteorol. Soc. 2015, 96, 2059–2077. [Google Scholar] [CrossRef]
  41. Rolph, G.; Stein, A.; Stunder, B. Real-time Environmental Applications and Display sYstem: READY. Environ. Model. Softw. 2017, 95, 210–228. [Google Scholar] [CrossRef]
  42. Vergados, P.; Mannucci, A.J.; Ao, C.O.; Verkhoglyadova, O.; Iijima, B. Comparisons of the tropospheric specific humidity from GPS radio occultations with ERA-Interim, NASA MERRA, and AIRS data. Atmos. Meas. Tech. 2018, 11, 1193–1206. [Google Scholar] [CrossRef]
  43. Tenny, K.M.; Cooper, J.S. Ideal Gas Behavior; StatPearls Publishing: Treasure Island, FL, USA, 2017. [Google Scholar]
  44. Kauzmann, W. Thermodynamics and Kinetic Theory; Courier Corporation: North Chelmsford, MA, USA, 2012. [Google Scholar]
  45. Loeb, L.B. The Kinetic Theory of Gases; Being a Text and Reference Book Whose Purpose Is to Combine the Classical Deductions with Recent Experimental Advances in a Convenient form for Student and Investigator; Dover Publications: Mineola, NY, USA, 2004. [Google Scholar]
  46. Heaviside, C.; Witham, C.; Vardoulakis, S. Potential health impacts from sulphur dioxide and sulphate exposure in the UK resulting from an Icelandic effusive volcanic eruption. Sci. Total Environ. 2021, 774, 145549. [Google Scholar] [CrossRef] [PubMed]
  47. Stewart, C.; Damby, D.E.; Horwell, C.J.; Elias, T.; Ilyinskaya, E.; Tomašek, I.; Longo, B.M.; Schmidt, A.; Carlsen, H.; Mason, E.; et al. Volcanic air pollution and human health: Recent advances and future directions. Bull. Volcanol. 2022, 84, 11. [Google Scholar] [CrossRef]
  48. Stendel, M.; Francis, J.; White, R.; Williams, P.D.; Woollings, T. The jet stream and climate change. In Climate Change; Elsevier: Amsterdam, The Netherlands, 2021; pp. 327–357. [Google Scholar]
  49. Varotsos, C. Atmospheric pollution and remote sensing: Implications for the southern hemisphere ozone hole split in 2002 and the northern mid-latitude ozone trend. Adv. Space Res. 2004, 33, 249–253. [Google Scholar] [CrossRef]
  50. Varotsos, C.A.; Cracknell, A.P. Remote Sensing Letters contribution to the success of the Sustainable Development Goals—UN 2030 agenda. Remote Sens. Lett. 2020, 11, 715–719. [Google Scholar] [CrossRef]
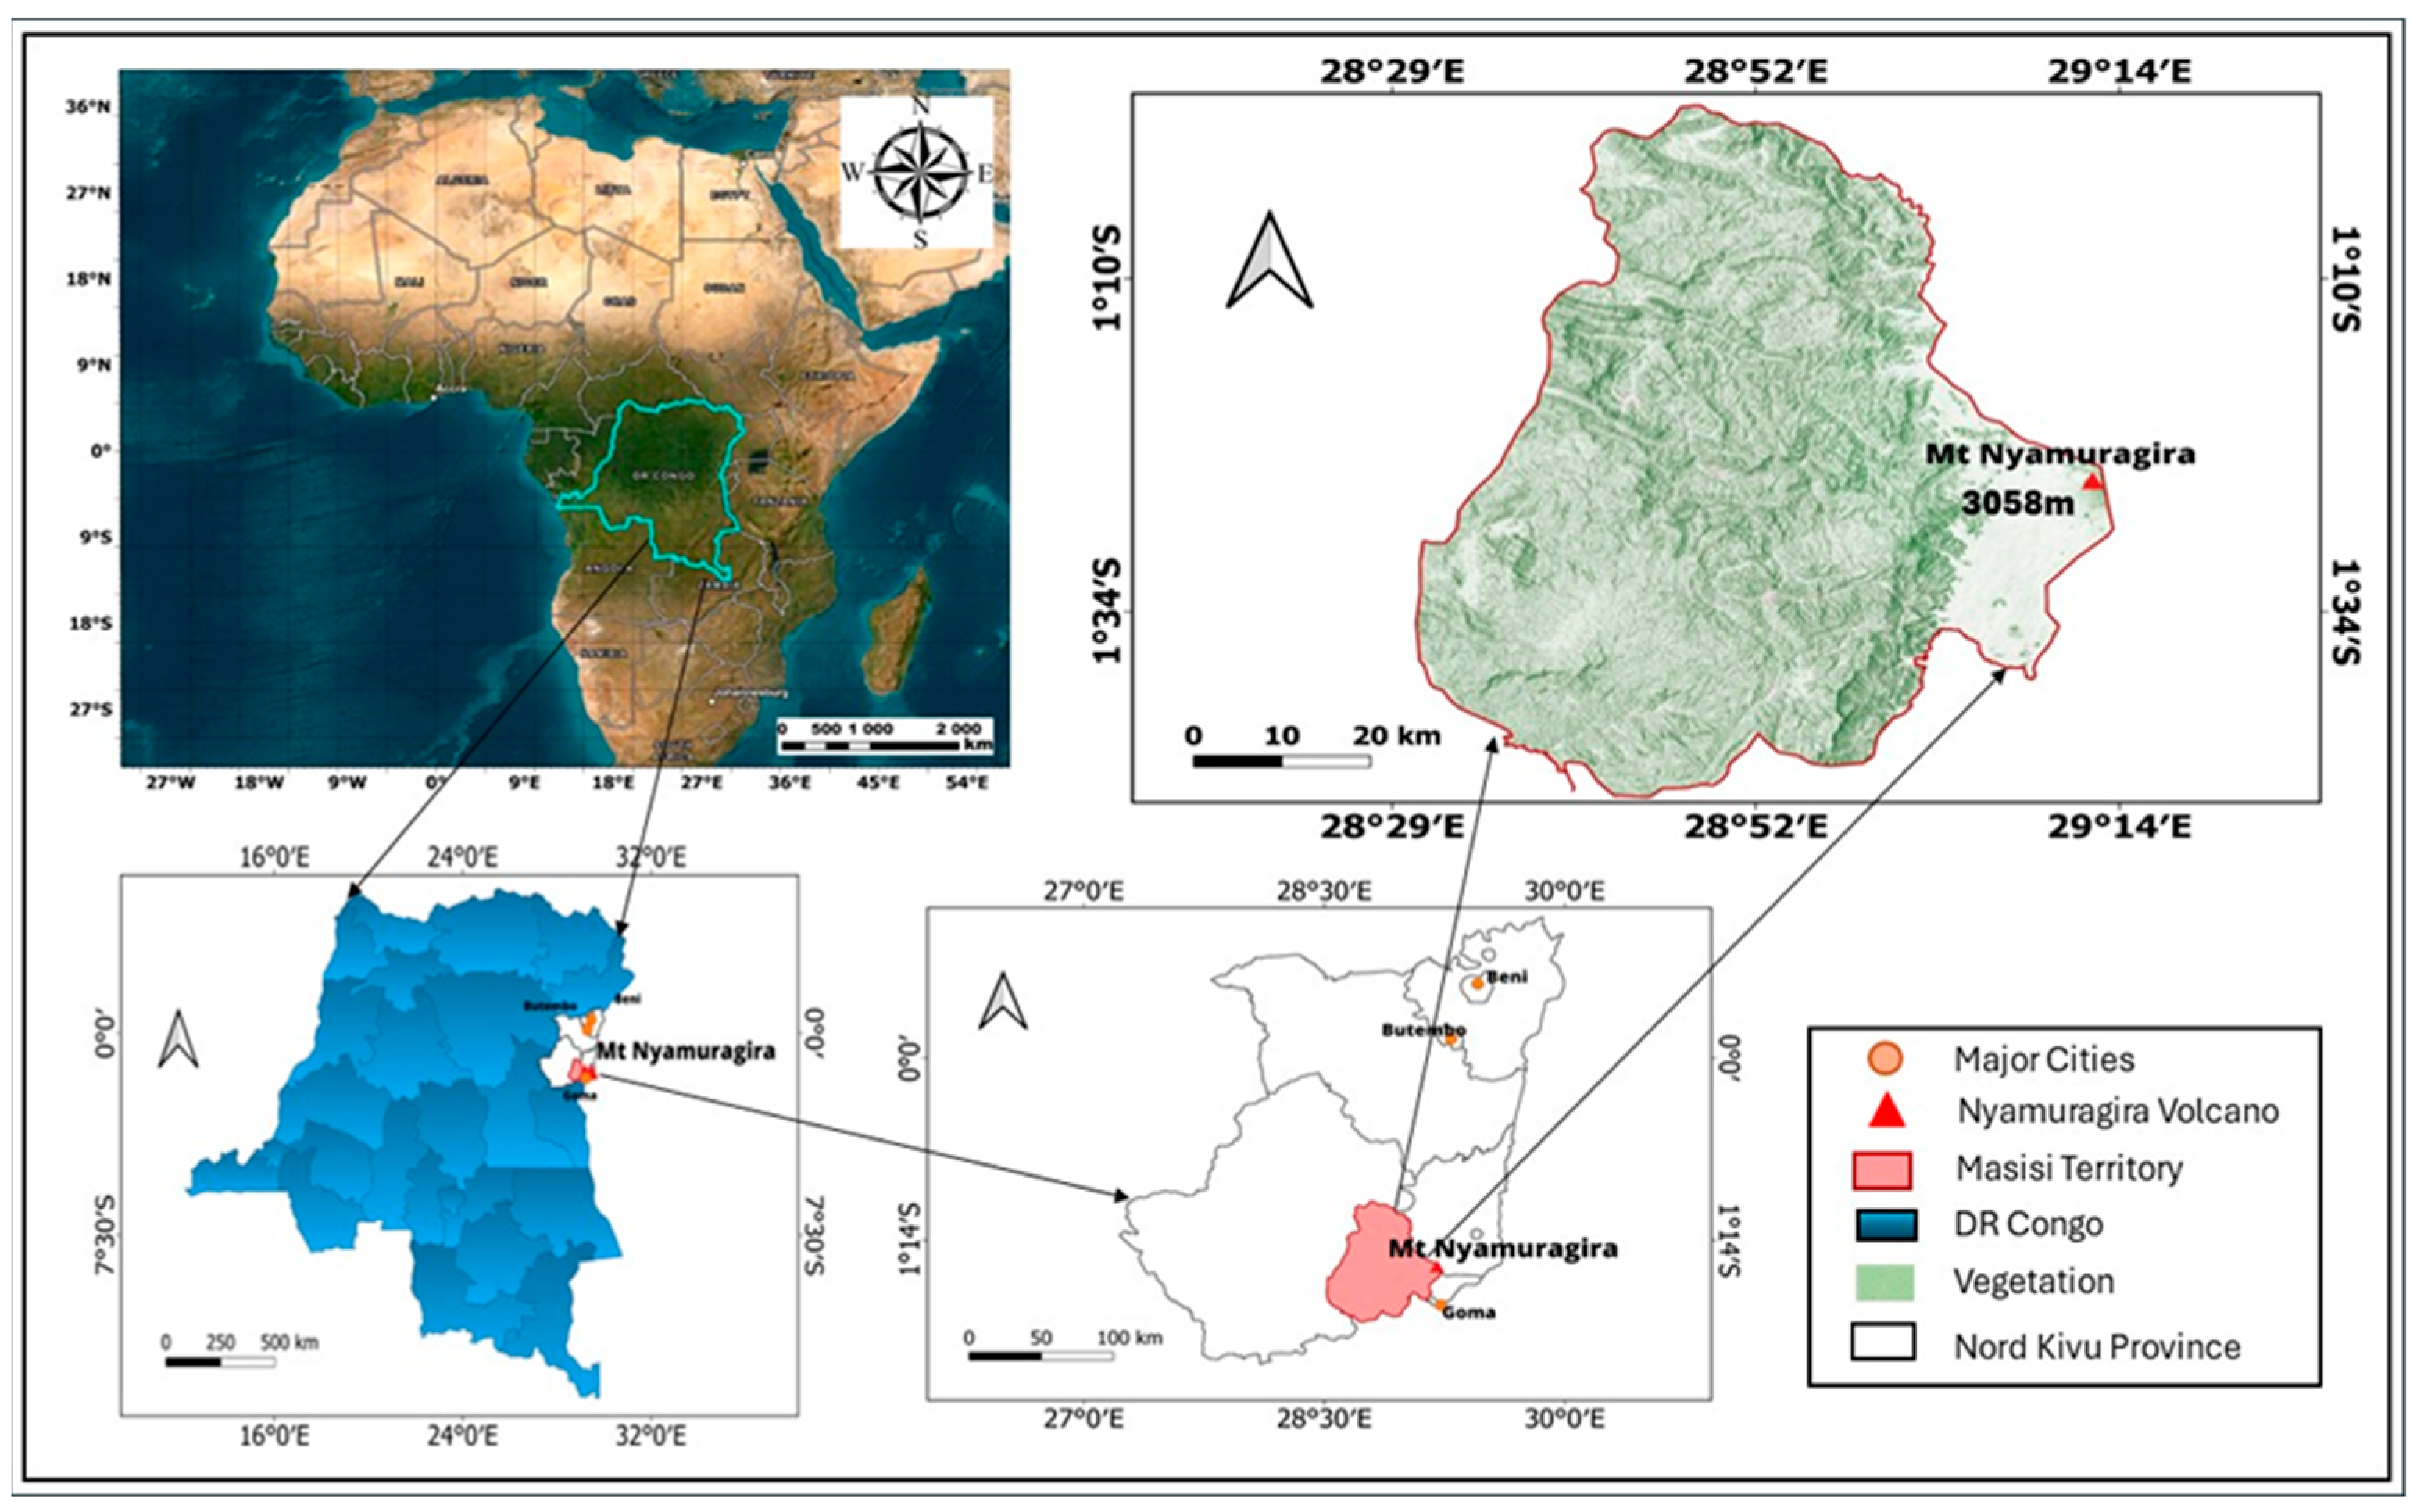
Figure 1. Map showing the location of the region of interest and the Mount Nyamuragira volcano in the Democratic Republic of Congo (DRC).
Earth 06 00102 g001
Figure 2. Hourly averaged SO2 column mass density for the periods (a) 15–26 November, (b) 25 November to 6 December, and (c) 5–16 December 2006 over Mount Nyamuragira.
Earth 06 00102 g002
Figure 3. MERRA-2 reanalysis daily averaged data, spatially illustrating injection, wind shearing effects, dispersion, and different remotely sensed densities (kg·m−2) of SO2 in the atmosphere, on each day from the 28th of November 2006 to the 09th of December 2006 (al).
Earth 06 00102 g003
Figure 4. Mean averaged wind direction over central and northern Africa (a) and mean averaged OMI daily data ranging over 20 days (b) from the 26th of November 2006 to the 16th of December 2006, where the colours represent the column densities (kg·m−2) as follows: green = low, yellow = medium, and red = high.
Earth 06 00102 g004
Figure 5. HYSPLIT dispersion transport model, illustrating forward wind trajectories at 100 m, 5000 m, and 12,000 m AGL.
Earth 06 00102 g005
Figure 6. Visualising the dispersion based on wind speed, wind directions at specific atmospheric pressure surface heights in millibars (mb).
Earth 06 00102 g006
Figure 7. (a) Zonally averaged latitude–altitude cross-sections of extinction coefficient and (b) extinction coefficient vertical profile on November 2006.
Earth 06 00102 g007
Table 1. Summary of the data sources used in this study.
PlatformSpatial ResolutionProduct NameOutput Data
OMI13 km × 24 kmSO2 column density (kg/m2)Timeseries
Spatial distribution maps
CALIPSO330 m horizontal
30 m vertical
Aerosol Extinction Coefficient
Aerosol subtypes
Latitude–altitude graphs
MERRA-20.5° × 0.625°Wind Speed (m·s−1)Spatial distribution maps
HYSPLIT model-5 days forward air mass trajectoriesMap showing trajectory of air masses
Disclaimer/Publisher’s Note: The statements, opinions and data contained in all publications are solely those of the individual author(s) and contributor(s) and not of MDPI and/or the editor(s). MDPI and/or the editor(s) disclaim responsibility for any injury to people or property resulting from any ideas, methods, instructions or products referred to in the content.