

Urban Expansion and Land Use Transformations in Midnapore City (2003–2024): Implications for Sustainable Development

 ,
,  ,
,  ,
,  ,
,  , and
, and 
Abstract
1. Introduction
2. Methods and Methodology
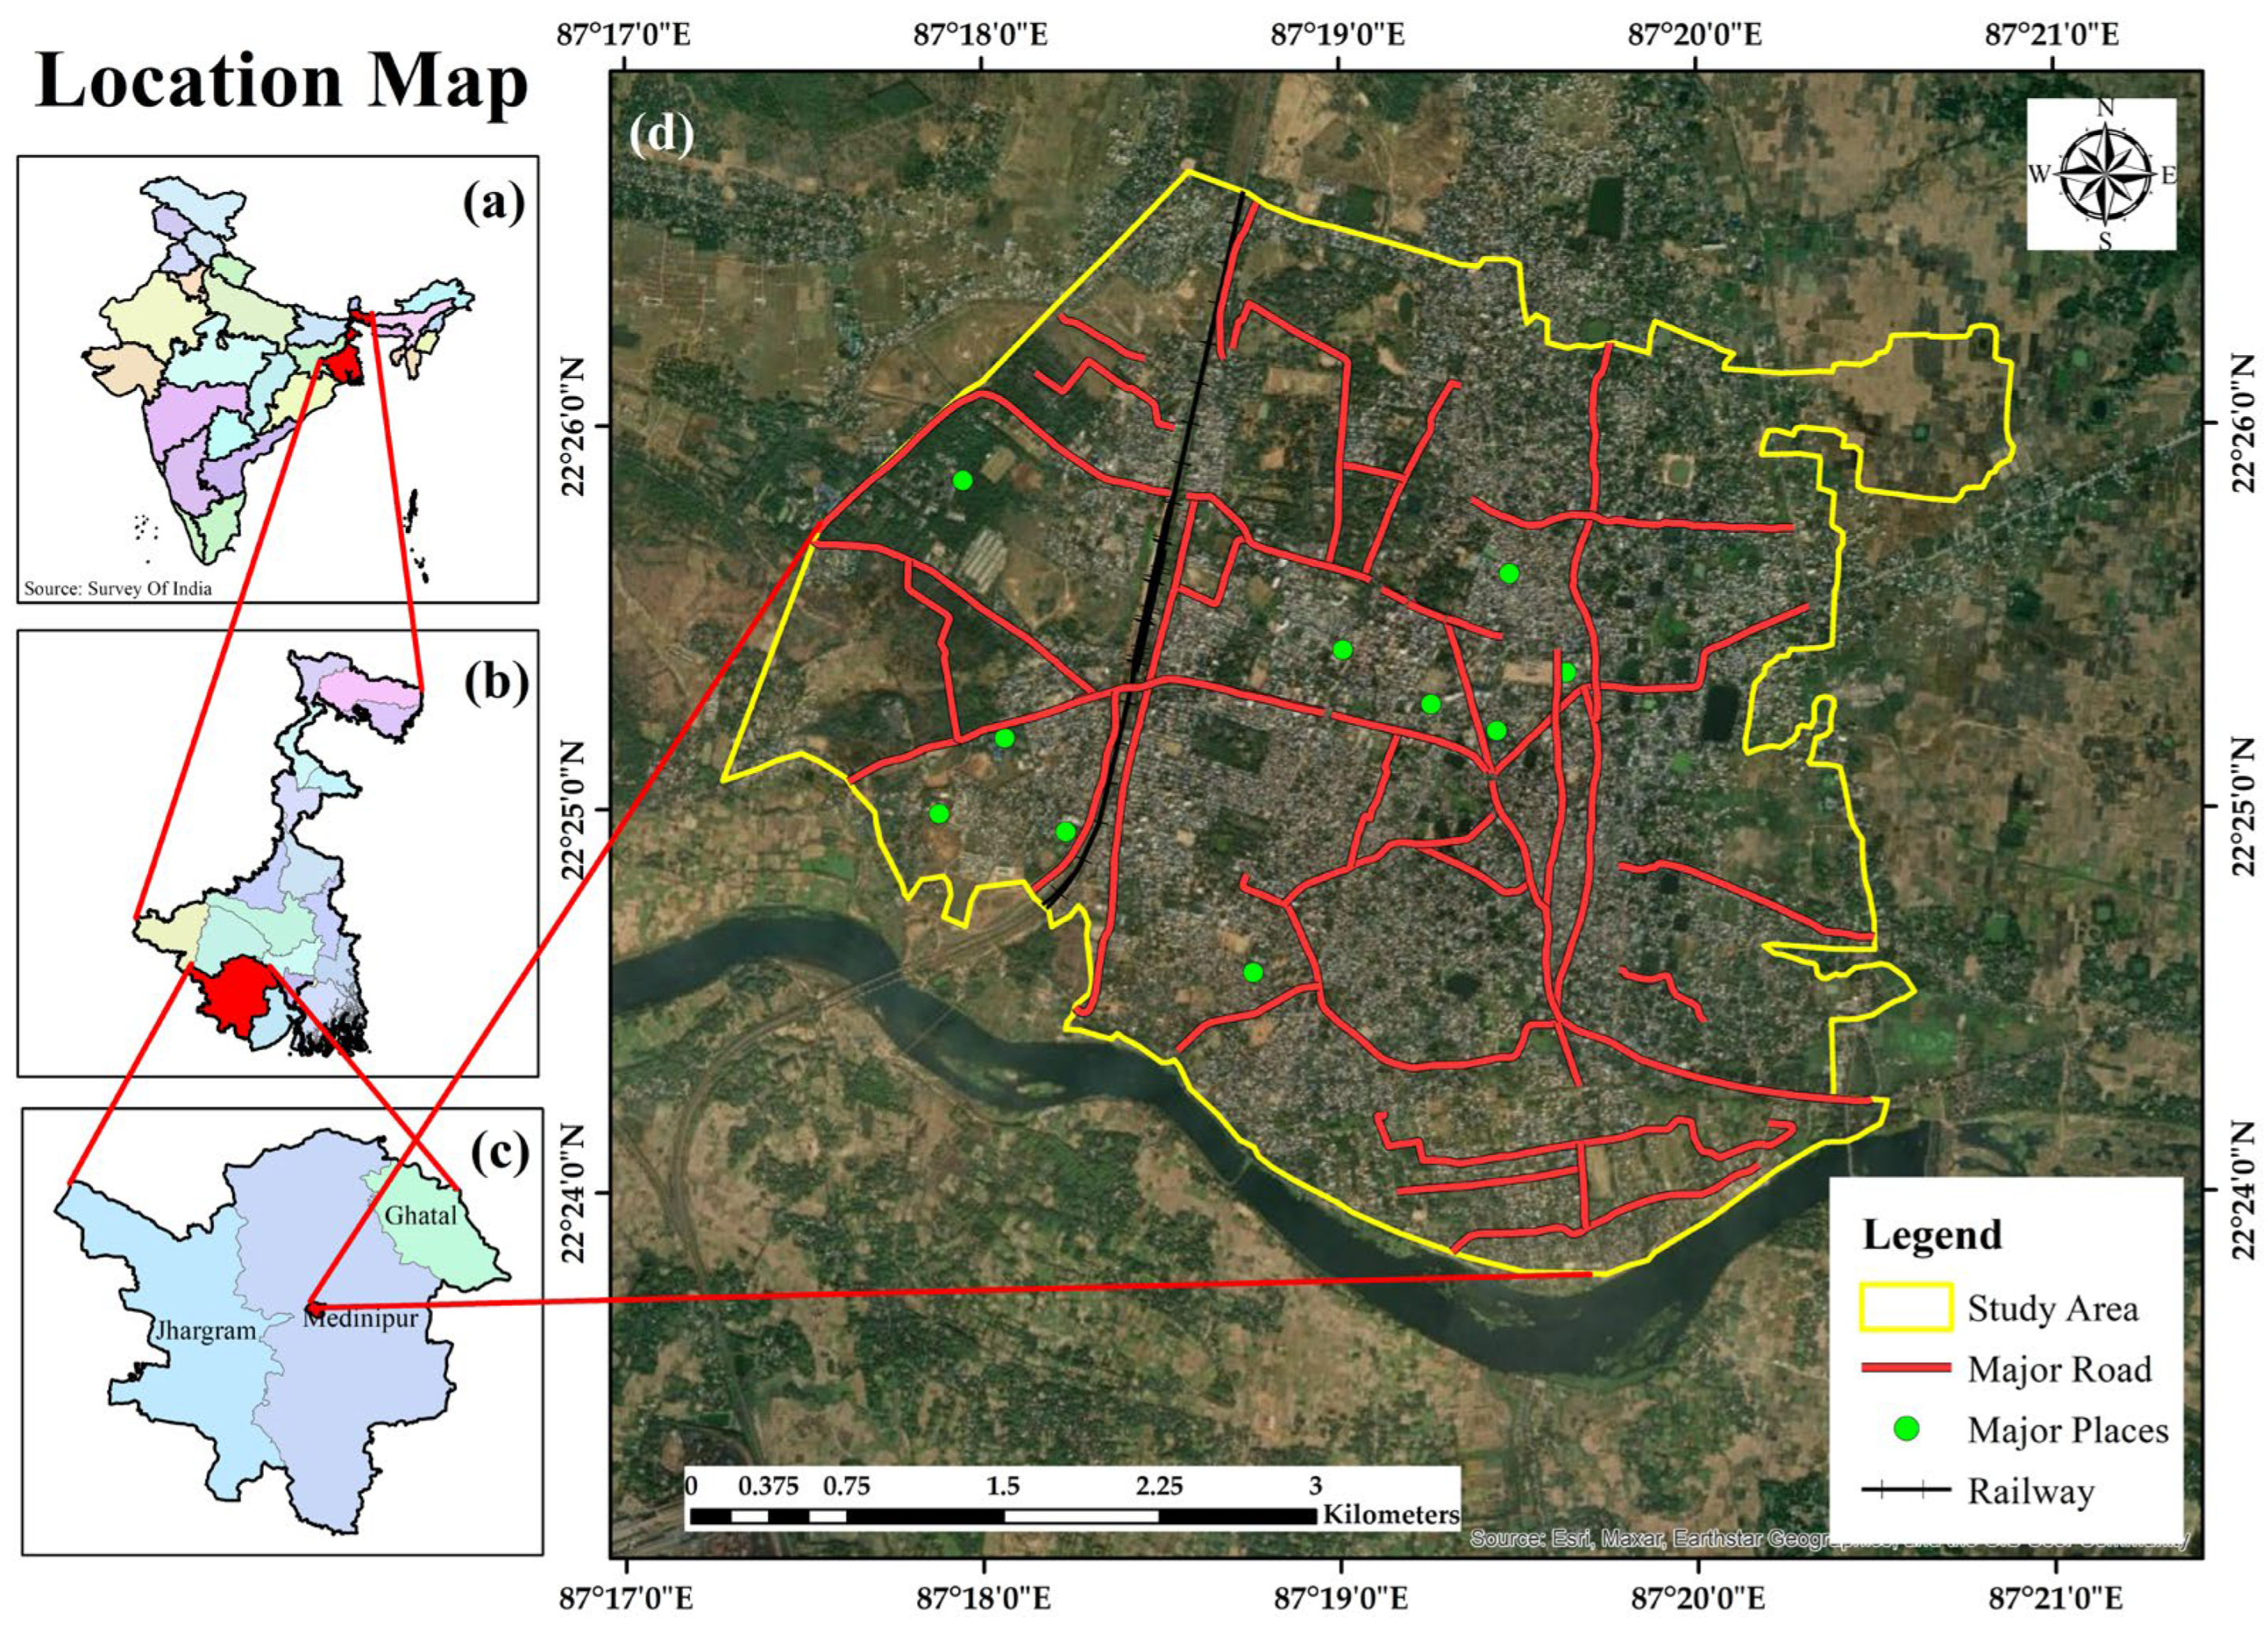
2.1. Study Area
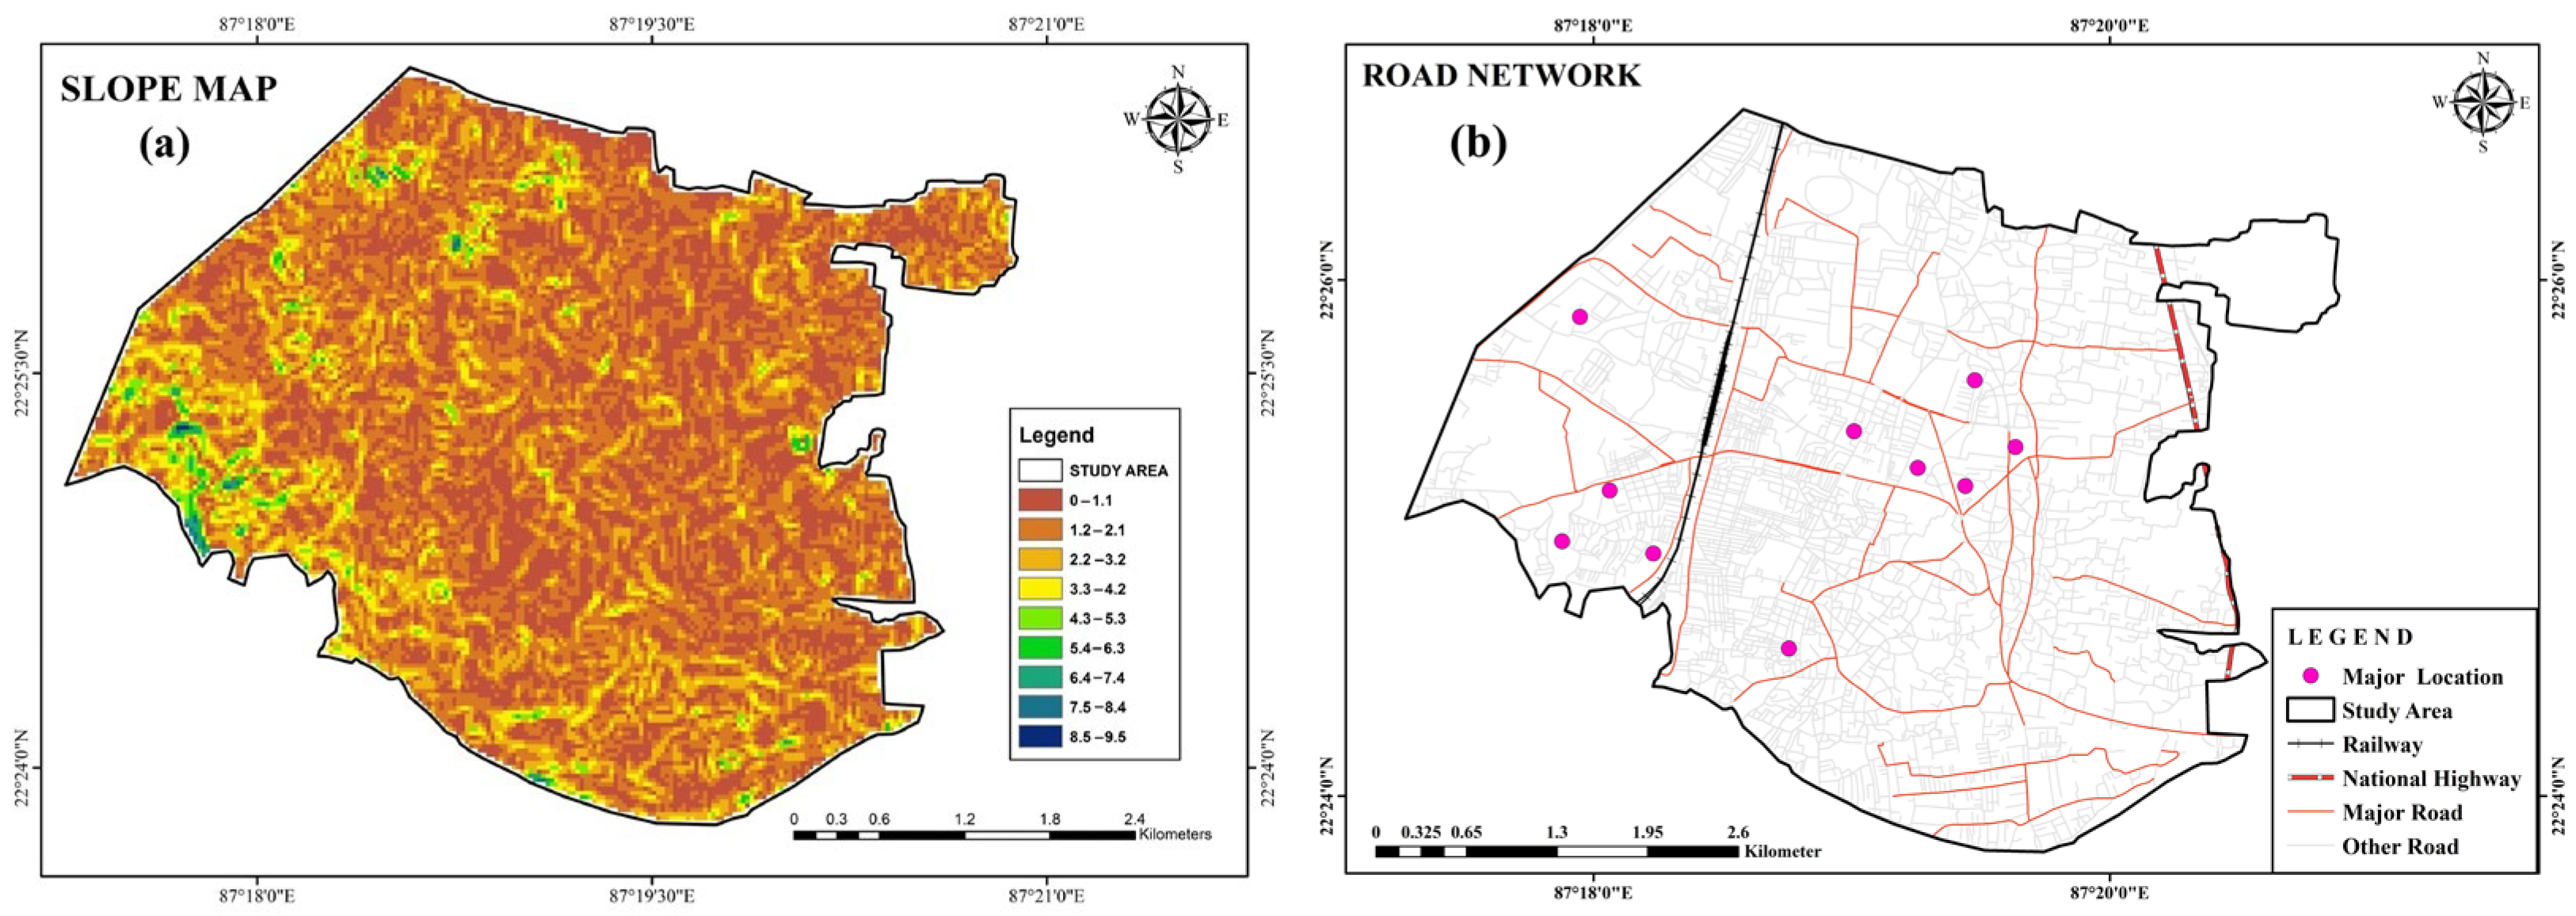
2.2. Topography
2.3. Transport System
2.4. Methodology
2.4.1. Maximum Likelihood Classifier (MLC)
2.4.2. Data Source
2.4.3. Data Preprocessing and Image Classification
2.4.4. Change Detection and Statistical Analysis
2.4.5. Validation, Visualization and Mapping
2.4.6. Binary Logistic Regression Modeling
3. Results
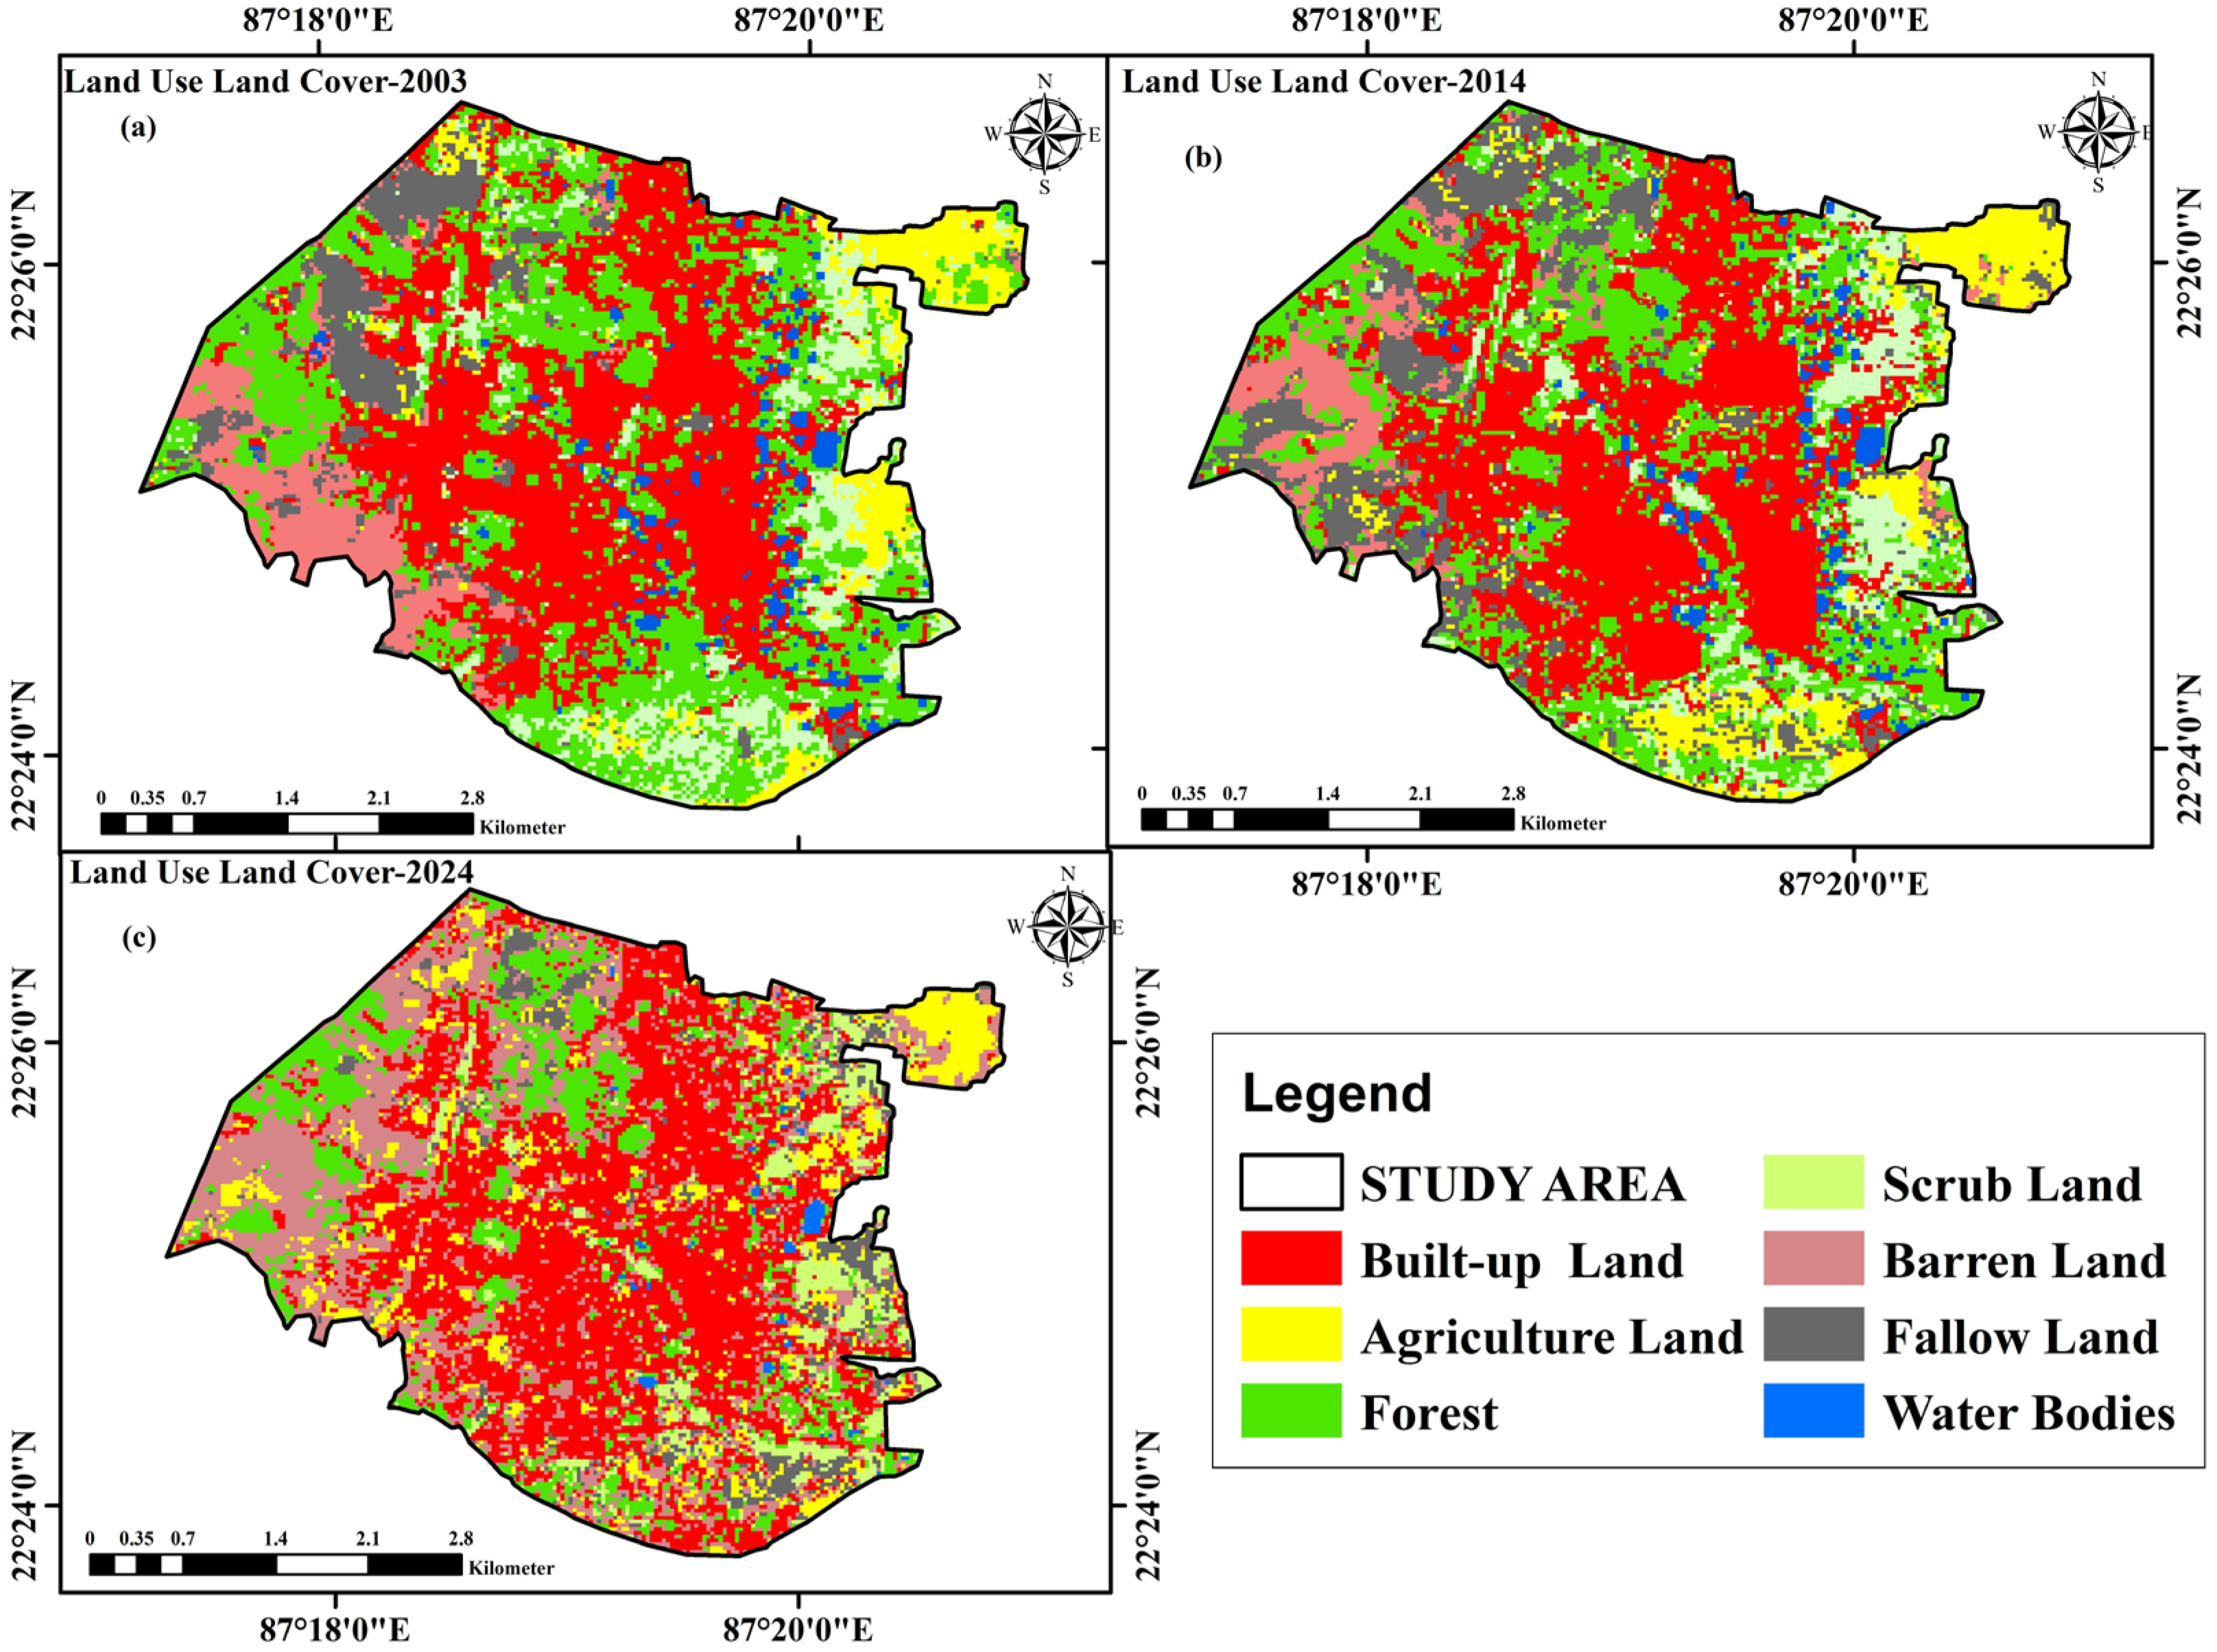
3.1. Land Use and Land Cover Change Detection
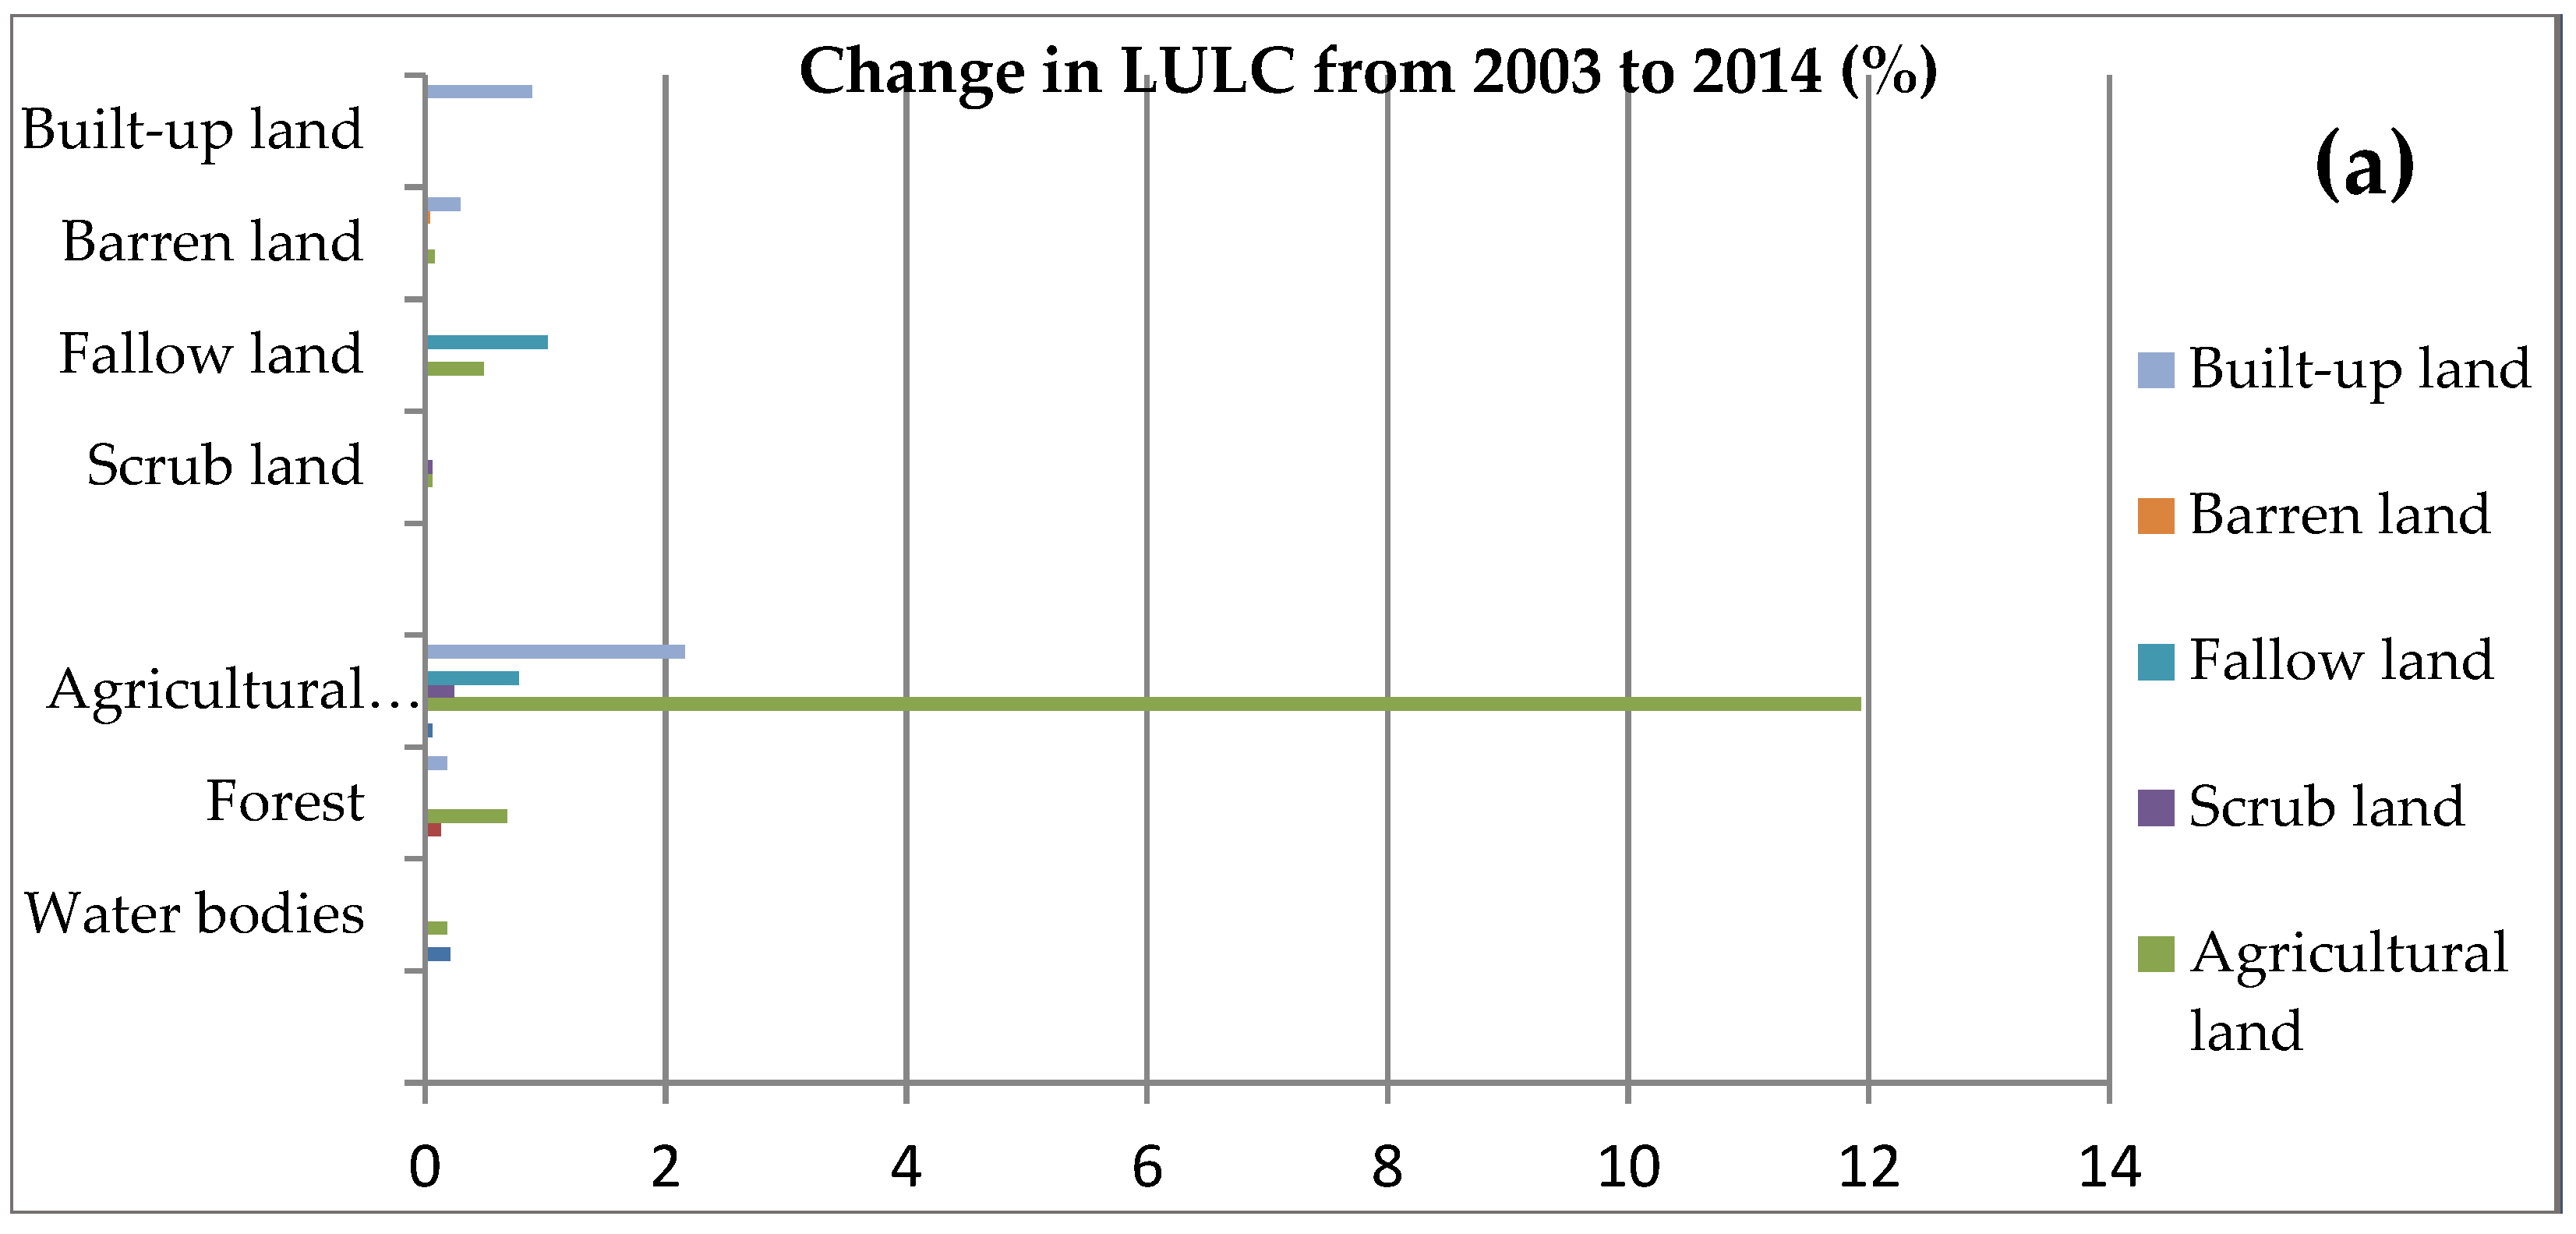
3.2. Change Matrix of LULC
3.2.1. For 2003–2014
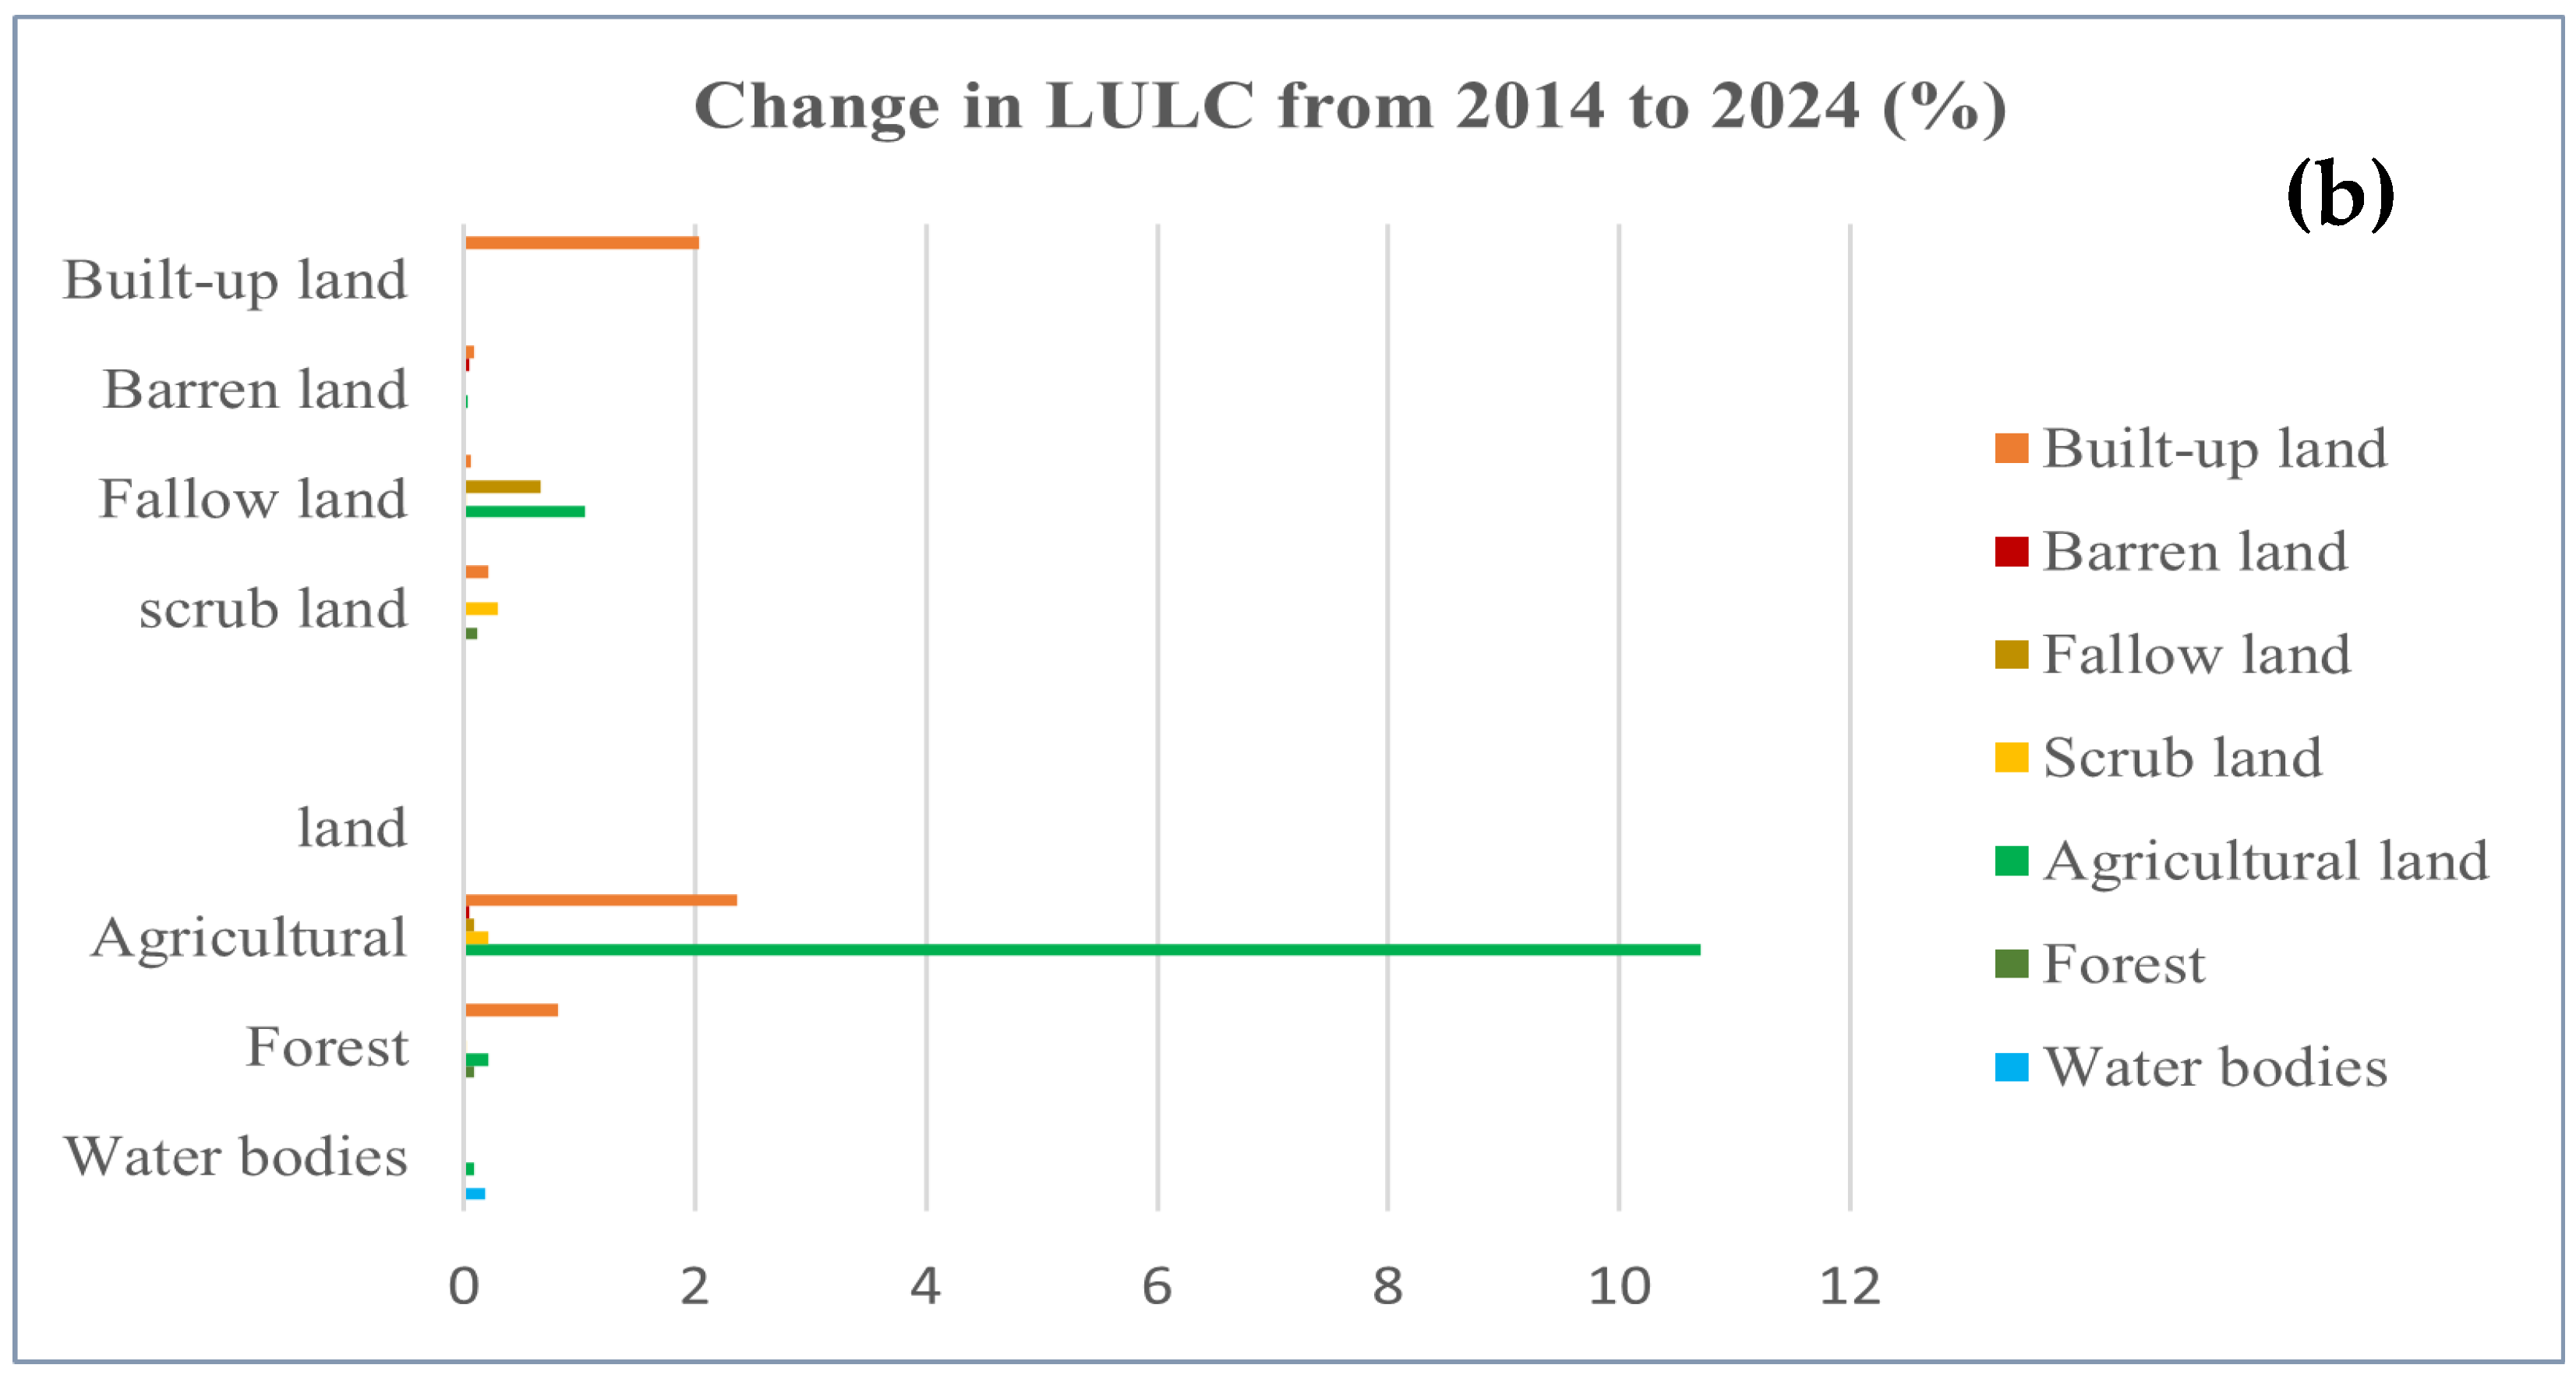
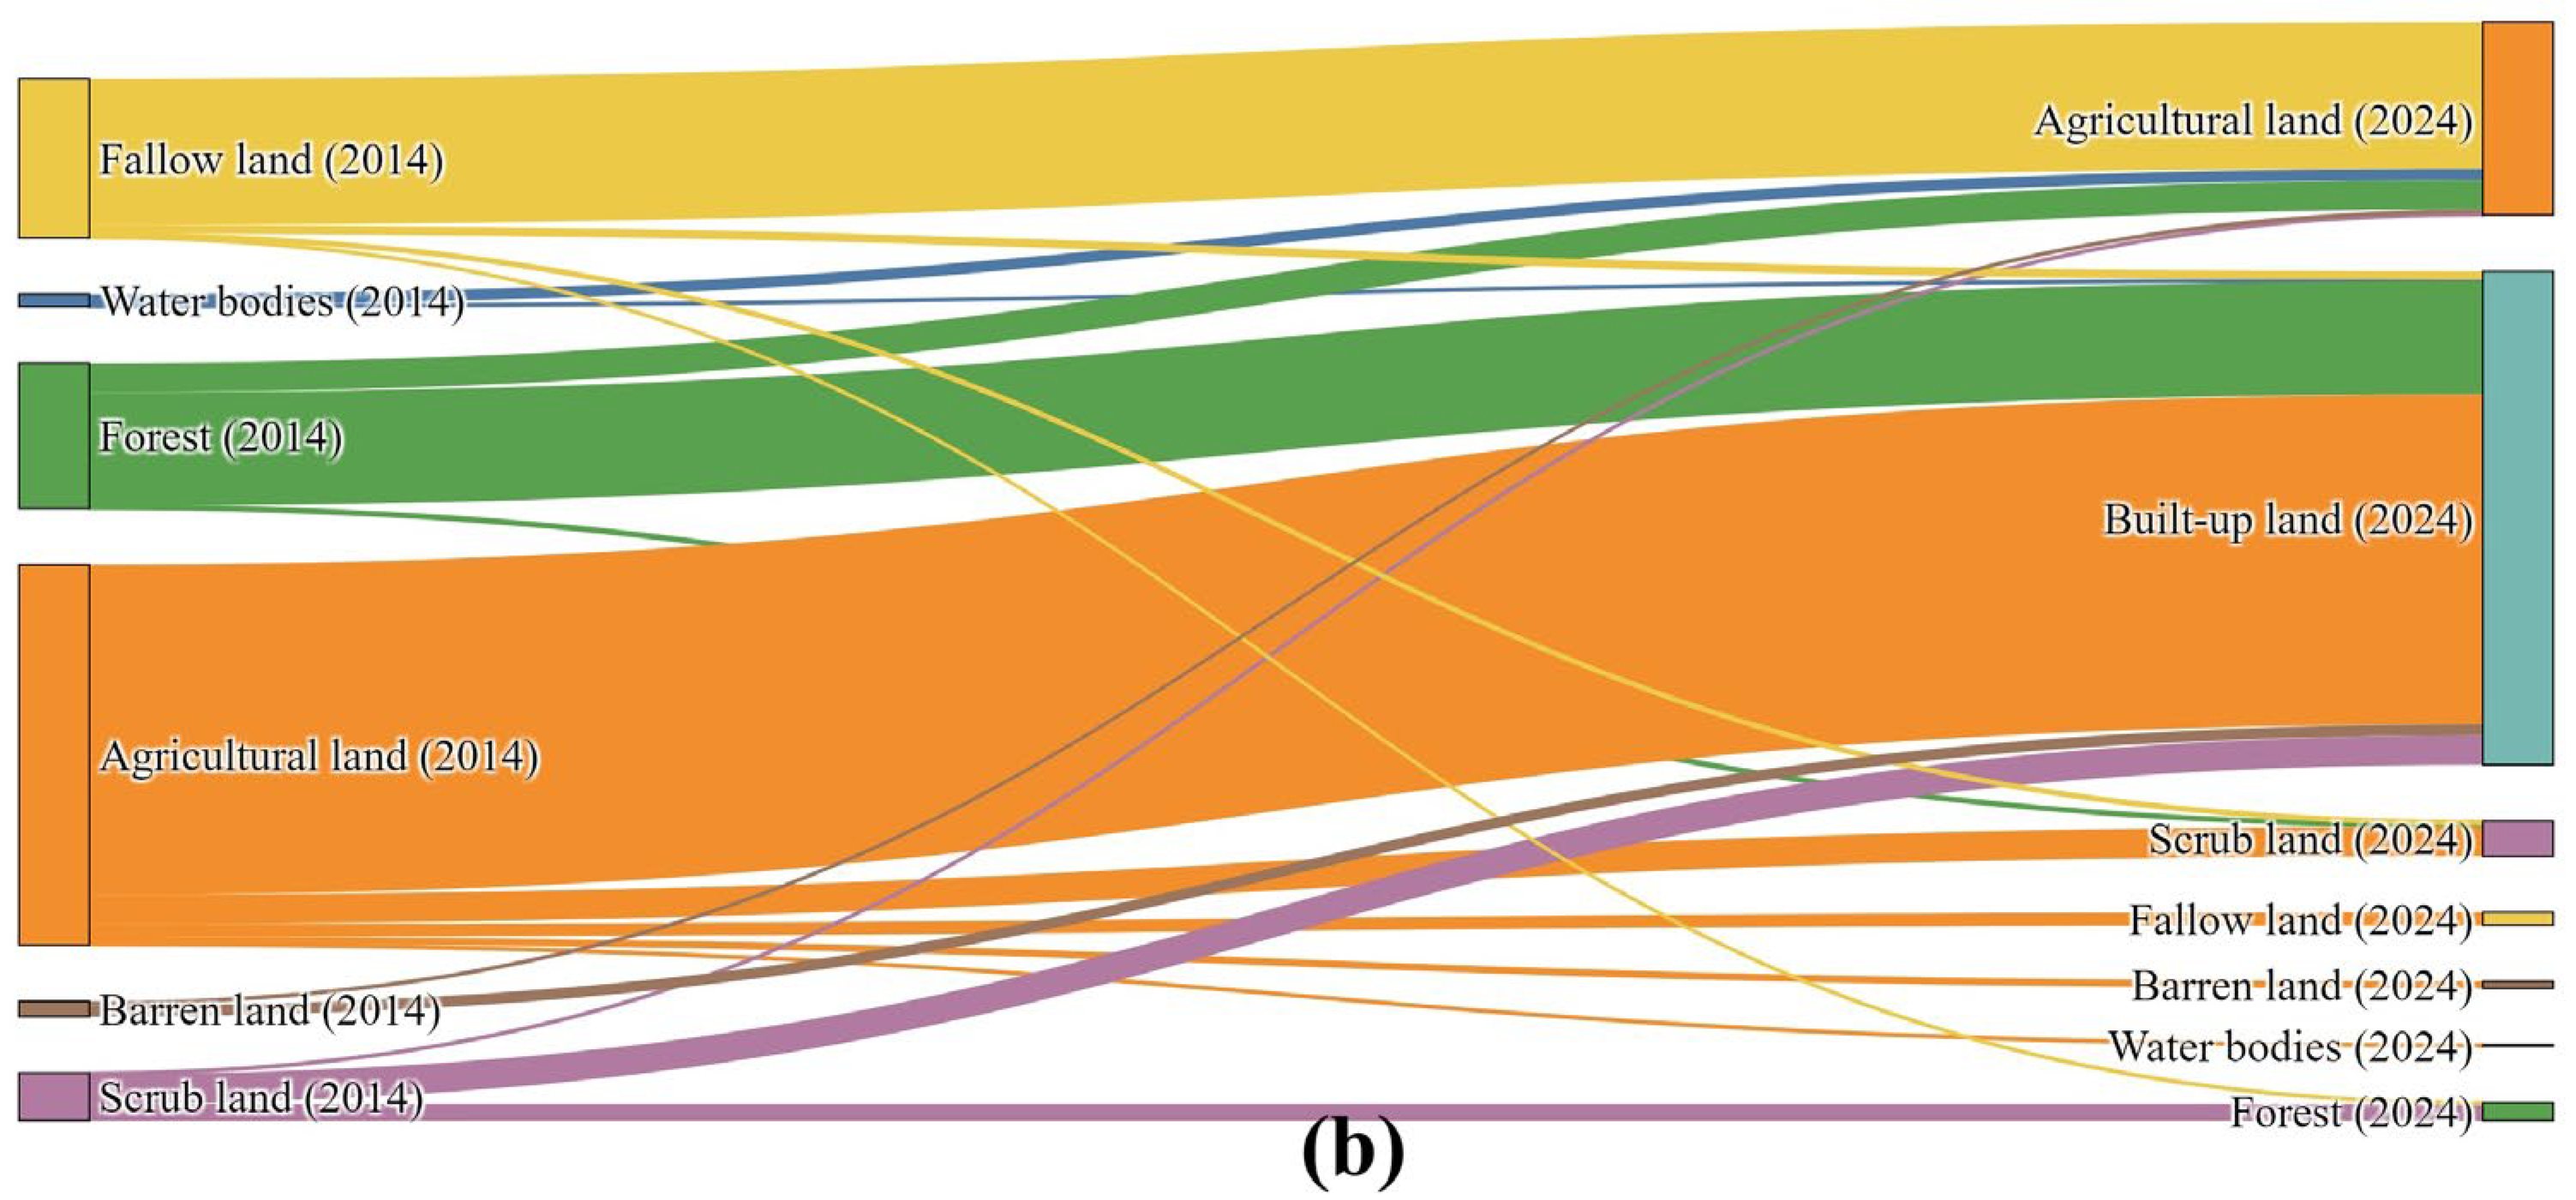
3.2.2. For 2014–2024
3.3. Matrix Union to Logistic Regression Result
4. Discussion
4.1. Summary
4.2. Limitation and Recommendations
5. Conclusions
Author Contributions
Funding
Data Availability Statement
Acknowledgments
Conflicts of Interest
Appendix A

| Agricultural Land | ||||||||||||
| Value | Standard Error | Wald Chi-Square | Pr > Chi2 | Lower Bound (95%) | Upper Bound (95%) | |||||||
| 2003–2014 | 2014–2024 | 2003–2014 | 2014–2024 | 2003–2014 | 2014–2024 | 2003–2014 | 2014–2024 | 2003–2014 | 2014–2024 | 2003–2014 | 2014–2024 | |
| Distance to Agricultural Land | 262.183 | 246.508 | 33,380.489 | 78,909.069 | 0.00 | 0.00 | 0.994 | 0.998 | −65,162.373 | −154,412.425 | 65,686.74 | 154,905.441 |
| Distance to Developed Land | −39.506 | −60.629 | 10,913.161 | 97,936.02 | 0.00 | 0.00 | 0.997 | 1.00 | −21,428.909 | −192,011.701 | 21,349.897 | 191,890.444 |
| Slope | 0.186 | −5.143 | 995.208 | 3009.465 | 0.00 | 0.00 | 1.00 | 0.999 | −1950.387 | −5903.586 | 1950.758 | 5893.299 |
| Road | −0.26 | 1.071 | 1422.835 | 2459.607 | 0.00 | 0.00 | 1.00 | 1.00 | −2788.966 | −4819.67 | 2788.446 | 4821.812 |
| Fallow Land | ||||||||||||
| Distance to Fallow Land | 42.974 | 4778.254 | 0.00 | −9322.231 | 0.993 | 9408.179 | ||||||
| Distance to Developed Land | −0.385 | 1296.537 | 0.00 | −2541.551 | 1.000 | 2540.781 | ||||||
| Slope | 0.176 | 758.821 | 0.00 | −1487.086 | 1.000 | 1487.438 | ||||||
| Road | −0.072 | 857.779 | 0.00 | −1681.288 | 1.000 | 1681.144 | ||||||
| Water Body | ||||||||||||
| Distance to Water | 780.11 | 2365.223 | 201,296.127 | 632,182.068 | 0.00 | 0.00 | 0.997 | 0.997 | −393,753.049 | −1,236,688.861 | 395,313.269 | 1,241,419.308 |
| Distance to Agricultural Land | 539.111 | −1966.626 | 102,218.787 | 301,618.184 | 0.00 | 0.00 | 0.996 | 0.995 | −200,884.253 | −593,127.403 | 199,806.03 | 589,194.152 |
| Slope | 15.165 | −54.272 | 2919.267 | 9058.159 | 0.00 | 0.00 | 0.996 | 0.995 | −5706.492 | −17,807.937 | 5736.823 | 17,699.393 |
| Road | 3.595 | 41.348 | 1553.123 | 5516.36 | 0.00 | 0.00 | 0.998 | 0.994 | −3040.469 | −10,770.519 | 3047.66 | 10,853.215 |
| Forest | ||||||||||||
| Distance to Forest | 3.547 | 6.752 | 2657.725 | 3223.23 | 0.00 | 0.00 | 0.999 | 0.998 | −5205.499 | −6310.662 | 5212.593 | 6324.167 |
| Distance to Agricultural Land | 53.911 | −239.786 | 6673.254 | 20,943.657 | 0.00 | 0.00 | 0.994 | 0.991 | −13,133.249 | −41,288.599 | 13,025.427 | 40,809.027 |
| Slope | −1.423 | −3.533 | 1597.382 | 1507.614 | 0.00 | 0.00 | 0.999 | 0.998 | −3132.235 | −2958.403 | 3129.388 | 2951.337 |
| Road | −0.928 | 17.919 | 1663.839 | 2647.621 | 0.00 | 0.00 | 1.00 | 0.995 | −3261.992 | −5171.323 | 3260.136 | 5207.162 |
| Agricultural Land | ||||||||
| Variables | Distance to Agriculture | Distance to Built-Up Land | Slope | Road | ||||
| 2003–2014 | 2014–2024 | 2003–2014 | 2014–2024 | 2003–2014 | 2014–2024 | 2003–2014 | 2014–2024 | |
| Distance to Agricultural Land | 1.000 | 1.000 | −0.232 | −0.210 | 0.041 | 0.134 | −0.090 | 0.021 |
| Distance to Developed Land | −0.232 | −0.210 | 1.000 | 1.000 | −0.095 | 0.033 | 0.343 | 0.257 |
| Slope | 0.041 | 0.134 | −0.095 | 0.033 | 1.000 | 1.000 | −0.085 | −0.022 |
| Road | −0.090 | 0.021 | 0.343 | 0.257 | −0.085 | −0.022 | 1.000 | 1.000 |
| Fallow Land | ||||||||
| Variables | Distance to Fallow Land | Distance to Built-Up Areas | Slope | Road | ||||
| 2003–2014 | 2014–2024 | 2003–2014 | 2014–2024 | 2003–2014 | 2014–2024 | 2003–2014 | 2014–2024 | |
| Distance to Fallow land | 1.000 | 1.000 | −0.158 | −0.310 | 0.110 | 0.177 | −0.058 | −0.132 |
| Distance to Developed Land | −0.158 | −0.310 | 1.000 | 1.000 | −0.230 | −0.026 | 0.017 | −0.283 |
| Slope | 0.110 | 0.177 | −0.230 | −0.026 | 1.000 | 1.000 | −0.123 | −0.177 |
| Road | −0.058 | −0.132 | 0.017 | −0.283 | −0.123 | −0.177 | 1.000 | 1.000 |
| Water Body | ||||||||
| Variables | Distance to Water | Distance to Agriculture | slope | road | ||||
| 2003–2014 | 2014–2024 | 2003–2014 | 2014–2024 | 2003–2014 | 2014–2024 | 2003–2014 | 2014–2024 | |
| Distance to Water | 1.000 | −0.363 | −0.036 | −0.294 | ||||
| Distance to Agricultural Land | −0.363 | 1.000 | 0.150 | 0.045 | ||||
| Slope | −0.036 | 0.150 | 1.000 | 0.087 | ||||
| Road | −0.294 | 0.045 | 0.087 | 1.000 | ||||
| Forest | ||||||||
| Variables | Distance to Forest | Distance to Agriculture | Slope | Road | ||||
| 2003–2014 | 2014–2024 | 2003–2014 | 2014–2024 | 2003–2014 | 2014–2024 | 2003–2014 | 2014–2024 | |
| Distance to Forest | 1.000 | 1.000 | −0.421 | −0.462 | 0.267 | 0.073 | 0.458 | 0.255 |
| Distance to Agricultural Land | −0.421 | −0.462 | 1.000 | 1.000 | 0.016 | 0.099 | −0.160 | −0.191 |
| Slope | 0.267 | 0.073 | 0.016 | 0.099 | 1.000 | 1.000 | 0.271 | −0.029 |
| Road | 0.458 | 0.255 | −0.160 | −0.191 | 0.271 | −0.029 | 1.000 | 1.000 |
References
- Wang, L.; Yang, Z.-L. Changes in Land Use Influenced by Anthropogenic Activity. In Oxford Research Encyclopedia of Environmental Science; Oxford University Press: Oxford, UK, 2020. [Google Scholar]
- Aryal, J.; Sitaula, C.; Frery, A.C. Land Use and Land Cover (LULC) Performance Modeling Using Machine Learning Algorithms: A Case Study of the City of Melbourne, Australia. Sci. Rep. 2023, 13, 13510. [Google Scholar] [CrossRef] [PubMed]
- Fan, X.; Ma, Z.; Yang, Q.; Han, Y.; Mahmood, R. Land Use/Land Cover Changes and Regional Climate over the Loess Plateau during 2001–2009. Part II: Interrelationship from Observations. Clim. Change 2015, 129, 441–455. [Google Scholar] [CrossRef]
- Zhao, G.X.; Lin, G.; Warner, T. Using Thematic Mapper Data for Change Detection and Sustainable Use of Cultivated Land: A Case Study in the Yellow River Delta, China. Int. J. Remote Sens. 2004, 25, 2509–2522. [Google Scholar] [CrossRef]
- Mishra, P.; Jena, D.; Samal, K.P.; Dibiat, N. Urbanization and Groundwater Quality: A Case of Bhubaneswar in Odisha, India. Turk. Online J. Qual. Inq. 2021, 12, 5520–5529. [Google Scholar]
- Ellis, E.; Pontius, R. Land-Use and Land-Cover Change. Encycl. Earth 2007, 1, 1–4. [Google Scholar]
- Hussain, S.; Mubeen, M.; Karuppannan, S. Land Use and Land Cover (LULC) Change Analysis Using TM, ETM+ and OLI Landsat Images in District of Okara, Punjab, Pakistan. Phys. Chem. Earth Parts A/B/C 2022, 126, 103117. [Google Scholar] [CrossRef]
- Wu, T.; Luo, J.; Fang, J.; Ma, J.; Song, X. Unsupervised Object-Based Change Detection via a Weibull Mixture Model-Based Binarization for High-Resolution Remote Sensing Images. IEEE Geosci. Remote Sens. Lett. 2017, 15, 63–67. [Google Scholar] [CrossRef]
- Gupta, A.; Shukla, A.K. Optimal approaches in global warming mitigation and adaptation strategies at city scale. Discov. Sustain. 2024, 5, 272. [Google Scholar] [CrossRef]
- Phiri, D.; Morgenroth, J. Developments in Landsat Land Cover Classification Methods: A Review. Remote Sens. 2017, 9, 967. [Google Scholar] [CrossRef]
- Jin, S.; Yang, L.; Zhu, Z.; Homer, C. A Land Cover Change Detection and Classification Protocol for Updating Alaska NLCD 2001 to 2011. Remote Sens. Environ. 2017, 195, 44–55. [Google Scholar] [CrossRef]
- Felsenstein, D.; Lichter, M.; Ashbel, E.; Grinberger, A.Y. Land Use-Land Cover Dynamics at the Metropolitan Fringe. In Modeling of Land-Use and Ecological Dynamics; Springer: Berlin/Heidelberg, Germany, 2013; pp. 143–165. ISBN 9783642401992. [Google Scholar]
- Dwivedi, R.S.; Sreenivas, K.; Ramana, K.V. Land-Use/Land-Cover Change Analysis in Part of Ethiopia Using Landsat Thematic Mapper Data. Int. J. Remote Sens. 2005, 26, 1285–1287. [Google Scholar] [CrossRef]
- Sekertekin, A.; Marangoz, A.M.; Akcin, H. Pixel-Based Classification Analysis of Land Use Land Cover Using Sentinel-2 and Landsat-8 Data. Int. Arch. Photogramm. Remote Sens. Spatial Inf. Sci. 2017, 42, 91–93. [Google Scholar] [CrossRef]
- Lambin, E.F.; Geist, H.J.; Lepers, E. Dynamics of Land-Use and Land-Cover Change in Tropical Regions. Annu. Rev. Environ. Resour. 2003, 28, 205–241. [Google Scholar] [CrossRef]
- Gour, D.; Soumen, D.; Sujan, S. An Application of Remote Sensing and GIS to Analyze Urban Expansion and Land Use Land Cover Change of Midnapore Municipality, WB, India. Int. Res. J. Earth Sci. 2014, 2, 8–20. [Google Scholar]
- Lv, Z.; Liu, T.; Wan, Y.; Benediktsson, J.A.; Zhang, X. Post-Processing Approach for Refining Raw Land Cover Change Detection of Very High-Resolution Remote Sensing Images. Remote Sens. 2018, 10, 472. [Google Scholar] [CrossRef]
- Thakur, R.R.; Kumar, P.; Palria, S. Monitoring Changes in Vegetation Cover of Bhitarkanika Marine National Park Region, Odisha, India Using Vegetation Indices of Multidate Satellite Data. Indian J. Geo-Mar. Sci. 2019, 48, 1916–1924. [Google Scholar]
- Das, P.; Pandey, V. Use of Logistic Regression in Land-Cover Classification with Moderate-Resolution Multispectral Data. J. Indian Soc. Remote Sens. 2019, 47, 1443–1454. [Google Scholar] [CrossRef]
- Arowolo, A.O.; Deng, X. Land Use/Land Cover Change and Statistical Modelling of Cultivated Land Change Drivers in Nigeria. Reg. Environ. Change 2018, 18, 247–259. [Google Scholar] [CrossRef]
- Bhattacharya, R.K.; Das Chatterjee, N.; Das, K. Land Use and Land Cover Change and Its Resultant Erosion Susceptible Level: An Appraisal Using RUSLE and Logistic Regression in a Tropical Plateau Basin of West Bengal, India. Environ. Dev. Sustain. 2021, 23, 1411–1446. [Google Scholar] [CrossRef]
- Kumar, R.; Nandy, S.; Agarwal, R.; Kushwaha, S.P.S. Forest Cover Dynamics Analysis and Prediction Modeling Using Logistic Regression Model. Ecol. Indic. 2014, 45, 444–455. [Google Scholar] [CrossRef]
- Buya, S.; Tongkumchum, P.; Owusu, B.E. Modelling of Land-Use Change in Thailand Using Binary Logistic Regression and Multinomial Logistic Regression. Arab. J. Geosci. 2020, 13, 437. [Google Scholar] [CrossRef]
- Mondal, I.; Srivastava, V.K.; Roy, P.S.; Talukdar, G. Using Logit Model to Identify the Drivers of Landuse Landcover Change in the Lower Gangetic Basin, India. Int. Arch. Photogramm. Remote Sens. Spatial Inf. Sci. 2014, XL-8, 853–859. [Google Scholar] [CrossRef]
- Mustafa, A.; Heppenstall, A.; Omrani, H.; Saadi, I.; Cools, M.; Teller, J. Modelling Built-up Expansion and Densification with Multinomial Logistic Regression, Cellular Automata and Genetic Algorithm. Comput. Environ. Urban Syst. 2018, 67, 147–156. [Google Scholar] [CrossRef]
- Alturk, B.; Konukcu, F. Modeling Land Use/Land Cover Change and Mapping Morphological Fragmentation of Agricultural Lands in Thrace Region/Turkey. Environ. Dev. Sustain. 2020, 22, 6379–6404. [Google Scholar] [CrossRef]
- Matas, C. Urban Sprawl of Major Cities in the Baltic States. Archit. Urban Plan. 2013, 7, 72–79. [Google Scholar]
- Pour, N.M.; Oja, T. Prediction Power of Logistic Regression (Lr) and Multi-Layer Perceptron (Mlp) Models in Exploring Driving Forces of Urban Expansion to Be Sustainable in Estonia. Sustainability 2022, 14, 160. [Google Scholar] [CrossRef]
- Gaur, S.; Singh, R. A Comprehensive Review on Land Use/Land Cover (LULC) Change Modeling for Urban Development: Current Status and Future Prospects. Sustainability 2023, 15, 903. [Google Scholar] [CrossRef]
- Dinda, S.; Das, K.; Chatterjee, N.D.; Ghosh, S. Integration of GIS and Statistical Approach in Mapping of Urban Sprawl and Predicting Future Growth in Midnapore Town, India. Model. Earth Syst. Environ. 2019, 5, 331–352. [Google Scholar] [CrossRef]
- Feng, L.; Jiang, Y. Land Use Structure, Socioeconomic Structure and Macroeconomic Regulation—Empirical Analysis Based on Different Regions of China. In Proceedings of the 2009 International Conference on Management Science and Engineering, Moscow, Russia, 14–16 September 2009; IEEE: Piscataway, NJ, USA, 2009; pp. 2060–2066. [Google Scholar]
- Van der Meer, F. Remote-sensing image analysis and geostatistics. Int. J. Remote Sens. 2012, 33, 5644–5676. [Google Scholar] [CrossRef]
- Richards, J.A.; Richards, J.A. Remote Sensing Digital Image Analysis; Springer: Berlin/Heidelberg, Germany, 2022; Volume 5, pp. 256–258. [Google Scholar]
- Chowdhury, M.; Hasan, M.E.; Abdullah-Al-Mamun, M.M. Land Use/Land Cover Change Assessment of Halda Watershed Using Remote Sensing and GIS. Egypt. J. Remote Sens. Space Sci. 2020, 23, 63–75. [Google Scholar] [CrossRef]
- Natarajan, S.; Radhakrishnan, N. Assessment of Rainfall–Runoff Due to the Impacts of Land-Use Changes by Integrated Geospatial Empirical Approach: Study on Koraiyar Basin, Tiruchirappalli City, India. J. Indian Soc. Remote Sens. 2021, 49, 793–812. [Google Scholar] [CrossRef]
- Chatewutthiprapa, C.; Chotpantarat, S.; Yumuang, S. Land Use and Land Cover Change of Chanthaburi Watershed Following 1999, 2006 and 2013 Floods. In Proceedings of the Geoinformatics for Sustainable Development in Asian Cities, Bangkok, Thailand, 19–20 July 2018; Springer: Berlin/Heidelberg, Germany, 2020; pp. 21–31. [Google Scholar]
- Gupta, S.; Islam, S.; Hasan, M.M. Analysis of Impervious Land-Cover Expansion Using Remote Sensing and GIS: A Case Study of Sylhet Sadar Upazila. Appl. Geogr. 2018, 98, 156–165. [Google Scholar] [CrossRef]
- Kumar, D.; Singh, V.; Bahadur, R. Land Use/Land Cover Change Analysis Using Matrix Union Method. Bull. Pure Appl. Sci. -Geol. 2022, 41, 309–317. [Google Scholar] [CrossRef]
- Singh, M.C.; Satpute, S.; Prasad, V. Remote Sensing and GIS-Based Watershed Prioritization for Land and Water Conservation Planning and Management. Water Sci. Technol. 2023, 88, 233–265. [Google Scholar] [CrossRef]
- Ngandam Mfondoum, A.H.; Wokwenmendam Nguet, P.; Mefire Mfondoum, J.V.; Tchindjang, M.; Hakdaoui, S.; Cooper, R.; Gbetkom, P.G.; Penaye, J.; Bekoa, A.; Moudioh, C. Adapting Sudden Landslide Identification Product (SLIP) and Detecting Real-Time Increased Precipitation (DRIP) Algorithms to Map Rainfall-Triggered Landslides in Western Cameroon Highlands (Central-Africa). Geoenvironmental Disasters 2021, 8, 17. [Google Scholar] [CrossRef]
- Andersson, E. Urban Landscapes and Sustainable Cities. Ecol. Soc. 2006, 11, 34. [Google Scholar] [CrossRef]
- Patra, S.; Sahoo, S.; Mishra, P.; Mahapatra, S.C. Impacts of Urbanization on Land Use /Cover Changes and Its Probable Implications on Local Climate and Groundwater Level. J. Urban Manag. 2018, 7, 70–84. [Google Scholar] [CrossRef]
- Shen, G.; Yang, X.; Jin, Y.; Xu, B.; Zhou, Q. Remote Sensing and Evaluation of the Wetland Ecological Degradation Process of the Zoige Plateau Wetland in China. Ecol. Indic. 2019, 104, 48–58. [Google Scholar] [CrossRef]
- Basiago, A.D. Economic, Social, and Environmental Sustainability in Development Theory and Urban Planning Practice; Kluwer Academic Publishers: Dordrecht, The Netherlands, 1999; Volume 19. [Google Scholar]
- Shen, L.Y.; Jorge Ochoa, J.; Shah, M.N.; Zhang, X. The Application of Urban Sustainability Indicators—A Comparison between Various Practices. Habitat Int. 2011, 35, 17–29. [Google Scholar] [CrossRef]
- Roy, N.C.; Thangaraj, V. Dynamic Interaction of Urban Development and Rural–Urban Migration: An Application of Integrated Urban Metabolism Analysis Tool (IUMAT) for Sustainable City Planning. Digit. Policy Regul. Gov. 2022, 24, 118–140. [Google Scholar] [CrossRef]
- Kumar, S.S.; Pandey, M.; Shukla, A.K. Spatio-temporal analysis of riverbank changes using remote sensing and geographic information system. Phys. Chem. Earth Parts A/B/C 2024, 136, 103692. [Google Scholar] [CrossRef]
- Bharath, H.A.; Chandan, M.C.; Vinay, S.; Ramachandra, T.V. Modelling Urban Dynamics in Rapidly Urbanising Indian Cities. Egypt. J. Remote Sens. Space Sci. 2018, 21, 201–210. [Google Scholar] [CrossRef]
- Pearman, A.D. Scenario Construction for Transport Planning. Transp. Plan. Technol. 1988, 12, 73–85. [Google Scholar] [CrossRef]
- Sarkar, R. Association of Urbanization with Demographic Dynamics in India. GeoJournal 2020, 85, 779–803. [Google Scholar] [CrossRef]
- Shaban, A.; Kourtit, K.; Nijkamp, P. India’s Urban System: Sustainability and Imbalanced Growth of Cities. Sustainability 2020, 12, 2941. [Google Scholar] [CrossRef]
- Cohen, M.; Simet, L. Macroeconomy and Urban Productivity. In Urban Planet; Cambridge University Press: Cambridge, UK, 2018; pp. 130–146. [Google Scholar]
- Gao, J.; O’Neill, B.C. Mapping Global Urban Land for the 21st Century with Data-Driven Simulations and Shared Socioeconomic Pathways. Nat. Commun. 2020, 11, 2302. [Google Scholar] [CrossRef]
- Basha, U.; Pandey, M.; Nayak, D.; Shukla, S.; Shukla, A.K. Spatial–Temporal Assessment of Annual Water Yield and Impact of Land Use Changes on Upper Ganga Basin, India, Using InVEST Model. J. Hazard. Toxic Radioact. Waste 2024, 28, 04024003. [Google Scholar] [CrossRef]
- Verma, P.; Raghubanshi, A.; Srivastava, P.K.; Raghubanshi, A.S. Appraisal of Kappa-Based Metrics and Disagreement Indices of Accuracy Assessment for Parametric and Nonparametric Techniques Used in LULC Classification and Change Detection. Model. Earth Syst. Environ. 2020, 6, 1045–1059. [Google Scholar] [CrossRef]
- Shi, W.; Zhang, M.; Zhang, R.; Chen, S.; Zhan, Z. Change Detection Based on Artificial Intelligence: State-of-the-Art and Challenges. Remote Sens. 2020, 12, 1688. [Google Scholar] [CrossRef]
- Roy, P.S.; Ramachandran, R.M.; Paul, O.; Thakur, P.K.; Ravan, S.; Behera, M.D.; Sarangi, C.; Kanawade, V.P. Anthropogenic Land Use and Land Cover Changes—A Review on Its Environmental Consequences and Climate Change. J. Indian Soc. Remote Sens. 2022, 50, 1615–1640. [Google Scholar] [CrossRef]
- Jung, M.; Scharlemann, J.P.W.; Rowhani, P. Landscape-Wide Changes in Land Use and Land Cover Correlate with, but Rarely Explain Local Biodiversity Change. Landsc. Ecol. 2020, 35, 2255–2273. [Google Scholar] [CrossRef]
- Gomes, L.C.; Bianchi, F.J.J.A.; Cardoso, I.M.; Schulte, R.P.O.; Arts, B.J.M.; Fernandes Filho, E.I. Land Use and Land Cover Scenarios: An Interdisciplinary Approach Integrating Local Conditions and the Global Shared Socioeconomic Pathways. Land Use Policy 2020, 97, 104723. [Google Scholar] [CrossRef]
- Sharma, S.; Joshi, P.K.; Fürst, C. Exploring Multiscale Influence of Urban Growth on Landscape Patterns of Two Emerging Urban Centers in the Western Himalaya. Land 2022, 11, 2281. [Google Scholar] [CrossRef]
- Hale, R.C.; Gallo, K.P.; Loveland, T.R. Influences of Specific Land Use/Land Cover Conversions on Climatological Normals of Near-surface Temperature. J. Geophys. Res. Atmos. 2008, 113, D14113. [Google Scholar] [CrossRef]
- Asempah, M.; Sahwan, W.; Schütt, B. Assessment of Land Cover Dynamics and Drivers of Urban Expansion Using Geospatial and Logistic Regression Approach in Wa Municipality, Ghana. Land 2021, 10, 1251. [Google Scholar] [CrossRef]
- Amini, S.; Saber, M.; Rabiei-Dastjerdi, H.; Homayouni, S. Urban land use and land cover change analysis using random forest classification of landsat time series. Remote Sens. 2022, 14, 2654. [Google Scholar] [CrossRef]
- Parracciani, C.; Gigante, D.; Mutanga, O.; Bonafoni, S.; Vizzari, M. Land cover changes in grassland landscapes: Combining enhanced Landsat data composition, LandTrendr, and machine learning classification in google earth engine with MLP-ANN scenario forecasting. GIScience Remote Sens. 2024, 61, 2302221. [Google Scholar] [CrossRef]
- Hansen, M.C.; Loveland, T.R. A review of large area monitoring of land cover change using Landsat data. Remote Sens. Environ. 2012, 122, 66–74. [Google Scholar] [CrossRef]


| 2003–2014 | ||||||||
|---|---|---|---|---|---|---|---|---|
| Water Bodies | Forest | Agricultural Land | Scrub Land | Fallow Land | Barren Land | Built-Up Land | Grand Total | |
| Water Bodies | 0.21 | 0.00 | 0.18 | 0.00 | 0.00 | 0.00 | 0.01 | 0.41 |
| Forest | 0.00 | 0.13 | 0.68 | 0.00 | 0.01 | 0.00 | 0.18 | 1.3 |
| Agricultural Land | 0.06 | 0.00 | 11.93 | 0.24 | 0.78 | 0.00 | 2.16 | 15.38 |
| Scrub Land | 0.00 | 0.02 | 0.06 | 0.06 | 0.00 | 0.00 | 0.00 | 0.14 |
| Fallow Land | 0.00 | 0.00 | 0.49 | 0.00 | 1.02 | 0.00 | 0.02 | 1.52 |
| Barren Land | 0.00 | 0.00 | 0.08 | 0.00 | 0.00 | 0.04 | 0.29 | 0.12 |
| Built-up Land | 0.00 | 0.00 | 0.00 | 0.00 | 0.00 | 0.00 | 0.89 | 1.37 |
| Grand Total | 0.27 | 0.32 | 13.88 | 0.60 | 1.81 | 0.09 | 3.26 | 20.23 |
| 2014–2024 | ||||||||
| Water Bodies | 0.18 | 0.00 | 0.08 | 0.00 | 0.00 | 0.00 | 0.01 | 0.27 |
| Forest | 0.00 | 0.09 | 0.21 | 0.02 | 0.00 | 0.00 | 0.81 | 0.32 |
| Agricultural Land | 0.01 | 0.00 | 10.70 | 0.21 | 0.09 | 0.05 | 2.36 | 13.88 |
| Scrub Land | 0.00 | 0.12 | 0.01 | 0.29 | 0.00 | 0.00 | 0.21 | 0.6 |
| Fallow Land | 0.00 | 0.01 | 1.05 | 0.02 | 0.66 | 0.00 | 0.06 | 1.81 |
| Barren Land | 0.00 | 0.00 | 0.03 | 0.00 | 0.00 | 0.05 | 0.08 | 0.09 |
| Built-up Land | 0.00 | 0.00 | 0.00 | 0.00 | 0.00 | 0.00 | 2.04 | 3.26 |
| Grand Total | 0.23 | 0.67 | 13.47 | 0.53 | 0.75 | 0.11 | 4.47 | 20.23 |
Disclaimer/Publisher’s Note: The statements, opinions and data contained in all publications are solely those of the individual author(s) and contributor(s) and not of MDPI and/or the editor(s). MDPI and/or the editor(s) disclaim responsibility for any injury to people or property resulting from any ideas, methods, instructions or products referred to in the content. |
© 2025 by the authors. Licensee MDPI, Basel, Switzerland. This article is an open access article distributed under the terms and conditions of the Creative Commons Attribution (CC BY) license (https://creativecommons.org/licenses/by/4.0/).
Share and Cite
Thakur, R.R.; Nandi, D.; Shukla, A.K.; Das, S.; Chand, S.; Singha, P.; Beuria, R.; Sharma, C. Urban Expansion and Land Use Transformations in Midnapore City (2003–2024): Implications for Sustainable Development. Earth 2025, 6, 50. https://doi.org/10.3390/earth6020050
Thakur RR, Nandi D, Shukla AK, Das S, Chand S, Singha P, Beuria R, Sharma C. Urban Expansion and Land Use Transformations in Midnapore City (2003–2024): Implications for Sustainable Development. Earth. 2025; 6(2):50. https://doi.org/10.3390/earth6020050
Chicago/Turabian StyleThakur, Rakesh Ranjan, Debabrata Nandi, Anoop Kumar Shukla, Subhasmita Das, Sasmita Chand, Pankaj Singha, Roshan Beuria, and Chetan Sharma. 2025. "Urban Expansion and Land Use Transformations in Midnapore City (2003–2024): Implications for Sustainable Development" Earth 6, no. 2: 50. https://doi.org/10.3390/earth6020050
APA StyleThakur, R. R., Nandi, D., Shukla, A. K., Das, S., Chand, S., Singha, P., Beuria, R., & Sharma, C. (2025). Urban Expansion and Land Use Transformations in Midnapore City (2003–2024): Implications for Sustainable Development. Earth, 6(2), 50. https://doi.org/10.3390/earth6020050