Abstract
The Urban Heat Island’s (UHI) effect intensifies thermal discomfort for urban communities, increasing energy requirements. This study assesses the incorporation of Phase Change Materials (PCMs) into building envelopes to reduce Urban Heat Island (UHI) impacts in the Trichy urban area, characterised by a dry-summer tropical savanna environment. To evaluate energy efficiency and indoor temperature regulation, simulations were conducted using Design Builder and Climate 6.0 software. The results show that overall room electricity consumption decreased from 480 kWh to 380 kWh, demonstrating the energy-saving benefits of the modifications. Overall energy consumption was reduced to 271.9 kWh/m2/year from 312.23 kWh/m2/year in the base case, a 13% decrease, equating to 40.33 kWh/m2/year in energy savings. The payback period for PCM installation was predicted to be around 30.64 years. These results show that PCM-enhanced building envelopes reduce UHI effects and improve thermal comfort and energy efficiency, making them a feasible, sustainable urban development strategy.
1. Introduction
The Urban Heat Island (UHI) effect refers to the phenomenon in which urban regions exhibit elevated temperatures compared to surrounding rural areas, attributable to anthropogenic activity and alterations in land use [1]. In industrialised and fast-developing cities, the temperature in the urban centre exceeds that of the adjacent rural areas. Impermeable surfaces, low albedo materials, lack of vegetation, reduction in tree canopy, heat emissions from industrial activities, building density, air pollution, and particulate matter all exacerbate the Urban Heat Island effect [2,3,4]. An enhanced microclimate causes a series of adverse consequences, including increased energy consumption, heightened greenhouse gas emissions, declining air quality, detrimental impacts on public health, alterations to the local climate, compromised water quality, impaired urban infrastructure, and diminished comfort and living conditions [5]. Urban planners and legislators can adopt initiatives such as expanding green spaces, utilizing reflective building materials, and enhancing urban design to alleviate the UHI effect [6,7]. Urban planners and policymakers must devise and execute solutions to mitigate the UHI effect to enhance urban quality of life and foster sustainable, resilient communities.
Urban Heat Island (UHI) mitigation strategies include green roofs, urban forestry, cool pavements, increased vegetation, water bodies, and fountains. Green roofs diminish heat flow into buildings by transforming sensible heat into latent heat through evapotranspiration. The process is facilitated by vegetation, which retains water and cools the surrounding air through evapotranspiration and metabolism. Urban forestry offers shade, evapotranspiration, and enhanced thermal comfort. Increasing vegetation in urban areas, such as parks and green spaces, can help to reduce the UHI effect by cooling the air and enhancing the urban microclimate [8]. Cool pavements absorb less heat but require more maintenance and irrigation. Increased vegetation coverage improves cooling, air quality, and aesthetics but requires regular maintenance and watering [6,7]. Water bodies and fountains offer cooling properties but require substantial area and water resources. Strategic urban planning and design include improving ventilation, increasing green spaces, and incorporating reflecting materials. These measures can significantly decrease UHI but may require extensive planning, high expenses, and resistance from urban development interests [8,9].
Despite significant research on UHI mitigation measures, there is still a lack of understanding of how PCMs and advanced glazing systems affect building energy performance in tropical regions. Phase Change Materials (PCMs) and low-emissivity (low-e) windows have emerged as potential alternatives for reducing heat gain and cooling loads in buildings [10]. During phase transitions, such as solid-to-liquid and liquid-to-solid states, PCMs absorb and release thermal energy. This characteristic enables them to regulate indoor temperatures by absorbing heat at peak times and releasing it when temperatures drop [11]. Low-emissivity (low-e) windows have a microscopically thin film that reflects infrared radiation and minimises heat gain in the summer and heat loss in the winter, lowering the need for mechanical heating and cooling. Residential and commercial buildings use this technology for new constructions and to replace existing windows. Combining PCMs in walls and low-e windows can enhance a building’s thermal performance, reduce HVAC loads, and enhance interior comfort [12,13,14,15,16]. Studies have shown significant energy savings and enhanced thermal comfort when these technologies are integrated.
Though PCMs and low-e windows are promising for reducing building heat gain and cooling loads, most current research concentrates on the individual effects of PCMs or glazing systems without considering their combined effect. Research conducted by many has shown considerable energy savings through the utilisation of Phase Change Materials (PCMs) in building walls [17,18,19,20]; however, their long-term efficacy across various climatic conditions is yet inadequately addressed. Moreover, most of the research has concentrated on individual PCM installations; however, our study assesses an integrated approach that employs PCMs in conjunction with triple-glazed windows aimed at Trichy’s dry-summer tropical savanna climate. Through a comprehensive numerical analysis of triple-glazed windows and PCM-integrated walls, this study addresses the gap by quantifying their influence on financial feasibility, thermal comfort, and energy consumption within the urban environment of Trichy.
2. Materials and Methodology
2.1. Materials
A case study in Tiruchirappalli, Tamil Nadu compares conventional and green buildings using a passive vertical envelope. The city has a dry-summer tropical savanna climate with average temperatures of 25 °C to 32 °C. Phase Change Materials (PCMs) are used in the walls and triple-glazed windows that make up the facade of the planned residential building’s vertical envelope [12,13,16,19]. PCMs can absorb or release energy at specific temperatures, and when exposed to heat, the PCM transitions from solid to liquid. Latent heat is stored or absorbed by the PCM during the phase transition process. In contrast, if the temperature falls below the PCM’s phase transition temperature, the molten PCM solidifies, releasing heat energy into the environment [20]. PCMs can be incorporated into concrete in three ways: direct, microencapsulation, and macroencapsulation. RUBITHERM 21 is a PCM material used in the study to balance outdoor temperature for energy savings, reducing energy consumption by 16% annually [13]. This study uses triple-glazed windows with three panes separated by argon gas, providing an additional insulation layer for better temperature management. These windows are more energy efficient with a lower U-value, keeping cold out during winter, providing thermal comfort during summer, and potentially increasing home value. The properties of these windows are based on India’s energy conservation codes.
2.2. Methodology
This study aims to create a sustainable vertical envelope for Trichy region buildings to combat the Urban Heat Island (UHI) effect. The methodology involves identifying UHI causes and selecting appropriate mitigation methods. Essential weather data and thermo-physical properties of building components, including Phase Change Materials (PCMs), are collected. A 2D residential model is drafted using AutoCAD 2019 and transformed into a 3D simulation using Design Builder. Two scenarios are considered: the base case, which represents the standard building design without energy-saving features, and the proposed case, which includes modifications to improve energy efficiency and thermal comfort, such as PCMs and advanced glazing systems. The building model is divided into two parts for thermal analysis: Part A, which includes flats A, B, and E, and Part B, which includes flats C and D and the corridor. Thermal simulations are conducted for both scenarios, with and without PCM and triple-glazed windows. The results are compared to evaluate the effectiveness of the proposed modifications in enhancing the building’s energy efficiency and thermal comfort.
3. Results and Discussions
3.1. Weather Data
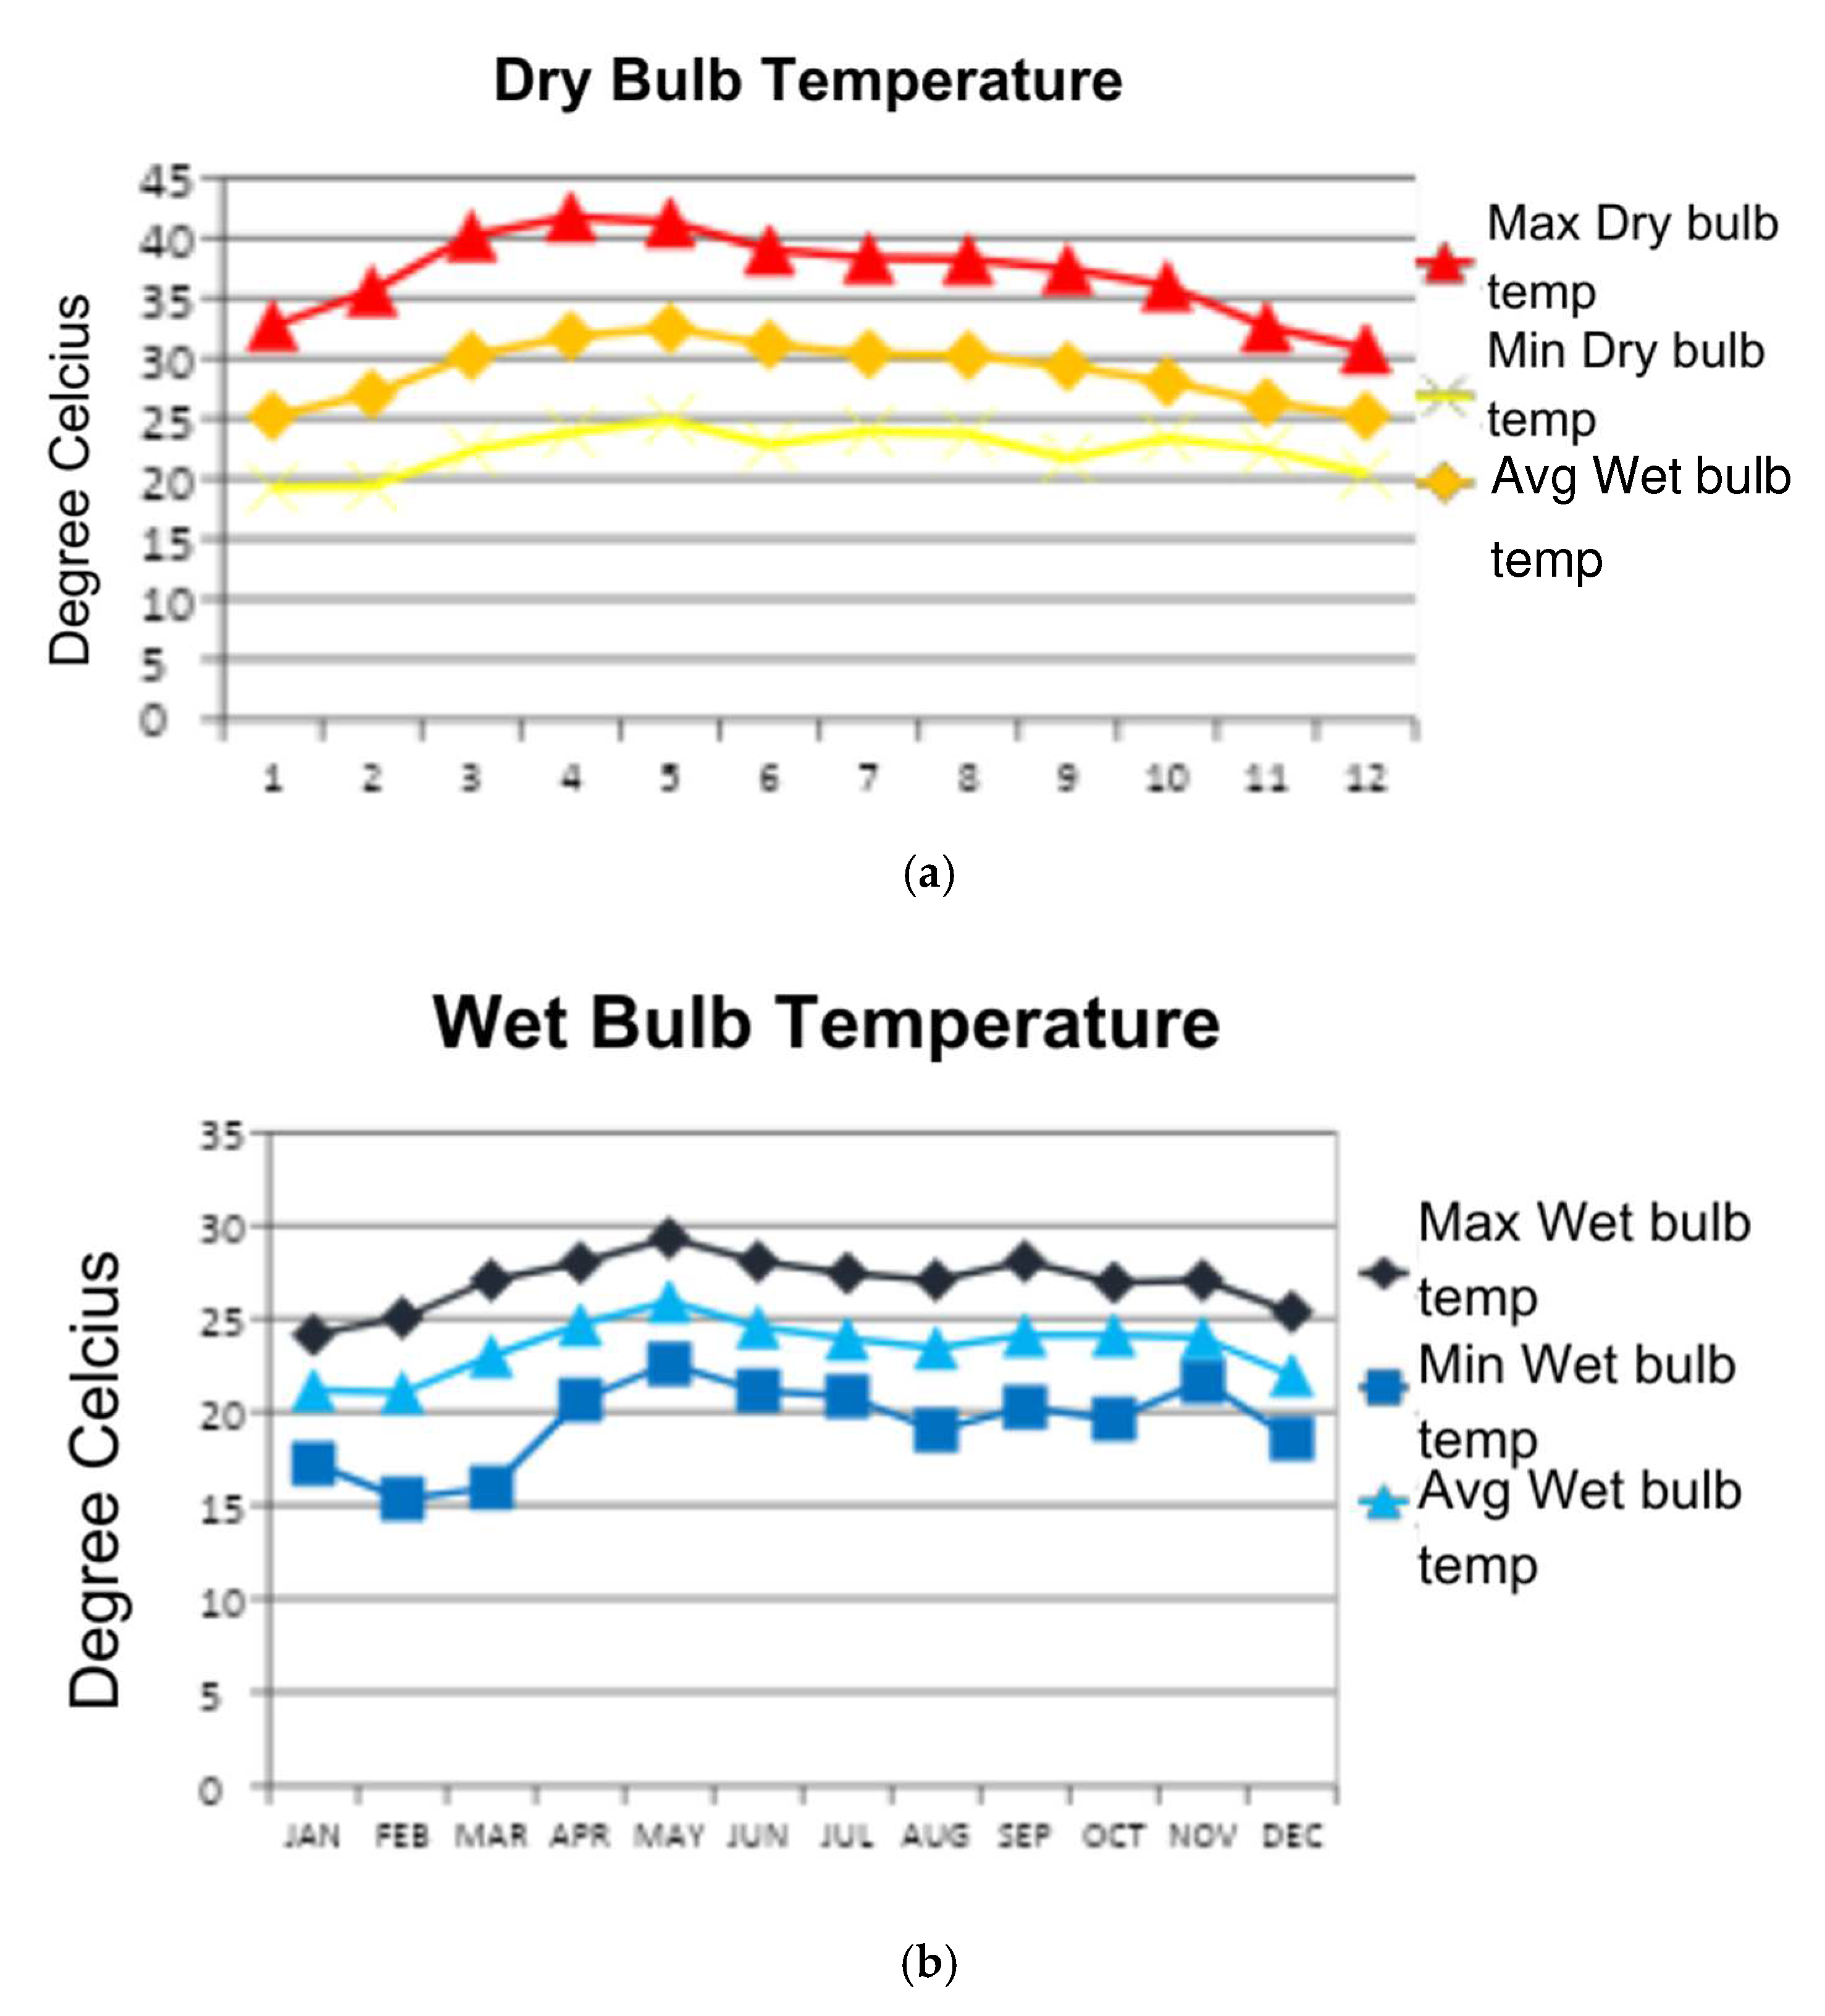
The study area is classified as ‘Aw’ (Tropical Dry Winter or Tropical Savannah Climate) and was analysed using weather data from weather station number 433440. The data collected in 2021 include dry bulb and wet bulb temperatures, Global Horizontal Irradiance (GHI), Direct Normal Irradiance (DNI), and Diffuse Horizontal Irradiance (DHI). In tropical savanna regions like Trichy, Phase Change Materials (PCMs) are useful for lowering cooling loads and regulating indoor temperatures. They function optimally when there are substantial diurnal temperature variations, enabling them to capture heat during the day and emit it at night. The observed temperature range in Trichy’s tropical savanna climate is 10–15 °C in summer and 8–12 °C in winter, with extremes of 41.8 °C (April) and 16.8 °C (January). These variations improve PCM performance by regulating indoor temperatures and lowering cooling demands (Figure 1a). Seasonal trends showed steady increases from January to April, then gradual decreases from May to December. Higher dry bulb temperatures during summer likely increase building cooling load, leading to higher energy consumption for air conditioning. Lower winter temperatures reduce cooling demands but may increase heating needs.

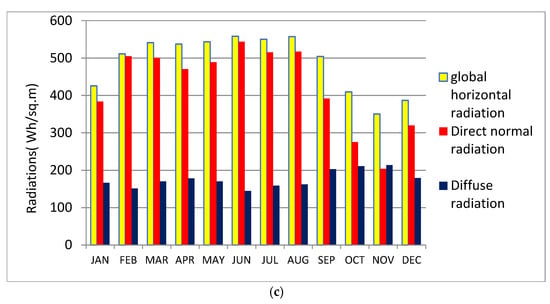
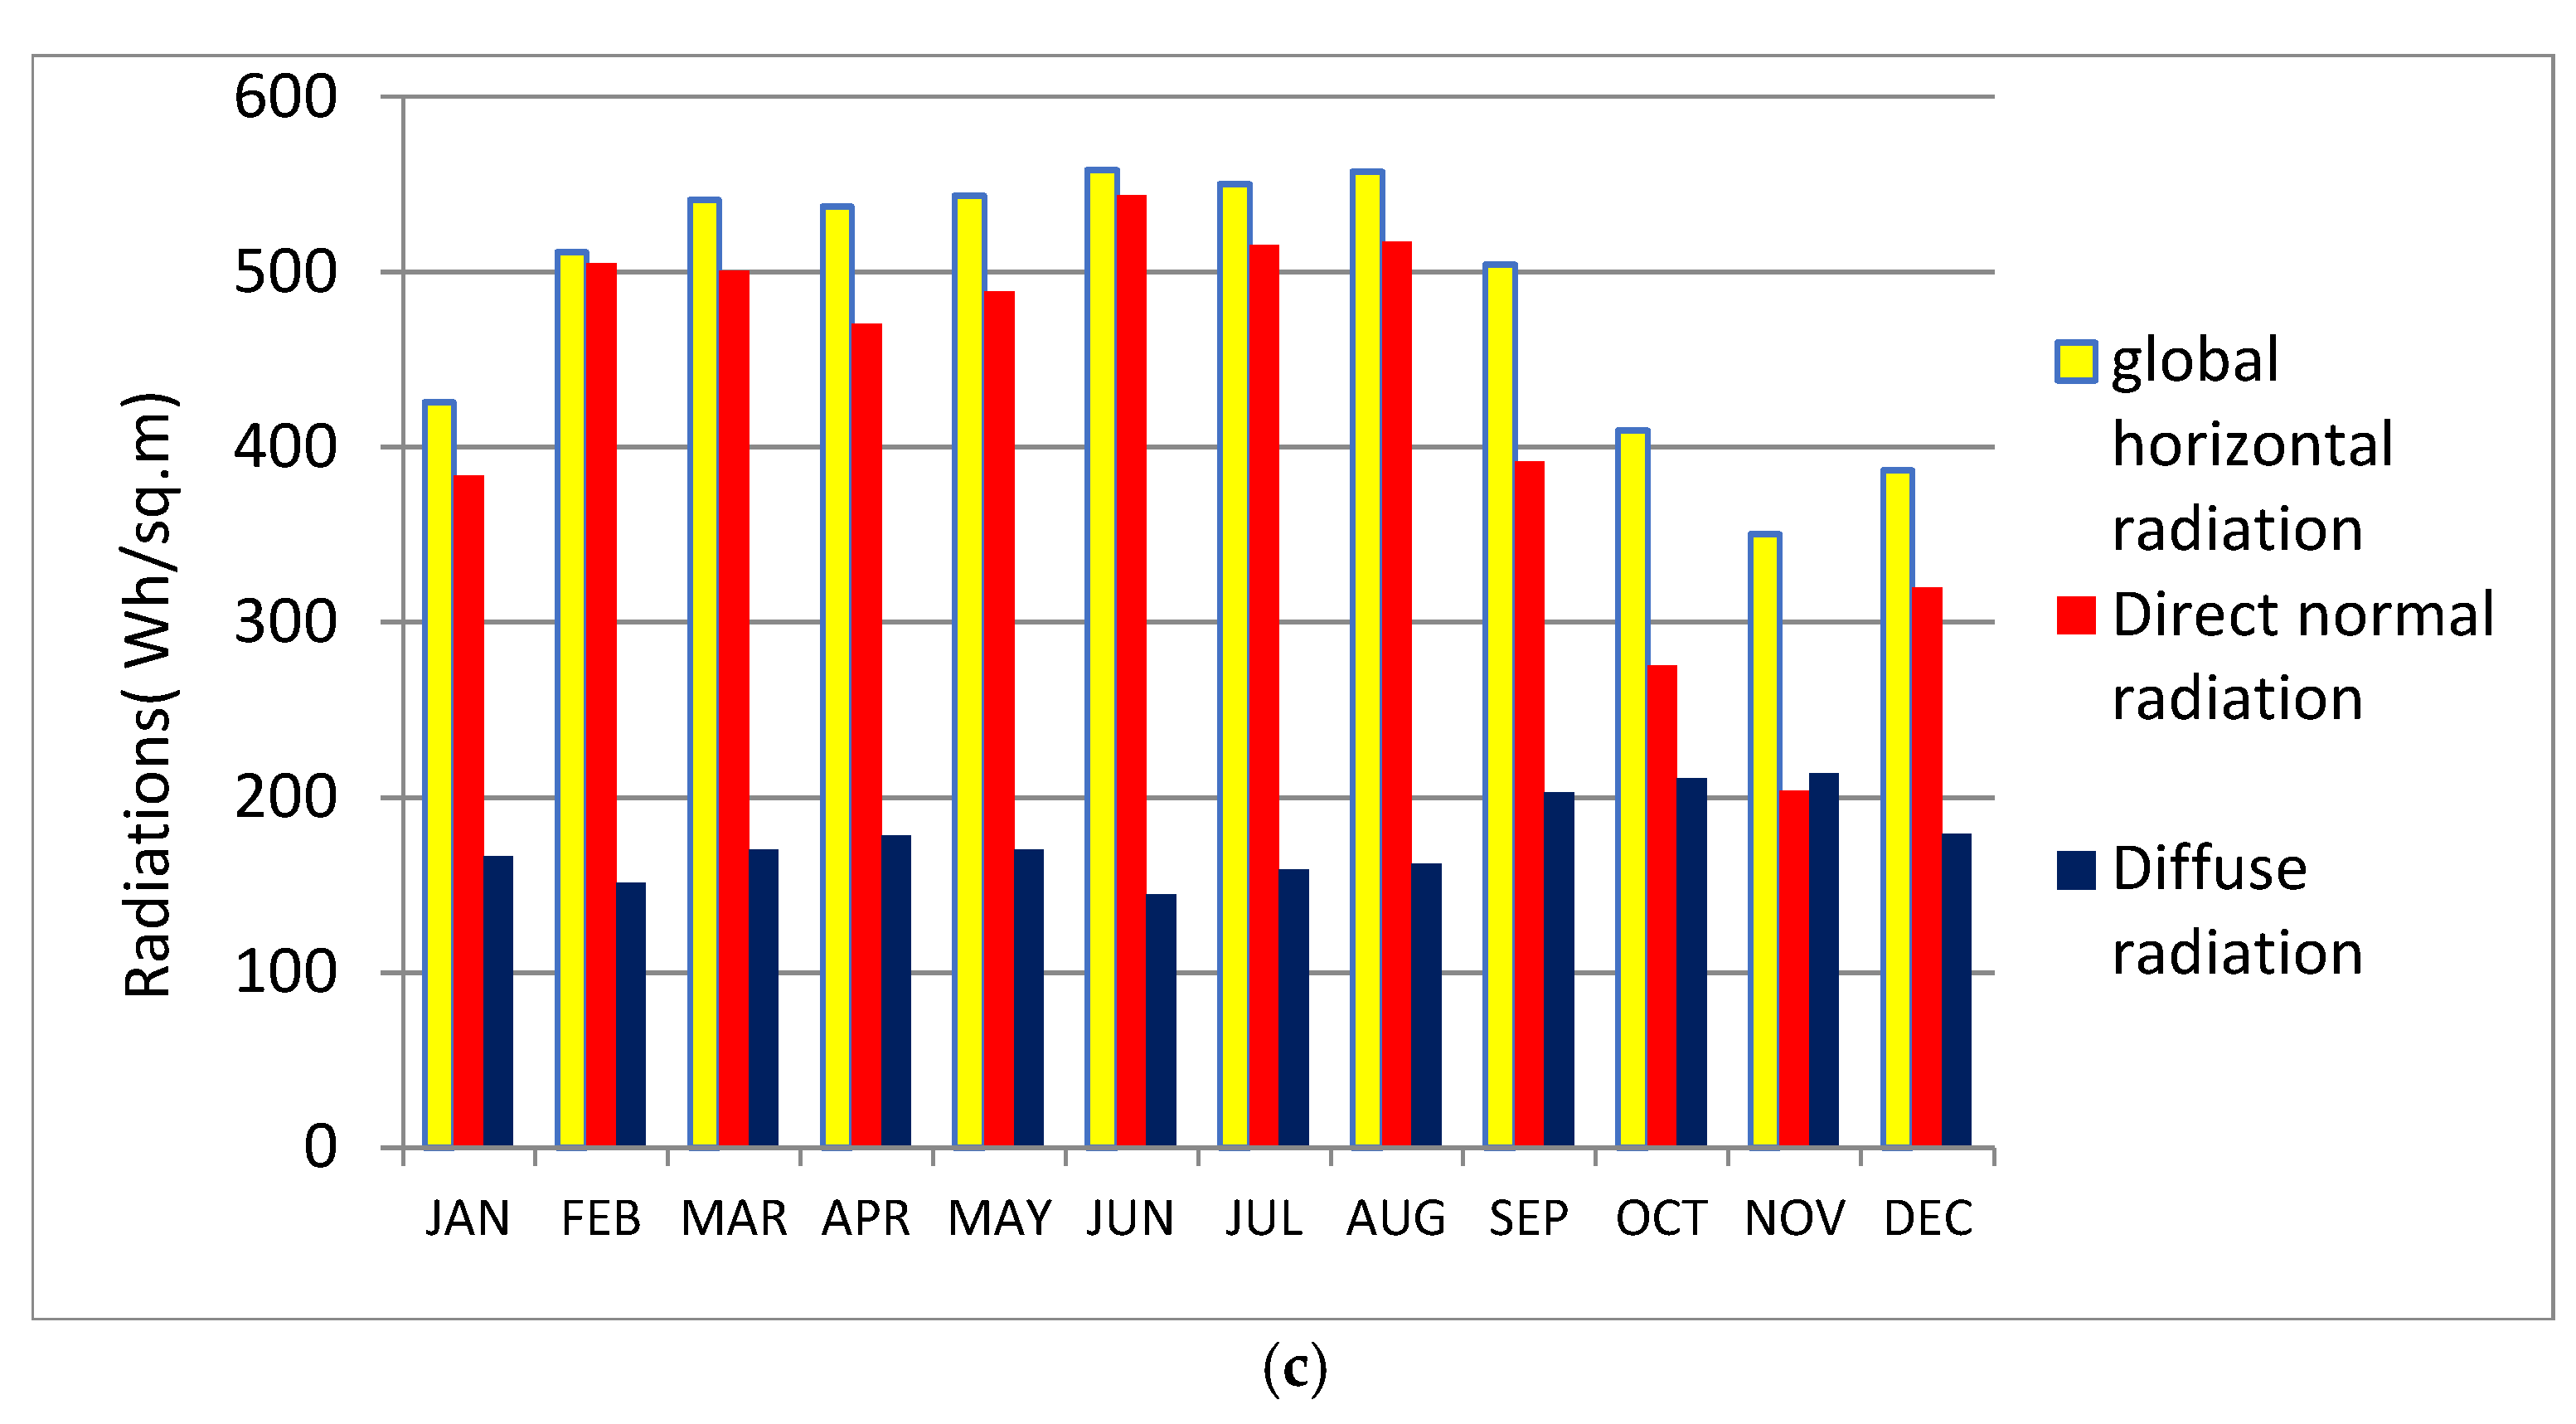
Figure 1.
Temperature data: (a) dry bulb temperature, (b) wet bulb temperature, (c) GHI, DNI, DHI.
The wet bulb temperature, which accounts for air temperature and humidity, indicates fluctuating humidity levels throughout the year, with May being the most humid month (29.3 °C) and February the least (15.35 °C) (Figure 1b). The mean daily relative humidity is 67%, fluctuating between 42% in March and 85% in November. The dry bulb temperature data are illustrated in Figure 1. High humidity can hinder sweat evaporation, making the perceived temperature feel hotter than the actual dry bulb temperature, leading to discomfort and potential health risks due to heat stress. Implementing dehumidification strategies, such as natural ventilation and passive moisture absorption techniques like using baking soda, can help manage energy consumption more efficiently while preventing excessive moisture accumulation. Additionally, behavioral modifications, such as taking shorter showers with open bathroom doors, further contribute to effective humidity regulation, enhancing indoor comfort and reducing energy use. Additionally, the Global Horizontal Irradiance (GHI) represents the total irradiance from the sun on a horizontal surface, the Direct Normal Irradiance (DNI) is the quantity of solar radiation that a surface perpendicular to the sun’s rays receives per unit area, and the Diffuse Horizontal Irradiance (DHI) is the radiation scattered by the atmosphere; these were collected and are shown in Figure 1c.
3.2. 3D Drafting
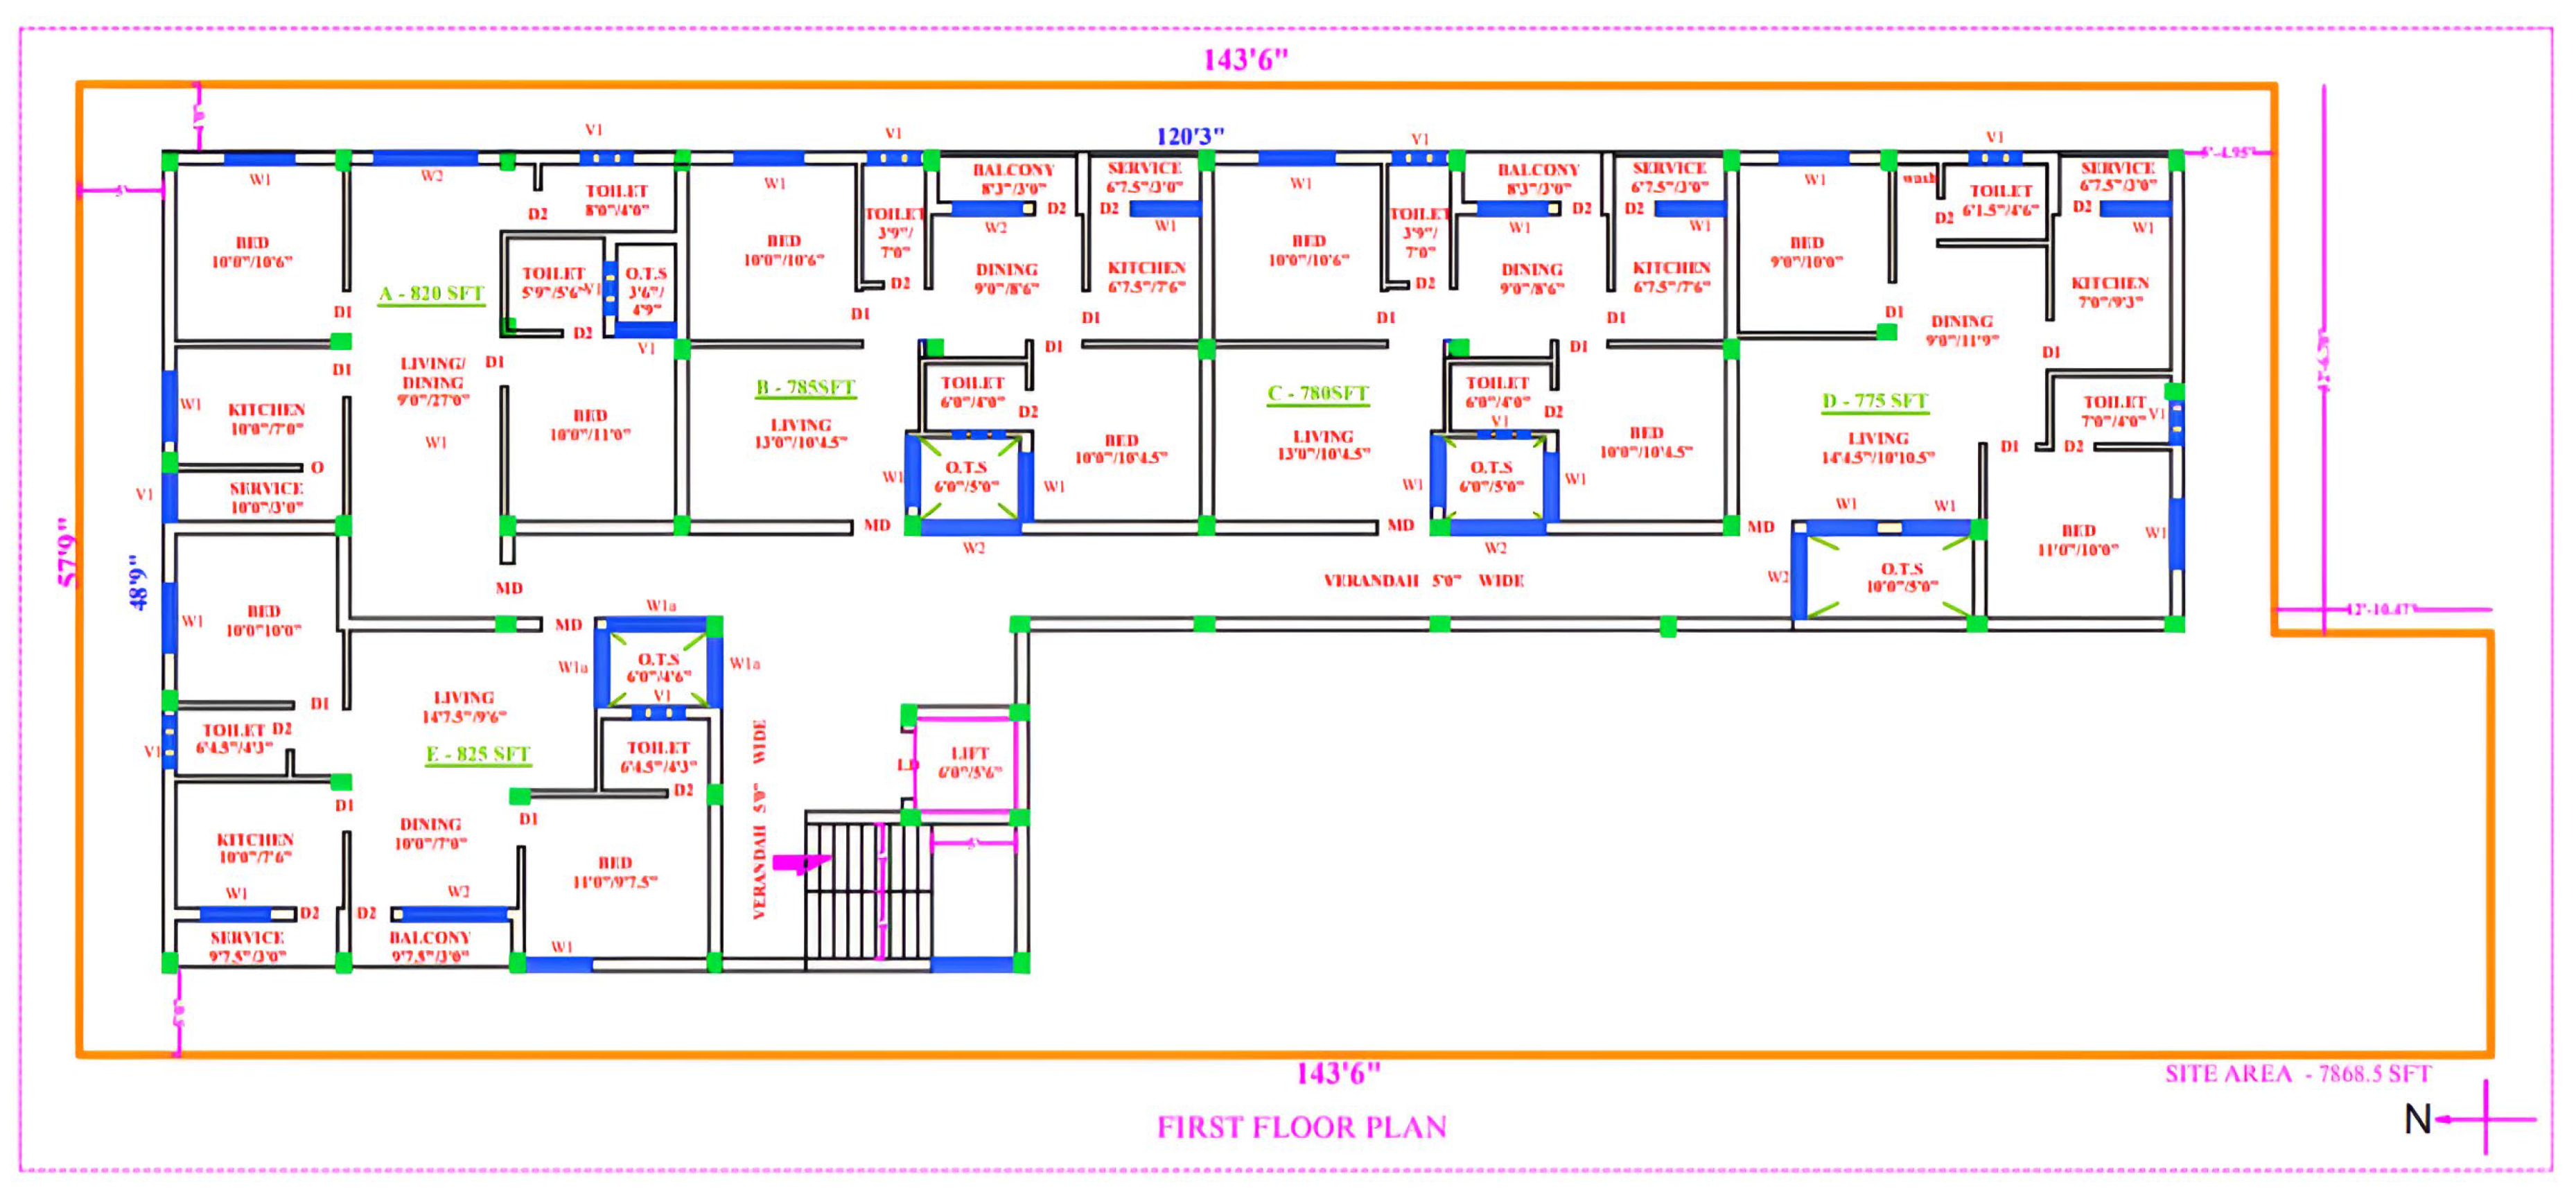
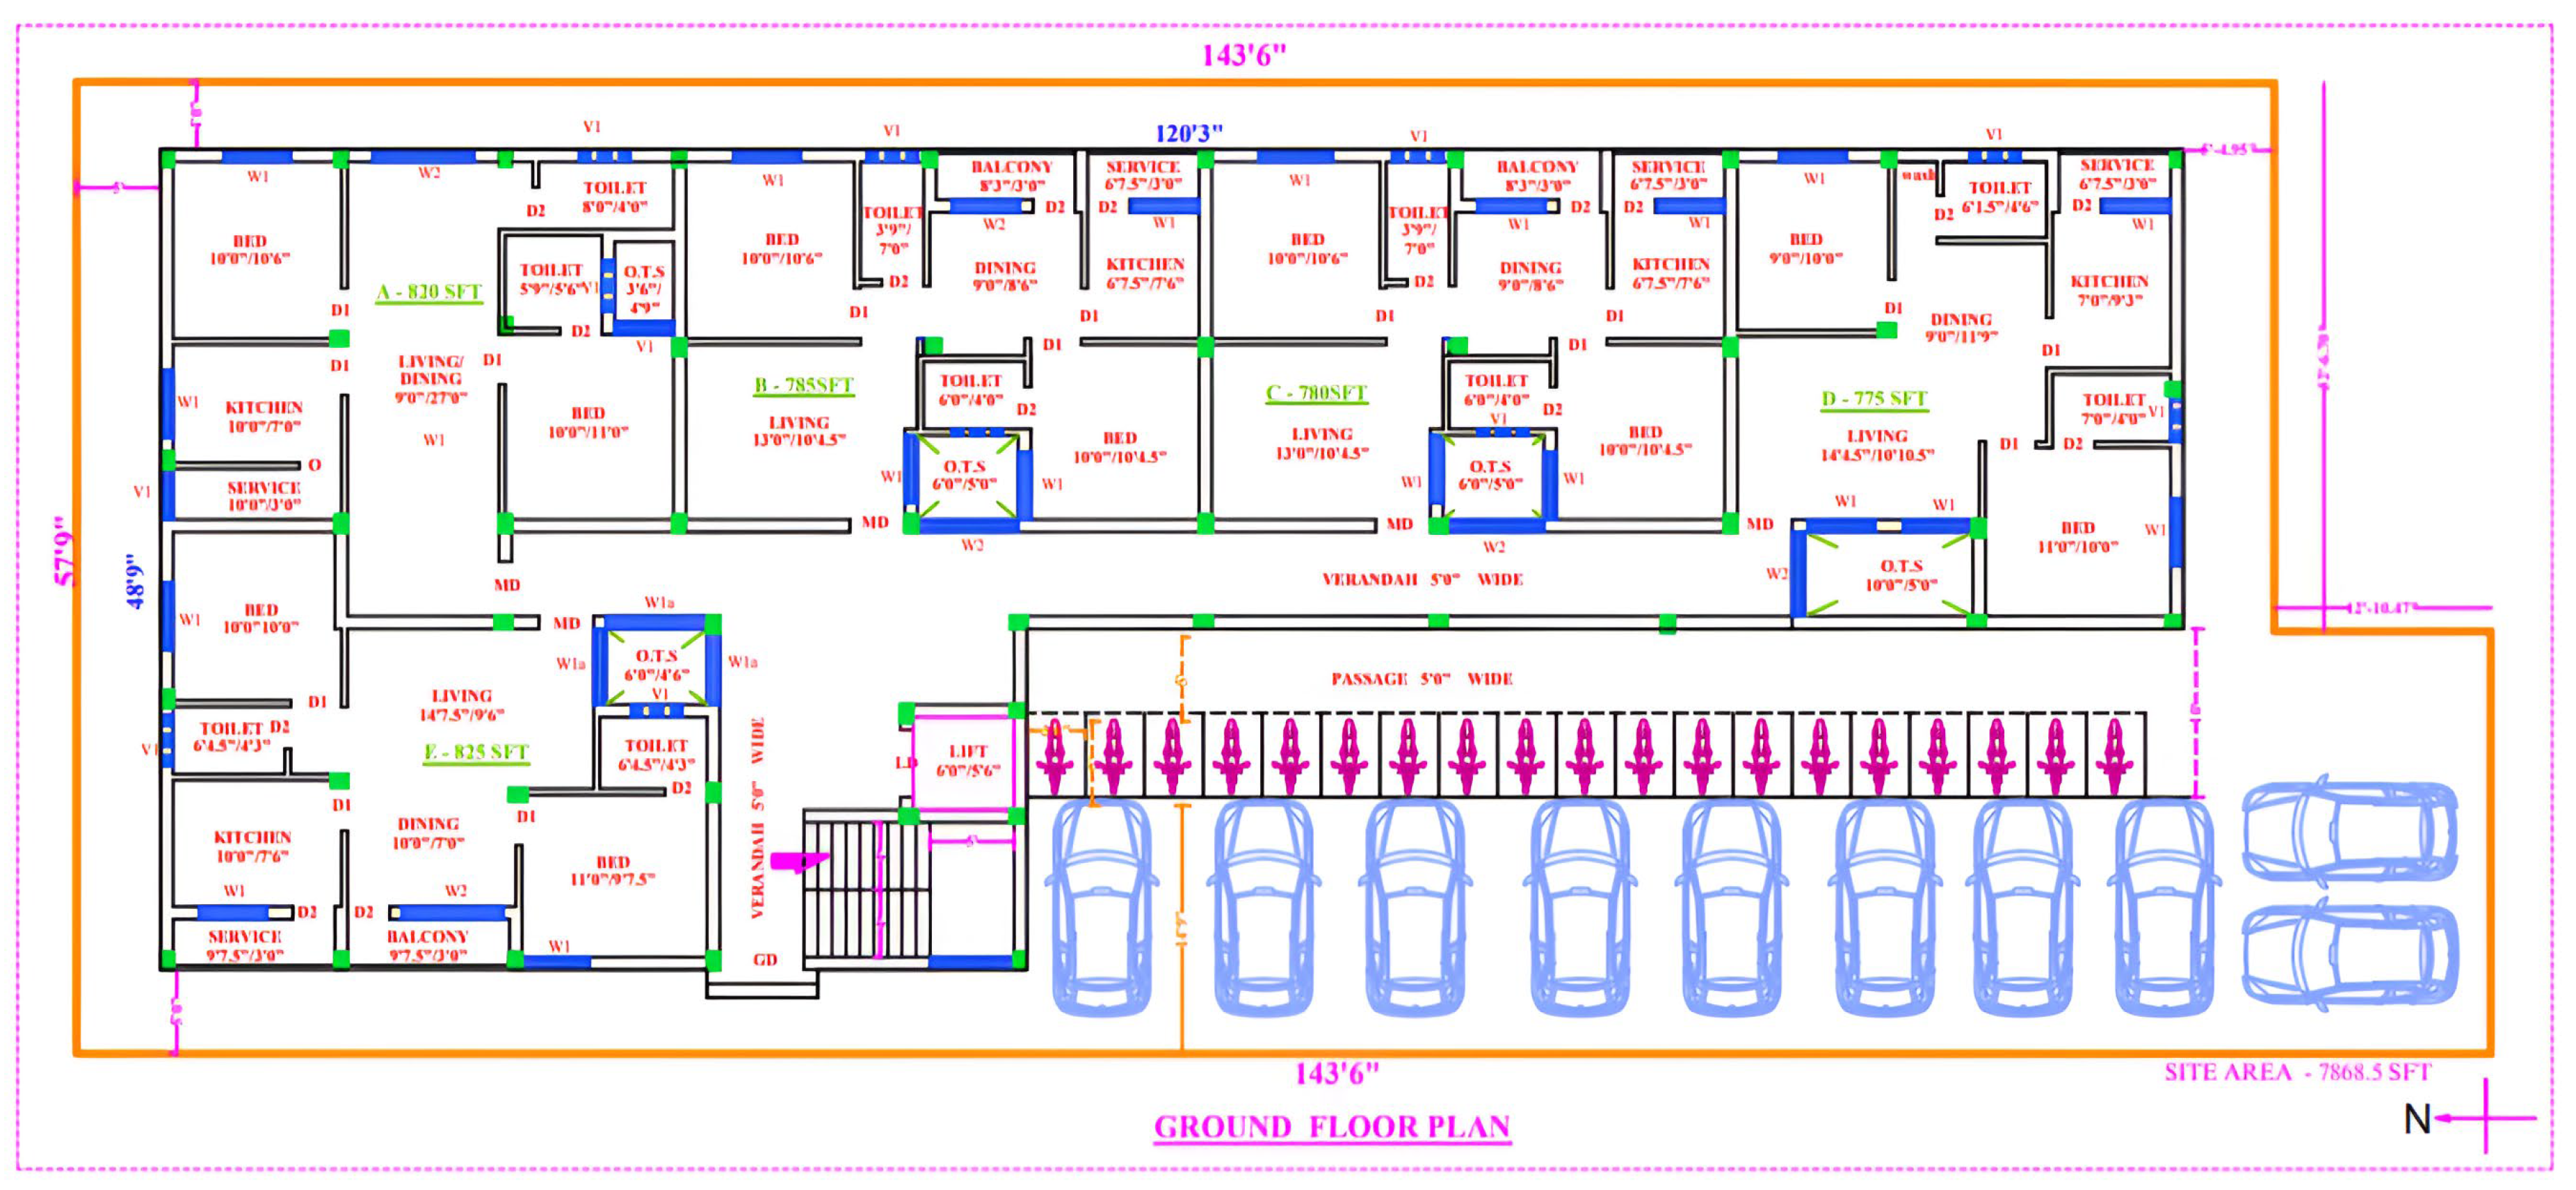
The 2D drafting phase is crucial to the design process, ensuring precision, compliance with national building standards (NBC), and facilitating detailed planning among project stakeholders. This phase supports creating accurate 3D models, which is essential for simulations and design stages. For this project, a 2D plan of a G + 1 residential apartment building was developed using Autodesk CAD, adhering strictly to NBC standards for legal and safety requirements. Key design details include the building’s orientation, total built-up area, and specific room dimensions, such as for the living room, kitchen, toilet, balcony, staircase, and corridor. These specifications ensure that the building layout is compliant with regulations and optimised for the comfort and safety of its residents. The floor plans for the ground and first floors are detailed in Figure 2.
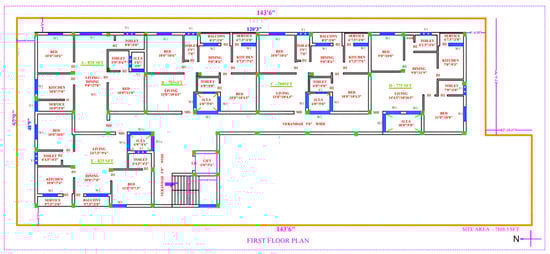
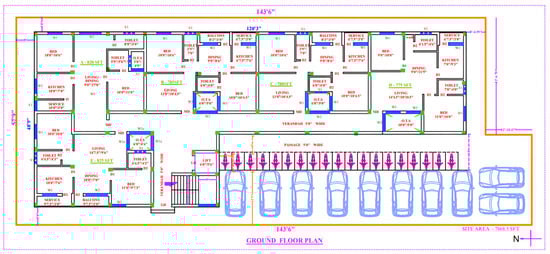
Figure 2.
2D plan of the residential building: (a) ground floor plan, (b) first floor plan.
3.3. 3D Modelling
The building’s 3D modelling and subsequent building simulation were completed using Design Builder software v7. The residential building’s 3D model is shown in Figure 3. The base and proposed case model have the same outlook except for the design of walls and windows.
Figure 3.
3D model of the residential building: (a) S-W isometric view, (b) N-E isometric view, (c) S-E isometric view.
3.4. Data Evaluation
Table 1 details the location data of both the proposed and the base case. In order to conduct in-depth analyses, the building was divided into separate zones based on their utility. Each flat had six zones: kitchen and service, living/dining, bedroom 1, bedroom 2, bathroom 1, and bathroom 2. The zoning divisions were uniformly implemented in all ten flats. The Design Builder software was used to simulate real-world usage accurately. This study also utilised material properties and glazing systems, including U and R values, to analyse energy efficiency. The U-value represents the heat transmission rate, while the R-value measures insulation effectiveness. The specific values used in this study are detailed in Table 2.

Table 1.
Location data.
Table 2.
Combined data for base case model and proposed case model.
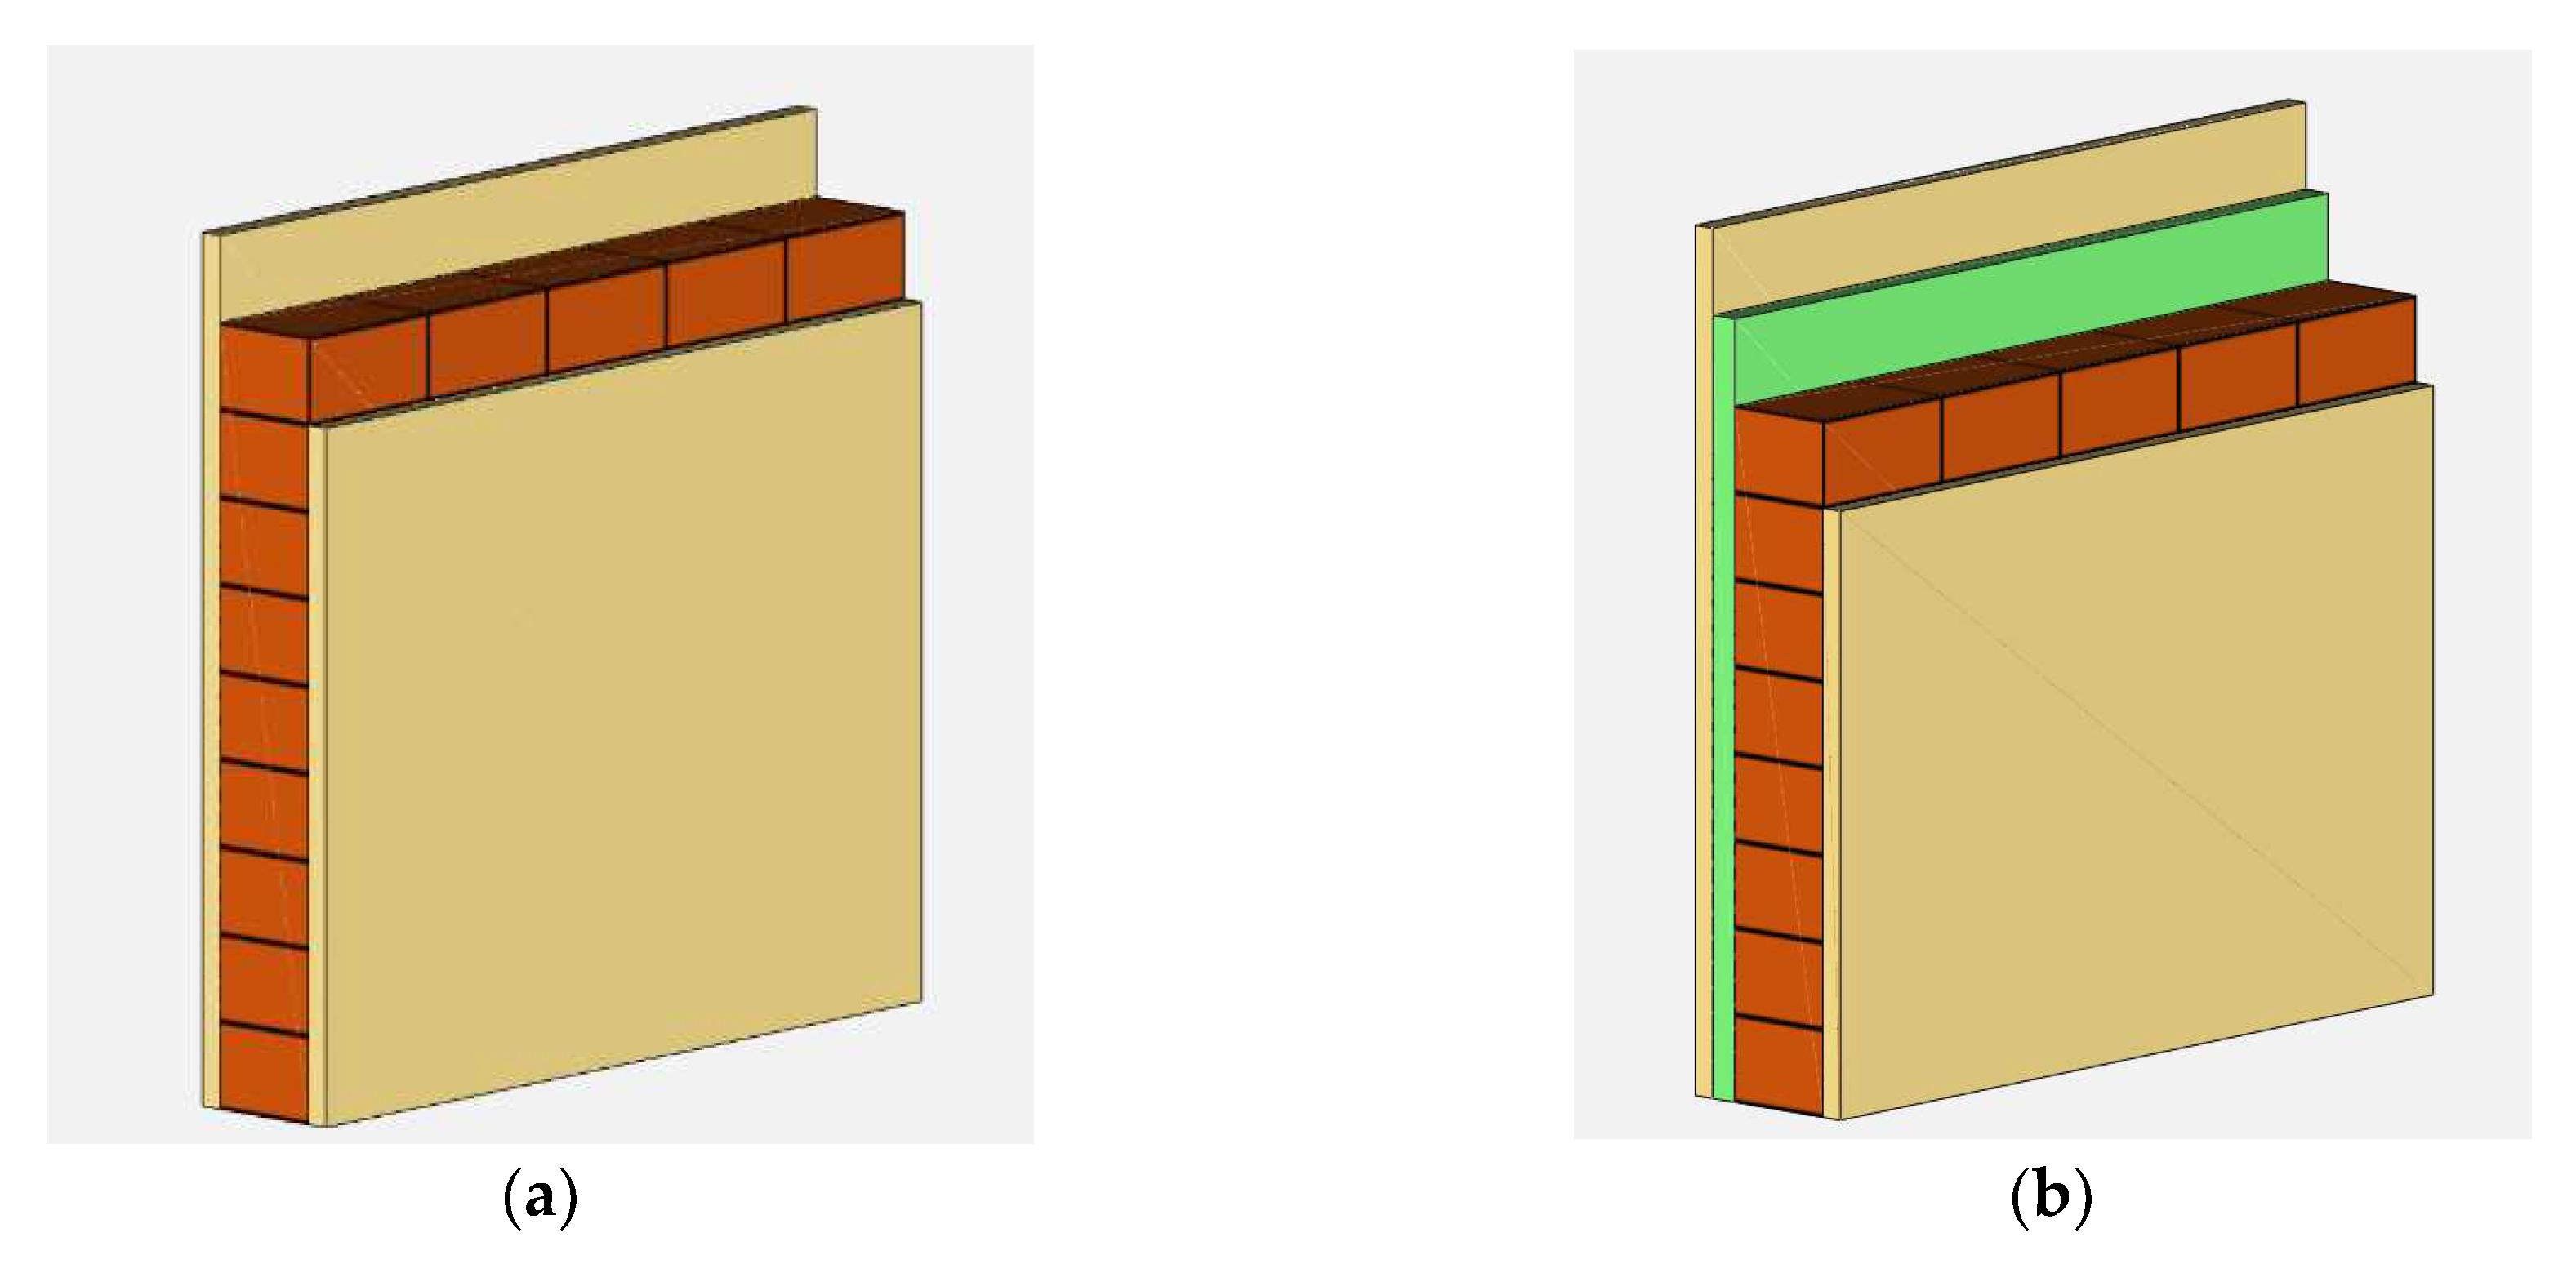
The proposed case involves the integration of Rubitherm PCM (Phase Change Material) into the walls and upgrading single clear glass windows to triple-glazed ones. The amount of PCM utilised was calculated according to empirical studies and manufacturer specifications (Rubitherm 21). It was chosen to provide optimal heat management while being feasible for wall use. The PCM’s placement was chosen based on the building’s external and internal climates and properties. In hot climates, the PCM layer is placed on the exterior side of the wall or window to minimise heat ingress. This helps reduce high daytime indoor temperatures. In colder climates or winter, the PCM layer is placed on the interior side to store and reuse heat efficiently. The wall construction includes 1.25 cm of cement plaster, a 3 cm layer of Rubitherm PCM-mortar (with 20% of the fine aggregate replaced by PCM), 20 cm of brick, and another 1.25 cm cement plaster layer (Figure 4). The detailed data for the proposed building configuration are provided in Table 2. The wall’s U-value in the proposed case is reduced due to the incorporation of Rubitherm PCM, which enhances the thermal insulation. The specific properties of this PCM are detailed in Table 3.
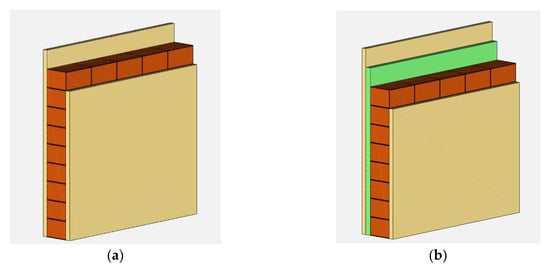
Figure 4.
Cross-section of walls: (a) base case wall, (b) proposed case wall.
Table 3.
Variation in energy parameters.
Illuminance, measured in Lux, represents the total luminous flux incident on a surface per unit area. Lighting Power Density (LPD), measured in Watts per square metre, indicates the lighting power requirement. These values were sourced from the International Energy Conservation Code (IECC) 2021 and are in Table 4.
Table 4.
Properties of R-PCM.
3.5. Energy Model and Thermal Analysis
This study focuses on thermal comfort in a building, analysing the base and proposed case models divided into two sections: Part A and Part B. Part A includes flats A, B, and E, while Part B includes flats C and D and the corridor (Figure 5). Factors influencing thermal comfort include metabolic rate, clothing insulation, air temperature, radiant temperature, airspeed, and humidity. This study primarily focuses on radiant temperature. Material parameters, and U and R values of building components were input into the Design Builder simulation model to determine annual cumulative energy consumption per square metre for both models. The Energy Use Index (EUI) was used to estimate energy efficiency, varying based on factors like building type, climate conditions, operating hours, and occupants. A comparative analysis was conducted to evaluate the building’s performance concerning EUI.
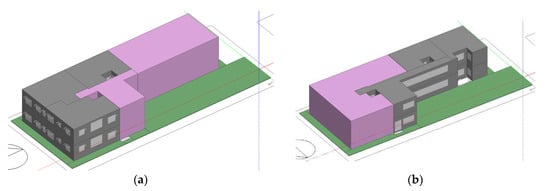
Figure 5.
Sectional model for analysis: (a) Part A, (b) Part B.
3.6. Variation in Energy Parameters
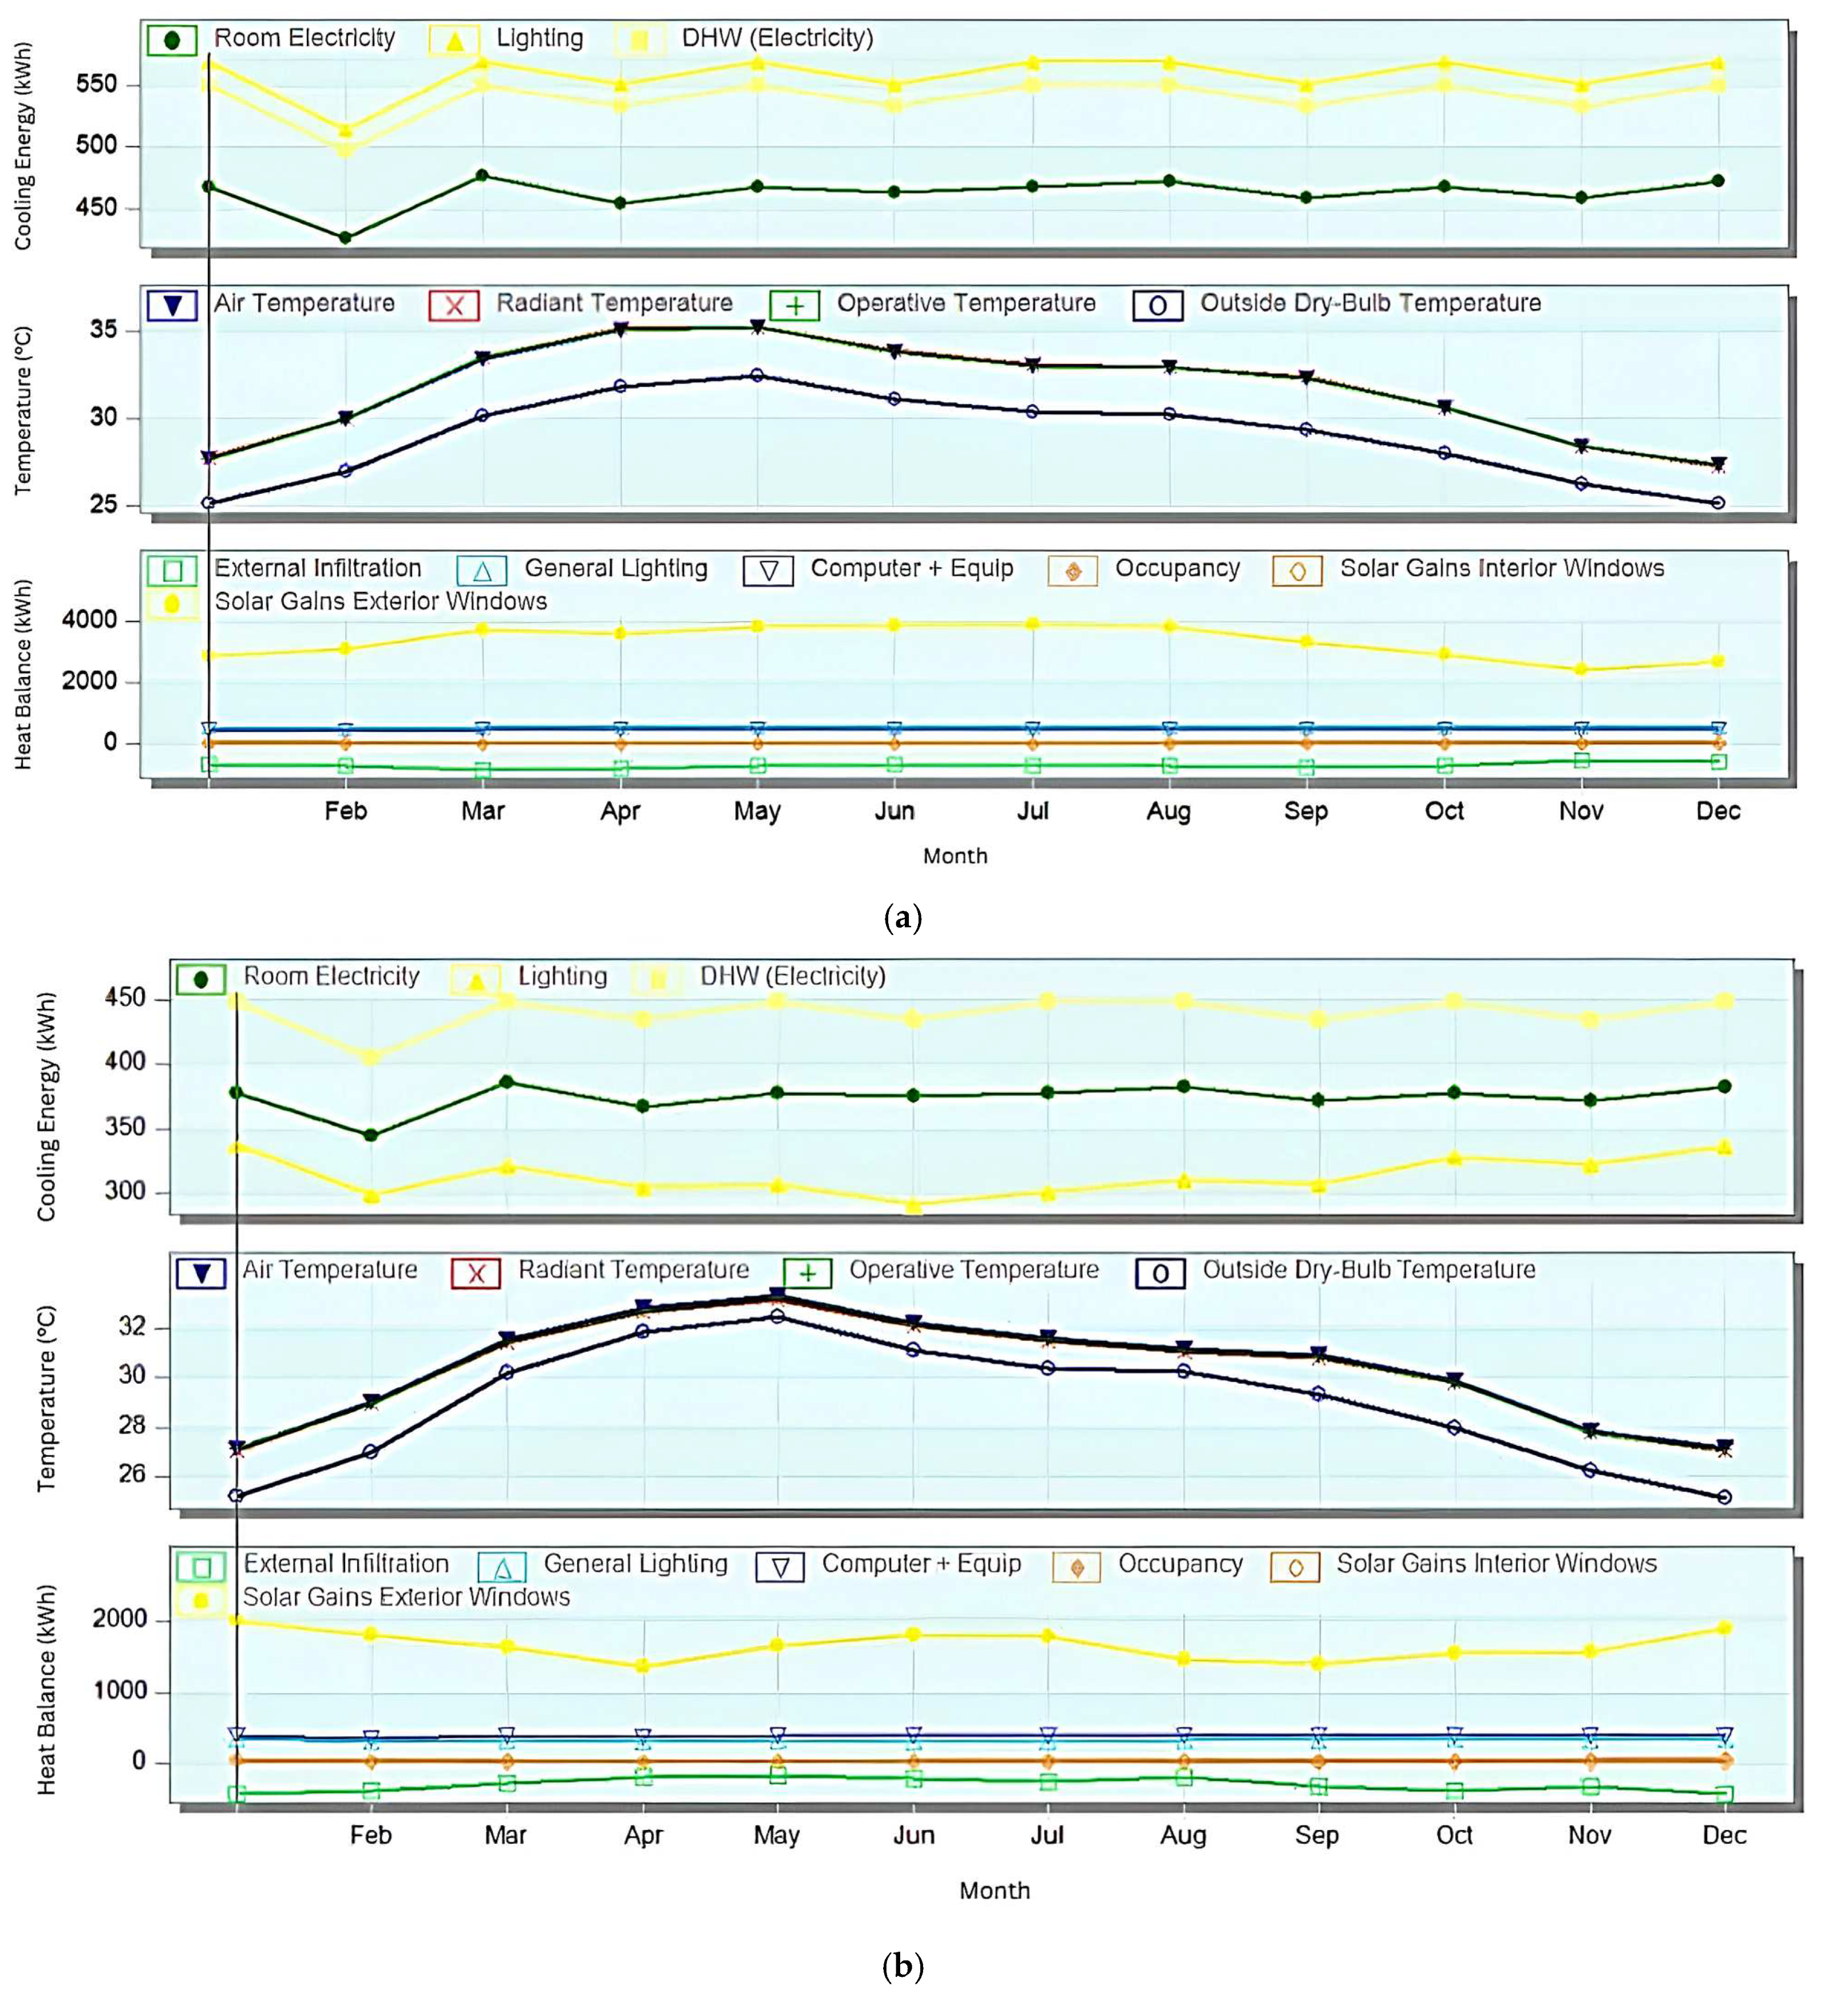
In order to examine fluctuations in radiation, both the proposed and base case models have been simulated to full simulation. Figure 6 depicts the results in graphs. Table 5 summarises significant interpretations of these graphs.
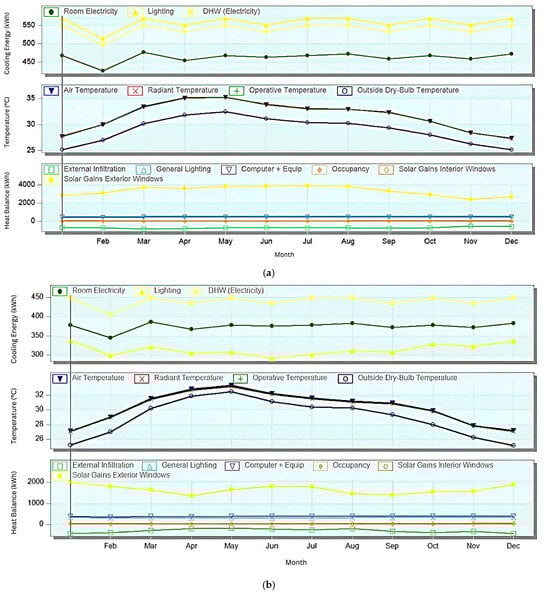
Figure 6.
Variation in energy parameters: (a) base case, (b) proposed case.
Table 5.
Total energy consumption of base case.
The comparative analysis of the base and proposed case models reveals that incorporating Rubitherm Phase Change Materials (PCMs) and triple-glazed windows leads to significant energy reductions and improved thermal performance. Room electricity consumption decreases to 377 kWh, while domestic hot water usage is lower, which is primarily due to better insulation, which minimises heat loss from storage tanks and pipelines. For instance, if pipes and storage tanks have been further isolated, the heat transfer rate with the external environment lessens. By minimizing heat transfer with the external environment, insulation reduces the need for additional heating in winter and prevents excessive heat gain in summer. During the winter, when heat losses are usually higher, the drop in DHW use is higher. Consequently, the utilisation of domestic hot water (DHW) decreases substantially during colder periods, when heat losses are higher, while still giving advantages in milder conditions. Additional improvements to efficiency can be obtained by insulating domestic hot water pipelines and storage tanks using methods such as pipe lagging, tank insulation jackets, or reflecting barriers. Lighting energy use decreases to 315 kWh, and solar gains through exterior windows are lower. Integrating PCM and triple-glazed windows minimises illumination energy consumption by balancing solar gain and daylighting. Single-pane windows produced increased solar heat gain and VLT, necessitating more sunshine to ensure indoor comfort. While triple-glazed windows have a lower SHGC (0.47) and VLT (0.65) than single-glazed windows, this enables more effective light diffusion throughout the interior. This enhances the indoor environment by favouring natural light over artificial illumination.
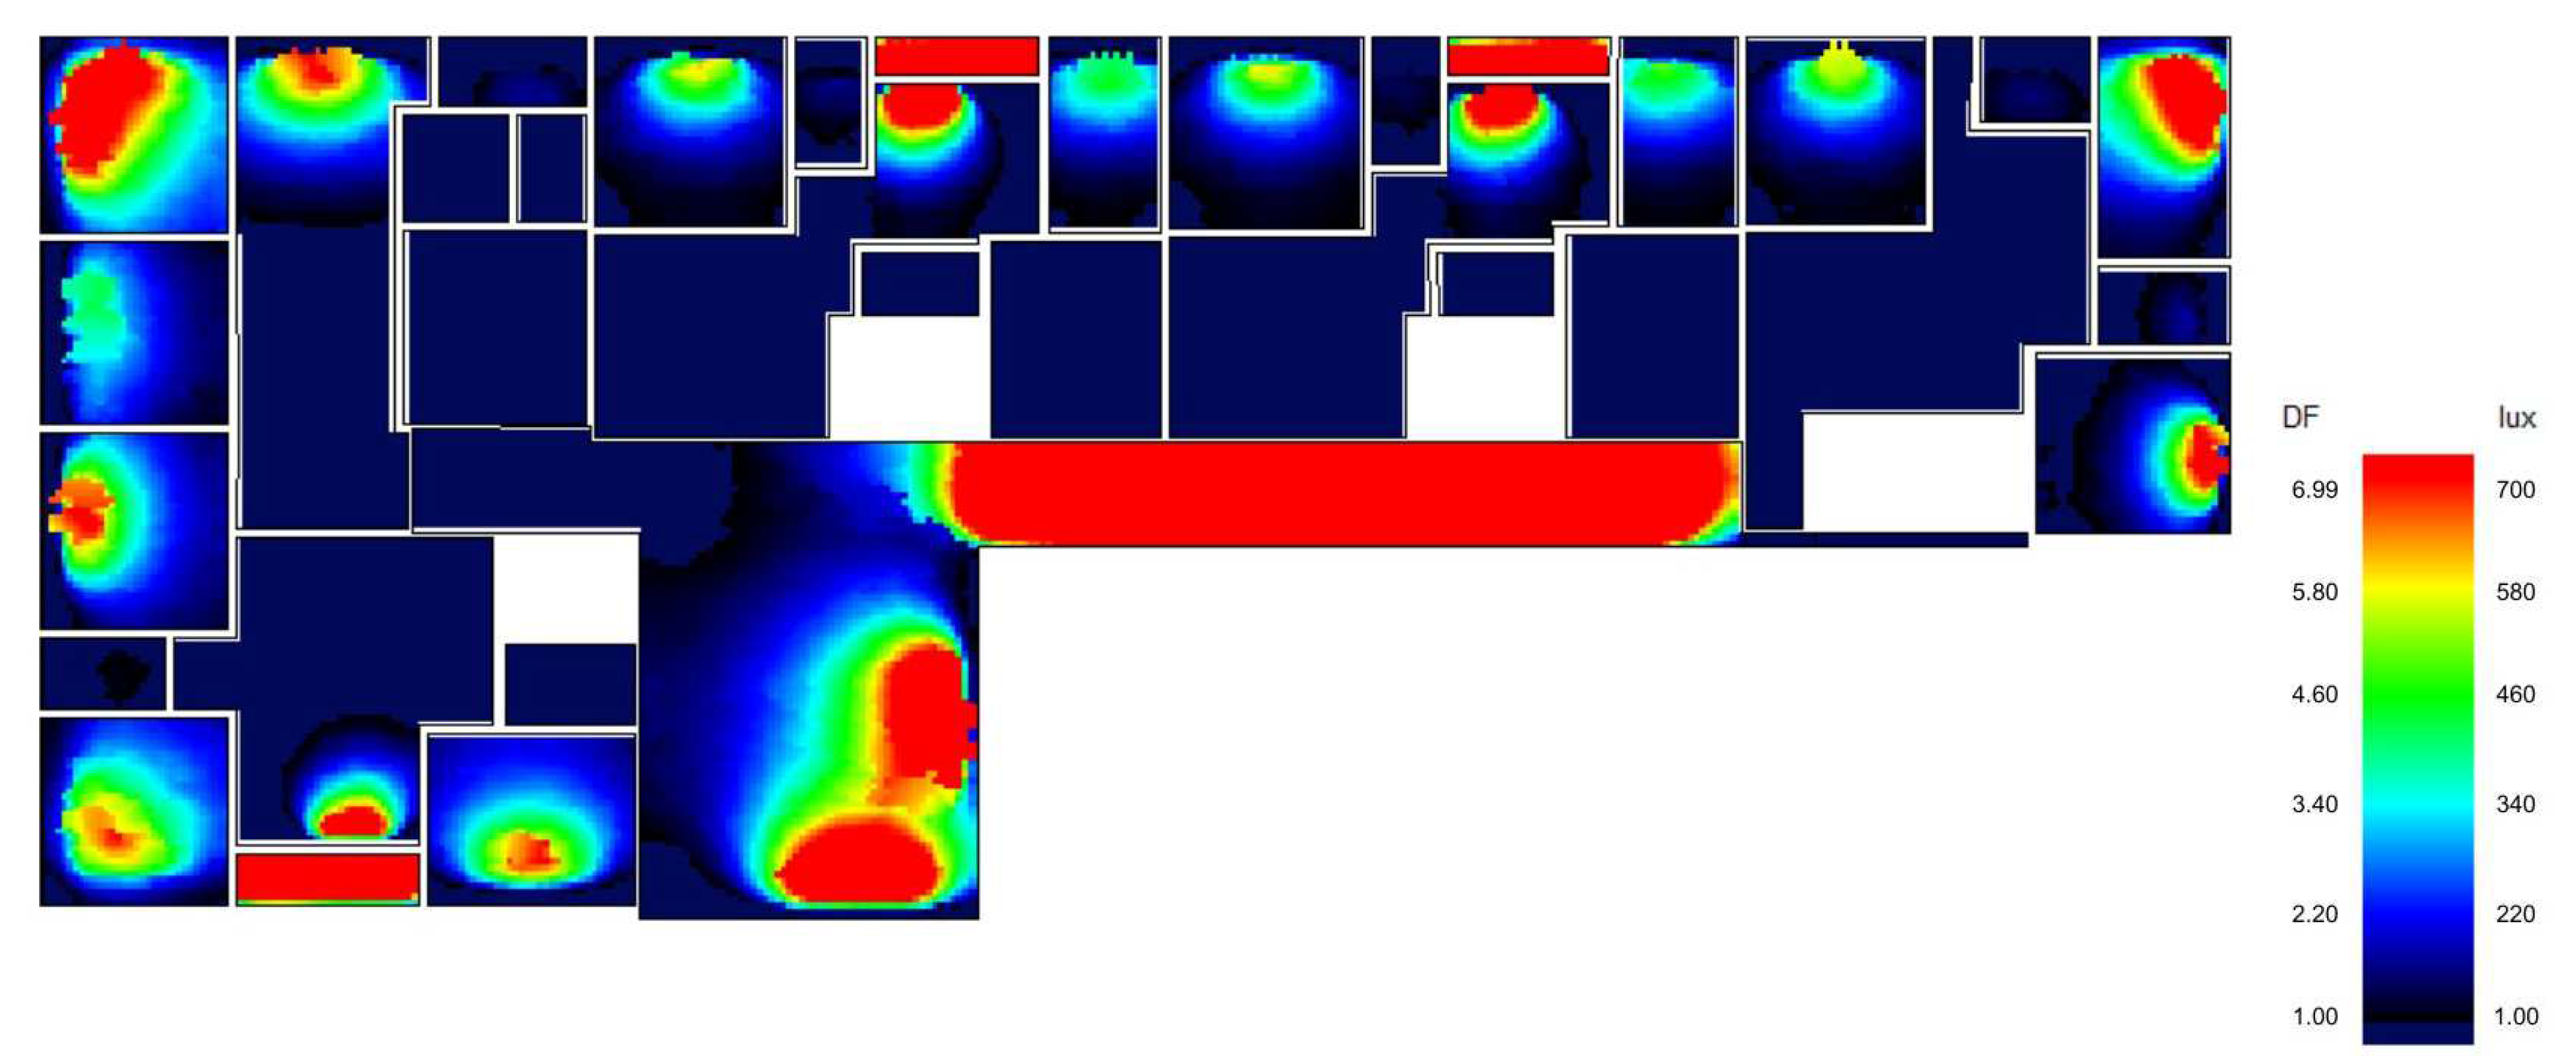
The base case and proposed models were subjected to thermal analysis to evaluate daytime radiance and illuminance in Parts A and B. The daylight factor, which measures the proportion of indoor light levels to outdoor light levels, and the illuminance were evaluated for each scenario. The top floor, crucial for daylight assessment, was specially simulated. The outcomes of these simulations are displayed in Figure 7 and Figure 8.
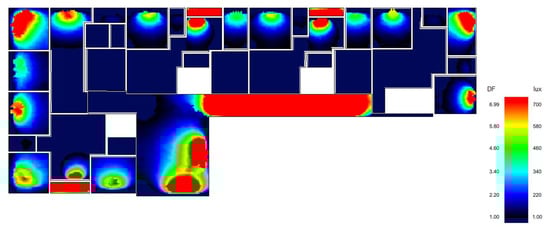
Figure 7.
Daylight radiance of base case (Part A and Part B).
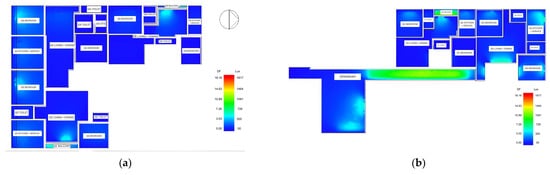
Figure 8.
Daylight radiance of proposed case: (a) Part A, (b) Part B.
In Figure 7, the daylight analysis shows that the maximum illuminance is 700 lux and the minimum is 100 lux, with a daylight factor of 1 to 6.9. Figure 5 illustrates that in both Part A and Part B of the models, the highest brightness level is around 500 lux, and the lowest level is approximately 200 lux, with the daylight factor ranging from 2.2 to 4.6. The proposed case’s improved illuminance over the base case is due to the use of Rubitherm PCM in the walls and triple-glazed windows. The triple-glazed windows let in more natural light because they eliminate glare and improve light diffusion. This effect is facilitated by the incorporation of PCM, which modifies surface reflectance. This configuration provides optimal lighting conditions, meeting the minimum lux requirements set by energy codes.
3.7. Total Energy Consumption
The total energy consumption for the base case and proposed case buildings was analysed through simulations. Each part of the model was oriented in all four cardinal directions, resulting in sixteen different simulation scenarios. The energy consumption values obtained from these simulations are summarised in Table 6.
Table 6.
Total energy consumption of the proposed case.
Table 5 and Table 6 indicate that the average annual energy consumption for the base case building is 312.23 kWh/m2/year, whereas the proposed case building consumes 271.90 kWh/m2/year. This represents a difference of 40.33 kWh/m2/year, demonstrating that the green strategies applied to the vertical envelope in the proposed case result in approximately a 13% reduction in energy consumption.
3.8. Cost Analysis
This study conducted a cost analysis to evaluate the feasibility and financial implications of incorporating Phase Change Materials (PCMs) and other energy-efficient improvements in residential buildings. The analysis compared the base case with the proposed case, focusing on material costs, installation costs, energy savings, and potential subsidies or incentives for adopting energy-efficient technologies. The analysis aimed to determine the payback period for these interventions and provide valuable insights into their financial viability.
Compared to the base case, the proposed building case results in an additional cost of Rs. 4.35 lakhs per owner. Despite the huge initial investment, the analysis reveals significant long-term advantages and energy savings, justifying the additional cost. Using Phase Change Materials (PCMs) enhances thermal comfort, reduces reliance on air conditioning, and aligns with green building standards, potentially leading to green building certifications and increased market value. Government subsidies and incentives for adopting energy-efficient technologies can offset the initial costs, and energy efficiency grants can increase property market value. Energy-efficient buildings also have lower maintenance costs due to durable materials and advanced technologies, extending the building’s lifespan and reducing the need for renovations or repairs. The proposed building case shows a 13% decrease in energy consumption, equivalent to 40.33 kWh/m2/year, for the total floor area of 703.6 m2. The annual savings are approximately INR 141,885.24, or INR 14,188.52 per owner when divided among 10 owners. The payback period for the additional cost per owner is approximately 30.64 years.
4. Conclusions
A residential building in Trichy, Tamil Nadu was compared to an identical building incorporating Rubitherm Phase Changing Material (PCM) and triple-glazed windows filled with argon gas. Thermal analysis using Design Builder software revealed several key findings. The PCM-incorporated building achieved a maximum temperature reduction of 32 °C, a 3 °C reduction due to PCM. Radiance increased significantly, with the lux range increasing from 100–700 in the base case to 200–500 in the proposed case. The building’s exterior windows experienced a reduction in maximum solar gains from 4000 kWh to 2000 kWh and minimum solar gains from 2500 kWh to 1300 kWh, attributed to PCM absorbing ambient heat and minimizing indoor heat transfer. Room electricity consumption decreased from 480 kWh to 380 kWh, demonstrating the energy-saving benefits of the modifications. Overall energy consumption was reduced to 271.9 kWh/m2/year from 312.23 kWh/m2/year in the base case, a 13% decrease, equating to 40.33 kWh/m2/year in energy savings.
The additional cost for the proposed building was INR 4.3 lakhs, which is approximately USD 5220 or EUR 4800. The annual energy savings of INR 14,188.52 per owner lead to a payback period of approximately 30.64 years. In addition, it offers substantial energy savings and improved thermal comfort, enhancing long-term sustainability and potentially increasing the property’s value. In conclusion, replacing conventional walls and windows with PCM-encapsulated walls and triple-pane glazing has significantly reduced heat gain and improved thermal comfort for occupants. This change also resulted in notable energy savings, making the proposed model a step towards achieving a zero-energy building and ensuring its long-term sustainability. Future research could include a Life Cycle Analysis (LCA) of all materials, extending the study to different climatic zones, examining PCM placement in various positions, exploring concrete blocks instead of bricks, incorporating PCM through various methods, and focusing on commercial and high-rise residential buildings.
Author Contributions
Conceptualisation, G.G.I., S.R. and R.V.; Methodology, G.G.I.; Software, R.V., A.R.V., A.B.V.C. and A.C.; Validation, G.G.I., S.R. and R.V.; Formal Analysis, G.G.I. and S.R.; Data Curation, R.V., A.R.V., A.B.V.C. and A.C.; Writing—Original Draft Preparation, G.G.I., S.R. and R.V.; Writing—Review and Editing, G.G.I. and S.R.; Visualisation, R.V.; Supervision, G.G.I. and S.R. All authors have read and agreed to the published version of the manuscript.
Funding
This research received no external funding.
Data Availability Statement
Data are contained within the article.
Acknowledgments
The authors acknowledge the help and support of SASTRA Deemed to be University towards the completion of the work.
Conflicts of Interest
The authors declare no conflicts of interest.
References
- Soltani, A.; Sharifi, E. Understanding and Analysing the Urban Heat Island (UHI) Effect in Micro-Scale. Int. J. Soc. Ecol. Sustain. Dev. 2019, 10, 14–28. [Google Scholar] [CrossRef]
- Halder, B.; Bandyopadhyay, J.; Banik, P. Monitoring the Effect of Urban Development on Urban Heat Island Based on Remote Sensing and Geo-Spatial Approach in Kolkata and Adjacent Areas, India. Sustain. Cities Soc. 2021, 74, 103186. [Google Scholar] [CrossRef]
- Abutaleb, K.; Darwish, A.; Ahmed, M.; Ahmed, F.; Arafat, S.; Ngie, A. Assessment of Urban Heat Island Using Remotely Sensed Imagery over Greater Cairo, Egypt. Adv. Remote Sens. 2015, 04, 34–47. [Google Scholar] [CrossRef]
- Yang, L.; Qian, F.; Song, D.-X.; Zheng, K.-J. Research on Urban Heat-Island Effect. Procedia Eng. 2016, 169, 11–18. [Google Scholar] [CrossRef]
- Twarakavi, N.K.; Kaluarachchi, J.J. Sustainability of Ground Water Quality Considering Land Use Changes and Public Health Risks. J. Environ. Manag. 2006, 81, 405–419. [Google Scholar] [CrossRef]
- Akshay, K.J. Urban Green Spaces and Their Role in Enhancing Quality of Life. J. Struct. Eng. 2024, 12, 33–42. [Google Scholar] [CrossRef]
- Zhang, F.; Qian, H. A Comprehensive Review of the Environmental Benefits of Urban Green Spaces. Environ. Res. 2024, 252, 118837. [Google Scholar] [CrossRef] [PubMed]
- Fernández, C.T.; Navarro, I.M. Analysis of the Impact of Urban Green Spaces on Mitigating the Urban Heat Island Effect. Innov. Sci. Technol. 2024, 3, 11–20. [Google Scholar] [CrossRef]
- Nematinasab, M. A Study of the Place of Green Spaces in Urban Planning with a Look at Informal Urban Green-Space. Int. J. Ser. Eng. Sci. 2017, 3, 14–28. [Google Scholar]
- Faraj, K.; Khaled, M.; Faraj, J.; Hachem, F.; Castelain, C. Phase Change Materials (PCMs) in Buildings. Renew. Sustain. Energy Rev. 2023, 119, 109579. [Google Scholar] [CrossRef]
- Sun, X.; Zhang, Q.; Medina, M.A.; Lee, K.O. On the Natural Convection Enhancement of Heat Transfer during Phase Transition Processes of Solid-Liquid Phase Change Materials (PCMs). Energy Procedia 2014, 61, 2062–2065. [Google Scholar] [CrossRef]
- Al-Absi, Z.A.; Isa, M.H.M.; Ismail, M. Application of Phase Change Materials (PCMs) in Building Walls: A Review. In The Advances in Civil Engineering Materials: Selected Papers of the ICACE 2018 held in Batu Ferringhi, Penang Malaysia on 9–10 May 2018; Springer: Berlin/Heidelberg, Germany, 2019; pp. 73–82. [Google Scholar] [CrossRef]
- Al-Absi, Z.A.; Isa, M.H.M.; Ismail, M. Phase Change Materials (PCMs) and Their Optimum Position in Building Walls. Sustainability 2020, 12, 1294. [Google Scholar] [CrossRef]
- Jin, X.; Medina, M.A.; Zhang, X. On the Importance of the Location of PCMs in Building Walls for Enhanced Thermal Performance. Energy 2014, 73, 780–786. [Google Scholar] [CrossRef]
- Sun, X.; Medina, M.A.; Zhang, Y. Potential Thermal Enhancement of Lightweight Building Walls Derived From Using Phase Change Materials (PCMs). Front. Energy Res. 2019, 7, 13. [Google Scholar] [CrossRef]
- Zhou, D.; Zhao, C.Y.; Tian, Y. Review on Thermal Energy Storage with Phase Change Materials (PCMs) in Building Applications. Appl. Energy 2012, 92, 593–605. [Google Scholar] [CrossRef]
- Wang, X.; Li, W.; Luo, Z.; Wang, K.; Shah, S.P. A critical review on phase change materials (PCM) for sustainable and energy efficient building: Design, characteristic, performance and application. Energy Build. 2022, 260, 111923. [Google Scholar] [CrossRef]
- Lamrani, B.; Johannes, K.; Kuznik, F. Phase change materials integrated into building walls: An updated review. Renew. Sustain. Energy Rev. 2021, 140, 110751. [Google Scholar] [CrossRef]
- Fokaides, P.A.; Kylili, A.; Kalogirou, S.A. Phase Change Materials (PCMs) Integrated into Transparent Building Elements: A Review. Mater. Renew. Sustain. Energy 2015, 4, 1–13. [Google Scholar] [CrossRef]
- Mishra, L.; Sinha, A.; Gupta, R. Recent Developments in Latent Heat Energy Storage Systems Using Phase Change Materials (PCMs)—A Review. In Transactions in Civil and Environmental Engineering; Singapore Springer: Singapore, 2018. [Google Scholar] [CrossRef]


Disclaimer/Publisher’s Note: The statements, opinions and data contained in all publications are solely those of the individual author(s) and contributor(s) and not of MDPI and/or the editor(s). MDPI and/or the editor(s) disclaim responsibility for any injury to people or property resulting from any ideas, methods, instructions or products referred to in the content. |
© 2025 by the authors. Licensee MDPI, Basel, Switzerland. This article is an open access article distributed under the terms and conditions of the Creative Commons Attribution (CC BY) license (https://creativecommons.org/licenses/by/4.0/).