Article

Enhancing Watershed Management Through the Characterization of the River Restoration Index (RRI): A Case Study of the Samian Watershed, Ardabil Province, Iran

1
Department of Range and Watershed Management, Faculty of Agriculture and Natural Resources, Water Management Research Center, University of Mohaghegh Ardabili, Ardabil 5619913131, Iran
2
Department of Watershed Management Engineering, Faculty of Natural Resources and Marine Sciences, Tarbiat Modares University, Noor 46414-356, Iran
3
Department of Range and Watershed Management, Faculty of Natural Resources, Urmia University, Urmia 5756151818, Iran
4
Markazi Province Agricultural and Natural Resources Research and Education Center, Agricultural Research, Education and Extension Organization (AREEO), Arak 3818385149, Iran
5
School of Environmental Sciences, University of Guelph, Guelph, ON N1G 2W1, Canada
*
Author to whom correspondence should be addressed.
Submission received: 9 December 2024 / Revised: 21 January 2025 / Accepted: 22 January 2025 / Published: 26 January 2025

Abstract

:
The mountainous Samian Watershed hosts important rivers recently, significantly triggered by fast and unplanned urbanization, population growth, environmentally hazardous industrialization, and inappropriate dam construction. Nonetheless, this watershed has not yet been evaluated through the lens of river restoration. Therefore, this study aims (1) to apply the River Restoration Index (RRI), (2) to assess the significance of each river restoration criterion and sub-index, and (3) to identify priority hotspots for immediate restoration efforts across 27 sub-watersheds in this case study. First, we built a database containing meteorological, hydrological, land use, physiographic, soil, and economic data. Then, we calculated the general state of the watershed (GSW), connectivity (Con), riverbank conditions (RbC), and hydraulic risk reduction (HRR) sub-indices to develop a multi-domain RRI. Finally, the MEREC-ORESTE hybrid method supported sustainable government planning. The findings reveal significant environmental issues, notably in sanitation conditions, transversal connectivity, and urban encroachment on riverbanks. Sanitation risks were high throughout the watershed, while other eco-environmental risks varied across regions. The weights of 0.36, 0.16, 0.32, and 0.16 were assigned for GSW, Con, RbC, and HRR, respectively, highlighting the importance of GSW and RbC in river restoration activities. Priority management areas (with RRI below 0.50) cover 78% of the watershed.

1. Introduction

Planning for the effective use of river (stream) ecosystems is a fundamental stage in optimal exploitation and avoidance of watershed destruction. Following the declaration of the United Nations on the decade of ecosystem restoration (2021–2030), recently, river restoration has become essential as a managerial and planning approach, especially in urban landscapes where flood risks and morphological imbalances are evident [1,2]. River restoration refers to a wide range of ecological, physical, spatial, and management measures that target to reestablish the natural condition and utility of the river system in the provision of biodiversity, entertainment/tourism, flood/drought management, and land improvement [2,3,4]. It also concludes the hydrological and hydrodynamic performances, geomorphology, water quality, and biotic behavior of the river system [4,5]. Considering the number of rivers and the location of many of them in urban watersheds, measures should be taken to restore urban rivers to their past life to reconcile humans with nature and improve the urban environment [6,7,8].
The discussion on river restoration as an alternative to responding to the gradual ecosystem destruction [9], flood control [10], and restoration of the river environment [11] is expanding. For example, Mrozinska et al. [12] investigated water quality as an indicator in the river flow restoration project in Kwacza, Poland. The results showed that river restoration projects reduce nitrogen pollution, which is especially important in agricultural areas. Verol et al. [4] presented and reviewed the Urban River Restoration Index (URRIx) as a supporting tool for evaluating the improvement of the river environment in urban flood control projects in the Rio de Janeiro region of Brazil. In addition, Verol et al. [4] discussed the integration of river restoration with sustainable urban water management in resilient cities in Dona Eugenia, Brazil. They concluded that river restoration should be supported by sustainable urban drainage measures to offset the adverse effects of city growth on the water cycle to the entire watershed, using a systematic approach.
Zheng and Wang [6] developed an adaptive river-based recreation network for urban river restoration in Rencheng District, Jining City, China. The results showed that the distribution of river connectivity is primarily related to the pattern of regional physical geography (geological structure and topological position of water spots) and human activities (canalization). Williams and Filoso [13] also investigated hydrologic changes and pollutant loads resulting from river restoration in the Rock Creek Watershed in Washington. The results showed that the Regenerative Stormwater Conveyance (RSC) scheme in degraded watersheds can lead to hydrological and biogeochemical changes that significantly reduce nutrient and sediment loads. Recently, Sanchez and Alvarez [1] used the Analytical Hierarchy Process (AHP) for a comprehensive evaluation of the Dulcepamba River Basin, Bolivar, Ecuador, in terms of hydrological restoration. The results of spatial zonation showed that, respectively, 20.28%, 30.67%, and 33.35% of the studied area requires long-term, short-term, and immediate hydrological restoration plans. Guimaraes et al. [3] used a newly developed index of the Integrated Socio-Economic and Environmental Ranking for Design Evaluation (I-SEER) of the Acari River Watershed, Rio de Janeiro, Brazil. They concluded that the hybrid blue-green-grey system had a better function than current conditions and grey infrastructure.
In Iran, Divsalar et al. [14] analyzed and reviewed the strategies for the Shahroud River restoration using the SWOT (strengths, weaknesses, opportunities, and threats) method. They concluded that dealing with the threats of the external environment is the priority for restoring the studied area. Additionally, the strengths of the internal environment should be considered to prevent the negative impact of threats from the external environment. Lotfi and Mousazadeh [15] studied the loss of open spaces around urban rivers and its role in the quality of life and security of citizens using the descriptive-analytical method and single-sample t-tests of the Alangdareh River in Gorgan. The results showed that the indicators of physical accessibility, legible design, lighting, physical security, feeling of security, and environmental comfort in environmental pollution (safety and sanitation) are, respectively, in a medium to low status. In addition, Banihabib et al. [16] provided a framework for determining the sustainable development strategy for restoring a seasonal urban river in the Vardavard River in Tehran. Considering six criteria of sustainable development and the multi-criteria decision-making method (MCDM), they chose the best strategy to achieve the goal, considering the two goals of quantitative and qualitative restoration of groundwater flow and flood protection.
Naderi et al. [17] dealt with river restoration by considering the environmental flow regime in the Qarasu River of Golestan Province. The results obtained from the System for Environmental Flow Analysis (SEFA) ecohydrological model provided a general idea of the habitat desirability in different river sections concerning changes in the natural flow regime and achieving optimal flow conditions and the stability of the aquatic ecosystem. Rajabi et al. [18] also investigated the selection of the best method for green space development with the approach of restoration and development of urban rivers with an MCDM using the AHP in the Kan River in Tehran. Among the major criteria influencing the development of blue-green space, the criterion of increasing the visual green-blue level of urban rivers is more than 34% important, according to the respondents. In addition, Yousefi [19] analyzed the restoration of the Zayandeh Rud River by examining the remaining opportunities. The most important challenge of the Zayandeh Rud River was the organizing of river harvests in the upland watersheds. Making the minimum but permanent river flow natural in a step-by-step and back-and-forth process is suggested as the most important strategy for transitioning to a new equilibrium state. Recently, Talebi et al. [20] assessed the morphology of the Talar River, Mazandaran Province, using the Morphological Quality Index (MQI). It is found that about 15%, 35%, and 50% of the studied reaches, respectively, have good, moderate, and poor (and very poor) conditions. It is also confirmed that the urban areas have the lowest morphological quality.
The increasing concern about river degradation worldwide and the reduction in river quality has led to the search for approaches to address the broader degradation consequences, such as social and economic perspectives. However, watershed restoration has not been evaluated enough using the concept of river restoration, particularly in developing countries. The novelty of this research lies in its first-ever assessment of river restoration in the Samian Watershed which includes most rivers of Ardabil Province (northern Iran). Unlike previous research, watershed zonation based on the multi-functional assessment of the river restoration has never been considered. Given the strategic socio-economic importance of the Samian Watershed, which includes four counties of Ardabil, Nir, Sarein, and Namin, and the ever-increasing human population, it presents a good case study to deepen our understanding of the general conditions of its rivers in terms of river restoration concept. Samian Watershed is a part of the Qarasu River Basin. Qarasu River is considered the longest and most watery river in Ardabil Province. Therefore, the present research was conducted to (1) apply the river restoration index (RRI) for the mountainous and urbanized watershed of Samian; (2) to determine the importance of each of the river restoration criteria and sub-indices; and (3) to distinguish the hotspots for immediate river restoration actions. The results of this research can be used in regular monitoring and evaluation of different criteria for river restoration at different levels of local, regional, or national decision making.

2. Materials and Methods

This research used the assessment of RRI based on sub-indices considering different criteria that affect the river restoration. To do this, various steps were taken: (1) collecting primary and secondary data; (2) setting and calculating desired sub-criteria, criteria, and sub-indices; (3) weighting criteria and sub-indices using the MEthod based on the Removal Effects of Criteria (MEREC); (4) estimation of the RRI; (5) ranking sub-watersheds using organísation, rangement et Synthèse de données relarionnelles (ORESTE); and (6) spatial zoning of sub-watersheds based on criteria, sub-indices, and RRI; (6) The steps of the present study are also shown in Figure 1.

2.1. Case Study Description

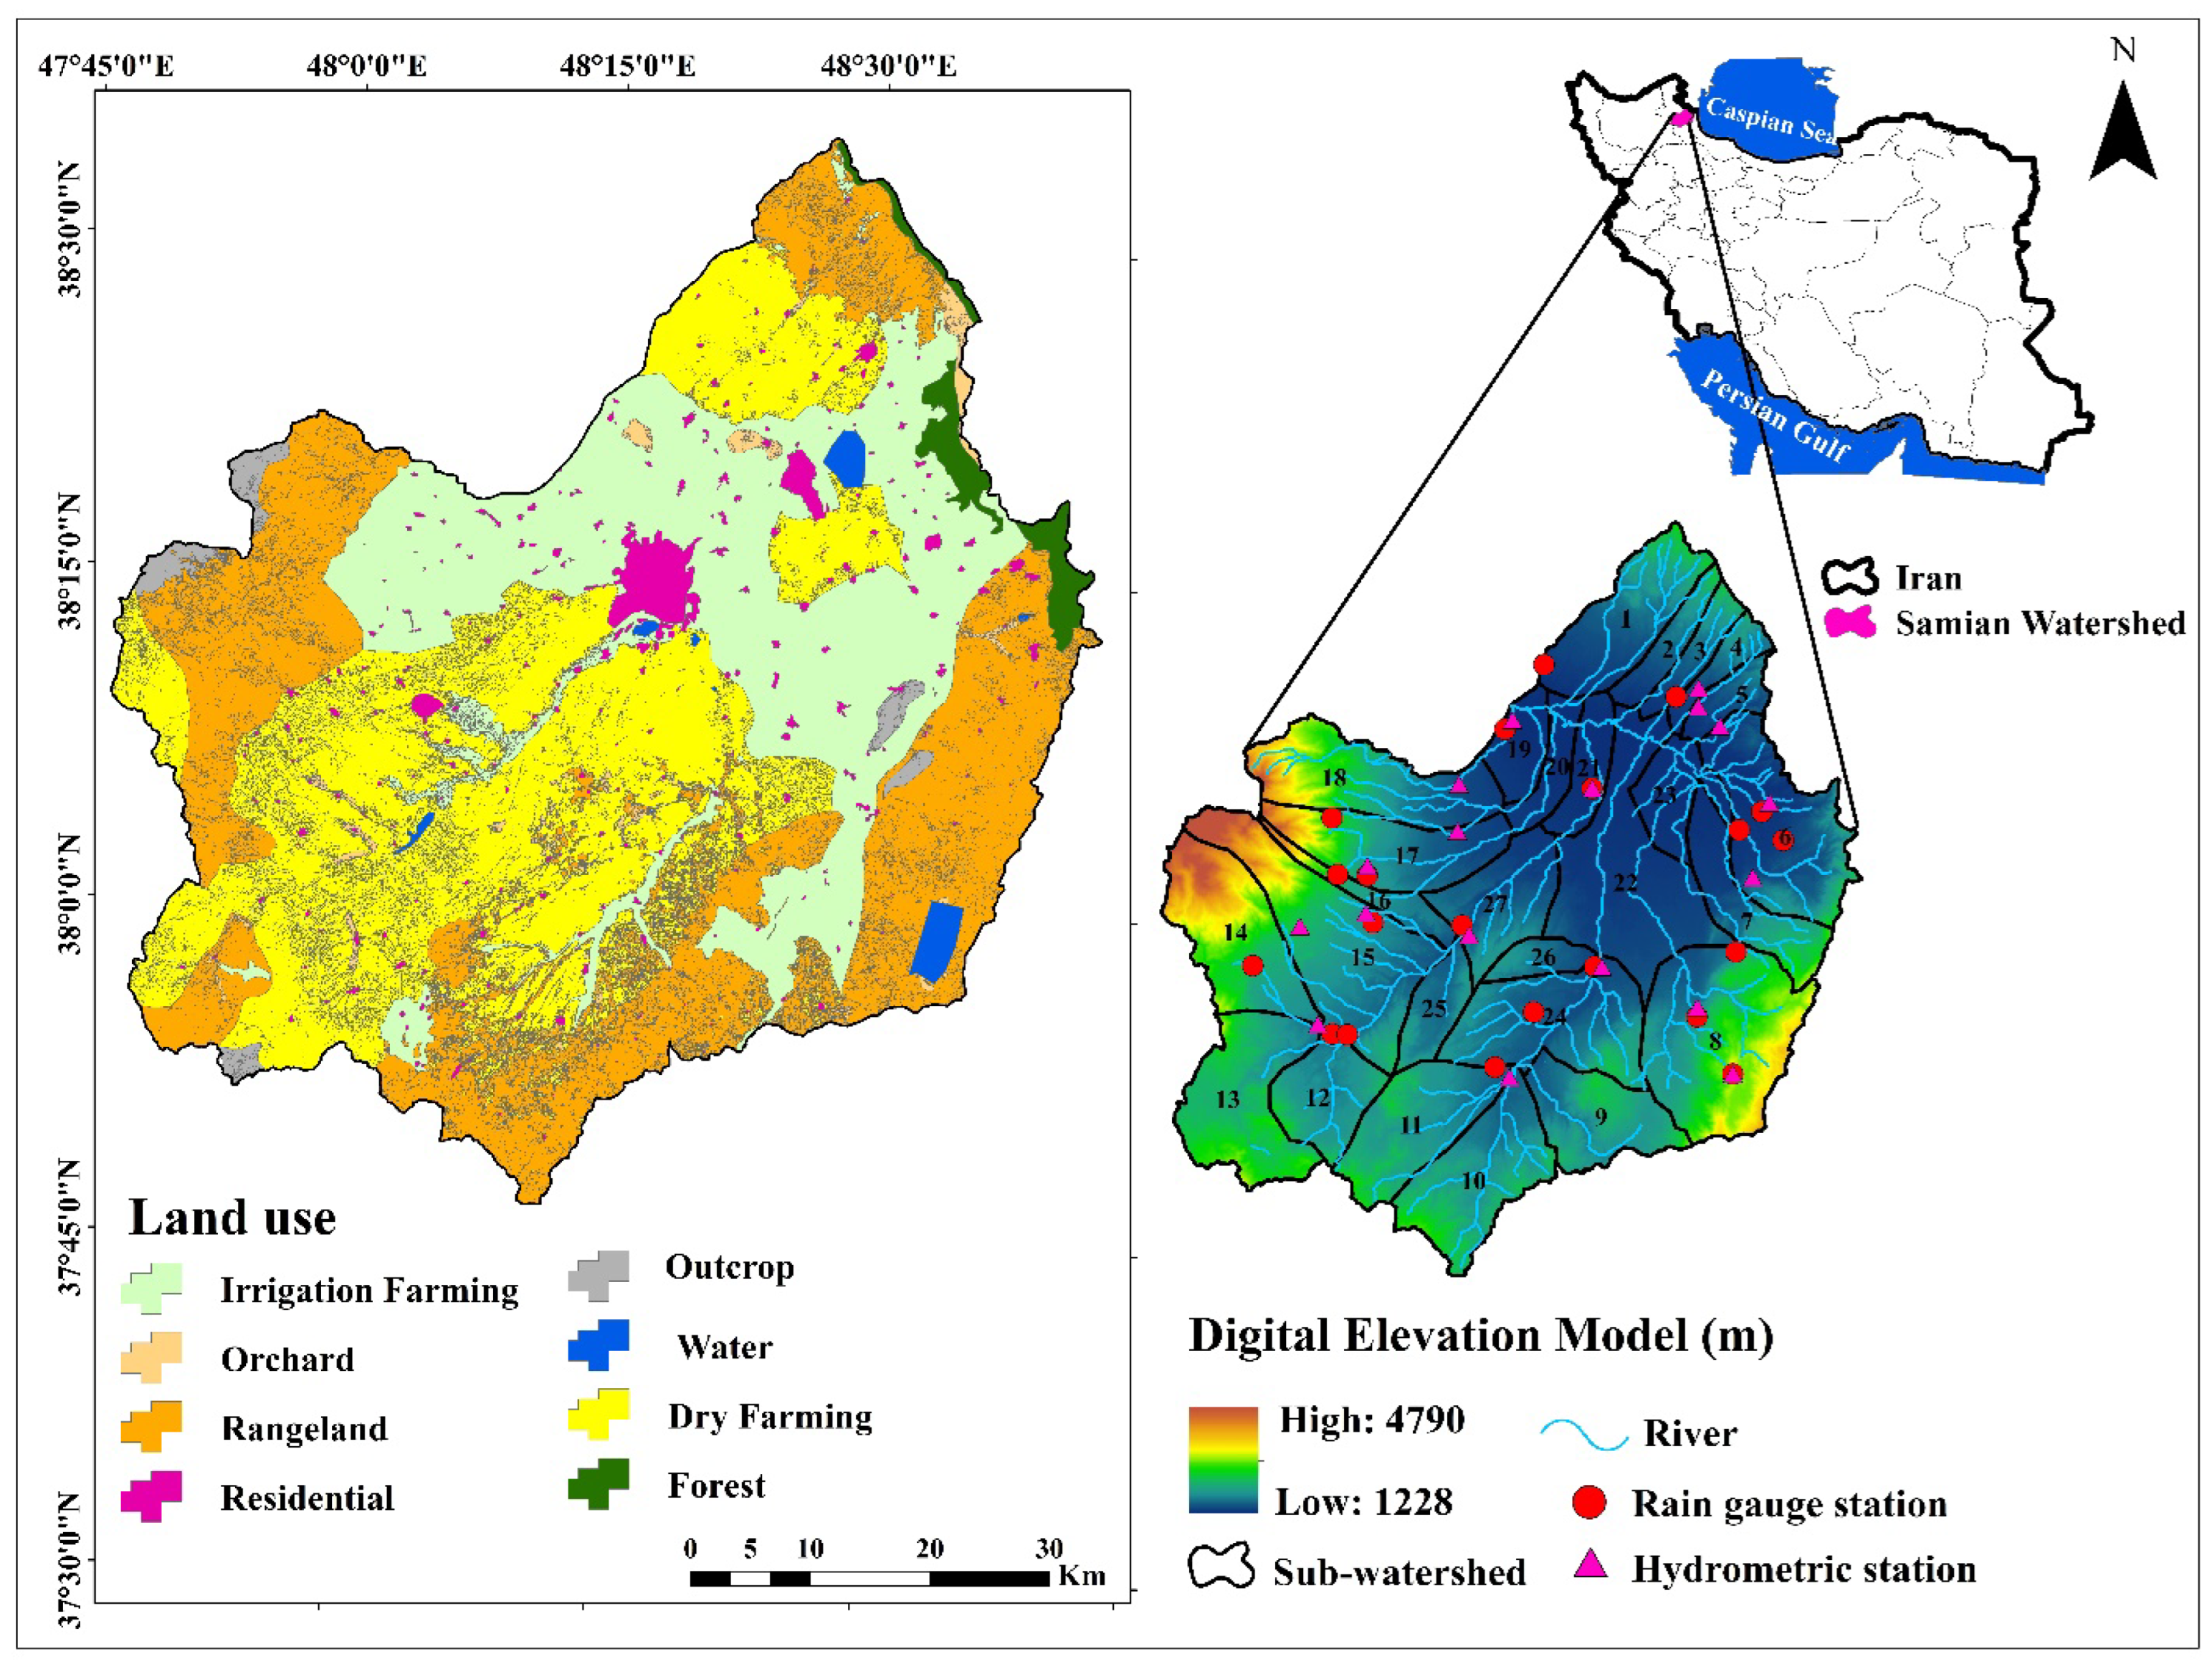
The Samian Watershed, located in Ardabil Province (Figure 2), was considered as a case study. The Samian Watershed with 27 sub-watersheds (Figure 2-right) has an area of 4235 km2 and is part of the Aras River Basin. The natural rangeland is limited to Germi City and Moghan Plain from the north, the Talesh mountain range from the east, the Bozqus mountain range from the south, and the Sabalan mountain range from the west. This region is between 48°0′ to 48°40′ east longitude and 37°30′ to 38°30′ north latitude. The elevation of the highest (Sablan Mountain peak) and the lowest (near the Samian Bridge) points of the studied region, respectively, are 4788 and 1200 m. The land use in this region (Figure 2-left) is mainly irrigated and rainfed agriculture, rangeland, forest, orchard, and residential areas. Among the types of land uses available, rainfed and irrigated agriculture occupy the largest watershed area [21].
Based on the statistical analysis (1989–2014), the mean rainfall and temperature are predicted to be 312.25 mm and 8.2 °C, respectively. The mean number of frost days is 130 days per year. The length of the main river of Qarasu is 285 km, and with an annual flow of 554 million m3, it is considered the most watery river in the province. According to the studies of Country Planning and Budget Organization [22], the Samian Watershed has several dams, including Neor, Kowsar, Saghezchi, Nowshehr, Qorichai Zamzam, Qorichai Ardabil, Yamchi, Pileh Sohran, Kamiabad, Muoghaddas Ardabili, and Eskishahr, which shows the effect of human actions on this watershed and its rivers.

2.2. Data Used

In the current research, various data were extracted from the Country Planning and Budget Organization (2018) [22] and the Statistics Center of Iran [23], and essential map layers were also provided from accessible GIS databases to estimate the sub-criteria, criteria, sub-indices, and RRI (Figure A1 and Table A1).
The map of maximum instantaneous flood discharge with a 50-year return period was collected from Azizi et al. [24]. To this end, based on the daily discharge statistics from 18 hydrometric stations and 21 rain gauge stations with a 46-year statistical period (the available data from 1969 to 2015), the annual maximum discharge values with a 50-year return period (i.e., maximum instantaneous flood discharge) were estimated using the Cumfreq software and ArcGIS 10.8. The Statistics Center of Iran [23] was used to determine the waste collection and disposal systems. The studies of the Country Planning and Budget Organization [22] were used to collect the sub-criterion of the watershed area occupied by a longitudinal barrier such as a dam and the length of the banks and the riverbed in its natural state.
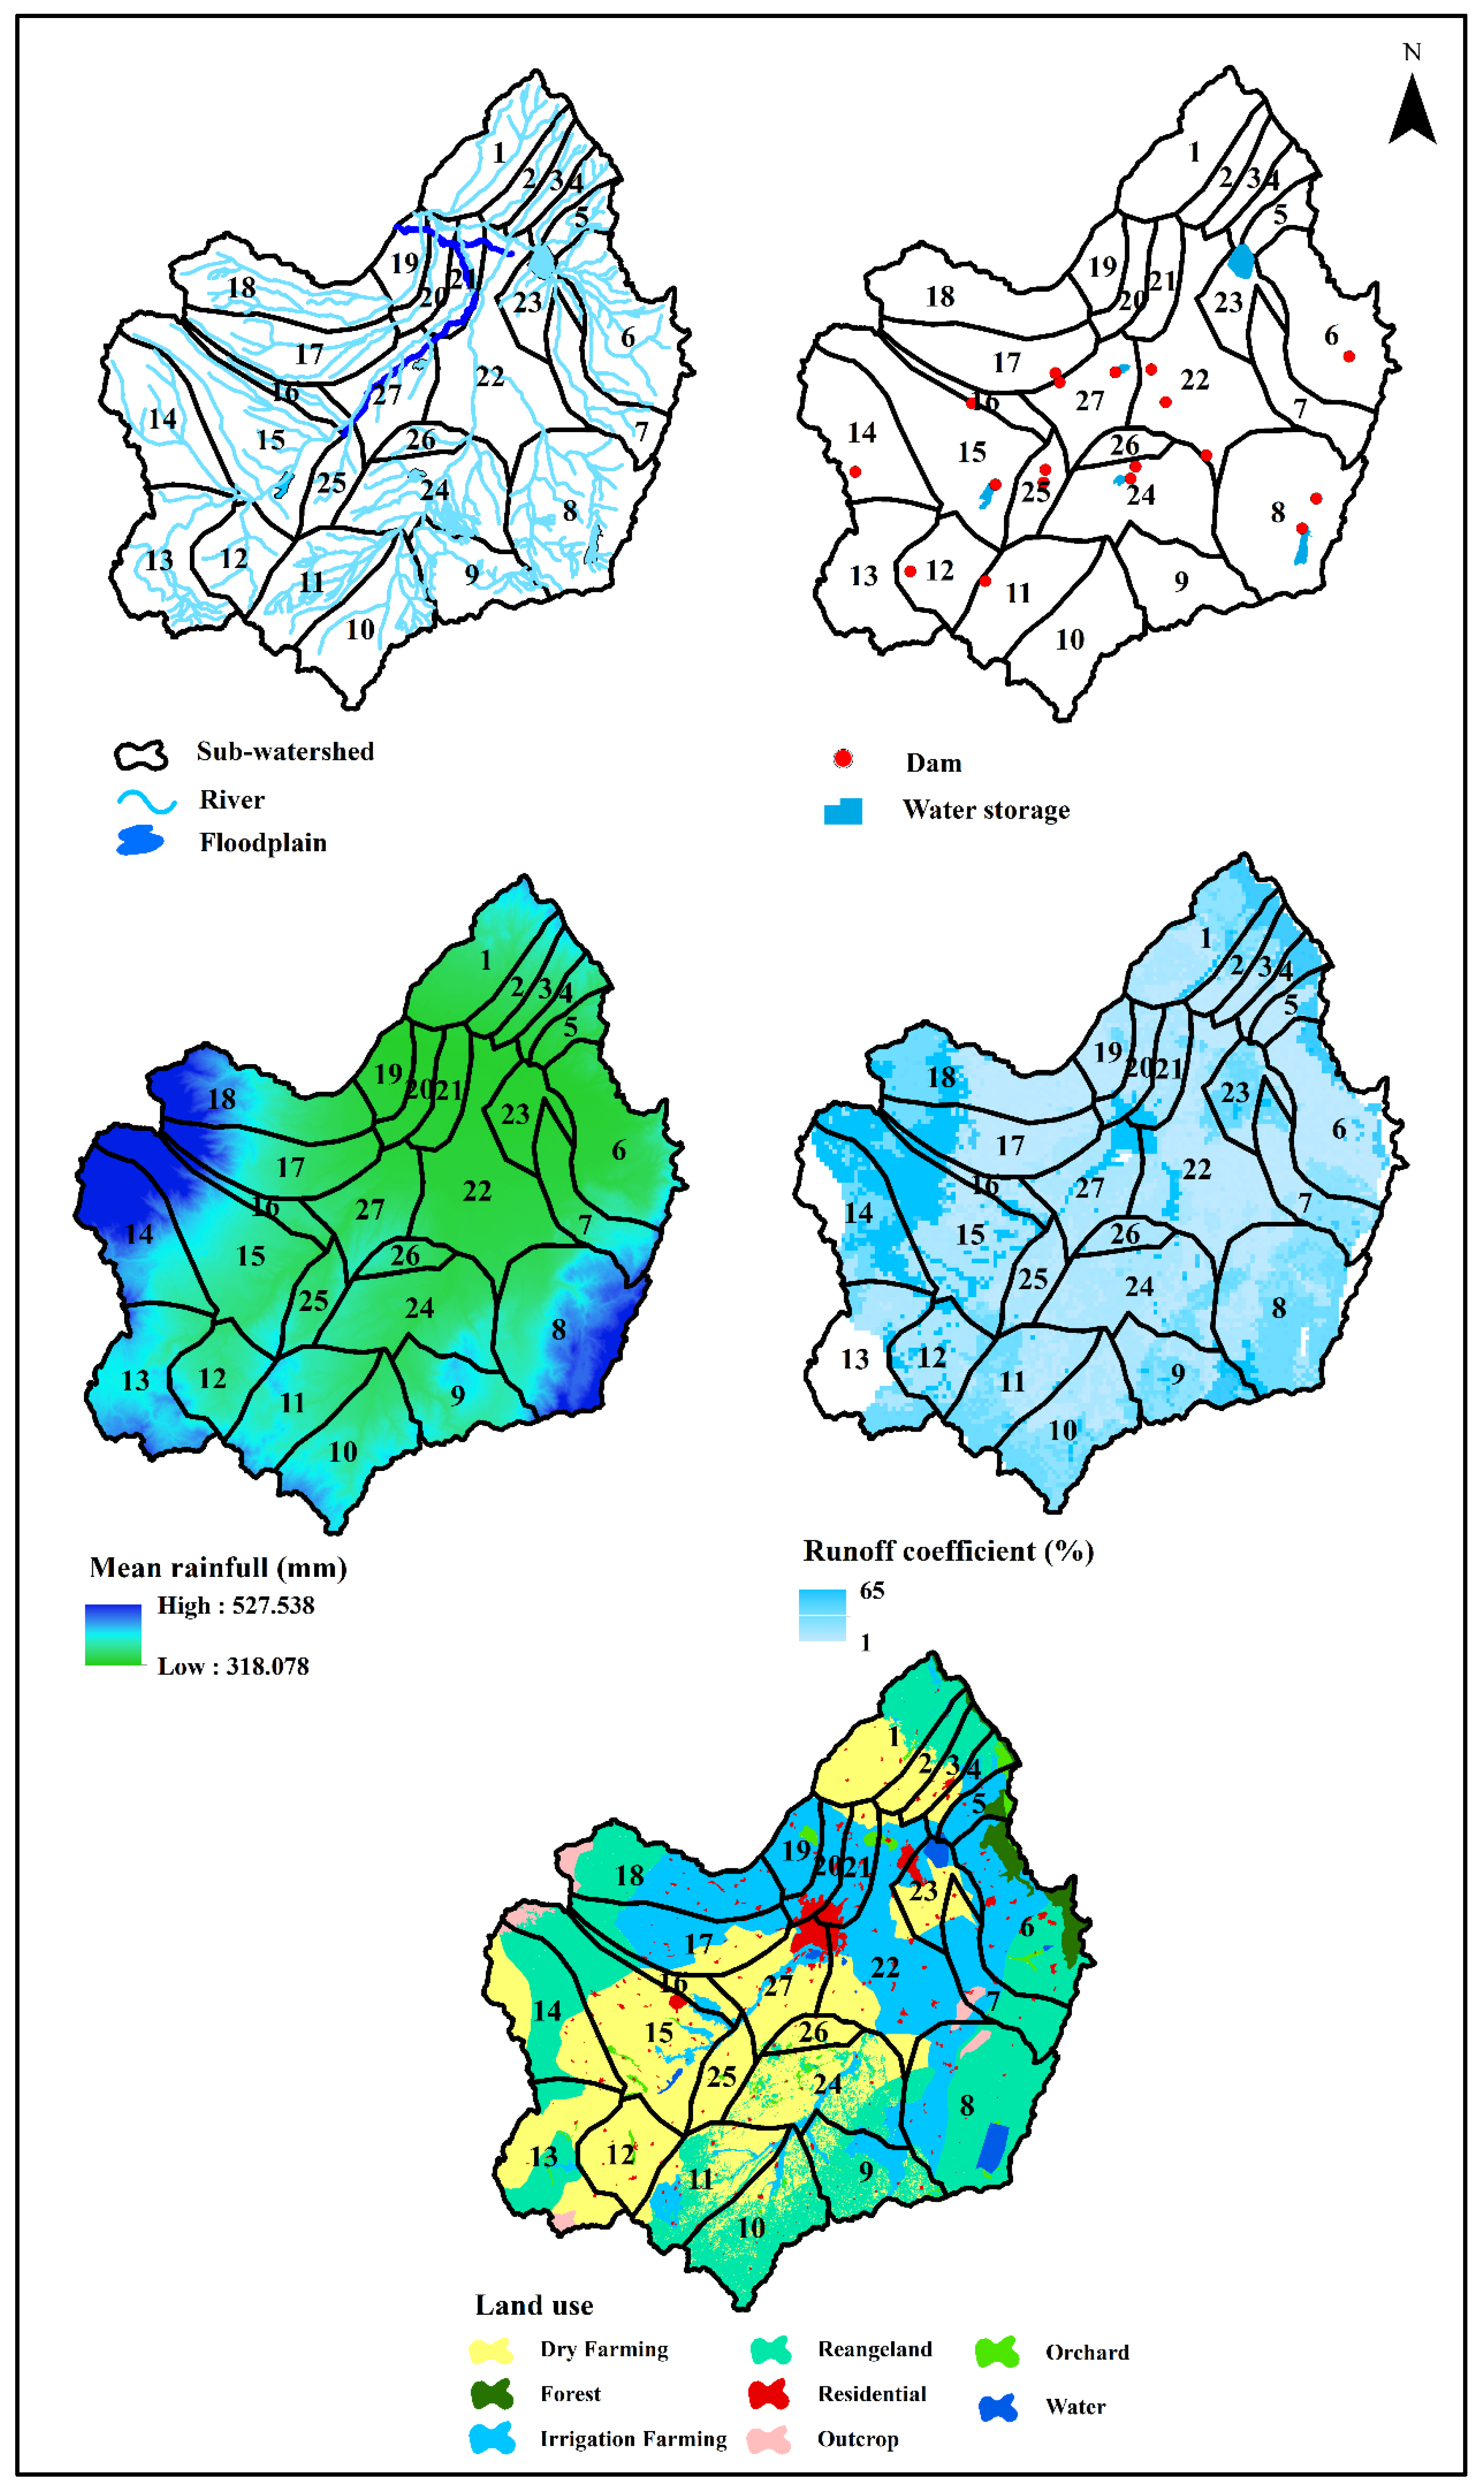
Available map layers that contain important information such as rainfall, floodplains, river shapefile, topography, location of dams, soil texture, and slope were collected (https://www.irimo.ir/eng/index.php, accessed on 29 April 2024; http://arrw.ir/?l=EN, accessed on 29 April 2024; https://en.ncc.gov.ir/, accessed on 6 May 2024, http://www.arrw.ir/st/419, accessed on 29 April 2024; https://ardebil.doe.ir, accessed on 6 May 2024; https://ardabil.frw.ir/, accessed on 6 May 2024, https://gisacademy.ir/shop/gis-data/ardabil-province-dataset/, accessed on 6 May 2024). In this way, the rainfall layer was used to determine the effective rainfall of each sub-watershed. The land use map was collected from Moradzadeh et al. [21]. It is extracted from Landsat OLI 8 (10 August 2021) images and a maximum likelihood classifier. The sub-criterion of the length of the riverbanks connected to the floodplain was estimated from the map of the floodplains of Iran. Using the land use map, the sub-criteria of the permeable area, riparian vegetation, and urban occupation of the riverbank were determined. In addition, the runoff coefficient was calculated following Liu’s approach [25].
The river shape file was used to calculate the sub-criterion of the total length of the riverbanks (right and left) and the total length of the river in its natural state. Through the topographical data, the amount of the area of each sub-watershed was also obtained. Calculations of sub-criteria of permeable area, the total area, the length of riverbanks connected to the floodplain, the total length of riverbanks (right and left), the area occupied by a dam, the length of banks and riverbed in a natural state, riparian vegetation, urban occupation of the riparian river, drainage area, mean rainfall, and runoff coefficient were conducted in the ArcGIS 10.8 environment. Finally, all data analyses and processes were made in Spreadsheet (Microsoft Excel 2019).

2.3. Sub-Indices Calculation

In the present study, four sub-indices including the general state of the watershed (GSW), connectivity (Con), riverbank conditions (RbC), and hydraulic risk reduction (HRR) were used to indicate the state of the river restoration and destruction. The sub-indices that make the RRI value aim to improve the quality of river systems and the interrelationship between natural and human-made settings [4,5].

2.3.1. The General State of the Watershed (GSW)

The GSW measures the changes in runoff production concerning initial status and water quality under the influence of poor sanitation. In this sub-index, the following three criteria are studied:

Permeability ( I P G S W )

The permeability criterion evaluates the amount of water penetration in the soil. It is obtained through the ratio between the porous surface of the studied area and its total area (Equation (1)). The low value of this criterion means greater deviation of the studied area from its natural behavior, an increase in runoff, and intensification of flooding [1,8,22]. The land use map was used to calculate this criterion. The land used for residential areas and outcrops was considered non-permeable.
I P G S W = A P A
I P G S W : permeability criterion; Ap: permeable area; A: total area.

Sanitation Conditions ( I S C G S W )

This criterion evaluates how to collect and purify wastewater and solid waste and is obtained through Equation (2). Establishing waste disposal systems decreases the point/nonpoint pollution flows from surface runoff and rivers [2,4,5].
I S C G S W = A a s _ t w c _ t A
I S C G S W : wastewater disposal condition criterion; Aas_twc_t: the area covering a sewage/solid waste disposal collection/treatment/disposal system; A: total area.

Urban Occupation of the Riverbanks ( I U O R b R b C )

This criterion is related to the degree of occupation of riverbanks by urban structures. The urban occupation of riverbanks indicates a disconnection of urban river sites, because they are often bordered by urban infrastructures [5].

2.3.2. Connectivity (Con)

Considering the river connectivity restoration in conservation programs is crucial to mitigate the adverse effects of fragmentation and enhance multiple ecosystem services [26,27]. The hydro-morphological situation of river systems should be analyzed by considering the connectivity of the main flow of the watershed with its three spatial dimensions of transversal, longitudinal, and vertical, as described as follows:

Transversal Connectivity ( I T C )

The transversal connectivity indicates the extension of the water flow that can overflow toward the floodplain. This type of connectivity restores riparian vegetation and serves as a refuge for the reproduction of many species of fish and other animals [28]. The transversal connectivity, in contrast to the longitudinal connectivity, is almost ignored. In the current research, the transversal connectivity of the river is calculated through Equation (3).
I T C = L R b _ c o n n e c t e d L R b
I T C : transversal connectivity criterion; LRb_connected: the length of the riverbanks linked to the floodplain (left and right) everywhere it is able to overflow; LRb: the total length of the riverbanks (left and right).

Longitudinal Connectivity ( I L C )

Longitudinal connectivity is related to the continuity of flow upstream and downstream (including water, sediment, organic matter, and nutrients). This criterion ensures the presence of a mosaic of interconnected riverine habitats. It outlines the presence of natural and anthropogenic barriers in the river as a critical factor for riverine ecosystems. The presence or absence of these barriers (dam/structures) can finally define the longitudinal connectivity as zero (worst state) and one (best state/natural conditions) [4,29]. Therefore, a ratio between the areas of the watershed bounded by a dam and the total watershed area is given as the following three prospects:
(1)
The interest watershed is upstream of the dam, as a result of which I L C equals one, because the dam does not affect the interest area;
(2)
The interest watershed coincides with the dam watershed, which leads to I L C being equal to zero, because it represents a wholly altered watershed;
(3)
The studied watershed area is larger than that demarcated by the dam and the consequence of the dam on the downstream reaches its minimum value by moving away from the upstream areas.
If there are many obstacles in the way of the water, only the closest one (concerning the desired watershed) is important. When the watershed includes barriers, Equations (4) and (5) can be used [4].
I L C = 1 , if   A interest watershed < A Barrier ( or   if   there   is   on   barrier )
I L C = 1 A Barrier A interest watershed , if   A interest watershed A Barrier
where I L C : longitudinal connectivity criteria; Ainterest_watershed: the area of the desired watershed; ABarrier: an area of a watershed occupied by a longitudinal barrier (e.g., dam).

Vertical Connectivity ( I V C )

Vertical connectivity indicates the extent of exchanges of water, nutrients, and organisms through the riverbed that is possible if bed materials and infiltration conditions are maintained [5,30]. I V C is calculated by establishing the relationship between the length of the coasts and the riverbed in the natural state and the total length of the coasts and the riverbed (to maintain stability) (Equation (6)).
I V C = L R b n a t u r a l L R
I V C : vertical connectivity criterion; LRb_natural: length of riverbanks (left and right) and riverbed in the natural state; LR: total length of both the riverbank and the riverbed. All rivers that exist in each sub-watershed were considered for this calculation. The parts of rivers that were not affected by urban and agricultural land uses were considered for calculation of the natural riverbank and riverbed.

2.3.3. Riverbank Conditions (RbC)

This sub-index considers two criteria of the presence of vegetation along the riverbanks and the riverbank’s occupation by structures (e.g., dikes) [4,5].

Riparian Vegetation ( I R V R b C )

The good hydro-morphological position of a river is influenced by the existence of riparian vegetation alongside its banks, which is imperative for maintaining water quality and riverbank steadiness and supporting aquatic and terrestrial fauna [27]. It acts as a surface runoff filter. In this case, riverbanks have sufficient vegetation if the width of the river connected to them is equal to or greater than the width determined in the environmental legal framework. Riparian vegetation is calculated as the total length of vegetation ranges on the left and right riverbanks divided by the total length of both riverbanks (Equation (7)) [4].
I R V R b c = L R V L R b
I R V R b C : riparian vegetation criterion; LRV: the length of the riverbank with vegetation (left and right); LRb: the entire length of the riverbank (left and right) in each sub-watershed.

Urban Occupation of the Riverbanks ( I U O R b R b C )

The presence of buildings and other structures along the riverbanks restricts the river’s flow, increases the risk of flooding, and confines local excesses. Contingent on the flow velocity, these structures can even fail, leading to new disasters from debris transport or temporary river blockage. In addition, there is a risk of contamination dissemination from these structures, such as sewage and solid waste [4]. The urban occupation of the riverbank measures the length of the banks free from the structures with the total length of the riverbanks (Equation (8)).
I U O R b R b c = L U O R b L R b
I U O R b R b C : urban occupation of the riverbanks; LUORb: length of urban occupation of riverbanks (left and right); and LRb: the total length of the riverbanks (left and right).

2.3.4. Hydraulic Risk Reduction (HRR)

This sub-index proposes to evaluate the center of gravity of flooding in a watershed caused by any source, including partial drainage failure and excess surface runoff [5,7]. It assesses the flooding degree using the maximum annual instantaneous discharge compared to the discharge of effective rainfall. Its values near zero indicate that the desired watershed is in a critical condition (Equation (9)).
I H R R H R R = 1 D m a x D e f f R
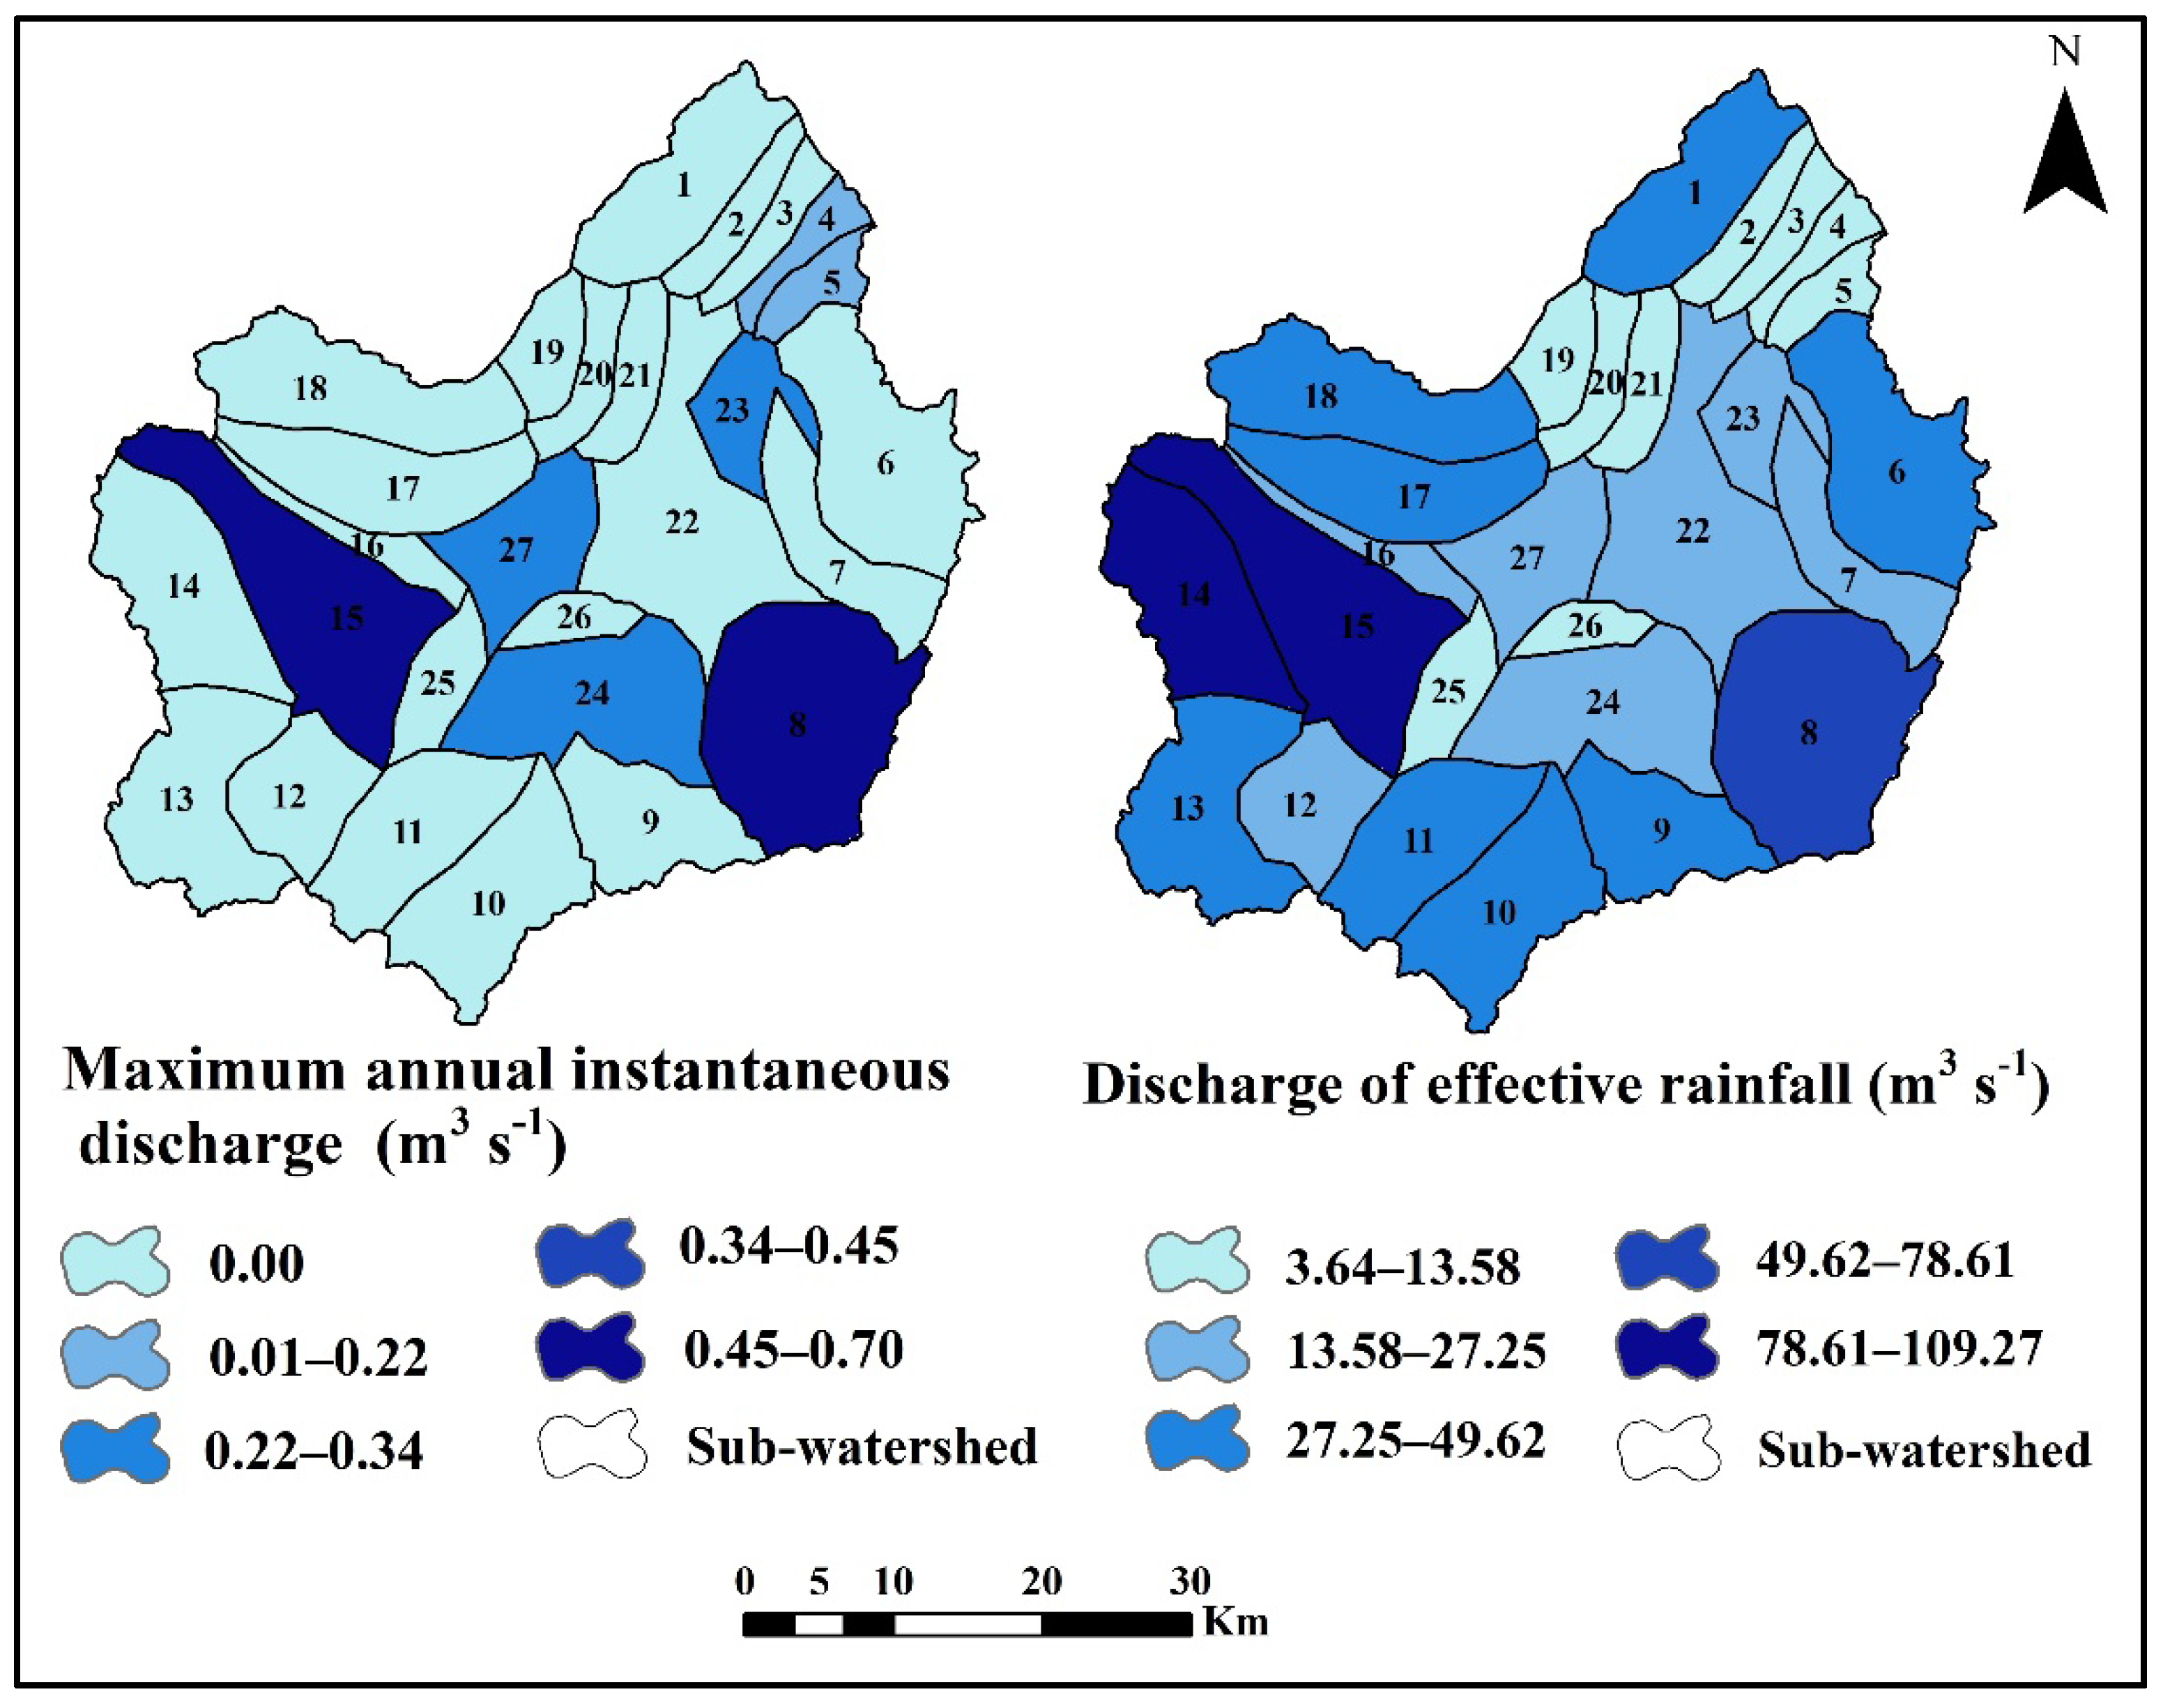
I H R R H R R : hydraulic risk reduction sub-index; Dmax: maximum annual instantaneous discharge (m3 s−1); DeffR: the discharge induced from effective rainfall. The effective rainfall is calculated through the mean annual rainfall multiplied by the area of the watershed and the runoff coefficient of each area. Then, its annual temporal scale (m3 y−1) was converted to a second temporal scale (m3 s−1).

2.4. River Restoration Index (RRI)

The RRI in the preliminary stage uses a weighted sum (Equation (10)) that balances the effects of each sub-index (the general state of the watershed (GSW), connectivity (Con), riverbank conditions (RbC), and hydraulic risk reduction (HRR)) to consider their contribution individually in the progress of the river restoration process [4,5]. This definition indirectly shows the main concerns of the river restoration approach.
R R I = G S W × W G S W + C × W C + R b C × W R b C + H R R × W H R R
where RRI: river restoration index, which is obtained from zero to one, in which critical areas refer to lower values (zero) of the index, and preserved areas refer to higher values (one). Wn: the weight assigned to the sub-indices.
Each sub-index is calculated by the weighted sum of criteria, as presented in Equations (11)–(14). Weighted sum considers the relationship between criteria/sub-indices, reducing the weight biases generated by individual criteria/sub-indices.
G S W = t = 1 n I i G S W × W i G S W
C o n = t = 1 n I j C o n × W j C o n
R b C = t = 1 n I k R b C × W k R b C
H R R = t = 1 n I I H R R × W I H R R
I i G S W : the i-th criterion of GSW; I j i C o n : the j-th criterion of Con; I k R b C : the k-th criterion of RbC, and I I H R R : the I-th criterion of HRR. In addition, w i G S W , w j C o n , w k R b C , and w I H R R are the weights associated with criteria used for the calculation of GSW, Con, RbC, and HRR that must comply with the following constraints (Equations (15)–(18)):
i ; i i i = 1 n w i G S W = 1
i ; i i i = 1 n w j c = 1
i ; i i i = 1 n w k R b C = 1
i ; i i i = 1 n w l H R R = 1
All criteria/sub-indices range from zero to one. It specifies the possibility of unifying units/scales and making logical comparisons between criteria/sub-indices. Higher values of all indices indicate a better hydro-morphological condition [4].

2.5. Weight Determination

The weights of criteria and sub-indices in MCDM problems are essential elements that can significantly affect the results. There are several methods for determining weighting, including objective, subjective, and combined. In this study, a new method called MEREC was used to determine the weight of criteria and sub-indices. The MEREC weighting method was presented by Keshavarz-Ghorabaee et al. [31] and uses the effect of removing each criterion on the performance of the options to determine the weights of the criteria. Most other weighting methods examine alternative performance variance associated with criteria to assign criteria weights [32].
-
Step 1: Decision matrix building
In the first step, a decision matrix is created that shows the value of each option (i.e., sub-watershed) for each criterion. The features of this matrix are symbolized by xij and should be higher than zero (xij > 0). The created decision matrix with n options (No. = 27) and m criteria (No. = variable for each sub-index) is as follows:
X i j = X 11 X 12 X 21 X 22 X 1 j X 1 m X 2 j X 2 m X i 1 X i 2 X n 1 X n 2 X i j X i m X n j X n m
-
Step 2: Normalization
Normalization is used in almost all decision-making methods. In this technique, linear normalization was used to make the elements of the decision matrix dimensionless. The elements of the normalized matrix are denoted by nij. If B is the set of useful criteria and H is the set of non-useful criteria, Equation (20) can be used for normalization.
n i j x = m i n x k j k x i j x i j m a x x k j k i f   j B i f   j H
-
Step 3: Calculating the overall performance of the options (Si)
In this section, a logarithmic measure with equal criteria weight is applied to obtain the overall performance of the options at this stage. This measurement is based on a non-linear function given in Equation (21). According to the normal values obtained from the previous step, we can ensure that smaller values of nij lead to higher performance (Si).
S i = ln 1 + 1 m j l n n i j x
-
Step 4: Calculating the performance of options by removing the effects of criteria (S′)
In this step, by removing each of the criteria, the performance of the options is calculated. In this step, we use the same logarithmic criteria as the previous step. The difference between this step and the previous step is that the performance of the options is calculated based on the exclusion of each criterion separately. Equation (22) is used for the calculations of this step.
S i j = ln 1 + 1 m k , k j l n n i k x
-
Step 5: Calculating the sum of absolute deviations (E)
In this step, the effect of removing criteria j is calculated based on the values obtained from the third and fourth steps. Ej shows the effect of removing criteria j (Equation (23)).
E j = i S i j S i
-
Step 6: Calculating the final weights (W)
In this step, the final weights of the criteria are determined. The weight of each criterion is calculated using the elimination effects of the fifth step. In the following, wj stands for the weight of criteria j (Equation (24)).
W j = E j k E k

2.6. Sub-Watersheds Ranking

The MCDM framework of ORESTE uses preference ranking and Besson mean to select the optimal option. This method was first proposed by Marc Roubens [33]. ORESTE is a simple outranking method that determines the superiority of options over each alternative according to each sub-index [34]. The ORESTE method provides a tool to fully rank the decision options and express the conflicts between the options. The most important feature of this method compared to other methods is its emphasis on rank instead of values [34,35]. Unlike other methods, in ORESTE, the order of importance of the sub-indices is extracted.
For the ORESTE ranking, the ranks of Besson mean are needed. So that, the relative importance of each sub-index or sub-watershed is not given with its weight; instead, it is presented by creating a preferential structure on the set of sub-indices (which are defined as weak order) and sub-watersheds in terms of sub-indices. This preference structure is expressed as complete and transitive relationships and a set of relationships of I (i.e., indifference between sub-indices and sub-watersheds for each sub-index) and P (i.e., preference). After forming two types of preference structures, sub-indices and sub-watersheds are assigned numbers from one to k number of sub-indices or one to m number of sub-watersheds. Then, the mean was computed from the most and the least assigned numbers (with an I relationship). The abbreviation of rank obtained for sub-indices is indicated by rk, and the abbreviation of rank obtained for each sub-watershed in terms of each sub-index is shown by rk(m).
Accordingly, the ORESTE method has three basic steps for ranking as follows:
-
Step 1: Projection of distances between sub-watersheds (d (0, mk))
Projection in the ORESTE method is based on a hypothetical matrix (i.e., the position matrix) [35]. In each column of this matrix based on the sub-indices, the decision options (i.e., sub-watersheds) are sorted from the best to worst, and the columns are also arranged based on the rank of the sub-indices [36].
By projecting the resulting matrix members on its main diameter, better and worse positions are, respectively, projected on the left and right sides. Then, a zero origin is considered at the end left of this diameter and all the created projections are determined by d (0, mk) [35,36,37]. This explanation could be formulated as given below:
if   a P k b   then   d ( 0 , a k ) < d ( o , b k ) if   r 1 a = r 2 b   and   1 P 2   then   d 0 , a 1 < d ( o , b 2 )
The distance projection is performed in three ways: direct linear, indirect linear, and non-linear.
In the direct linear projection, to determine the distance d (0, mk) (distance projection), Equation (26) is used:
d o , m k = 1 2 [ r k + r k ( m ) ]
rk (rank obtained for sub-indices) and rk(m) (rank obtained for each sub-watershed in terms of each sub-index).
In the indirect linear projection, the distances of the projections from the origin point are calculated as in Equation (27), in which a is added as a coefficient.
d o , m k = a r k + 1 a r k m
In non-linear projection, Equation (28) determines the distance of projections from the origin.
d o , m k = r k 2 2 + r k ( m ) 2
To achieve more general conditions, Equation (28) is changed to form Equation (29). Finally, if the normalized weights (a) and (1 − a) are added, Equation (30) is obtained.
d o , m k = r k R R + r k ( m ) R
d o , m k = a . r k R R + 1 a . r k ( m ) R
Considering some values of R, the projection distance, d, is defined as follows:
  • R = 1 d″: weighted arithmetic mean;
  • R = −1 d″: geometric mean;
  • R = 2 d″: mean square;
  • R = −∞ d″: min (r_k, r_k (m));
  • R = +∞ d″: max (r_k, r_k (m)).
-
Step 2: Overall ranking of distances, rk(m)
The overall ranking is carried out by determining the distance of the projections of each position matrix member from the origin using the above methods. In general, choosing any of the above methods or different R values for projection and determination of the distances, d (0, mk), depended on the influence of their position relative to each other. The distances are ranked using the Besson mean [35,36,37]. The result of this ranking is equal to assigning the rank obtained by the Besson method to the distances (d (0, mk)) in the form of rk (m). The obtained ranks are called overall ranks, which are located in the following range (Equation (31)):
1 R m k m . k
where m is the number of sub-watersheds, k is the number of sub-indices, and R (mk) is the absolute ranks.
-
Step 3: Aggregation
After calculating and determining the overall ranks, these ranks are summed in each sub-index for all sub-watersheds (Equation (32)). Therefore, an incremental ordinal structure is defined in terms of R(m) (Equations (33) and (34)).
R m k = k 1 k R ( m k )
if   R a < R ( b )   then   a   P   b
if   R a = R ( b )   then   a   I   b
Sub-watersheds with smaller R(mk) are more suitable and are given a better rank [35,36]. The better option had a lower sum of absolute ranks in all sub-indices than other options.

3. Results

3.1. The General State of the Watershed (GSW)

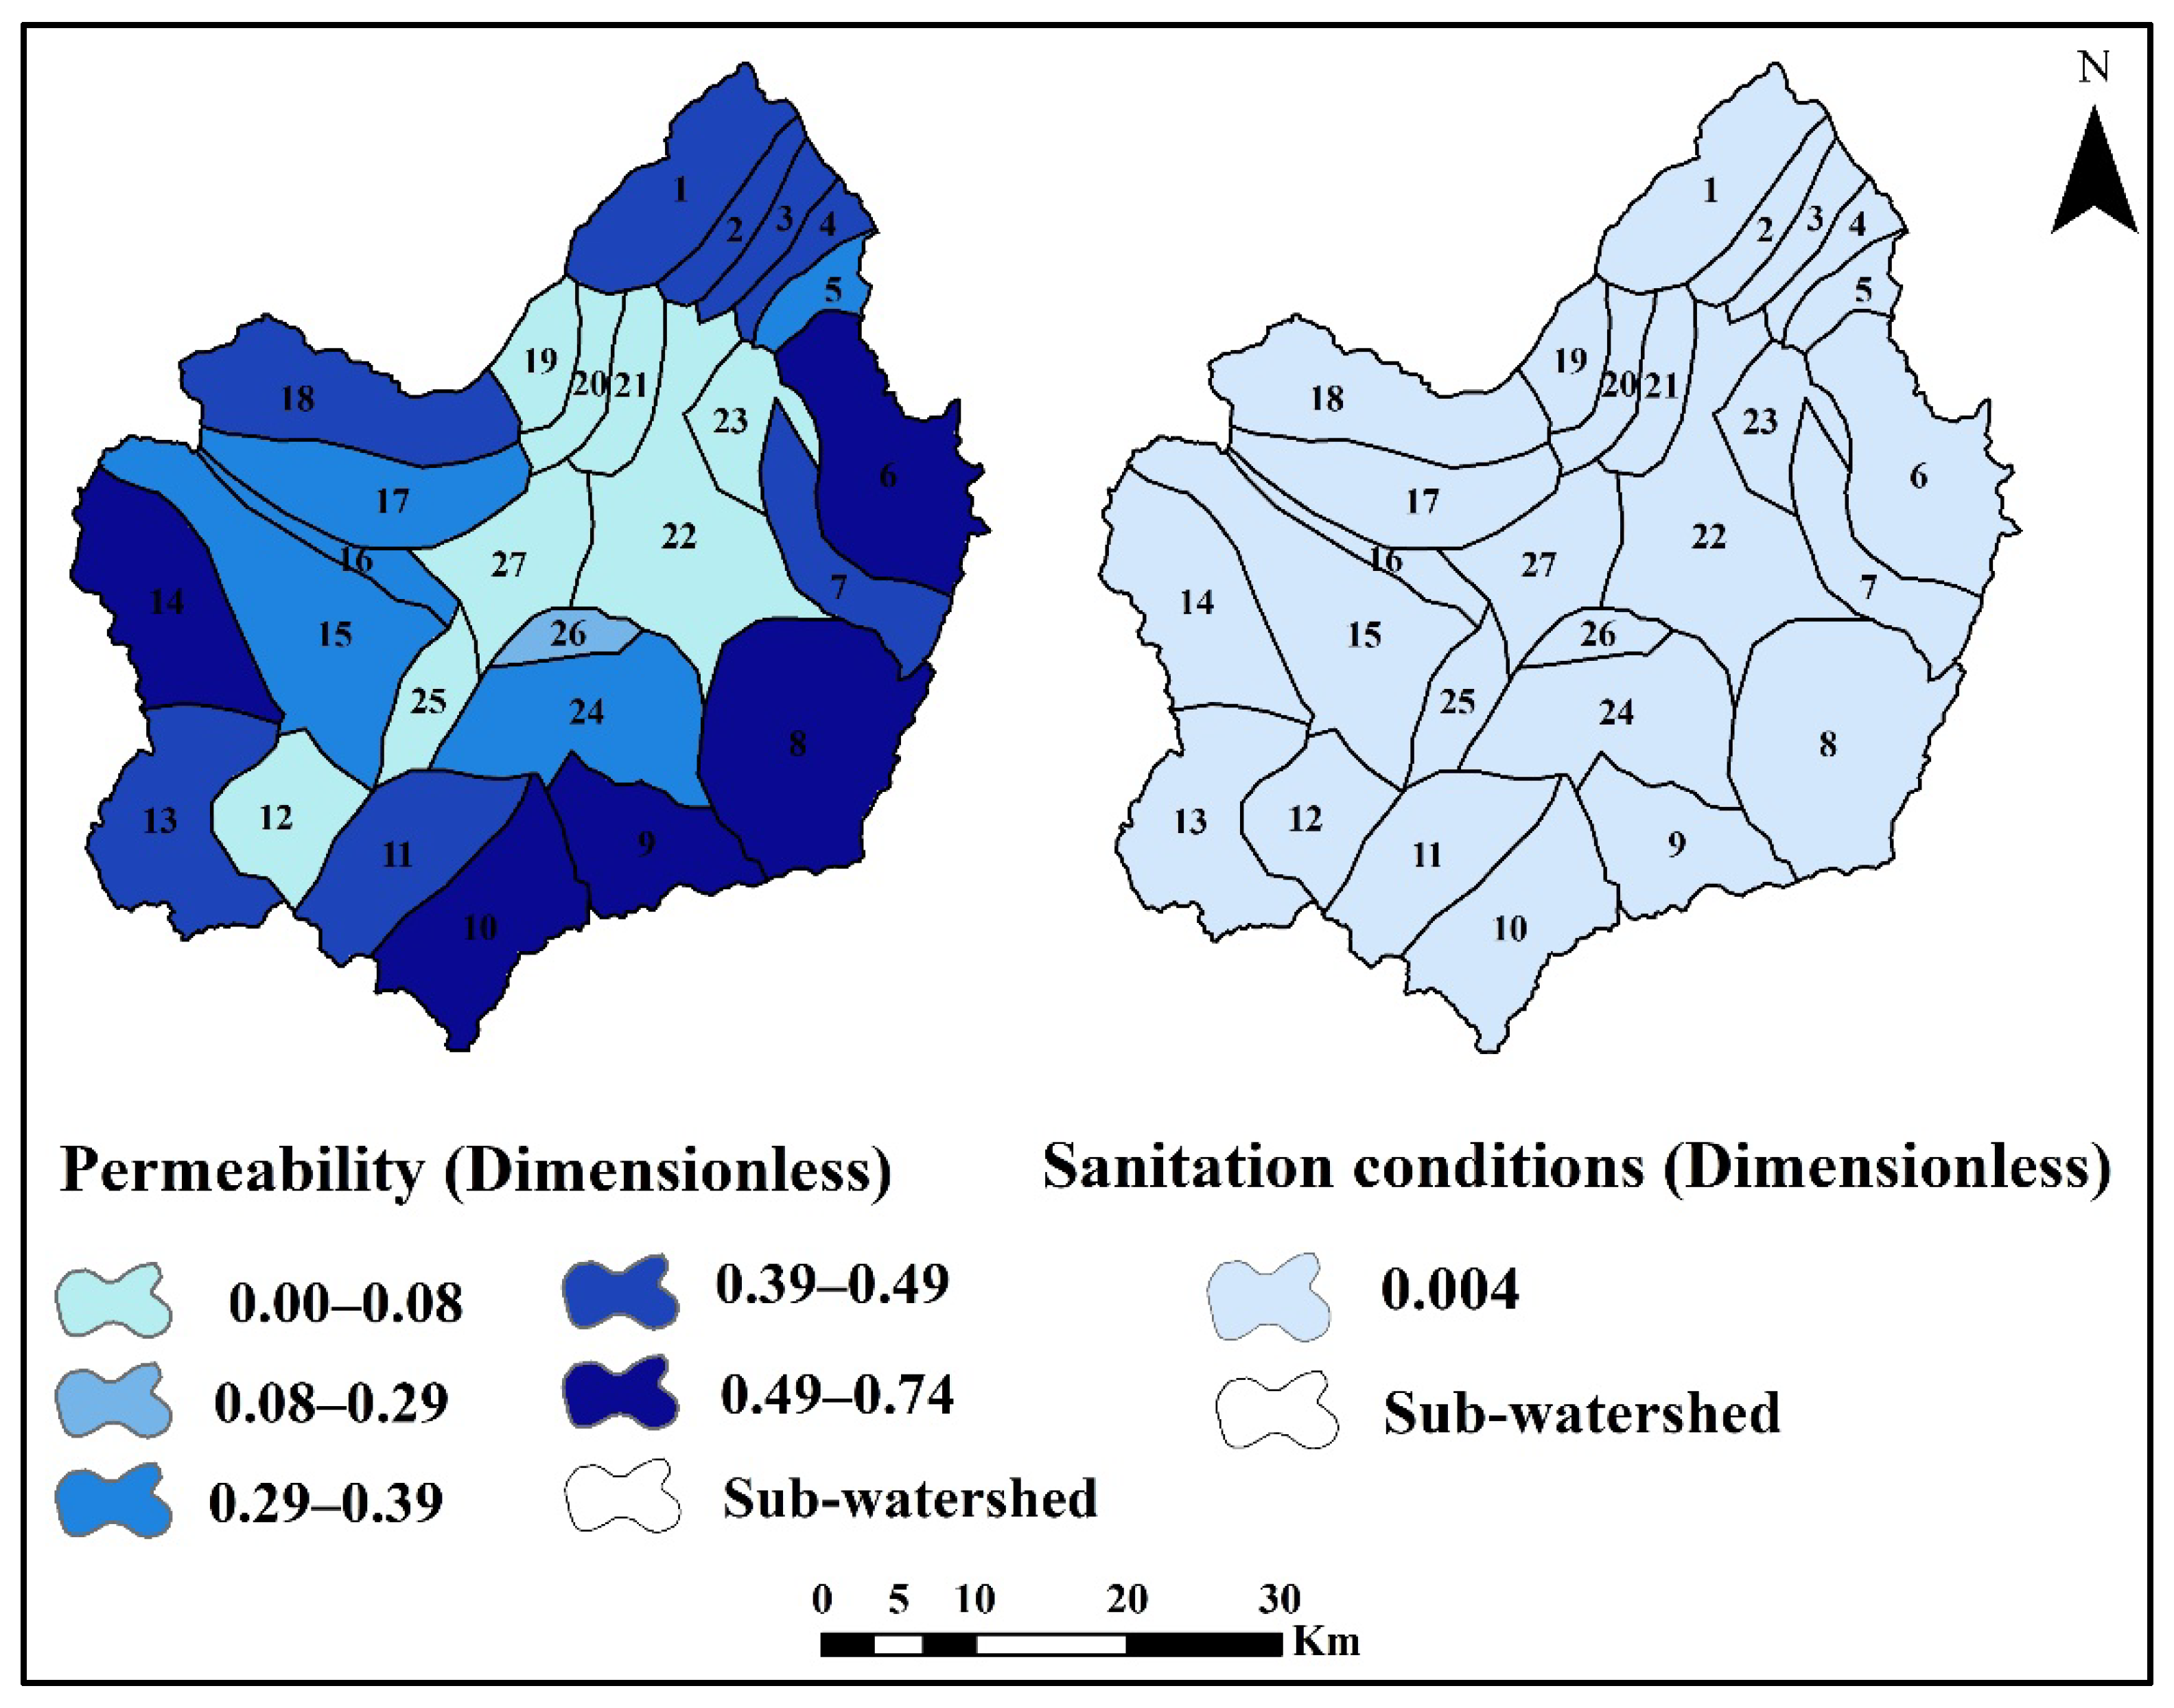
The results of two sub-criteria of the permeable area and waste disposal system are given in Figure 3 and Table A2. Our findings indicated that sub-watershed 8, due to its large area (229.46 km2), had a higher permeability area than other sub-watersheds. In addition, sub-watersheds 20 and 23 do not have a permeable area; it can be concluded that the surface of these sub-watersheds is impervious. In general, according to Figure 3 (left), it can be said that sub-watersheds 6, 8, 9, 10, and 14 have more permeable areas than other sub-watersheds and are in a favorable condition.
It was also found that the most extensive waste disposal system in sub-watershed 8 had an area of 1.68 km2. The minimum waste disposal system was obtained in sub-watershed 26, which had an area of about 0.21 km2 (Table A2). Nevertheless, by considering the two sub-criteria of the area allocated from the sub-watershed to the waste disposal system and the total area of each sub-watershed, the sanitation conditions in all sub-watersheds were obtained by assigning the exact value of 0.005 (Figure 3-right).

3.2. Connectivity (Con)

Figure 4 and Table A3 show the results of the sub-criteria and the criteria used to calculate the connectivity (Con). The spatial variability results of transversal connectivity showed that the river is connected to the floodplain only in watersheds 16, 19, 20, 21, 22, 25, and 27 (Table A3). Other sub-watersheds of the river are not connected to the floodplain at all. The results of the sub-criteria of the total length of the river in the studied sub-watersheds showed that in sub-watershed 8, the river has a maximum length of 166,965.71 m. Nevertheless, by referring to Table A3 and Figure 4, it can be seen that in sub-watersheds 25 and 20, the river has the most extensive transversal connectivity with a width of 9.214 and 8.046 m, respectively.
The results of the longitudinal connectivity showed that watersheds 8 and 26 have the largest and smallest areas, with 348.10 and 44.29 km2, respectively. In addition, the variable estimation of the dam reservoir volume showed that dam construction was performed only in sub-watersheds 6, 8, 11, 12, 14, 15, 17, 22, 24, 25, and 27. The results of calculating the longitudinal connectivity also showed that in its natural state, sub-watershed 8 maintained the length of the riverbanks (left and right) and its natural bed; despite obstacles such as dams, compared to other watersheds, it has the most extended length of riverbanks and riverbed in a natural state. Also, vertical connectivity is at its best in most sub-watersheds (Table A3 and Figure 4).

3.3. Riverbank Conditions (RbC)

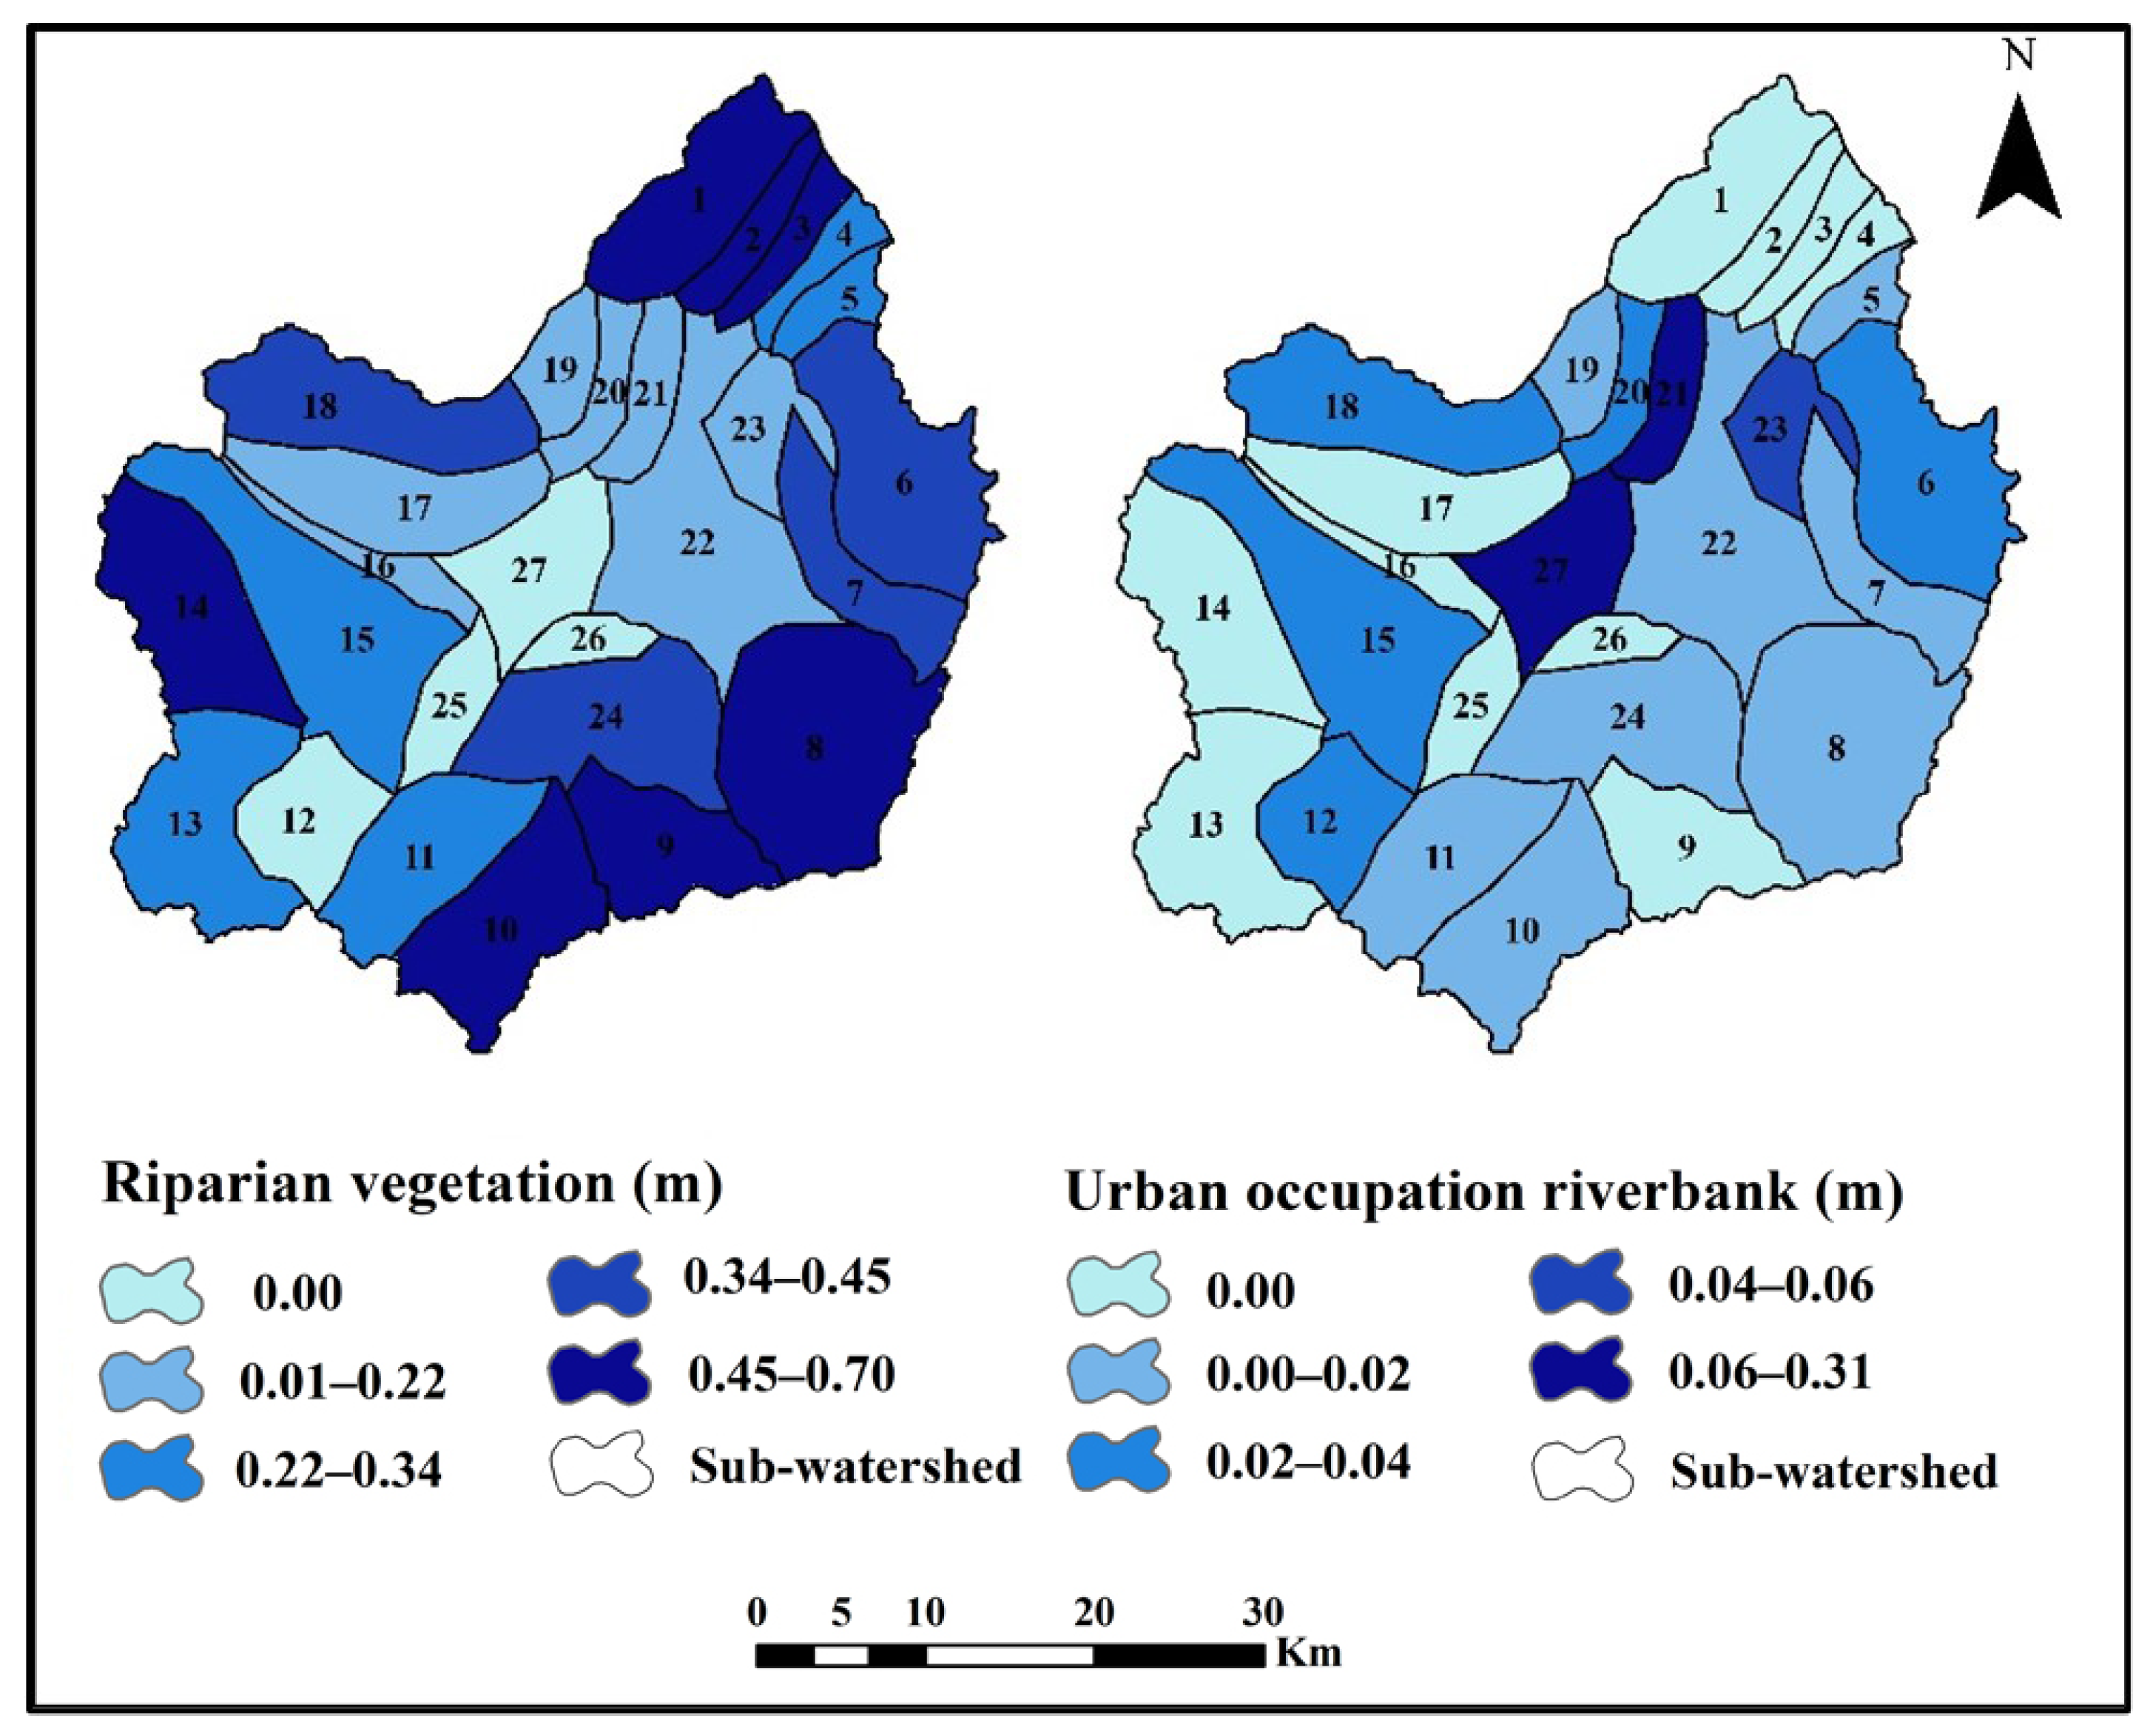
It was found that the total length of riparian vegetation along riverbanks with a value of 90,105.937 m is related to sub-watershed 8. While the riverbanks of sub-watersheds 12, 19, 20, 21, 22, 23, 25, 26, and 27 lack vegetation (Figure 5 and Table A4). Considering the total length of riparian vegetation along riverbanks and the total length of riverbanks, the results showed that riparian vegetation in sub-watershed 10 has the maximum value (0.6977 m) and in sub-watershed 12 has the minimum value (0.00 m). In addition, the spatial zoning of riparian vegetation shows that in sub-watersheds 3, 8, 9, 10, and 14, riparian vegetation is better (Figure 5). It can be concluded that the riverbanks with the longest length have the maximum riparian vegetation. In other words, the length of riverbanks has a direct and positive relationship with the total length of riparian vegetation.
On the other hand, the results of the sub-criteria of urban occupation showed that the length of urban occupation has the maximum value (12,288.4662 m) in sub-watershed 27. While the riverbanks in sub-watersheds 2, 3, 16, 25, and 26 are not occupied by residential areas (Table A4). Considering the length of urban occupation of the banks and the total length of the riverbanks, in most of the Samian sub-watersheds, the riverbanks are not occupied by the city, and only in sub-watersheds 21 and 27, the riverbanks are more occupied (Figure 5).

3.4. Hydraulic Risk Reduction (HRR)

The results of HRR showed that sub-watersheds 8, 22, and 15 had the maximum annual instantaneous discharge (9.16 < Dmax < 8.57 m3 s−1) compared to other sub-watersheds (Table A5 and Figure 6 (left)). The effect of three sub-criteria of watershed area, effective rainfall, and runoff coefficient on the discharge of effective rainfall showed sub-watersheds 8, 14, and 15 had the highest discharge of effective rainfall (78.46 < DeffR < 109.27 m3 s−1; Table A5 and Figure 6 (right)).

3.5. Criteria and Sub-Indices Weighting

The weighting results showed that the permeability criterion with a value of 0.88 had a higher impact than the sanitation condition with a value of 0.12 on the GSW characterization. The transversal connectivity with a weight of 0.46 and riparian vegetation with a weight of 0.54, respectively, had a more significant impact on the Con and RbC (Table 1). In addition, the GSW sub-index with the value of 0.36 had a higher weight than other criteria, which indicated that the quality and quantity of water in the hydro-morphological part of the studied watershed is in a favorable condition. On the other hand, the Con and HRR sub-indices had the lowest (0.16) effect on the RRI.

3.6. Sub-Watersheds Zoning and Ranking Based on the RRI and Its Sub-Indices

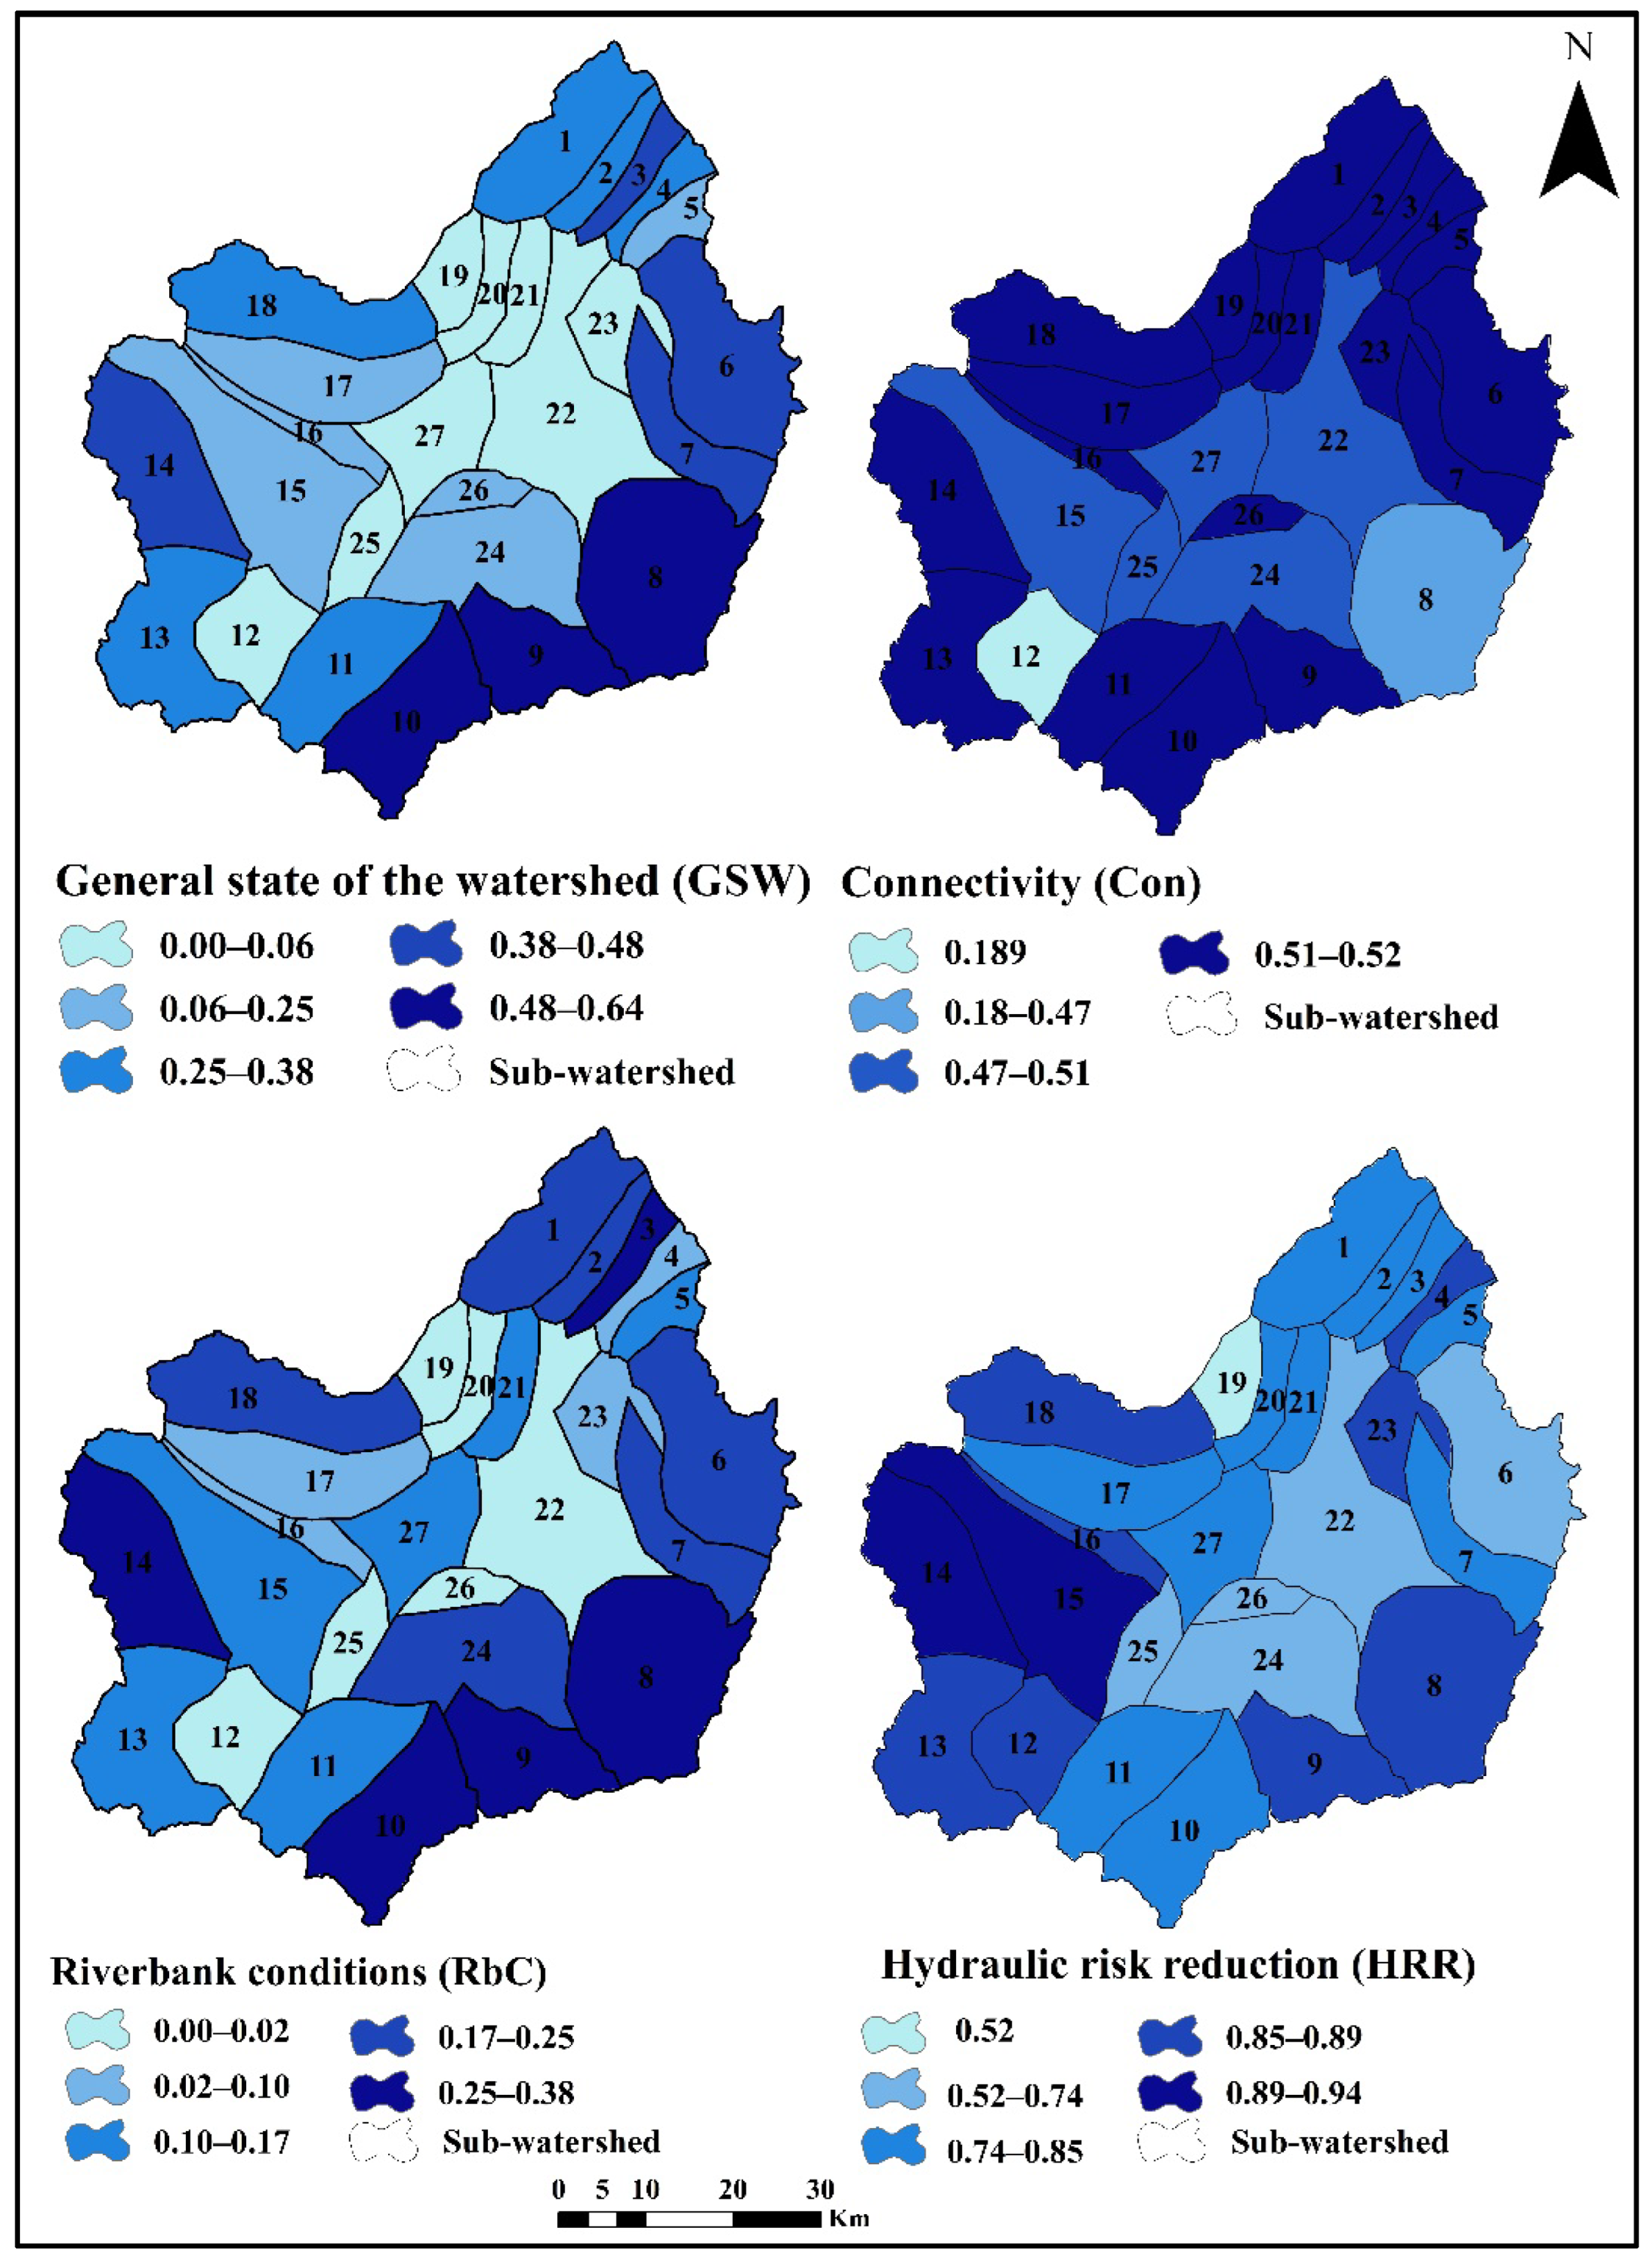
According to the obtained results, the highest value of the sub-index of the GSW was obtained in sub-watershed 10 by 0.23, and the lowest value was obtained in sub-watersheds 20, 22, 23, and 27 by 0.00. The sub-watershed 10 has a favorable situation in terms of the GSW sub-index, and the reason for that is the good permeability of this sub-watershed. Also, most sub-watersheds except sub-watersheds 8, 12, and 22 are in the same situation in terms of the Con sub-index. Sub-watershed 10 has a better situation in terms of RbC, while sub-watersheds 12, 19, 22, and 26 are not in good condition. Finally, the HRR sub-index was obtained with maximum values in sub-watersheds 14 and 15, with values of 0.95 and 0.92, respectively (Figure 7).
The general condition of sub-watersheds 10, 8, 9, and 6 was good (0.65 < GSW < 0.48), sub-watersheds 19, 21, 12, 25, 22, 27, 20, and 23, were in a critical condition (GSW < 0.06), and others situated in moderate general condition. In terms of the Con sub-index, most of the sub-watersheds were classified in a moderate condition from a hydro-morphological point of view (0.50 < Con < 0.45), and only sub-watershed 12 (Co < 0.20) was in a critical condition. The RbC sub-index in sub-watersheds 10, 3, 9, 14, and 8 was in a better condition (0.25 < RbC < 0.38), and sub-watersheds 20, 12, 19, 22, 25, and 26 were in a critical condition (RbC < 0.02) because they are occupied mainly by structures and residential areas. Finally, in sub-watersheds 14, 15, and 16, the urban river was in a more favorable hydraulic condition (0.89 < HRR < 0.95), and sub-watershed 19 was classified in an unfavorable hydraulic condition (Figure 7).
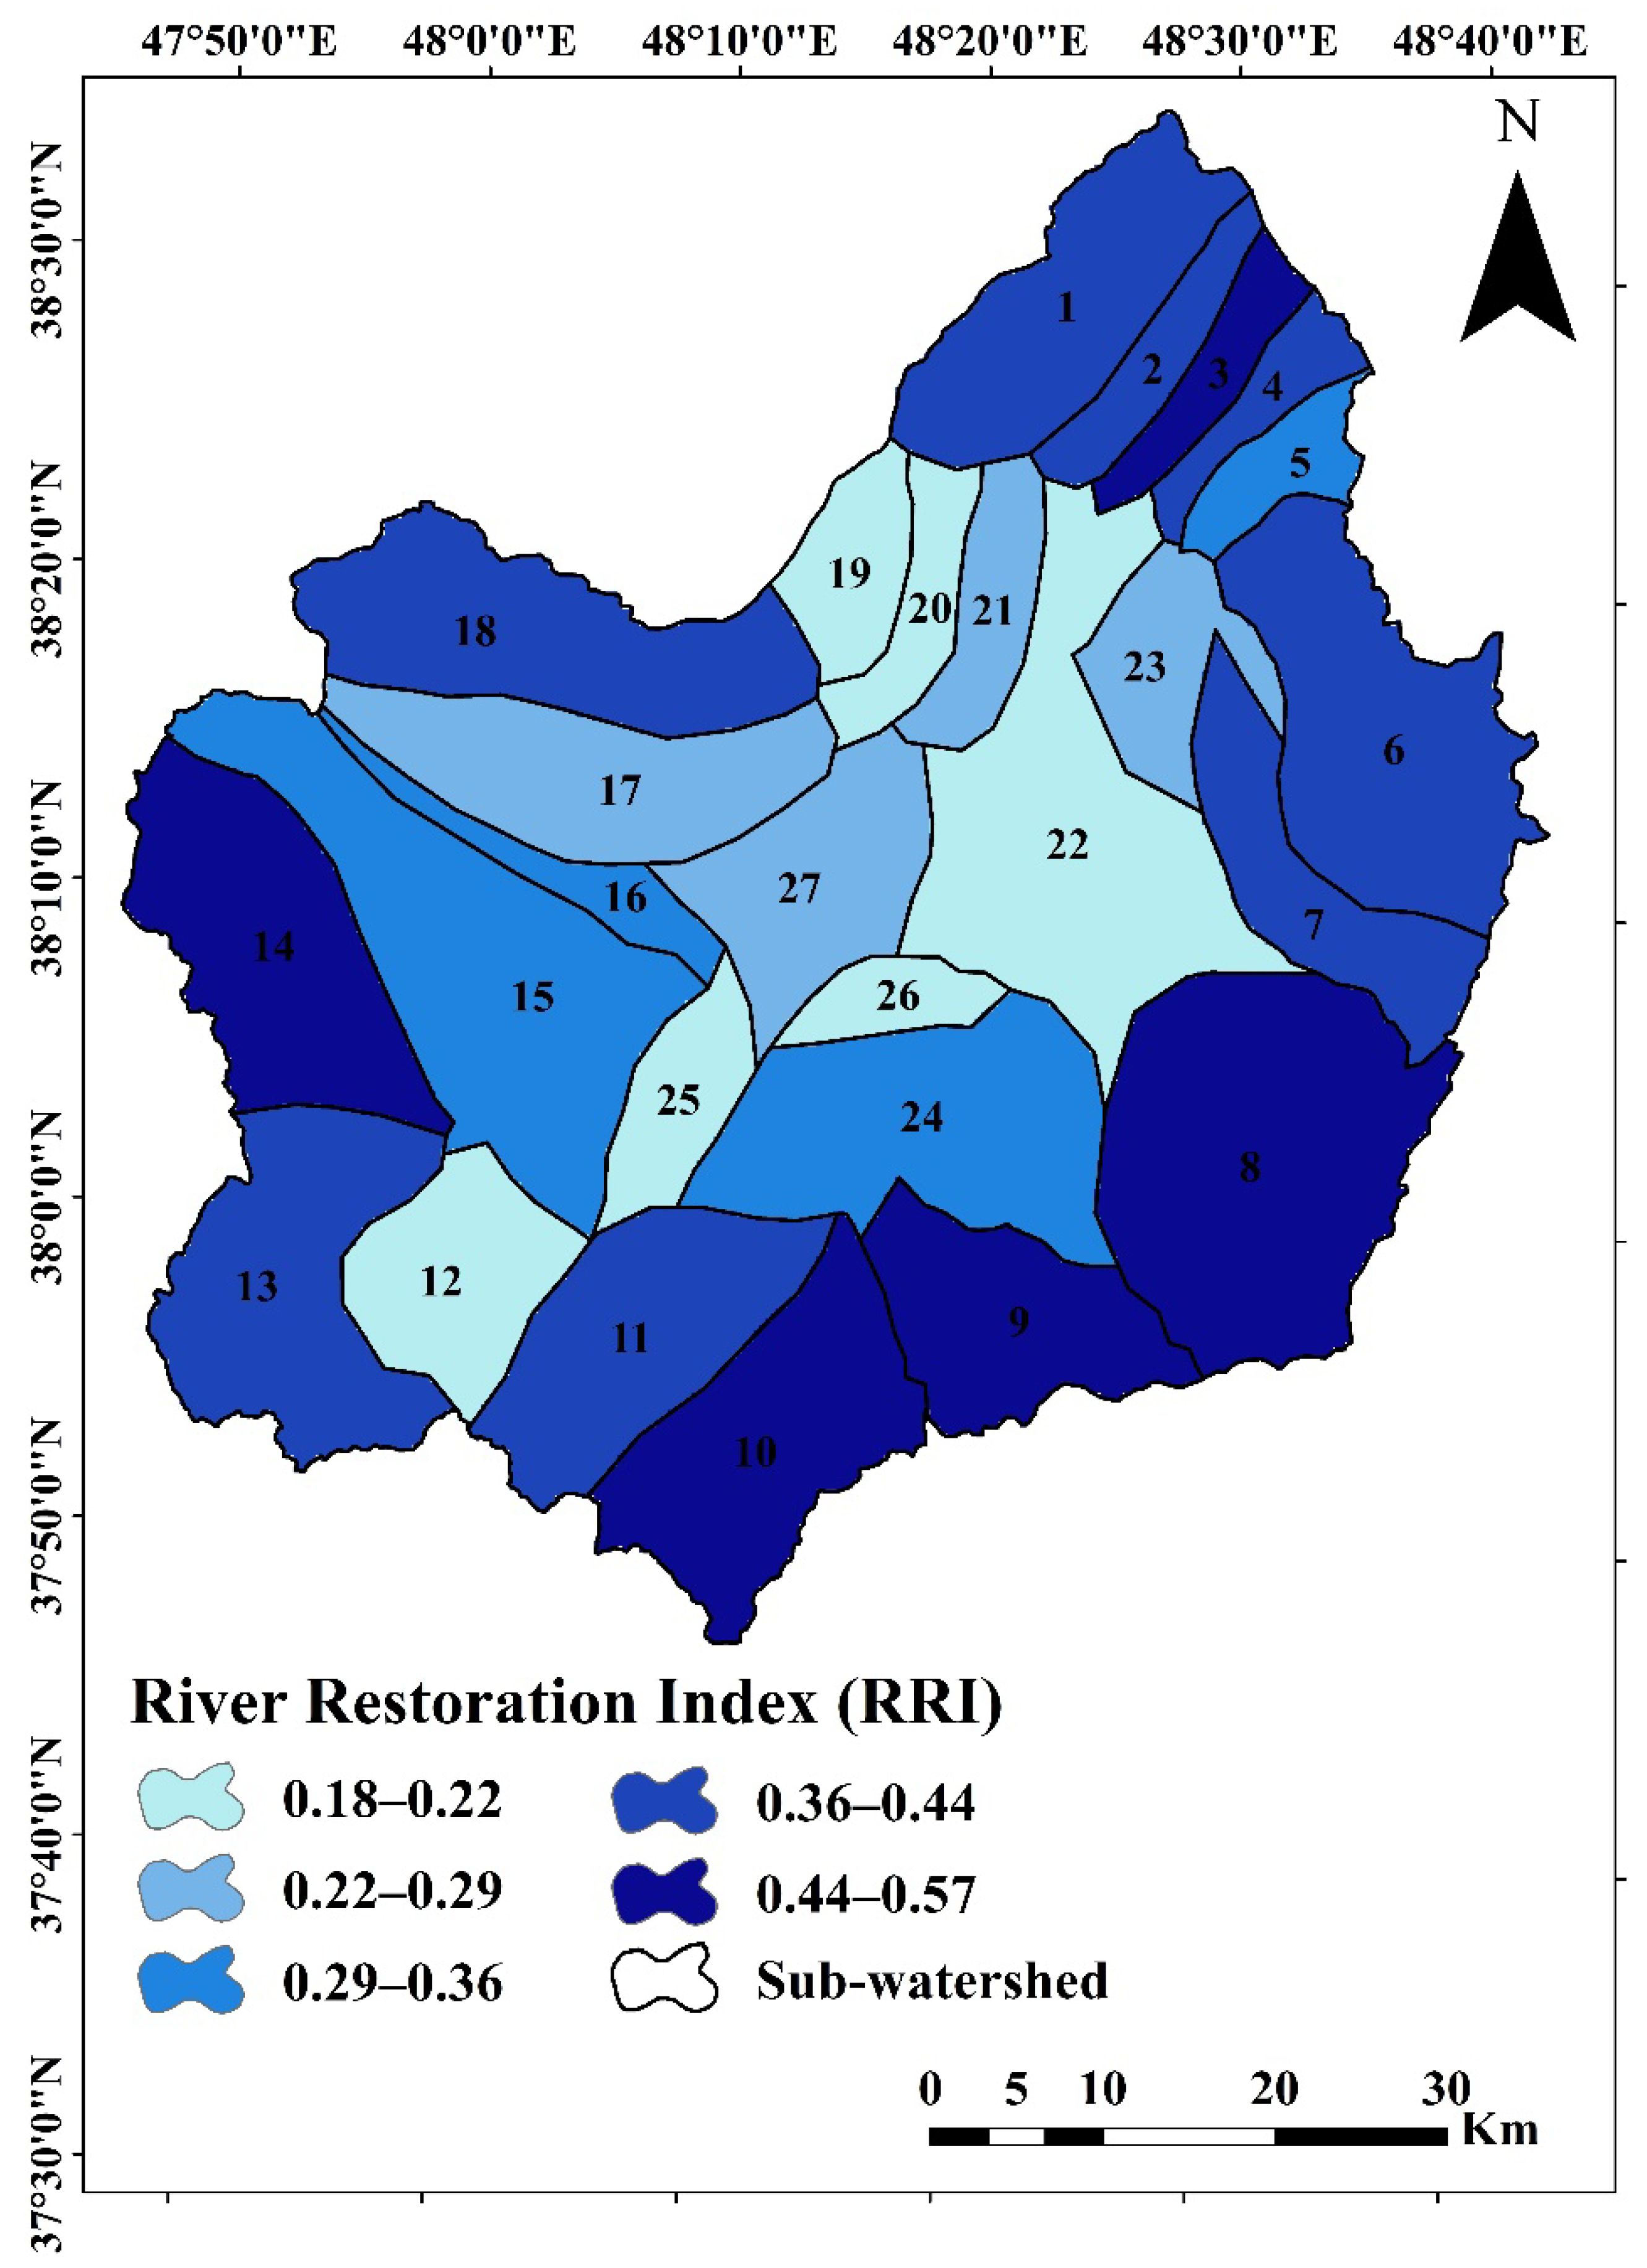
The zoning of the sub-watersheds of the Samian Watershed based on integrating the four sub-indices is presented in Figure 8. Sub-watersheds 12, 19, 22, 25, 20, and 26 had an RRI less than 0.22 and were placed in the very low RRI class. Correspondingly, sub-watersheds 6, 3, 14, 8, 9, and 10 had RRI values between 0.44 and 0.57, which were classified into the high RRI class.
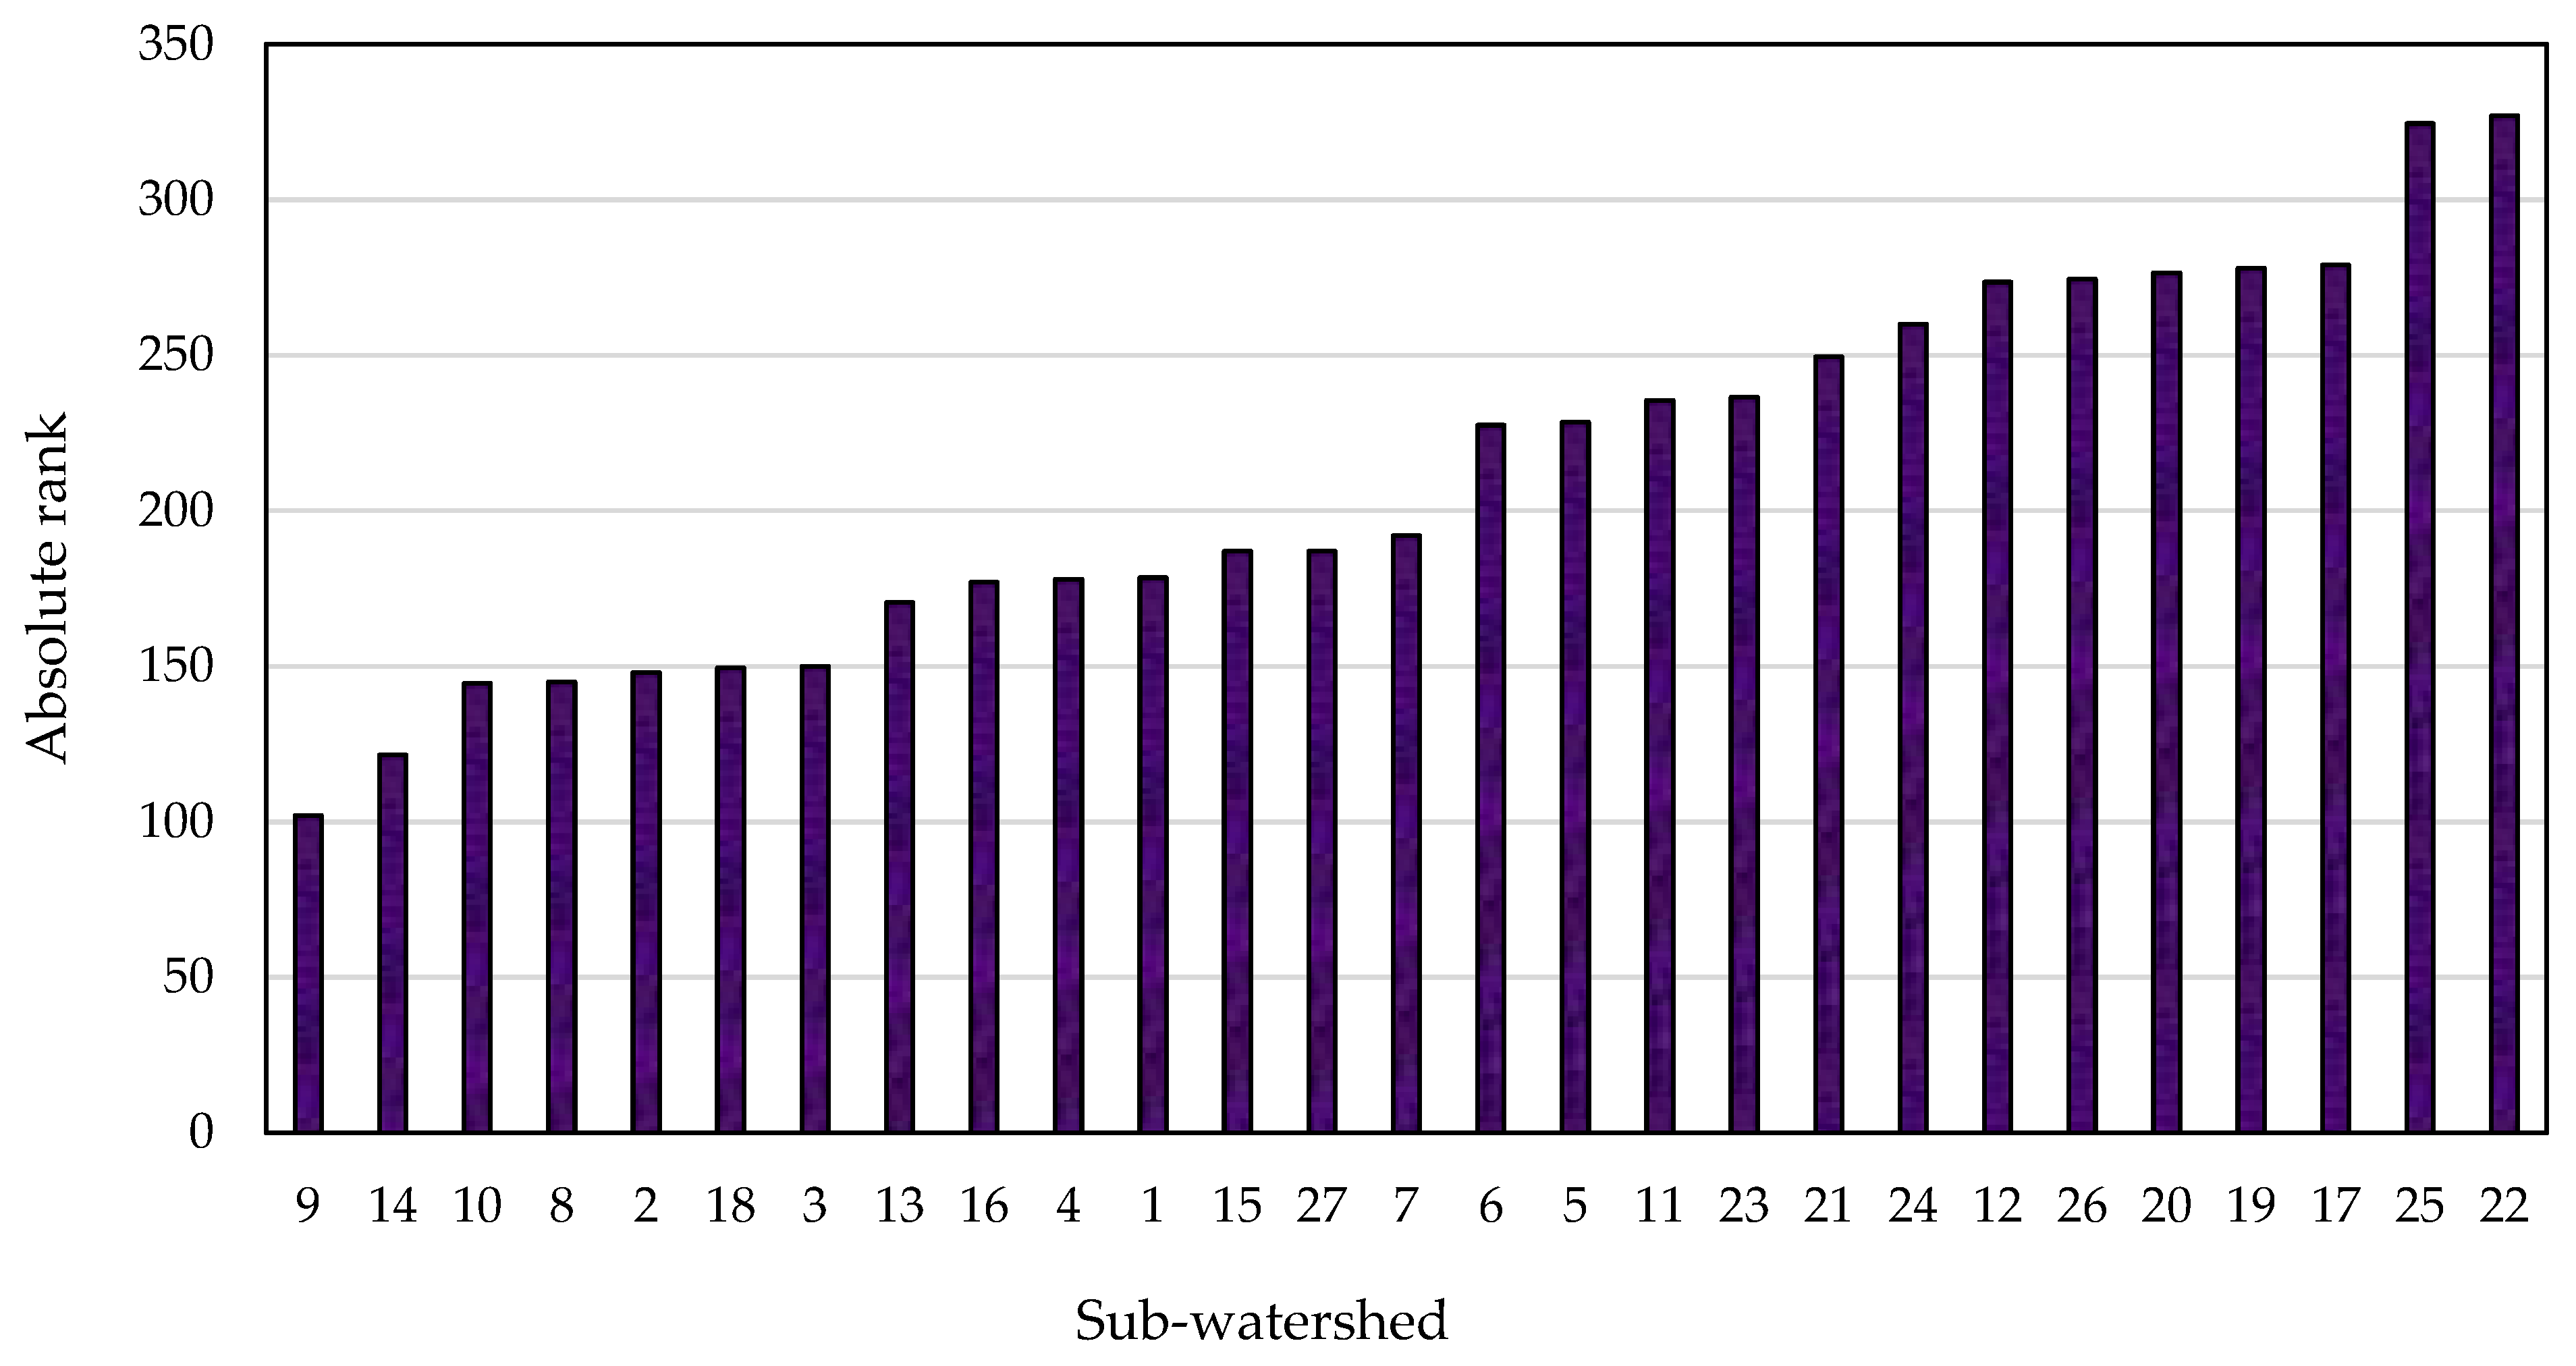
The hybrid method of MEREC-ORESTE, which assesses the interrelationship of river ecosystems with socio-economic systems, prioritized the sub-watersheds for adapting different management strategies. The ranking results based on four sub-indices showed that the sub-watersheds ranked between 1.0 and 107.0 (Table 2 and Figure 9). The maximum absolute rank was for the sub-watershed 12 in the Con sub-index, and its minimum was for sub-watershed 10 in the GSW sub-index (Table 2). In addition, the findings showed that the studied sub-watersheds were ranked differently in terms of the RRI. This means that the RRI in sub-watersheds 9, 14, 10, 8, 2, 18, and 3 are favorable. Considering the RRI results, sub-watersheds 12, 26, 20, 19, 17, 25, and 22 had the highest ranks (R(mk) >270.0). The higher sum of absolute ranks verifies adopting immediate restoration policies in these sub-watersheds.

4. Discussion

The watersheds of Iran have been manipulated enough. Although adopting management and conservation approaches is a requirement of the relevant environmental organizations’ programs, any manipulation and change in the natural state of the watersheds and sub-watersheds is contrary to natural conditions and is unacceptable. River restoration should be based on a process that maximizes the system’s resilience and minimizes maintenance needs. It is not recommended to interfere too much with nature’s ecological system, but rather, it is essential to address the factors that have caused the river to deviate from its natural state [14,15,16,17,18,20,21,24,38].
The Samian Watershed has recently become vulnerable to human disturbances, climatic changes (e.g., drought, flood), and ecological degradation. Its rivers serve as sources of different ecosystem goods and services for agricultural production, water for aquatic and edaphic organisms, industrial, irrigation, drinking, and domestic purposes, and ecotourism. Therefore, attention is required for maintenance and restoration to warrant long-standing development. Due to time, budget, and resource constraints, land planners and policymakers cannot reach all sub-watersheds/river systems at the same time in environmental initiatives. As a result, prioritization of sub-watersheds based on river restoration is critical.
According to our understanding of Ardabil Province and other similar studies [8,24], a large-scale flooding event could occur due to enhanced rainfall in the urban landscape. Several local regions of urban development alongside the rivers accelerated the hydrological responses. In this regard, Azizi et al. [24], taking into account six meteorological, hydrological, physical-environmental, social, economic, and spatial components based on 19 criteria, stated that the Samian Watershed had a high flood vulnerability.
Our results verified the high impact of the permeability criterion, which indicates suitable soil conditions in terms of water infiltration of the several studied sub-watersheds. The higher value of this criterion means less deviation of the watershed from its natural behavior and reduction in surface runoff. Considering that the good hydro-morphological condition of a river depends on good riparian vegetation in terms of maintaining water quality and stability of the riverbanks and removing surface runoff, the riparian vegetation of the studied area had a relatively favorable condition. In addition, the criterion of urban occupation of the riverbank showed that the presence of residential areas and structures along the riverbanks in the studied area was not highly limited the river flow. In this regard, according to the classification of Machado et al. [29], none of the studied sub-watersheds were affected by the dam, because either there was no dam in the sub-watershed, or the area of the sub-watershed was larger than the area occupied by the dam. However, occupying the banks alone is not enough, but the conditions of changing the riverbed are also important to consider for flood risk potential. It is possible that in some places, the conditions of water and flood flow through the river have changed, in which case there is a risk of flood damage [7]. Therefore, considering this issue in future studies is highly emphasized.
The results are inconsistent with the findings of Zareie et al. [38] regarding the classification of the Samian Watershed in terms of climatic vulnerability. They reported that most sub-watersheds in the center and the northern part of the Samian Watershed are at a very low level of climatic vulnerability. These discrepancies are probably due to different rainfall conditions that have led to different results. In addition, Mostafazadeh and Mehri [39] admitted that the Samian Watershed has a high runoff coefficient compared to other watersheds in Ardabil Province. Rasinezami et al. [40] have also pointed out the increase in hydrological drought in the watershed’s rivers with the development of urban and rural areas. Raoof and Alioghli [41] also stated that with the construction of the Yamchi Dam, the discharge of Balikhlochai River is 95.2 and 46.2 m2 s−1, respectively, for the protection of the river in suitable and relatively suitable conditions. In addition, the impact of the construction of Yamchi Dam on hydrological parameters is 38.61%, with a moderate degree of change.
In terms of comparison of RRI application with other methodologies, it could be pointed to the application of AHP and GIS in Sanchez and Alvarez’s study [1], in which different weights were obtained for effective criteria influencing hydrological restoration of the Dulcepamba River Basin. The stream power index (SPI), topographic wetness index (TWI), terrain ruggedness index (TRI), sediment transport index (STI), stream density index (SD), curve number index (CN), distance from river (RD), normalized difference vegetation index (NDVI), and rainfall index (RF), respectively, were assigned 6.45, 18.94, 3.76, 7.59, 7.97, 18.79, 9.45, 15.57, and 11.47% in hydrological restoration characterization.
The hybrid method of MEREC-ORESTE, which assesses the interrelationship of river ecosystems with socio-economic systems, prioritized the sub-watersheds for adapting different management strategies. Since the river-based resources are essential for taking advantage of the newly developed prospects and social benefits, the result depicted a sound roadmap for Samian sub-watershed stakeholders. Locals with sufficient water resources seize opportunities to determine the most operational sustainable livelihoods and economic sectors, such as tourism [4,12].
The main limitation of this study was the inability to quantitatively check the results accuracy of the index-based framework of the RRI. However, several field visits were made, and the RRI results were almost verified. In addition, the findings of our previous investigations were consistent with the present results. For instance, Azizi et al. [24] found that the Samian Watershed was situated in the high class of the flood vulnerability index (0.75 < FVI < 1.00). In addition, Moradzadeh et al. [21] showed high ecological disturbances (0.60–0.80) in the central and western sub-watersheds of the Samian Watershed.

5. Conclusions

This research demonstrated that the river restoration index (RRI) can be an effective index to support integrated watershed management, local river system strengthening, and the decreasing of growing backlogs by identifying priority management areas. In addition, a novel framework, which couples the MEREC-ORESTE hybrid method to quantify reciprocal feedback between river ecosystems and socio-economic systems for assessing river restoration, was adapted through a case study in the center of Ardabil Province, northwestern Iran. The current research specifies 19 main sub-criteria, 9 criteria, and, finally, 4 sub-indices: the general state of the watershed (GSW), connectivity (Con), riparian conditions (RbC), and hydraulic risk reduction (HRR); the river restoration level of the Samian Watershed was evaluated and spatially zoned.
Regarding the MEREC results, the contributions of the four sub-indices, GSW, Con, RbC, and HRR, in RRI characterization were weights of 0.36, 0.16, 0.32, and 0.16. In terms of the RRI, among 27 studied sub-watersheds, sub-watershed 10 (RRI = 0.57), situated in the southwest of the watershed, has more ideal conditions, which can be related to the better GSW and Con sub-indices. Meanwhile, in sub-watershed 12 (RRI = 0.18), situated in the southwest of the watershed, the river is not in good condition. The poor condition of the river connectivity and the riverbank has caused this unfavorable condition. In total, sub-watersheds 12, 19, 20, 25, and 26 (RRI = 0.18) were in the lowest RRI condition. The priority of restoration budget allocation can be assigned to return to the resilience level of these sub-watersheds. The priority of improving vegetation cover and biodiversity in sub-watersheds with unfavorable conditions, preventing the destruction of vegetation cover, and increasing soil moisture by maintaining the existing vegetation cover, as well as the use of management approaches compatible with restoring the Samian Watershed, are among the suggestions resulting from the research.
The key constraint of this research was related to the data acquisition. Indeed, limitations in data acquisition in terms of record length and spatial resolution showed momentous information gaps. The meteorological, hydrometric, social-economic, and pollution data in Iran, including our studied area, are collected through spare ground stations with very sparse density. The large area and limited research budget also affected the accuracy assessment of the RRI application through complete field visits. Therefore, it is highly proposed to extend the ground station network to obtain data with more precision and attained over long-term period. The use of new technologies to quantify the impact on vegetation and the hydrological regime is necessary for the current state of anthropization of the environment, which needs more research in the future, especially in the arid and semi-arid environments, which are more affected by climate change.

Author Contributions

Conceptualization, Z.H.; Formal analysis, Z.H., E.A. and E.G.; Funding acquisition, Z.H. and S.F.; Investigation, Z.H., E.G., Z.S. and A.D.; Methodology, Z.H., E.A. and Z.S.; Project administration, Z.H.; Software, E.A. and E.G.; Validation, Z.H., E.A. and E.G.; Visualization, E.A. and E.G.; Writing—original draft, E.A. and Z.S.; Writing—review and editing, Z.H., E.A., E.G., Z.S., A.D. and S.F. All authors have read and agreed to the published version of the manuscript.

Funding

This research was funded by the University of Mohaghegh Ardabili, grant number 1402/d/9/11478.

Data Availability Statement

The original contributions presented in this study are included in the article/Appendix A. Further inquiries can be directed to the corresponding author(s).

Acknowledgments

The authors are grateful for the support of the University of Mohaghegh Ardabili, Ardabil Province, Iran.

Conflicts of Interest

The authors declare no conflicts of interest. The funders had no role in the design of the study; in the collection, analyses, or interpretation of data; in the writing of the manuscript; or in the decision to publish the results.

Appendix A

Table A1. Main references for the data used.
Data UsedSource
Discharge dataRegional Water Company of Ardabil (http://arrw.ir/?l=EN, accessed on 29 April 2024)
Waste collection and disposal systemsStatistics Center of Iran [23] (https://old.sci.org.ir/english/Population-and-Housing-Censuses, accessed on 29 April 2024)
Rainfallhttps://www.irimo.ir/eng/index.php, accessed on 29 April 2024
Floodplain maphttps://gisacademy.ir/shop/gis-data/ardabil-province-dataset/, accessed on 6 May 2024
Land useMoradzadeh et al. [21]
River shape filehttps://gisacademy.ir/shop/gis-data/ardabil-province-dataset/, accessed on 6 May 2024
Topography mapIran National Cartographic Center (https://en.ncc.gov.ir/, accessed on 6 May 2024)
Soil mapGeneral Directorate of Natural Resources and Watershed Management of Ardabil Province (https://ardabil.frw.ir/, accessed on 6 May 2024)
Slopehttps://gisacademy.ir/shop/gis-data/ardabil-province-dataset/, accessed on 6 May 2024
Dam frequencyCountry Planning and Budget Organization [22]; http://www.arrw.ir/st/419, accessed on 29 April 2024
Table A2. The results of the sub-criteria and criteria used for GSW sub-index calculation.
Sub-Watershed No.Sub-CriteriaCriteriaSub-CriteriaCriteria
Permeable Area (km2)Total Area (km2)PermeabilityArea Served by
Treatment/Disposal (km2)
Total Area (km2)Sanitation Conditions
176.81186.710.410.90186.710.005
225.8761.480.420.3061.480.005
327.6856.100.490.2756.100.005
420.6148.270.430.2348.270.005
513.7451.750.270.2551.750.005
6145.52262.260.551.27262.260.005
758.37132.160.440.64132.160.005
8229.47348.100.661.68348.100.005
9100.01157.110.600.76157.110.005
10158.26215.490.741.04215.490.005
1170.89189.710.370.91189.710.005
122.64130.200.020.63130.200.005
1376.96225.720.341.09225.720.005
14114.09224.290.511.08224.290.005
1581.80325.680.251.57325.680.005
1614.0755.540.250.2755.540.005
1731.16189.250.170.91189.250.005
1887.98228.100.391.10228.100.005
194.0571.200.060.3471.200.005
200.0062.340.000.3062.380.005
213.4074.430.050.3674.4380.005
224.03327.320.011.58327.320.005
230.0092.970.000.4592.960.005
2471.91248.720.291.20248.720.005
251.3375.390.020.3675.390.005
263.5444.290.080.2144.290.005
270.94150.990.010.73150.990.005
Total1425.084235.580.3420.434235.580.01
Table A3. The results of the sub-criteria and the criteria used to calculate the connectivity (Con) sub-index.
Sub-Watershed No.Sub-CriteriaCriteriaSub-CriteriaCriteriaSub-CriteriaCriteria
Length of Riverbanks Connected to the Floodplain
)m)
Total Length of Riverbanks (m)Transversal ConnectivityWatershed Area (km2)Area Defined by a Longitudinal Barrier (km2)Longitudinal ConnectivityLength of Riverbanks and Riverbed in a Natural State (m)Total Length of Riverbanks and Riverbed (m)Vertical Connectivity
10.0077,950.790.00186.710.001.0077,950.7977,950.791.00
20.0022,483.770.0061.480.001.0022,483.7722,483.771.00
30.0021,608.300.0056.100.001.0021,608.3021,608.301.00
40.0027,386.170.0048.270.001.0027,386.1727,386.171.00
50.0030,835.430.0051.750.001.0030,835.4330,835.431.00
60.00124,131.530.00262.261.901.00124,109.22124,131.530.99
70.0038,622.170.00132.160.001.0038,622.1738,622.171.00
80.00166,965.710.00348.1041.100.88166,952.79166,965.710.99
90.0082,010.950.00157.110.001.0082,010.9582,010.951.00
100.0071,905.900.00215.490.001.0071,905.9071,905.901.00
110.00120,111.060.00189.710.500.98120,100.84120,111.060.99
120.0036,819.670.00130.200.800.1036,812.0536,819.670.99
130.0092,863.730.00225.720.001.0092,863.7392,863.731.00
140.0048,896.100.00224.291.100.9948,879.1648,896.100.99
150.00125,882.990.00325.6813.800.96125,810.36125,882.990.99
161.9929,563.566.7455.540.001.0029,563.5629,563.561.00
170.0075,554.850.00189.251.800.9975,544.1975,554.850.99
180.0097,197.010.00228.100.001.0097,197.0197,197.011.00
192.0016,431.300.0071.200.001.0016,431.3016,431.301.00
202.0124,946.548.0462.380.001.0024,946.5424,946.541.00
211.2524,554.505.0974.430.001.0024,554.5024,554.501.00
222.0055,910.753.57327.3213.60.9655,881.4655,910.750.99
230.0041,970.620.0092.950.001.0041,970.6241,970.621.00
240.00154,903.530.00248.7212.10.95154,861.35154,903.530.99
252.0121,774.009.2175.392.900.9621,757.9121,774.000.99
260.0016,413.740.0044.290.001.0016,413.7416,413.741.00
272.0239,734.495.07150.993.900.9739,657.9639,734.490.99
Total1.801,687,429.161.074235.5893.5025.761,687,111.781,687,429.160.99
Table A4. The results of sub-criteria and criteria used to calculate riverbank conditions (RbC) sub-index.
Sub-Watershed No.Sub-CriteriaCriteriaSub-CriteriaCriteria
Sum Length of the Riparian Vegetation (m)Total Length of the Riverbanks (m)Riparian VegetationLength of the Urban Occupation of Riverbanks (m)Total Length of Riverbanks (m)Urban Occupation of the Riverbanks
134,658.8477,950.790.4526.3877,950.790.00
210,418.2522,483.770.450.0022,483.770.00
313,257.1621,608.300.620.0021,608.300.00
45218.4927,386.170.203.7427,386.170.00
56484.6730,835.430.22394.5230,835.430.01
641,374.84124,131.530.344425.41124,131.530.04
715,247.4838,622.170.40252.5338,622.170.01
890,105.94166,965.710.541894.27166,965.710.01
948,548.9382,010.950.59294.9682,010.950.00
1050,170.6271,905.900.70711.3071,905.900.01
1135,186.66120,111.060.291831.01120,111.060.02
120.0036,819.670.00958.5936,819.670.03
1322,787.1092,863.730.25234.2292,863.730.00
1428,748.7248,896.100.59160.8548,896.100.00
1531,015.06125,882.990.253488.72125,882.990.03
164125.1429,563.560.140.0029,563.560.00
1710,148.6675,554.850.13220.9475,554.850.00
1835,954.5097,197.010.373961.8297,197.010.04
190.0016,431.300.01279.6016,431.300.02
200.0024,946.540.01992.8424,946.540.04
210.0024,554.500.016273.3924,554.500.26
220.0055,910.750.01474.5855,910.750.01
230.0041,970.620.012701.3041,970.620.06
2447,718.76154,903.530.311049.02154,903.530.01
250.0021,774.000.000.0021,774.000.00
260.0016,413.740.000.0016,413.740.00
270.0039,734.490.0012,288.4739,734.490.31
Total531,169.791,687,429.160.3242,918.481,687,429.160.025
Table A5. The results of the sub-criteria and criteria used to calculate the hydraulic risk reduction (HRR) sub-index.
Sub-Watershed No.CriteriaSub-CriteriaCriteriaHydraulic Risk Reduction (HRR)
Maximum Annual Instantaneous Discharge (m3 s−1)Watershed Area (m2)Effective Rainfall (m s−1)Runoff Coefficient (%)Discharge of Effective Rainfall (m3 s−1)
14.91186,710,000.001.0816.232.610.85
21.6261,480,000.001.0717.4411.530.86
31.4856,100,000.001.0817.1210.360.86
41.2748,270,000.001.0720.5710.640.88
51.3651,750,000.001.0513.557.360.82
66.90262,260,000.001.069.9227.460.75
73.48132,160,000.001.0913.0918.860.82
89.16348,100,000.001.0819.1178.460.88
94.13157,110,000.001.0719.9334.940.88
105.67215,490,000.001.0615.3937.260.85
114.99189,710,000.001.0914.9531.820.84
123.43130,200,000.001.1717.7425.690.87
135.94225,720,000.001.1118.8549.470.88
145.90224,290,000.001.1238.3108.640.95
158.57325,680,000.001.1228.59109.270.92
161.4655,540,000.001.1121.7113.780.89
174.98189,250,000.001.1615.4233.190.85
186.00228,100,000.001.2617.9848.80.88
191.8771,200,000.001.175.393.940.52
201.6462,380,000.001.0311.847.590.78
211.9674,430,000.001.0313.7410.590.81
228.61327,320,000.001.037.7826.390.67
232.4592,950,000.001.0418.317.470.86
246.54248,720,000.001.039.0824.340.73
251.9875,390,000.001.087.526.160.68
261.1744,290,000.001.097.633.640.68
273.97150,990,000.001.0814.4823.210.83
Total111.434,235,580,0001.0616.576.561.00
Figure A1. Basic maps prepared to characterize the RRI in the Samian Watershed.
Earth 06 00006 g0a1

References

  1. Sanchez, E.F.; Alvarez, C.I. Prioritization of hydrological restoration areas using AHP and GIS in Dulcepamba River Basin in Bolivar–Ecuador. Hydrology 2024, 11, 81. [Google Scholar] [CrossRef]
  2. Guimaraes, L.F.; Teixeira, F.C.; Pereira, J.N.; Becker, B.R.; Oliveira, A.K.B.; Lima, A.F.; Verol, A.P.; Miguez, M.G. The challenges of urban river restoration and the proposition of a framework towards river restoration goals. J. Clean. Prod. 2021, 316, 128330. [Google Scholar] [CrossRef]
  3. Guimaraes, L.F.; Verol, A.P.; Miguez, M.G. Assessing urban river restoration design using an integrated economic, social and environmental index. J. Clean. Prod. 2025, 486, 144568. [Google Scholar] [CrossRef]
  4. Verol, A.P.; Battemarco, B.P.; Merlo, M.L.; Machado, A.C.M.; Haddad, A.N.; Miguez, M.G. The urban river restoration index (URRIX) -A supportive tool to assess fluvial environment improvement in urban flood control projects. J. Clean. Prod. 2019, 239, 114. [Google Scholar] [CrossRef]
  5. Verol, A.P.; Lourenço, I.B.; Fraga, J.P.R.; Battemarco, B.P.; Merlo, M.L.; Magalhães, P.C.; Miguez, M.G. River restoration integrated with sustainable urban water management for resilient cities. Sustainability 2020, 12, 4677. [Google Scholar] [CrossRef]
  6. Zheng, X.; Wang, F. Construction of an adaptive river-based recreational network for urban river restoration: A case study of Rencheng District, Jining City, China. J. Clean. Prod. 2022, 374, 133985. [Google Scholar] [CrossRef]
  7. Islam, M.B.; Tingsanchali, T. Risk assessment of river bank failure due to floods in Jamuna, Ganges and Padma Rivers in Bangladesh. Int. J. Disaster Risk Reduct. 2024, 102, 104272. [Google Scholar] [CrossRef]
  8. Kravčík, M.; Pokorný, J.; Kohutiar, J.; Kováč, M.; Tóth, E. Water for the Recovery of the Climate-A New Water Paradigm. Water Policy. 2007. Available online: https://static1.squarespace.com/static/538c8ae0e4b0ef2df549ab42/t/55912e08e4b03ab3a9aa5c4f/1435577864636/A+New+Paradigm+for+Water.pdf (accessed on 22 August 2024).
  9. Baptista, M.N.; Valcarcel, R.; Mateus, F.A.; Medeiros, W.S.; De Andrade, F.C. Impact of urbanization on the hydrodynamics of a water table in a floodplain with high potential for renaturation. Water Resour. Manag. 2017, 31, 4091–4102. [Google Scholar] [CrossRef]
  10. Cunha, N.S.; Magalhaes, M.R.; Domingos, T.; Abreu, M.M.; Küpfer, C. The land morphology approach to flood risk mapping: An application to Portugal. J. Environ. Manag. 2017, 193, 172–187. [Google Scholar] [CrossRef] [PubMed]
  11. Morandi, B.; Piegay, H.; Lamouroux, N.; Vaudor, L. How is success or failure in river restoration projects evaluated? Feedback from French restoration projects. J. Environ. Manag. 2014, 137, 178–188. [Google Scholar] [CrossRef] [PubMed]
  12. Mrozinska, N.; Glinska Lewczuk, K.; Burandt, P.; Kobus, S.; Gotkiewicz, W.; Szymanska, M.; Bakowska, M.; Obolewski, K. Water quality as an indicator of stream restoration effects- A Case Study of the Kwacza River restoration project. Water 2018, 10, 1249. [Google Scholar] [CrossRef]
  13. Williams, M.R.; Filoso, S. Changes in hydrology and pollutant loads from stream restoration in an urban headwater catchment. Hydrology 2023, 618, 129164. [Google Scholar] [CrossRef]
  14. Divsalar, A.; Shokri Firoozjah, P.; Ferdowsi, S. Analyzing the strategies of rehabilitation of Shahrood River by SWOT technique. J. Environ. Sci. Tec. 2016, 18, 43–65. (In Persian). Available online: https://sanad.iau.ir/en/Journal/jest/Article/839188/FullText (accessed on 22 August 2024).
  15. Lotfi, H.; Mousazadeh, H. Restoration of open spaces around urban rivers and their role in the quality of life and security of citizens (Case study: Alangdareh River, Gorgan). Hum. Geogr. Res. 2020, 52, 199–219. (In Persian) [Google Scholar] [CrossRef]
  16. Banihabib, M.E.; Ezzatiamini, M.; Shabestari, M. A framework for determining sustainable development strategy in restoring a seasonal urban river. Watershed Eng. Manag. 2019, 11, 316–327. [Google Scholar] [CrossRef]
  17. Naderi, M.H.; Zakerinia, M.; Salarijazi, M. Aquatic of ecosystem management and restoration rivers. Iran. J. Ecohydrol. 2019, 6, 719–737. (In Persian) [Google Scholar] [CrossRef]
  18. Rajabi, H.; Firoozi, M.A.; Amanpur, S.; Hasani, N. Selecting the best way to develop green water space with the approach of rehabilitation and development of urban rivers based on AHP method. Water Resour. Eng. 2021, 14, 103–116. (In Persian) [Google Scholar] [CrossRef]
  19. Yousefi, A. Reviving the Zayandeh Rud River: Inquiring the remained opportunities. Water Resour. Eng. 2023, 18, 179–185. (In Persian) [Google Scholar]
  20. Talebi, Z.; Ayyoubzadeh, S.A.; Mostafavi, H.; Hosseinzadeh, M.M.; Moghaddam, H.S. Morphological analysis and assessment of a river based on morphological characteristics, artificial structures and channel adjustments (Case study: Talar River-Upstream of Shirgah). Environ. Sci. 2024, 22, 21–38. (In Persian). Available online: https://envs.sbu.ac.ir/article_103119.html?lang=en (accessed on 22 August 2024).
  21. Moradzadeh, V.; Hazbavi, Z.; Esmali Ouri, A.; Mostafazadeh, R.; Zarei, S.; Alaei, N. Assessment of spatial heterogeneity of hydro-sedimentological disturbance index in the Samian sub-watersheds. Hydrogeomorphology 2022, 9, 136-117. (In Persian) [Google Scholar] [CrossRef]
  22. Country Planning and Budget Organization. Studies of Ardabil Province Planning and Budget Organization; Management and Planning Organization: Tehran, Iran, 2018; 195p. (In Persian)
  23. Statistics Center of Iran. General Census of the Population and Housing of Ardabil Province; Statistics Center of Iran: Tehran, Iran, 2016; (In Persian). Available online: https://old.sci.org.ir/english/Population-and-Housing-Censuses (accessed on 29 April 2024).
  24. Azizi, E.; Mostafazadeh, R.; Hazbavi, Z.; Esmali Ouri, A.; Mirzaie, S.; Huang, G.; Qian, X. Spatial distribution of flood vulnerability index in Ardabil province, Iran. Stoch. Environ. Res. Risk Assess. 2022, 36, 4355–4375. [Google Scholar] [CrossRef]
  25. Liu, Y.B. Development and Application of a GIS-Based Hydrological Model for Flood Prediction and Watershed Management. Ph.D. Thesis, Vrije Universiteit, Brussel, Belgium, 2024. [Google Scholar]
  26. Hazbavi, Z.; Alaei, N. Assessment and optimization of hydrological connectivity for effective management of water resources in the Samian Watershed. Spat. Plan. 2024, 14, 115–138. [Google Scholar]
  27. Hysa, A. Introducing Transversal Connectivity Index (TCI) as a method to evaluate the effectiveness of the blue-green infrastructure at metropolitan scale. Ecol. Indic. 2021, 124, 107432. [Google Scholar] [CrossRef]
  28. Gonzalez del Tanango, M.; García De Jalon, D. Restauracion de ríos. Guía Metodologica para la Elaboracion de Proyectos, 1st ed.; Estrategia Nacional de Restauracion de Ríos-Programa Agua: Madrid, Spain, 2007.
  29. Machado, A.C.M.; Verol, A.P.; Miguez, M.G. River classification index (RCI): A tool for preliminary river quality assessment considering river restoration aspects. In Proceedings of the 13th Conference on Sustainable Development of Energy, Water, and Environment Systems, Palermo, Italy, 30 September–4 October 2018; pp. 1–17. [Google Scholar]
  30. Wohl, E. Connectivity in rivers. Prog. Phys. Geog. 2017, 41, 345–362. [Google Scholar] [CrossRef]
  31. Keshavarz-Ghorabaee, M.; Amiri, M.; Zavadskas, E.K.; Turskis, Z.; Antucheviciene, J. Determination of objective weights using a new method based on the removal effects of criteria (MEREC). Symmetry 2021, 13, 525. [Google Scholar] [CrossRef]
  32. Shanmugasundar, G.; Sapkota, G.; Čep, R.; Kalita, K. Application of MEREC in multi-criteria selection of optimal spray-painting robot. Processes 2022, 10, 1172. [Google Scholar] [CrossRef]
  33. Marc Roubens, M. Preference relations on actions and criteria in multicriteria decision making. Eur. J. Oper. Res. 1982, 10, 51–55. [Google Scholar] [CrossRef]
  34. Yerlikaya, M.A.; Yildiz, K.; Keskin, B.N. Solution proposal for completed preference structure in ORESTE method. Sci. Rep. 2023, 13, 4754. [Google Scholar] [CrossRef] [PubMed]
  35. Portabari, M.M.; Banihabib, A.; Najafi Marghmaleki, S. River restoration. In Proceedings of the 4th International Conference on Planning and Management, Tehran, Iran, 23–24 May 2017. (In Persian). [Google Scholar]
  36. Sadeghi Ravesh, M.H. Evaluation of de-desertification in Ardakan-khezr Abad plain by using Shannon entropy method and ORESTE model. Environ. Eros. Res. 2019, 8, 19–40. (In Persian) [Google Scholar]
  37. Jafari, H. Identification and prioritization of grain discharging operations risks by using ORESTE method. Am. J. Public Health Res. 2013, 1, 214–220. [Google Scholar] [CrossRef]
  38. Zareie, S.; Hazbavi, Z.; Mostafazadeh, R.; Esmali Ouri, A. Vulnerability comparison of Samian sub-watersheds based on climate change components. Phys. Geogr. Res. 2021, 52, 217–236. (In Persian) [Google Scholar] [CrossRef]
  39. Mostafazadeh, R.; Mehri, S. Comparing the variations in hydrologic response of Ardabil Province watersheds using precipitation-runoff polygons. Watershed Eng. Manag. 2019, 11, 381–391. (In Persian) [Google Scholar] [CrossRef]
  40. Rasinezami, S.; Izadifard, H.; Mostafazadeh, R.; Khavarian, H. Urban Development and the Characteristics of Hort and Medium-Term Hydrological Drought in the Samian Watershed of Ardabil Province. Geography Urban and Regional Studies. 2023. (In Persian). Available online: https://sanad.iau.ir/en/Journal/ges/Article/699059?jid=699059 (accessed on 24 August 2024).
  41. Raoof, M.; Alioghli, S. Estimation of environmental flow of the Balikhlochai River and evaluation impact of Yamchi dam operation on hydrological and environmental regime of the river. J. Nat. Environ. 2020, 73, 299–312. [Google Scholar] [CrossRef]
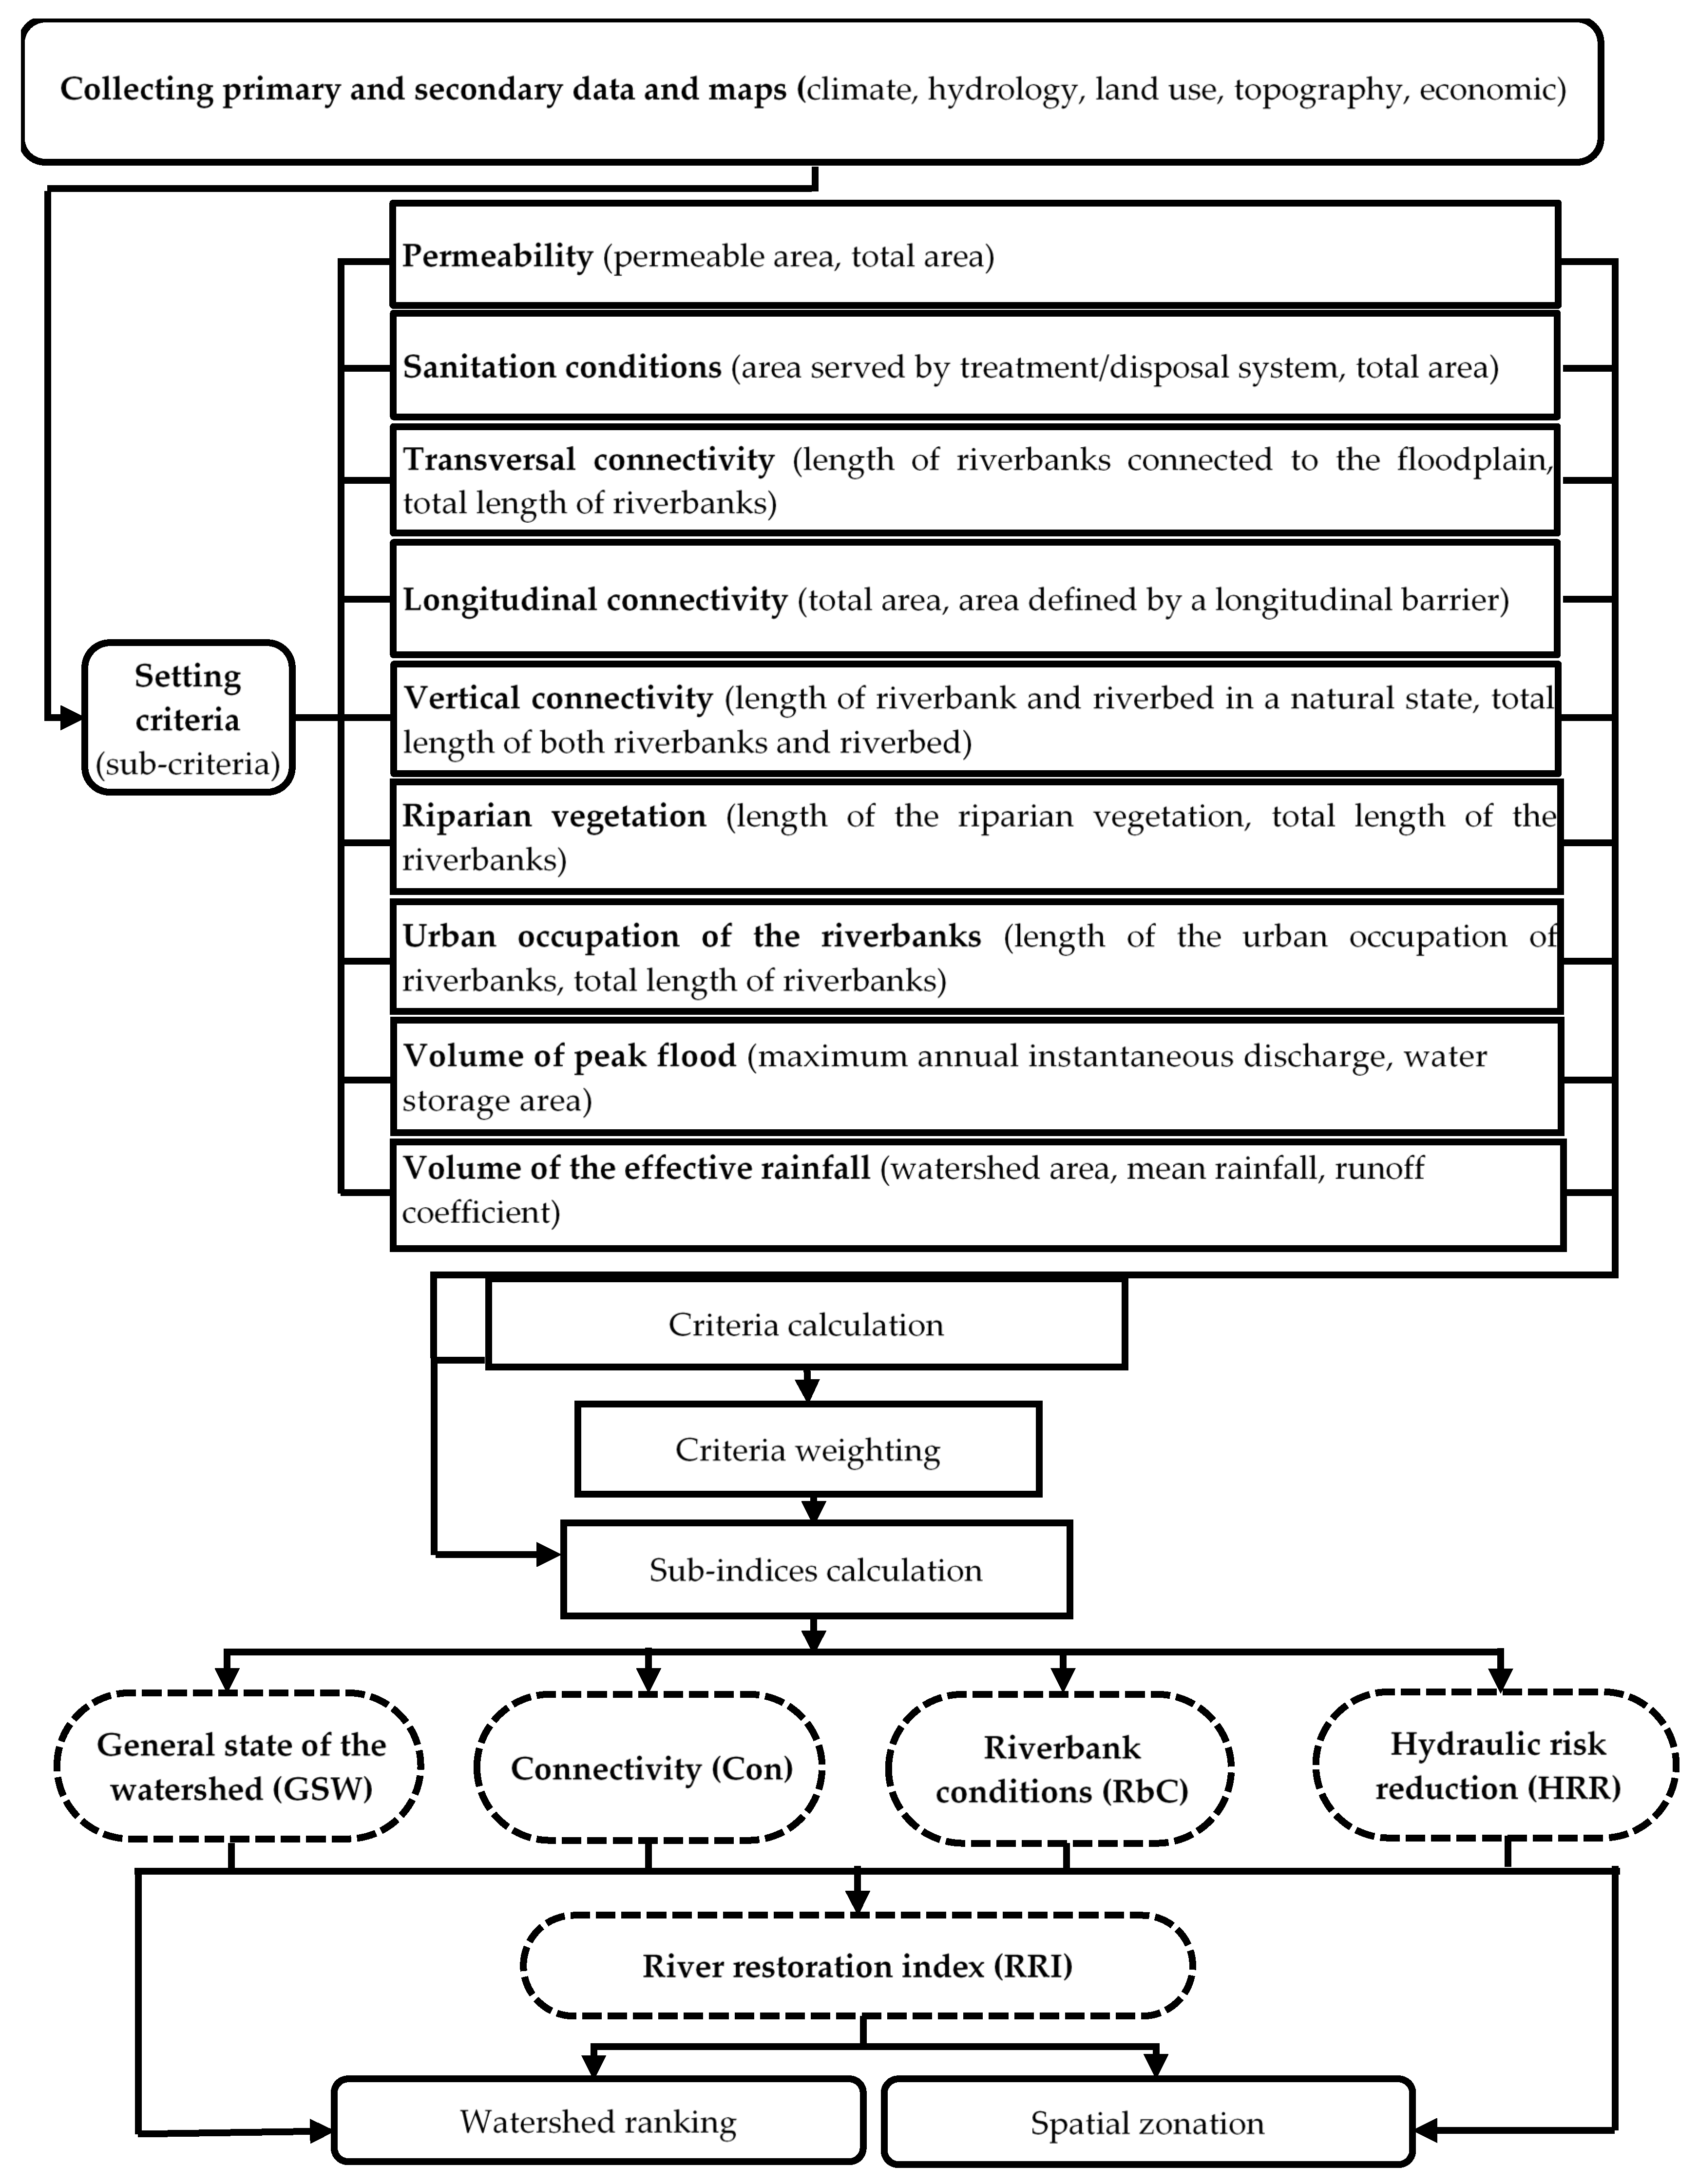
Figure 1. The overall workflow of the present research.
Earth 06 00006 g001
Figure 2. General view of the Samian Watershed, Ardabil Province, Iran (Right); its land use map (Left). The numbers on the map represent the sub-watersheds number.
Earth 06 00006 g002
Figure 3. Sub-watershed zoning based on permeability (left) and sanitation conditions (right).
Earth 06 00006 g003
Figure 4. Sub-watershed zoning based on vertical (left), transversal (middle), and longitudinal (right) connectivity.
Earth 06 00006 g004
Figure 5. Sub-watershed zoning based on the riparian vegetation along the riverbanks (left) and urban occupation of the riverbank (right) criteria.
Earth 06 00006 g005
Figure 6. Sub-watershed zoning based on maximum annual instantaneous discharge (left) and discharge of effective rainfall (right) criteria.
Earth 06 00006 g006
Figure 7. Sub-watershed zoning based on the general state of the watershed (GSW), connectivity (Con), riverbank conditions (RbC), and hydraulic risk reduction (HRR).
Earth 06 00006 g007
Figure 8. Sub-watershed zoning based on the river restoration index (RRI).
Earth 06 00006 g008
Figure 9. Sub-watershed ranking for river restoration index (RRI) based on ORESTE method.
Earth 06 00006 g009
Table 1. Results of weighting criteria and sub-indices.
Sub-IndicesGeneral State of the Watershed (GSW)Connectivity (Con)Riverbank Conditions (RbC)Hydraulic Risk Reduction (HRR)
Weight0.360.160.320.16
CriteriaPermeabilitySanitation conditionsTransversalLongitudinalVerticalRiparian vegetationUrban occupation of the riverbanks-
Weight0.880.120.480.370.150.540.46-
Table 2. Sub-watersheds ranking for river restoration index (RRI) and its sub-indices.
Sub-Watershed No.General State of the Watershed (GSW)Absolute Rank *Connectivity (Con)Absolute RankRiverbank Conditions (RbC)Absolute RankHydraulic Risk Reduction (HRR)Absolute RankRiver Restoration Index (RRI)Absolute Rank
10.3616.50.5062.00.2423.50.8576.50.42178.5
20.3714.50.5062.00.2520.00.8651.50.43148.0
30.4310.00.5062.00.336.50.8671.50.48150.0
40.3813.50.5062.00.1071.50.8831.00.39178.0
50.2325.50.5062.00.1253.00.8288.00.33228.5
60.506.50.5095.50.2034.50.7591.00.44227.5
70.3912.00.5062.00.2231.00.8287.00.42192.0
80.582.50.46106.00.3016.50.8820.00.52145.0
90.564.50.5062.00.3210.00.8825.50.53102.0
100.651.00.5062.00.382.50.8579.00.57144.5
110.3320.00.5092.00.1742.00.8481.50.39235.5
120.0238.50.20107.00.0180.00.8748.00.18273.5
130.3022.00.5062.00.1350.00.8836.50.37170.5
140.458.00.5095.50.3213.50.954.50.50121.5
150.2229.00.49103.00.1545.00.9210.00.35187.0
160.2227.50.5062.00.0873.00.8914.50.33177.0
170.1531.00.5099.00.0775.00.8574.00.29279.0
180.3418.00.5062.00.2227.50.8842.00.41149.5
190.0534.50.5062.00.0181.50.52100.00.18278.0
200.00146.50.5062.00.0278.00.7890.00.21276.5
210.0436.50.5062.00.1262.00.8189.00.26249.5
220.0142.00.49104.00.00483.00.6798.00.19327.0
230.00146.50.5062.00.0376.50.8651.50.23236.5
240.2523.50.49105.00.1738.50.7393.00.34260.0
250.0240.00.49102.00.0085.50.6897.00.19324.5
260.0733.00.5062.00.0085.50.6894.00.21274.5
270.00644.00.4910.00.1449.00.8384.00.26187.0
Disclaimer/Publisher’s Note: The statements, opinions and data contained in all publications are solely those of the individual author(s) and contributor(s) and not of MDPI and/or the editor(s). MDPI and/or the editor(s) disclaim responsibility for any injury to people or property resulting from any ideas, methods, instructions or products referred to in the content.