Article

Measuring Livelihood Resilience in Multi-Hazard Regions: A Case Study of the Khuzestan Province in the Persian Gulf Coast

by
Abdulsalam Esmailzadeh
1,
Mahmoud Arvin
2,
Mohammad Ebrahimi
3,
Mohammad Kazemi Garajeh
4,* and
Zahra Afzali Goruh
5
1
Department of Urban Planning, Faculty of Social Science, Allameh Tabataba’i University, Tehran 1544915113, Iran
2
Department of Human Geography, Faculty of Geography, University of Tehran, Tehran 1417935840, Iran
3
Department of Urban Planning, University of Larestan, Lar 7431716137, Iran
4
Department of Civil, Constructional and Environmental Engineering, Sapienza University of Rome, 00185 Rome, Italy
5
Department of Geography, Faculty of Human, University of Zanjan, Zanjan 4537138791, Iran
*
Author to whom correspondence should be addressed.
Earth 2024, 5(4), 1052-1079; https://doi.org/10.3390/earth5040054
Submission received: 19 September 2024 / Revised: 3 December 2024 / Accepted: 5 December 2024 / Published: 20 December 2024

Abstract

:
Assessing community-level resilience and implementing strategies to enhance it are essential for maintaining fundamental community functions, coping with and mitigating risks, effectively reducing hazards, and promoting sustainable regional development. Accordingly, this study aimed to measure hazard exposure and livelihood resilience in the counties of Khuzestan Province. Hazard exposure to earthquakes, flooding, and drought was evaluated using decision-making techniques within a geographic information system (GIS). Additionally, a multi-criteria decision-making approach incorporating eight indicators was employed to calculate the integrated livelihood resilience indicator for the counties. The results indicated that the northern and northeastern counties exhibit the highest potential for flooding and earthquake hazards, whereas the southern and southwestern counties are most vulnerable to flooding and drought. Moreover, Dezful, Shadegan, and Ahvaz counties demonstrated the highest levels of livelihood resilience, while Lali, Haftkel, and Andika counties exhibited the lowest levels. Assessing hazard exposure and livelihood resilience represents critical steps in risk reduction management programs and initiatives. Evaluating community-level livelihood resilience in multi-hazard areas is a vital component in advancing the global objectives of the Sendai Framework for Disaster Risk Reduction and the Sustainable Development Goals.

1. Introduction

Every year, many regions across the world are prone to various natural hazards such as landslides, earthquakes, floods, volcanic eruptions, and fires [1]. These events can result in casualties, the destruction of vital infrastructure, and significant economic losses. The increasing global communication followed by the expansion of technological dependence and continuous population growth [2] has gradually made modern global society more vulnerable to such destructive natural phenomena. Hence, relatively small events that had mainly local effects in the past currently cause considerable economic losses and indirectly affect other parts of the population, both at the regional and global levels [3].
To date, most of the scientific findings on hazard assessment and hazard management protocols focus on hazards and particularly individual hazards. However, in addition to single hazards, the interaction between natural hazards (e.g., earthquakes and riverbed blockages that lead to floods) and hazardous events that coincide in time and place [4,5] may affect communities. The number of multi-hazard scholarly studies has increased over the past years [6,7,8]. Multi-hazard scenarios, in which several dangerous phenomena may occur simultaneously or sequentially, have not yet been well framed and introduced, and we do not still have a thorough understanding of the potential (cause/effect) interrelationships between different hazards and their related and potential effects [8].
The number of people affected by natural hazards is increasing in many regions of the world due to population growth and urbanization, especially in developing countries [9]. The countries and regions that are most exposed to destructive natural hazards are also home to the world’s poorest population. Furthermore, the occurrence of natural disasters in sensitive and fragile socio-economic areas leads to catastrophes [10]. Thus, such hazards have sudden, dramatic, and long-term effects on people’s well-being and livelihood [11]. People’s livelihoods are dynamic and intertwined with the environment [12]. A community’s livelihood system is the core component of the social system that may be disrupted by environmental, financial, natural, and man-made vulnerabilities [13,14]. Livelihood resilience integrates livelihood systems with resilience in such a way that people are the main actors in adaptation practices. Livelihood resilience is a self-adaptive iterative system that transforms existing resources into a tool to save and provide people’s livelihoods in the face of natural disasters [15]. Accordingly, the community’s preparedness to cope with multiple or simultaneous hazards can reduce the damages caused by these hazards. Thus, studies need to address how communities face climate and non-climate changes. Livelihood resilience assessment can identify vulnerable people and the context leading to natural hazards by examining their different capacities. As a result, such assessment can contribute to identifying all effective risk-reduction strategies [16].
Several studies have addressed resilience and livelihood resilience and their different dimensions, including disaster management [15,17], livelihood resilience [18,19], and livelihood vulnerability [20,21]. Although many studies have focused on livelihood resilience, there are still some scientific gaps in the assessment of livelihood resilience [22]. In addition, more efficient strategies need to be taken to assess the livelihood resilience of regions in different geographical locations [23] and to depict their spatial characteristics. The studies in the literature have addressed livelihood resilience separately from the multi-hazard phenomenon. Studies on livelihood resilience have not focused on identifying natural and human risks affecting the studied society. Livelihood resilience at the regional level has been examined using questionnaire-driven data with a small sample size [24]. To this end, the current study aims to explore both fields objectively and integratively at the regional level. Accordingly, this study examines livelihood resilience against natural hazards including floods, earthquakes, and droughts in the counties in Khuzestan Province. Hence, the most important difference between the present study and previous studies on resilience is its focus on a geographical and regional scale. Furthermore, while most studies have focused on a single hazard, the present study addresses multi-hazards, as Iran is one of the most hazard-prone countries in the world [25]. An innovative aspect of this study was the use of a combination of MCDM and GIS techniques to identify multi-hazard zones and calculate the composite livelihood resilience index, especially on a regional scale and with an emphasis on the special characteristics of Khuzestan Province.
Different regions in Iran vary in terms of sensitivity to risks [26]. Khuzestan Province is prone to hazardous weather events, such as thunderstorms, floods, droughts, strong winds, dust storms, and heat waves, due to its geographical location and environmental diversity in height and ruggedness and geological and hydrological structure, leading to substantial human, financial, and economic losses and livelihood and social problems [27]. Khuzestan Province has significant features such as high population density, a large area, climate diversity, and potential environmental capacities that can be used in the agricultural, industrial, and tourist sectors [28]. This research focused on reducing the risk of hazards and increasing the resilience of the community and used a combination of MCDM and GIS techniques to identify the multi-hazard zones in Khuzestan Province and calculate the livelihood resilience index for different counties in the province. This study sought to develop a framework for identifying multiple climatic hazards and examining livelihood resilience in different regions in the province so that planners can more effectively address comprehensive development and risk reduction at the regional level. Thus, the two main goals pursued in the study are to evaluate the multi-hazard index at the regional level to identify the areas with the highest intensity of climatic hazards and to evaluate the livelihood resilience at the regional level to analyze the ability of local communities to cope with and adapt to these hazards. Theoretically, the findings from this study can contribute to developing an integrated framework of spatial scale distribution of livelihood resilience in multi-hazard areas. Practically, this study can contribute to a better understanding of effective strategies for increasing resilience in areas that are exposed to multiple hazards and pave the way for implementing risk reduction plans and promoting sustainable regional development. Accordingly, the current study seeks to answer how the multi-hazard index can be evaluated at the regional level to identify the areas with the highest level of exposure to climatic hazards and how is the livelihood resilience of the counties in Khuzestan Province when faced with climatic hazards?

2. Literature Review

2.1. Livelihood Resilience

Livelihood is a means of survival, life, and production, which is necessary for the sustainable development of the community and its members. According to Scoones, livelihood refers to capabilities, assets, and actions needed for life, while Ellis believes that livelihood is a way of survival that is closely associated with income [24]. In recent decades, the conceptual framework and precise empirical indicators for community resilience have been developed in the planning literature to reduce vulnerability to hazards [29]. These indicators include social, economic, cultural, political, environmental, and financial factors and their interactions with each other [23].
The concept of livelihood resilience has been derived from ecosystem resilience, which was first introduced in the field of ecology, where “resilience” is defined as the ability of a system to return to a state of equilibrium after a disturbance. It also refers to the ability to maintain the livelihood of a community located in an ecological region despite shocks and changes [30,31]. Livelihood resilience is a combination of the concepts of resilience and livelihood, which is summarized and applied to all community levels to examine the resilience of subjects at different levels after disturbances, stress, and shocks. Livelihood resilience is a process in which a community or household can cope with changes and absorb them, and as a result, has alternative strategies to adapt to changes and shocks [32].
Livelihood resilience has been explicitly and implicitly emphasized in a range of UN Sustainable Development Goals for 2030. Livelihood resilience is defined as the capacity of all people over generations to maintain and improve their livelihood opportunities and well-being despite environmental, economic, social, and political disturbances [33]. Livelihood resilience can be perceived in terms of flexibility capacity (e.g., absorbing, adaptive, and transforming) and different dimensions of livelihood conditions (e.g., social, economic, financial, cultural, environmental aspects, etc.) [34].

2.2. Regional Livelihood Resilience Assessment

Livelihood resilience research has been widely focused on various fields such as climate change, natural disaster management, food security, social ecology, and sustainable development [35,36]. Furthermore, concerning research perspectives and scales, several studies have addressed livelihood resilience at the macro, medium, and micro levels, which cover different research scales such as national, regional, social, and household scales [37]. Understanding how to make livelihoods resilient to an uncertain future is crucial because livelihood systems must adapt to local and regional climate change. Assessing resilience from the perspective of social and environmental production is a basic prerequisite for the sustainable interaction of humans and nature in the region [38]. Regional resilience has a two-way relationship with regional development and emphasizes the institutional capacities, behavior, culture, and political participation of institutions and people in critical situations [39]. Foster has defined regional resilience as the region’s ability to anticipate, prepare, respond, and recover after a disturbance. Moreover, Hill et al. have defined regional resilience as the region’s ability to successfully recover economically after a shock. that has diverted the system from the path of growth and stability [40].

2.3. Multi-Hazard Events

Natural hazards are inherently complex phenomena. The historical observed data of the 21st century show that climate change has led to an increase in the intensity, frequency, and impact of serious weather events (heavy rain, drought, hail, flood, frost, etc.) in many regions [41,42]. Other types of events not related to weather, such as earthquakes and volcanic eruptions, have not increased in frequency and number, but the impact of both types of events has shown an increasing trend.
The term “multi-hazard” has its origin in international policies and is mainly used in the field of risk reduction. The first reference is the 21st agenda of the United Nations for sustainable development, which was used in “a comprehensive multi-hazard study on the risk and vulnerability of human settlements and settlement infrastructure” to aid pre-disaster planning of human settlements in disaster-prone areas. This term reappeared in the UN Federal Emergency Management Agency [43], specifying the “need for coordinated, multi-hazard approaches” to natural disaster mitigation, particularly for the “design and construction of buildings” [44]. Although many risk assessment studies refer to “multi-hazard events”, the risk assessment of multi-hazard events is a relatively new field, especially when it is performed quantitatively (under uncertainty). In recent years, numerous studies have addressed this subject, but they have failed to use well-developed approaches. The existing literature on risk assessment of empirical or deterministic multi-hazard events has only focused on two or groups of hazards by experts from different fields [39]. Given that a region or infrastructure may be exposed to different types of risks, all multi-hazard event assessment studies do not consider all processes related to a defined region but consider them as multi-hazard approaches without taking into account the relationship between the hazards and/or their cumulative effect [45,46].
Nevertheless, the concept of “multi-hazard events”, which are multiple simultaneous or non-simultaneous events that a region can be exposed to, has been described by other related terms along with the evolution of multi-hazard analyses [47], including “composite events”, “composite extremes”, “composite impacts”, “composite hazards”, or “events with multiple factors in succession” (such as ocean and river floods, droughts, and heat waves). They may not necessarily be serious events individually, but they can nevertheless lead to severe effects [48]. Thus, the multi-hazard scenarios resulting from these combined events are often neglected in many risk assessment and design programs [44].

3. Study Area and Dataset

3.1. Study Area

Khuzestan Province, with an area of 64,057 km2, is located at 31.4360° N and 49.0413° E in the southwest of Iran and borders the Persian Gulf in the south and Iraq in the west. The north and east of Khuzestan Province are covered by the Zagros Mountain Range, with its height decreasing as we move toward the southwest. Topographically, Khuzestan can be divided into two mountainous and plain regions. The mountainous region is mainly located in the north and east of the province, accounting for about two-fifths of the total area of the province (Figure 1).
Topographic heights in the province vary from 0 to 3742 m. Izeh is the highest county with an altitude of 760 m above sea level, and Hendijan is the lowest county with an altitude of 2 m above sea level. Given the geomorphological features of the plains and mountains, the province has different climatic conditions, with a hot and dry (to super dry) climate in the plains and a semi-humid to a semi-arid climate in the mountainous areas. The northern and northeastern regions have colder weather, and the temperature in the southern regions of the province reaches more than 50 °C in summer. Annual rainfall ranges from 150 to 260 mm in the south and 990 to 1100 mm in the north, with about 70% of annual rainfall events occurring from February to April. Moreover, annual evaporation is 2000–4000 mm [49].
The big rivers of Karkhe, Karun, Dez, and Maron flow in Khuzestan Province. According to the latest population and housing census (2015), the population of the province was equal to 4,710,509 persons, with 24.4% of them living in rural areas and 75.5% living in urban areas.

3.2. Procedure

This quantitative–observational study describes large-scale variables using multi-criteria decision-making and spatial analysis. This study aimed to measure livelihood resilience in the multi-hazard areas in Khuzestan Province. The unit of analysis in this study was the county. The study was conducted in two phases: In the first phase, multi-criteria decision-making (MCDM) methods were used in ArcGIS for spatial analysis of hazard exposure. In the second phase, decision-making methods were used to analyze the livelihood resilience of counties.
In this research, exposure was conceptualized as the degree and intensity of the impact of natural hazards (floods, earthquakes, and droughts) in different regions in Khuzestan Province, while livelihood resilience refers to the ability of communities to cope with and adapt to these hazards and maintain livelihoods. These two concepts are used as complementary variables in this study. This means that the areas with the highest level of exposure to various natural hazards are also evaluated in terms of livelihood resilience to determine their ability to deal with crises. This approach allows us to identify areas that are more severely at risk on the one hand and less resilient on the other hand, as the main priorities for planning and intervention. Examining these two concepts simultaneously allows us to identify more complex patterns of vulnerability and local capabilities. For example, an area that has a high level of exposure to natural hazards but lacks adequate livelihood resilience is a priority for emergency interventions. Conversely, areas with a higher level of resilience even when exposed to hazards may require fewer interventions.

3.2.1. Data Collection

The data in this study were collected from subject matter experts and registered and official data available in departments and organizations. Given the research problem and research design, and since the factors affecting the severity of environmental hazards are numerous and have varying degrees of effects, the experts were surveyed. Furthermore, the research design required the use of various climatic, natural, and economic data related to the counties to measure exposure and livelihood resilience. Thus, the exposure to floods, earthquakes, and drought was assessed using the data from the geological, meteorological, and environmental departments and the Khuzestan Governorate General. The data on livelihood resilience was collected from the population and housing census of Khuzestan Province from the website of the Iran Statistics Center and the statistical yearbooks of Khuzestan Province in the management and planning organization of the province. The data used to measure the three hazards of floods, earthquakes, and drought were retrieved from GIS layers after processing and editing. The livelihood resilience data were in a raw statistical format. Thus, they were converted into indices and ratios for further analysis. Raw data are usually the information collected and then further processed into understandable data. Raw data were collected directly from related sources and have not yet processed, organized, cleaned, or visualized. Once the data are cleaned and organized, they will help us make valuable decisions.

3.2.2. Exposure Assessment Indicators

Hazard as a complex issue has various elements with different spatial impact values. Thus, the use of spatial multi-criteria decision-making methods for hazard assessment in a spatial framework is undeniable. The multi-dimensional hazard assessment in Khuzestan Province focuses on a combination of earthquake, flood, and drought hazards, and sometimes a single indicator can represent multiple dimensions. However, its effect will be different for each risk. Table 1 shows the hazard assessment indicators and their weights and impacts for Khuzestan Province.

3.2.3. Livelihood Resilience Indicators

Despite the extensive literature on resilience and livelihood, it is difficult to operationalize, since it has various individual and structural aspects. Furthermore, combining livelihood and resilience theoretically and empirically requires considering various dimensions [52]. Livelihood resilience can be measured by analyzing resilience indicators such as income and access to food, agricultural assets, agricultural activity and technology, household adaptive capacity, access to basic services, enabling institutional environment, climate variability, and social safety networks [53,54]. Following the literature, research objectives, and data availability, the livelihood resilience indicators in Khuzestan Province were selected as shown in Table 2. Livelihood indicators represent the financial, physical, natural, social, and human assets of the community. Natural indicators, such as water, soil, and air; financial indicators, such as capital, savings, and credit; human indicators, such as skills and workability; social indicators, such as networks and associations; and physical indicators, including services and infrastructure, are livelihood resilience resources and data, and these assets and capital can overlap. As an example, natural capital can create financial capital [55]. In this study, the indicators were categorized into financial and economic, natural, and human indicators. The per capita financial savings and animal and garden products were used as financial and economic indicators; the area of irrigated lands, rainfed lands, and rangelands were considered as natural indicators; and men’s and women’s occupations were taken as human indicators.

4. Methodology

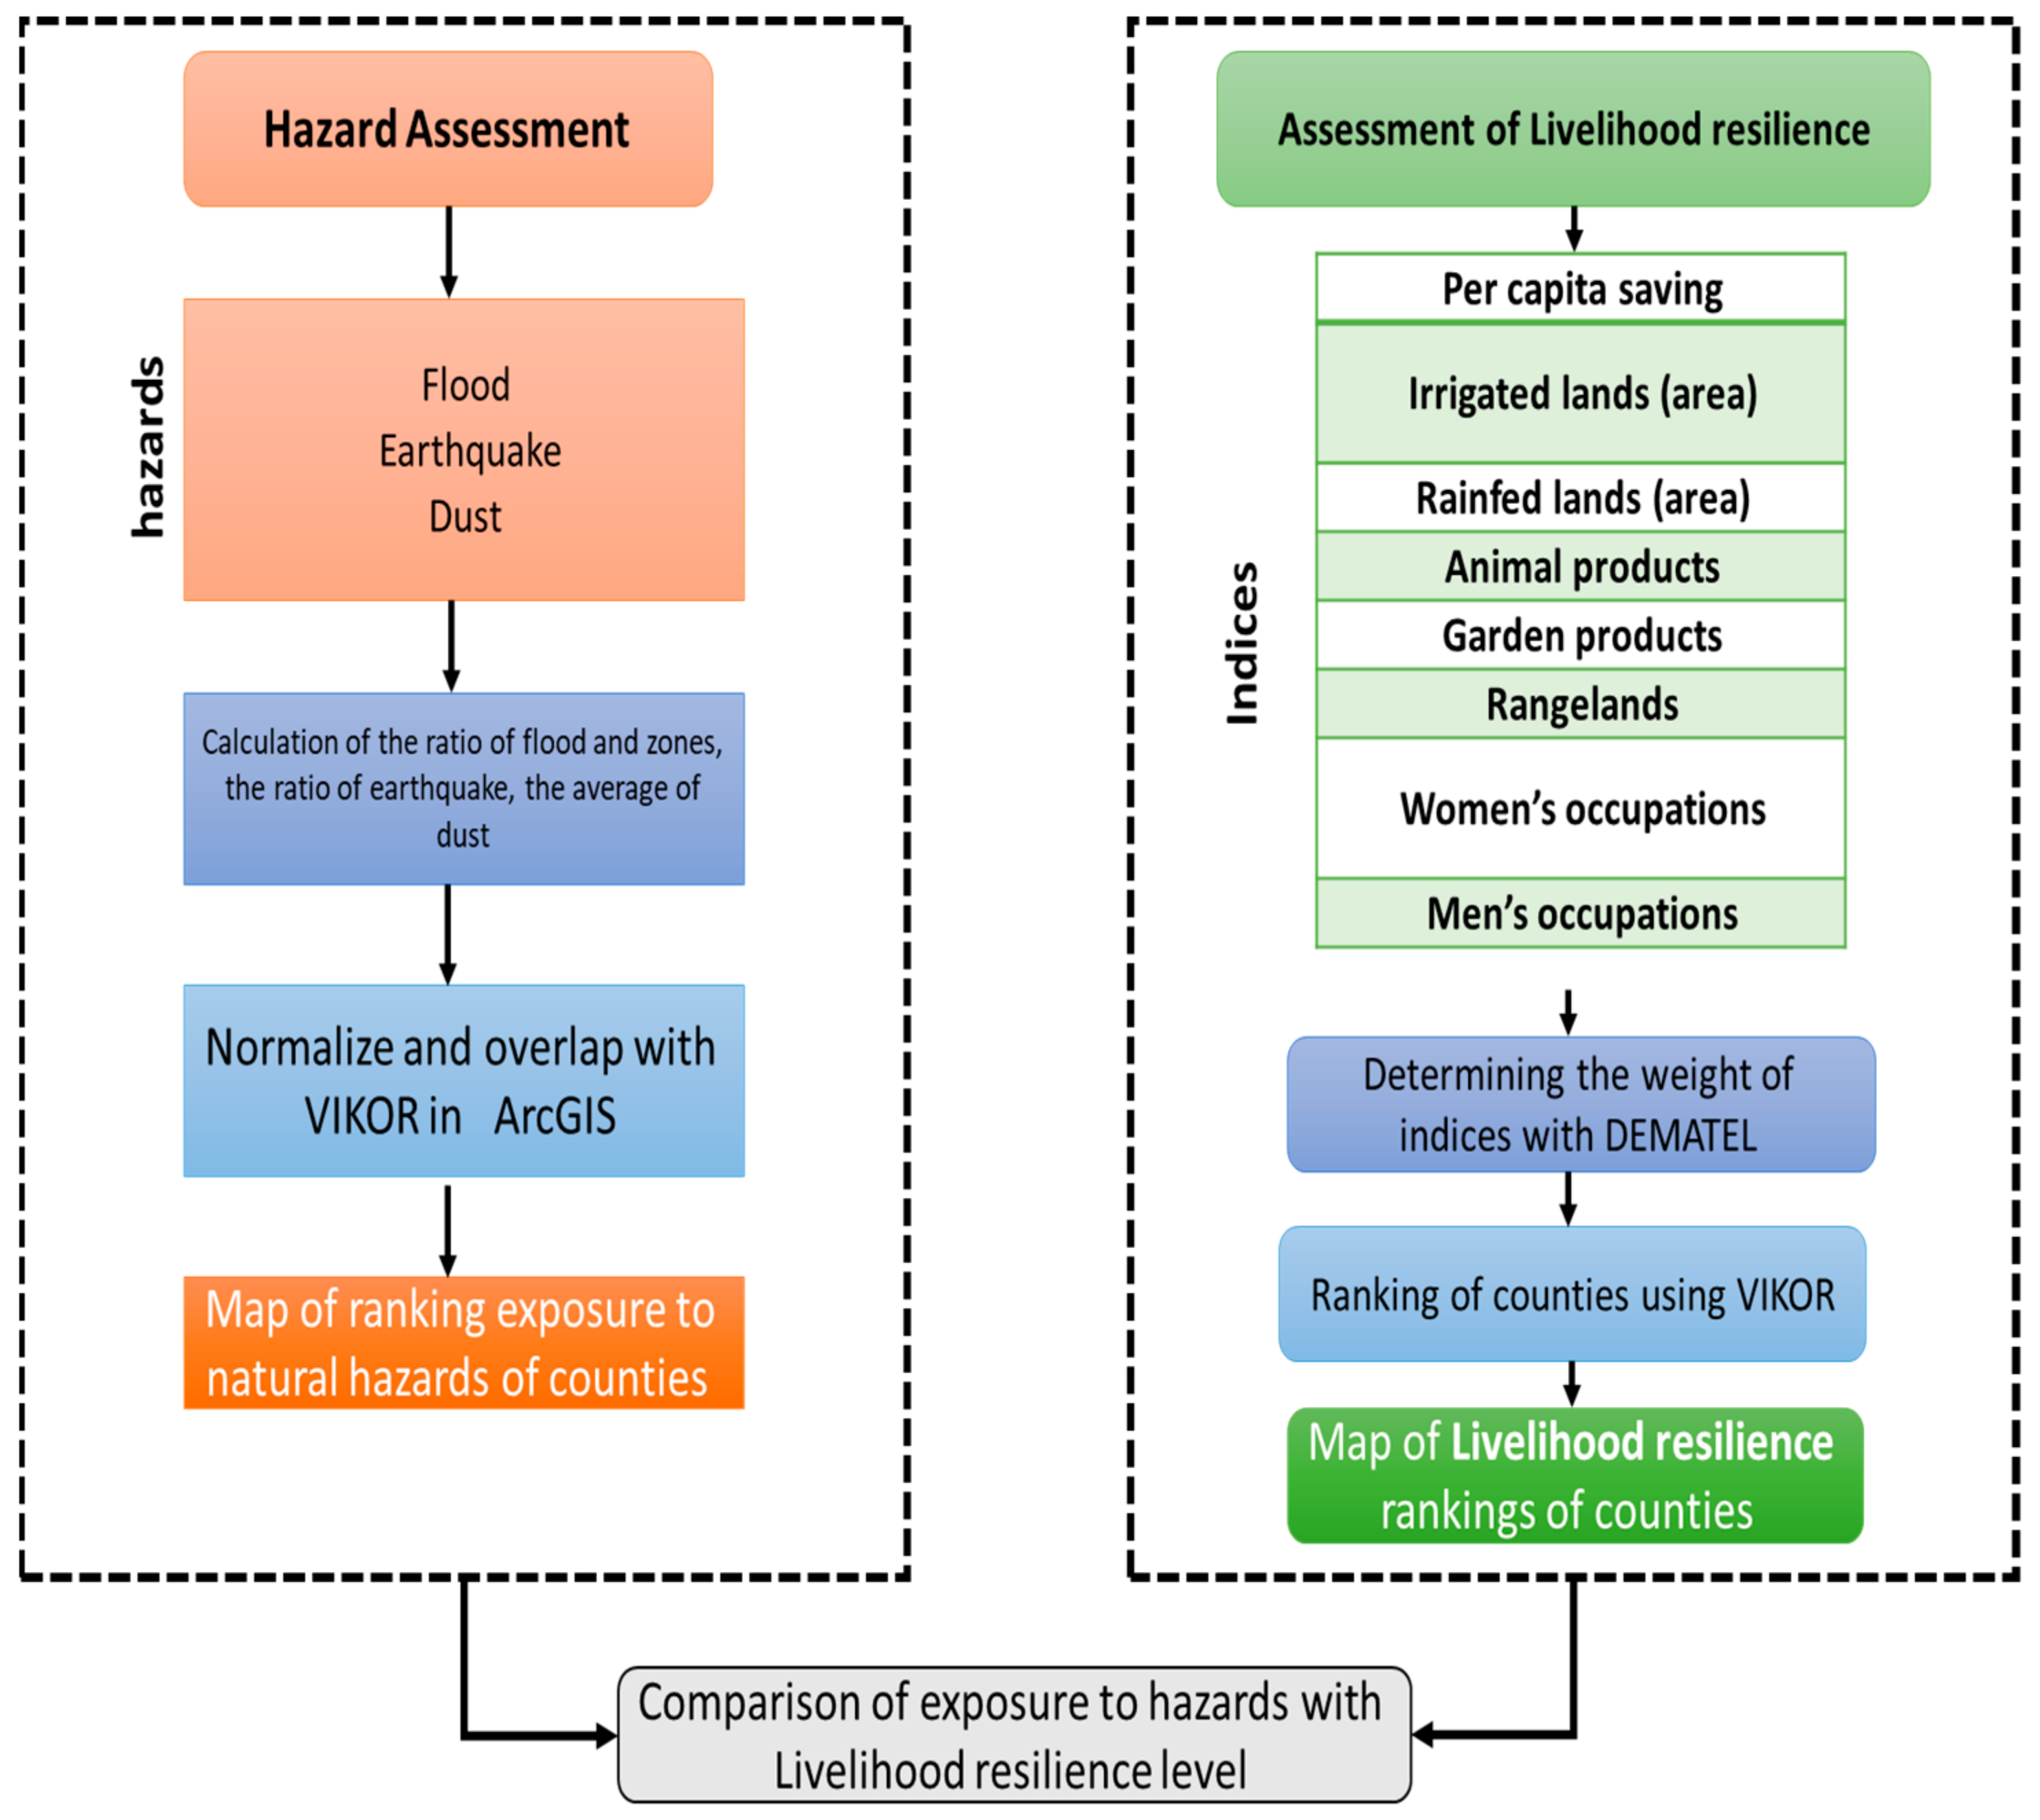
4.1. Measuring Exposure

Models are important because they make it possible to understand how the system behaves in situations where empirical analysis is not possible due to technical, economic, political, and ethical reasons. Moreover, ArcGIS 10.8 software, as a spatial modeling tool, is often known as a decision support system, but it lacks the mechanisms for integrating decision-making preferences and making choices related to objective evaluation and conflicting criteria. Given GIS restrictions to support the two stages of design and selection based on the decision-making process, combining GIS with MCDM techniques increases its spatial capabilities to solve spatial problems as a spatial decision-making support system [62]. In other words, GIS-based multi-criteria decision-making is, at a fundamental level, a set of techniques and procedures that transform and combine geographic data (input maps or criteria) and decision-maker preferences (criterion weights) into an overall value for each decision/alternative evaluation. In this case, the decision/output map shows that the analysis depends not only on the geographic distribution of alternatives but also on value judgments in the decision-making process. There is an argument that GIS-based multi-criteria decision-making increases productivity in the group decision-making process due to the provision of a flexible framework, and the stakeholders can investigate, understand, and guide the decision-making problem. The integration of GIS and MCDM can be assumed to be the process of integrating geographic data and judging the value of decision-makers to support information for decision-making purposes. Concerning natural hazards, multi-criteria decision-making approaches are widely adopted to measure vulnerability [63,64].
In this study, the multi-criteria decision-making technique was used for two purposes. First of all, the best-worst method was used to determine the relative weights of the criteria, and the VIKOR method was used to combine the digital layers related to each variable in the ArcGIS software. Finally, to analyze natural hazards by county, the average functions were used in Zonal Statistics. Figure 2 shows an overview of the applied methodology.
Data analysis in this study was performed in six steps, as follows:
Step 1: The formation of a spatial decision matrix (criterion map)
As stated earlier, spatial analysis was used in this study. To do so, each criterion was presented as a single layer in the GIS-based database. A criterion map represents the spatial distribution of an attribute based on which the degree of achievement of the goals associated with it is measured [65].
Step 2: Standardizing the criterion map
Reframing values based on membership in a set was also considered an aspect of the process of standardization of evaluation criteria [65]. In the VIKOR method, a linear function is used for standardization. Thus, Equation (1) is used for incremental criteria (with higher values), and Equation (2) is used for decreasing criteria (with lower values). In linear standardization, n i j represents the standardized score for the problem (alternative) i and attribute j, a i j represents the raw value, and max a i j also specifies the maximum value for attribute j, written as follows:
n i j = a i j max a i j
n i j = 1 a i j max a i j
Step 3: Creating layers for the weighted standardized map
The importance coefficients for the criteria for each hazard were specified by examining the relationship between the criteria using the best-worst method. As can be seen, the results indicated that the distance from the fault for earthquakes, the distance from the river for floods, and precipitation for drought are the most important criteria used to evaluate natural hazards in Khuzestan Province. At this step, all the criteria obtained from the previous step are multiplied by the obtained weights to be used in the next steps.
Step 4: Specifying the positive and negative ideal point
f j * is the best positive ideal solution for criterion j. We will have an optimal combination with the highest score by connecting all f j * values, written as follows:
f i * = j   m a x f i j = m a x ( f i j )   j = 1,2 ,   ,   m
f j is the worst negative ideal solution for criterion j. We will have an optimal combination with the lowest score by connecting all f j values, written as follows:
f i = j   m i n f i j = m i n ( f i j )   j = 1,2 ,   ,   m
Step 5: Calculating the utility (SJ) and regret (RJ) values
SJ represents the distance of alternative i from the positive ideal solution (the best combination), written as follows:
L 1 , i = S J = i = 1 n w i ( f i * f i j ) / ( f i * f )
Ri represents the distance of alternative i from the negative ideal solution (the worst combination), written as follows:
L , i = R J = m a x w i ( f i * f i j ) / ( f i * f )
Step 6: Calculating the VIKOR value (Qi)
In this step, the VIKOR index representing the final score of each alternative is calculated, with lower values showing the higher utility of the alternative and the extent to which the decision-making goal is achieved, written as follows:
Q j = v S j S S S + ( 1 v ) R j R R R
where S = M a x i S i , S * = M a x i S i , R = M a x i R i , R * = M a x i R i , and v is the weight of the strategy of the majority in favor of the criterion or the maximum group utility.

4.2. Assessing the Livelihood Resilience of the Counties in Khuzestan Province

  • Step 1: To form the raw matrix, the counties were considered as alternatives. Then, the data for each indicator were collected based on data availability and the conditions governing the province.
  • Step 2: The indicators have different effects on the livelihood resilience of the counties. Thus, the DEMATEL weighting method was used to calculate the weights of the indicators.
  • Step 3: To calculate the final VIKOR values, the weights obtained in the previous step were multiplied in the raw data matrix. Any county with a VIKOR value closer to zero has a better situation, and a county with a value close to one has a worse situation. If the final VIKOR value for an alternative is closer to zero, it has a higher position in terms of livelihood resilience.
To calculate the integrated livelihood resilience index, the VIKOR method, as a multi-criteria decision-making model, was used. It has been shown that multi-criteria decision-making (MCDM) is an effective method for ranking resilience and livelihood resilience indicators [24]. MCDM allows for quantifying the importance of all criteria and integrating them into a composite index. The VIKOR model is one of the models used in measuring resilience and vulnerability. The purpose of VIKOR is to rank the available alternatives by considering conflicting criteria. The ranking shows the largest value to the smallest value (ascending order), with the smallest value being the best alternative [66]. In this study, using VIKOR, the counties were ranked in terms of livelihood resilience indicators.

5. Results

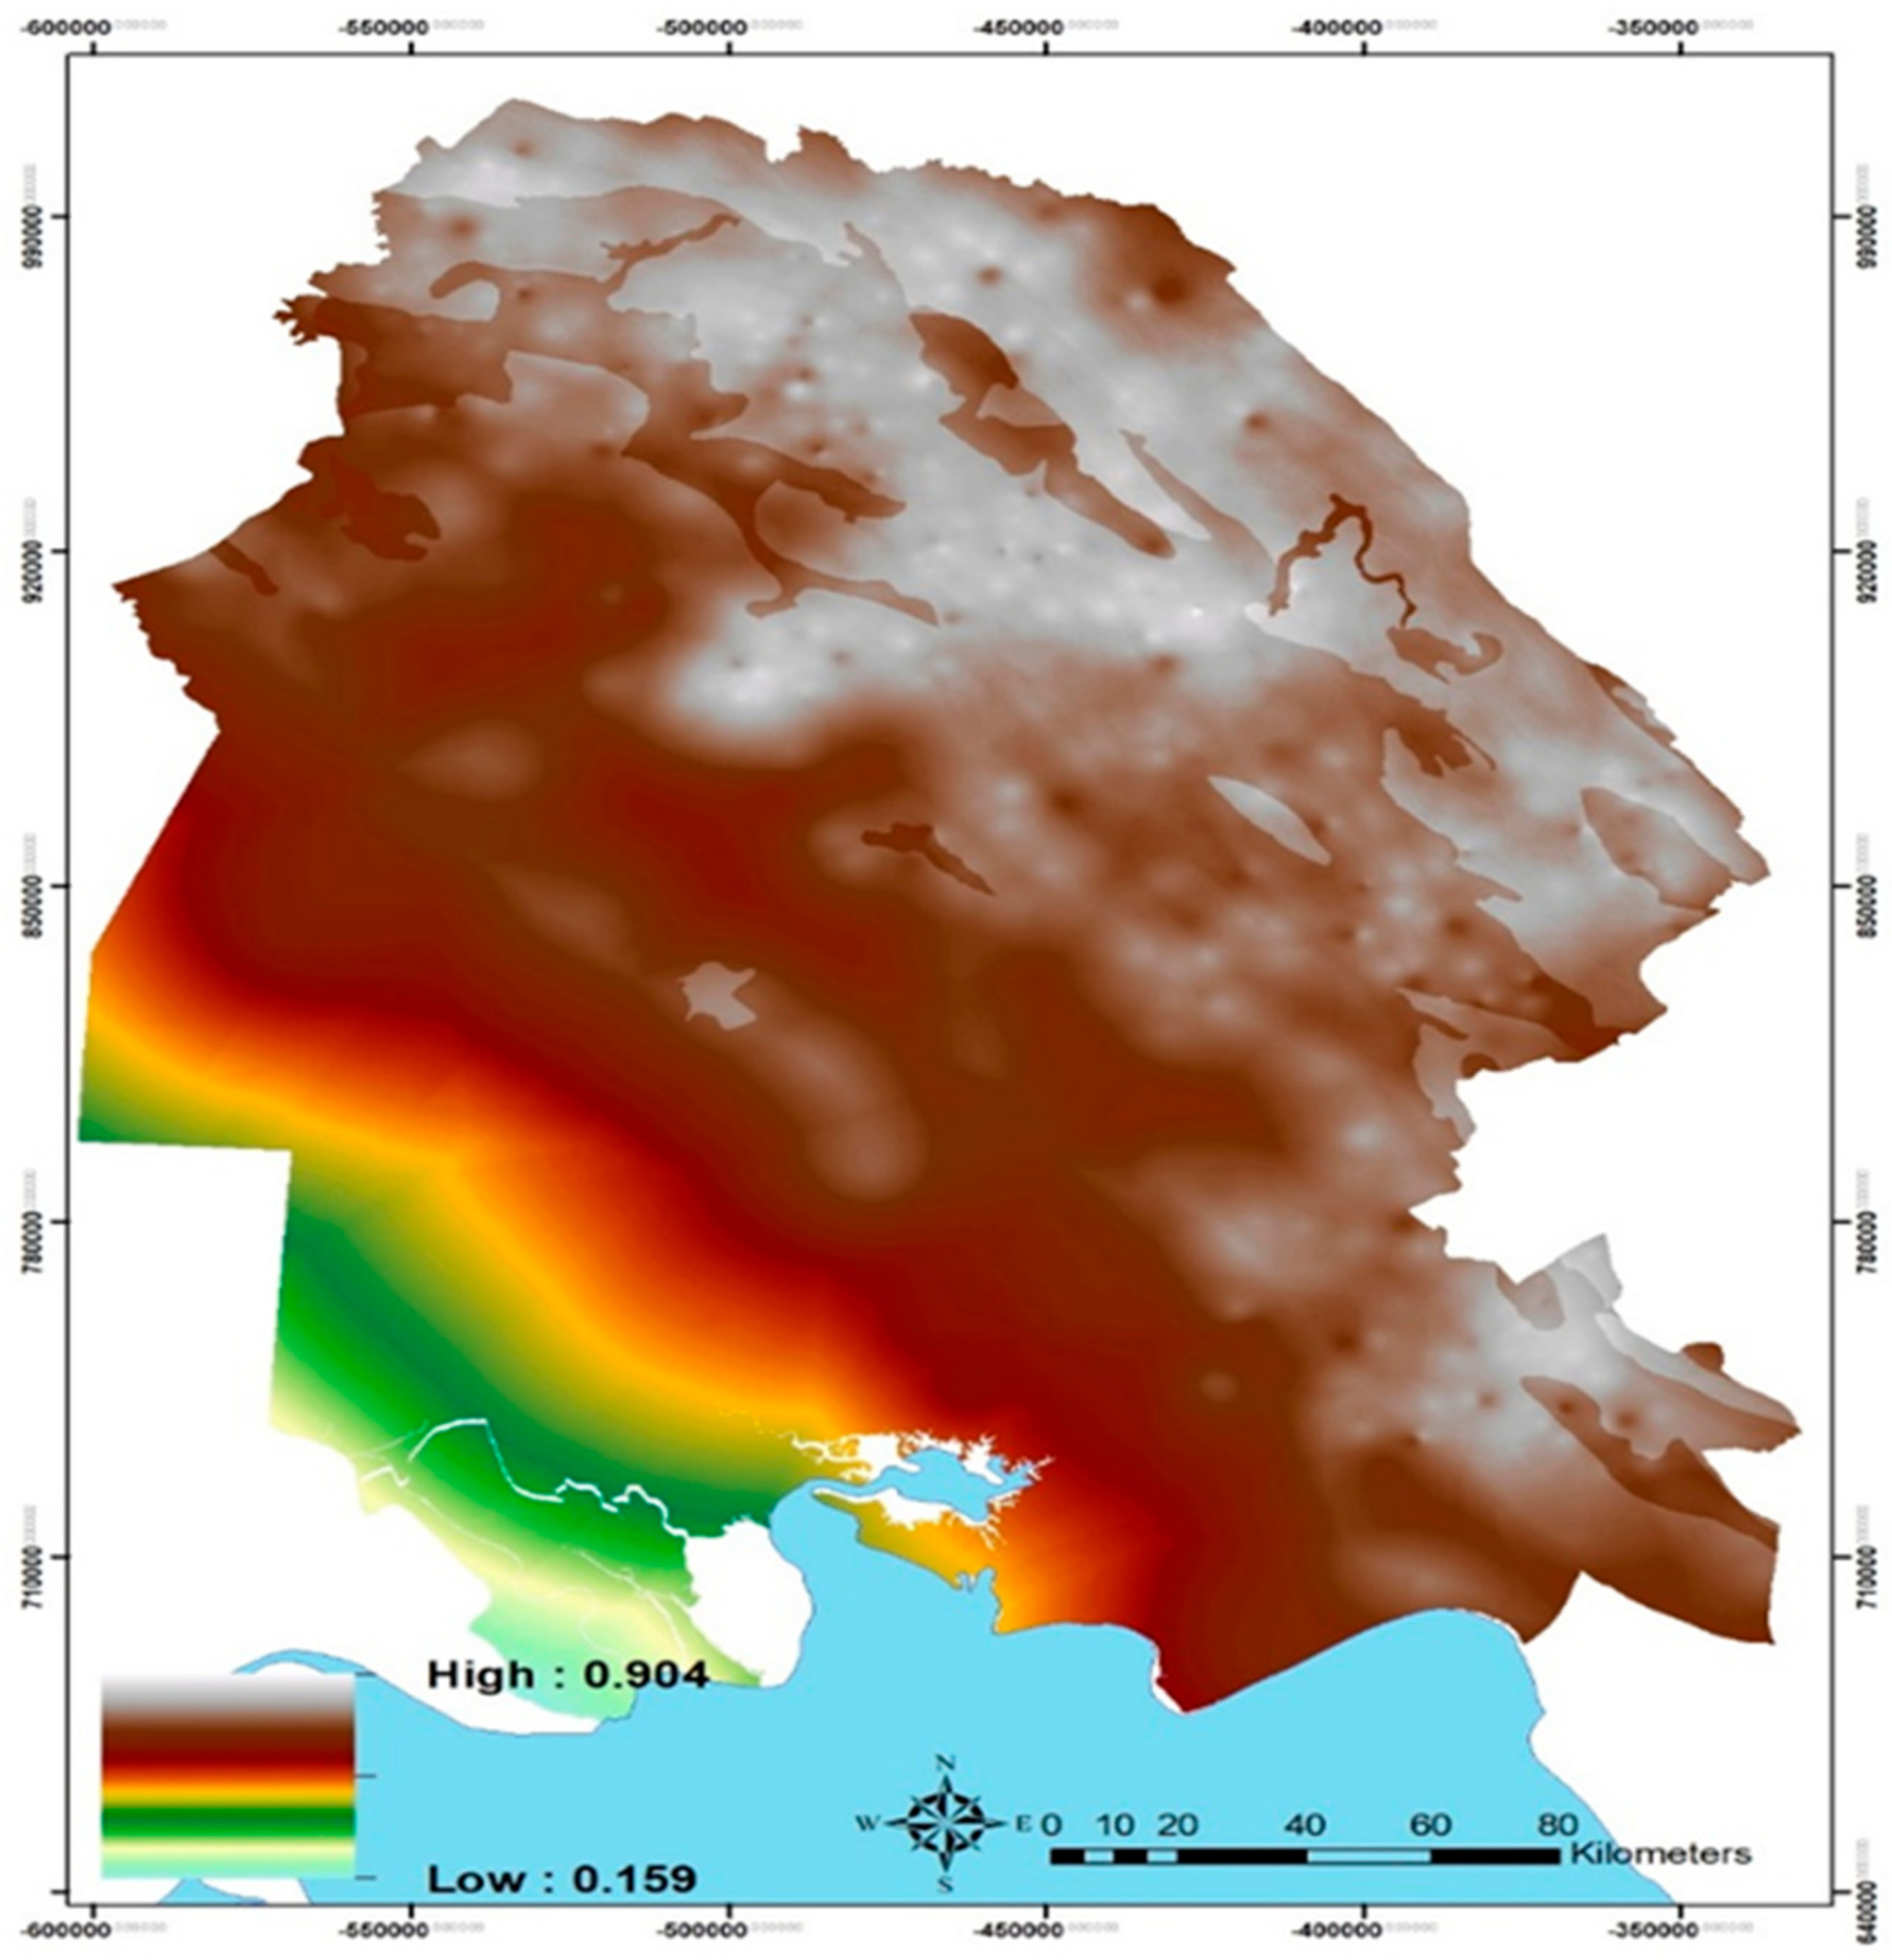
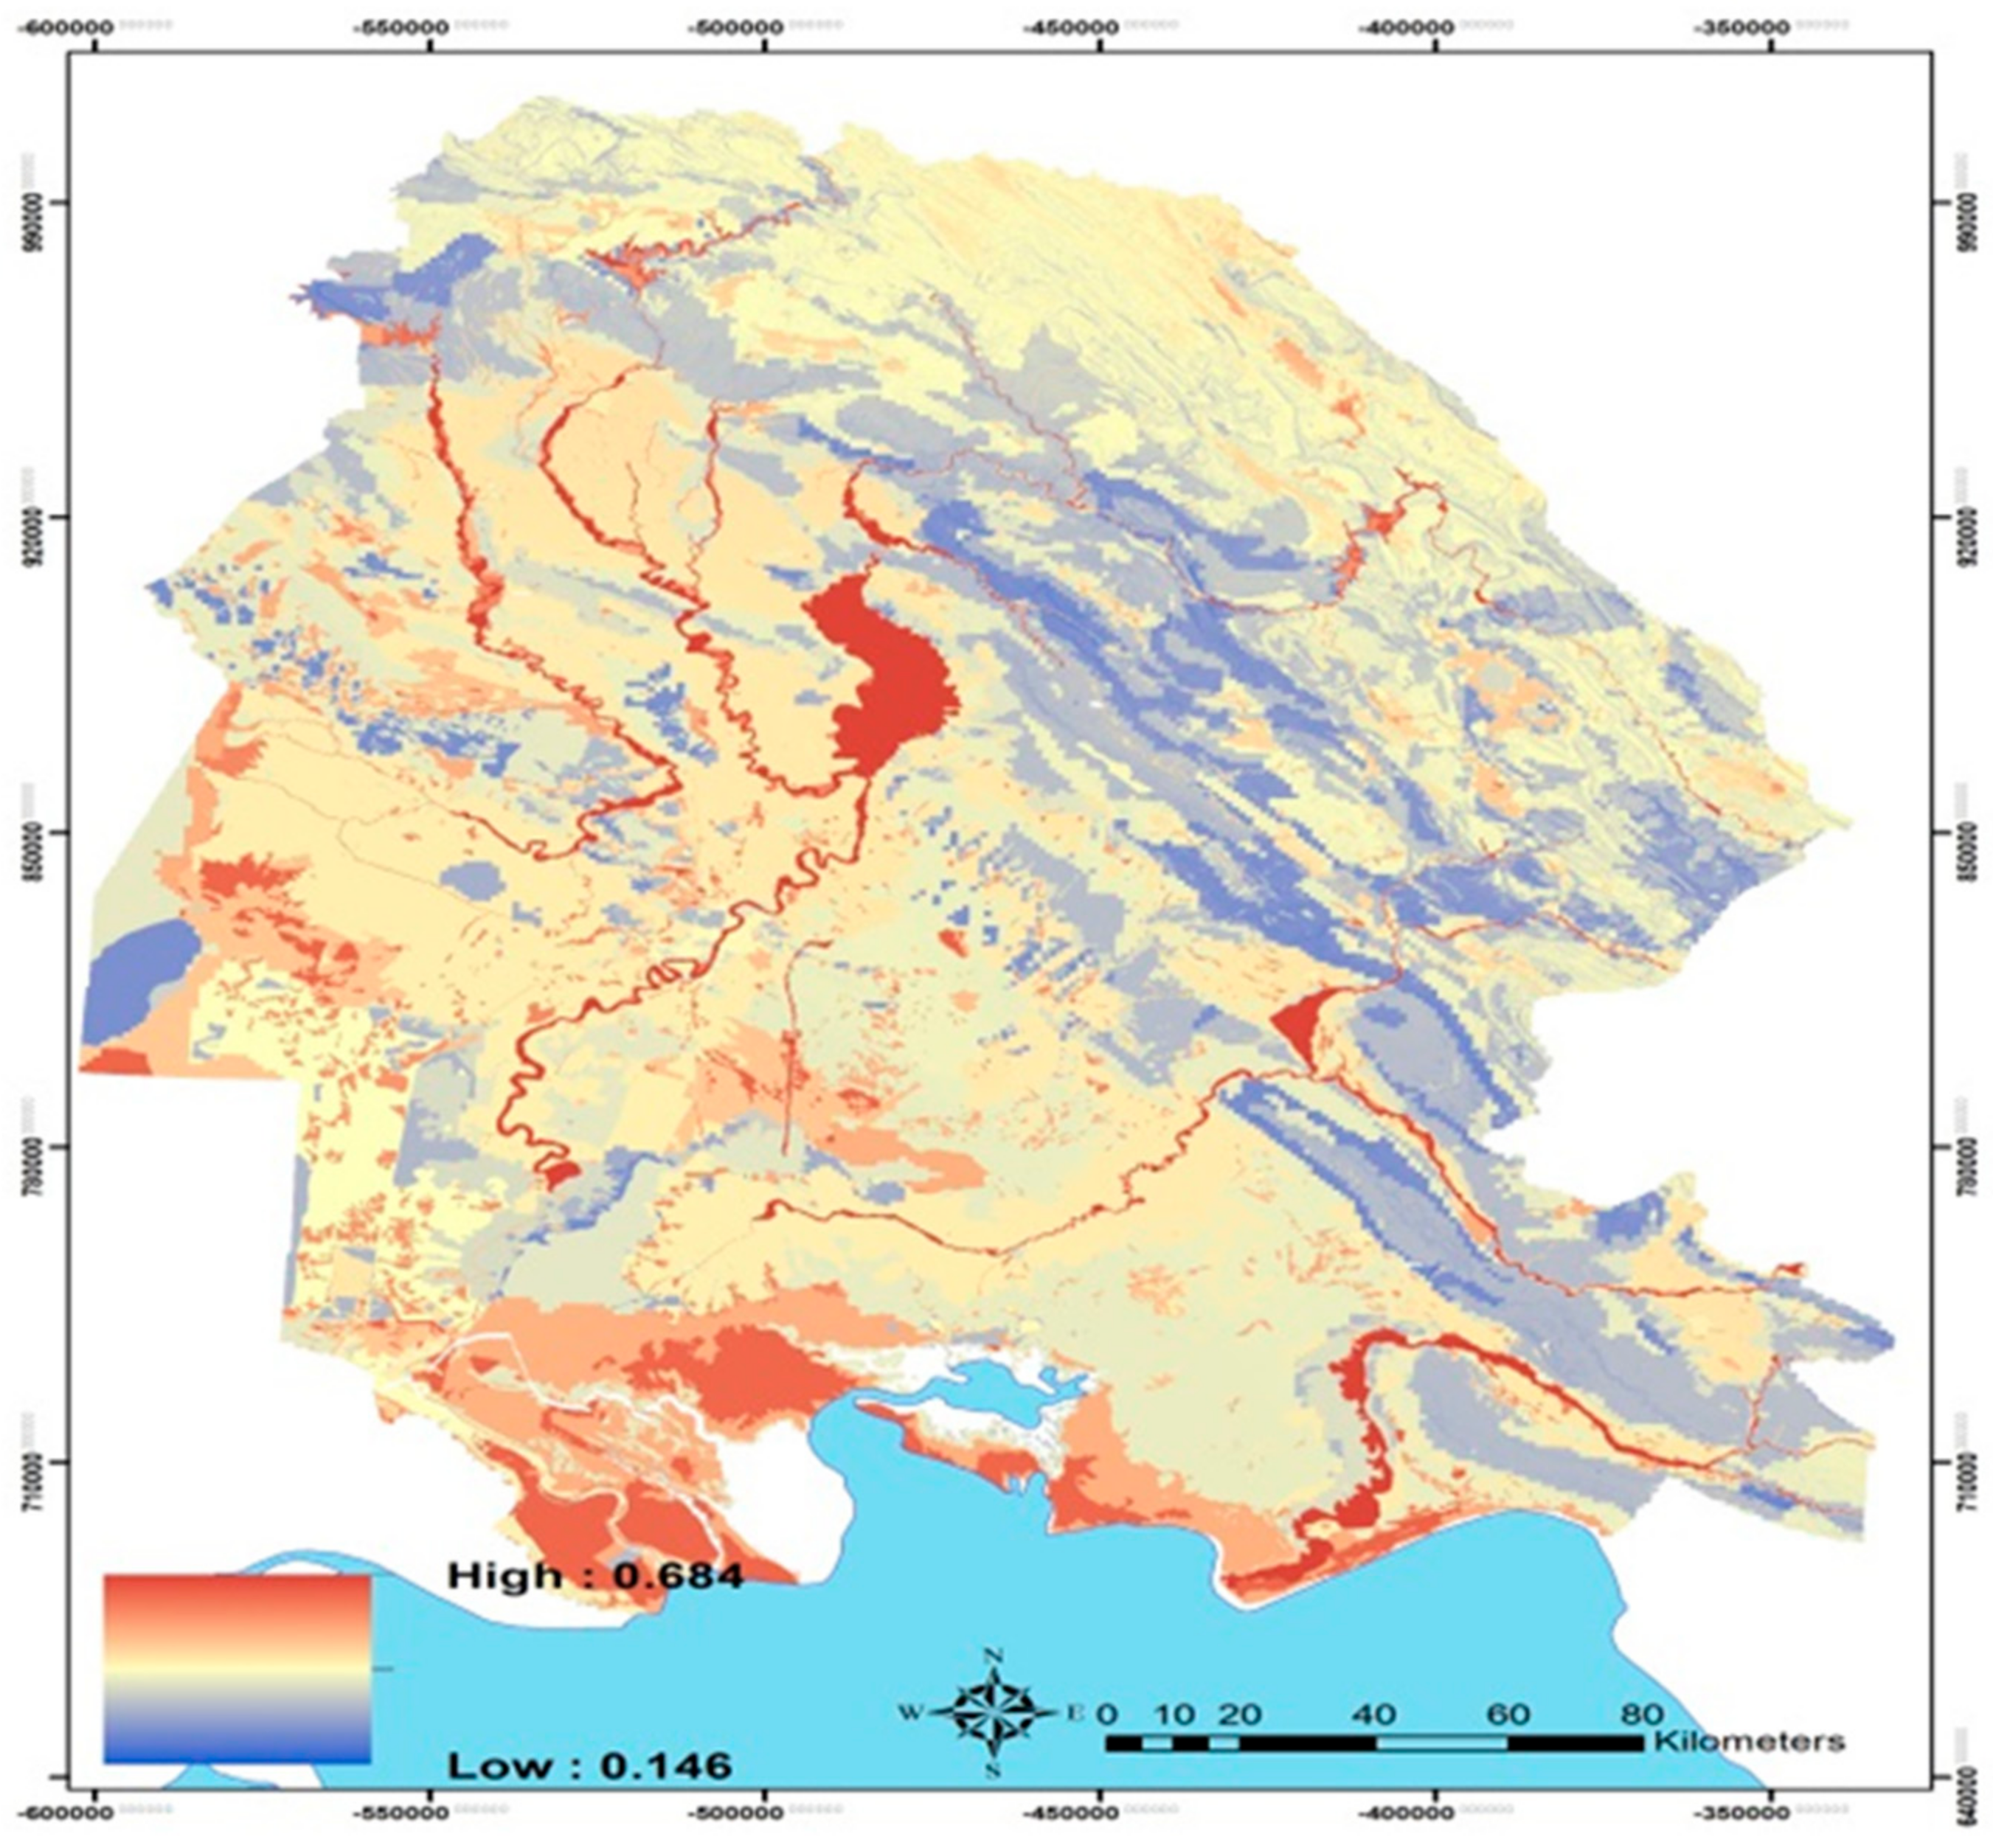
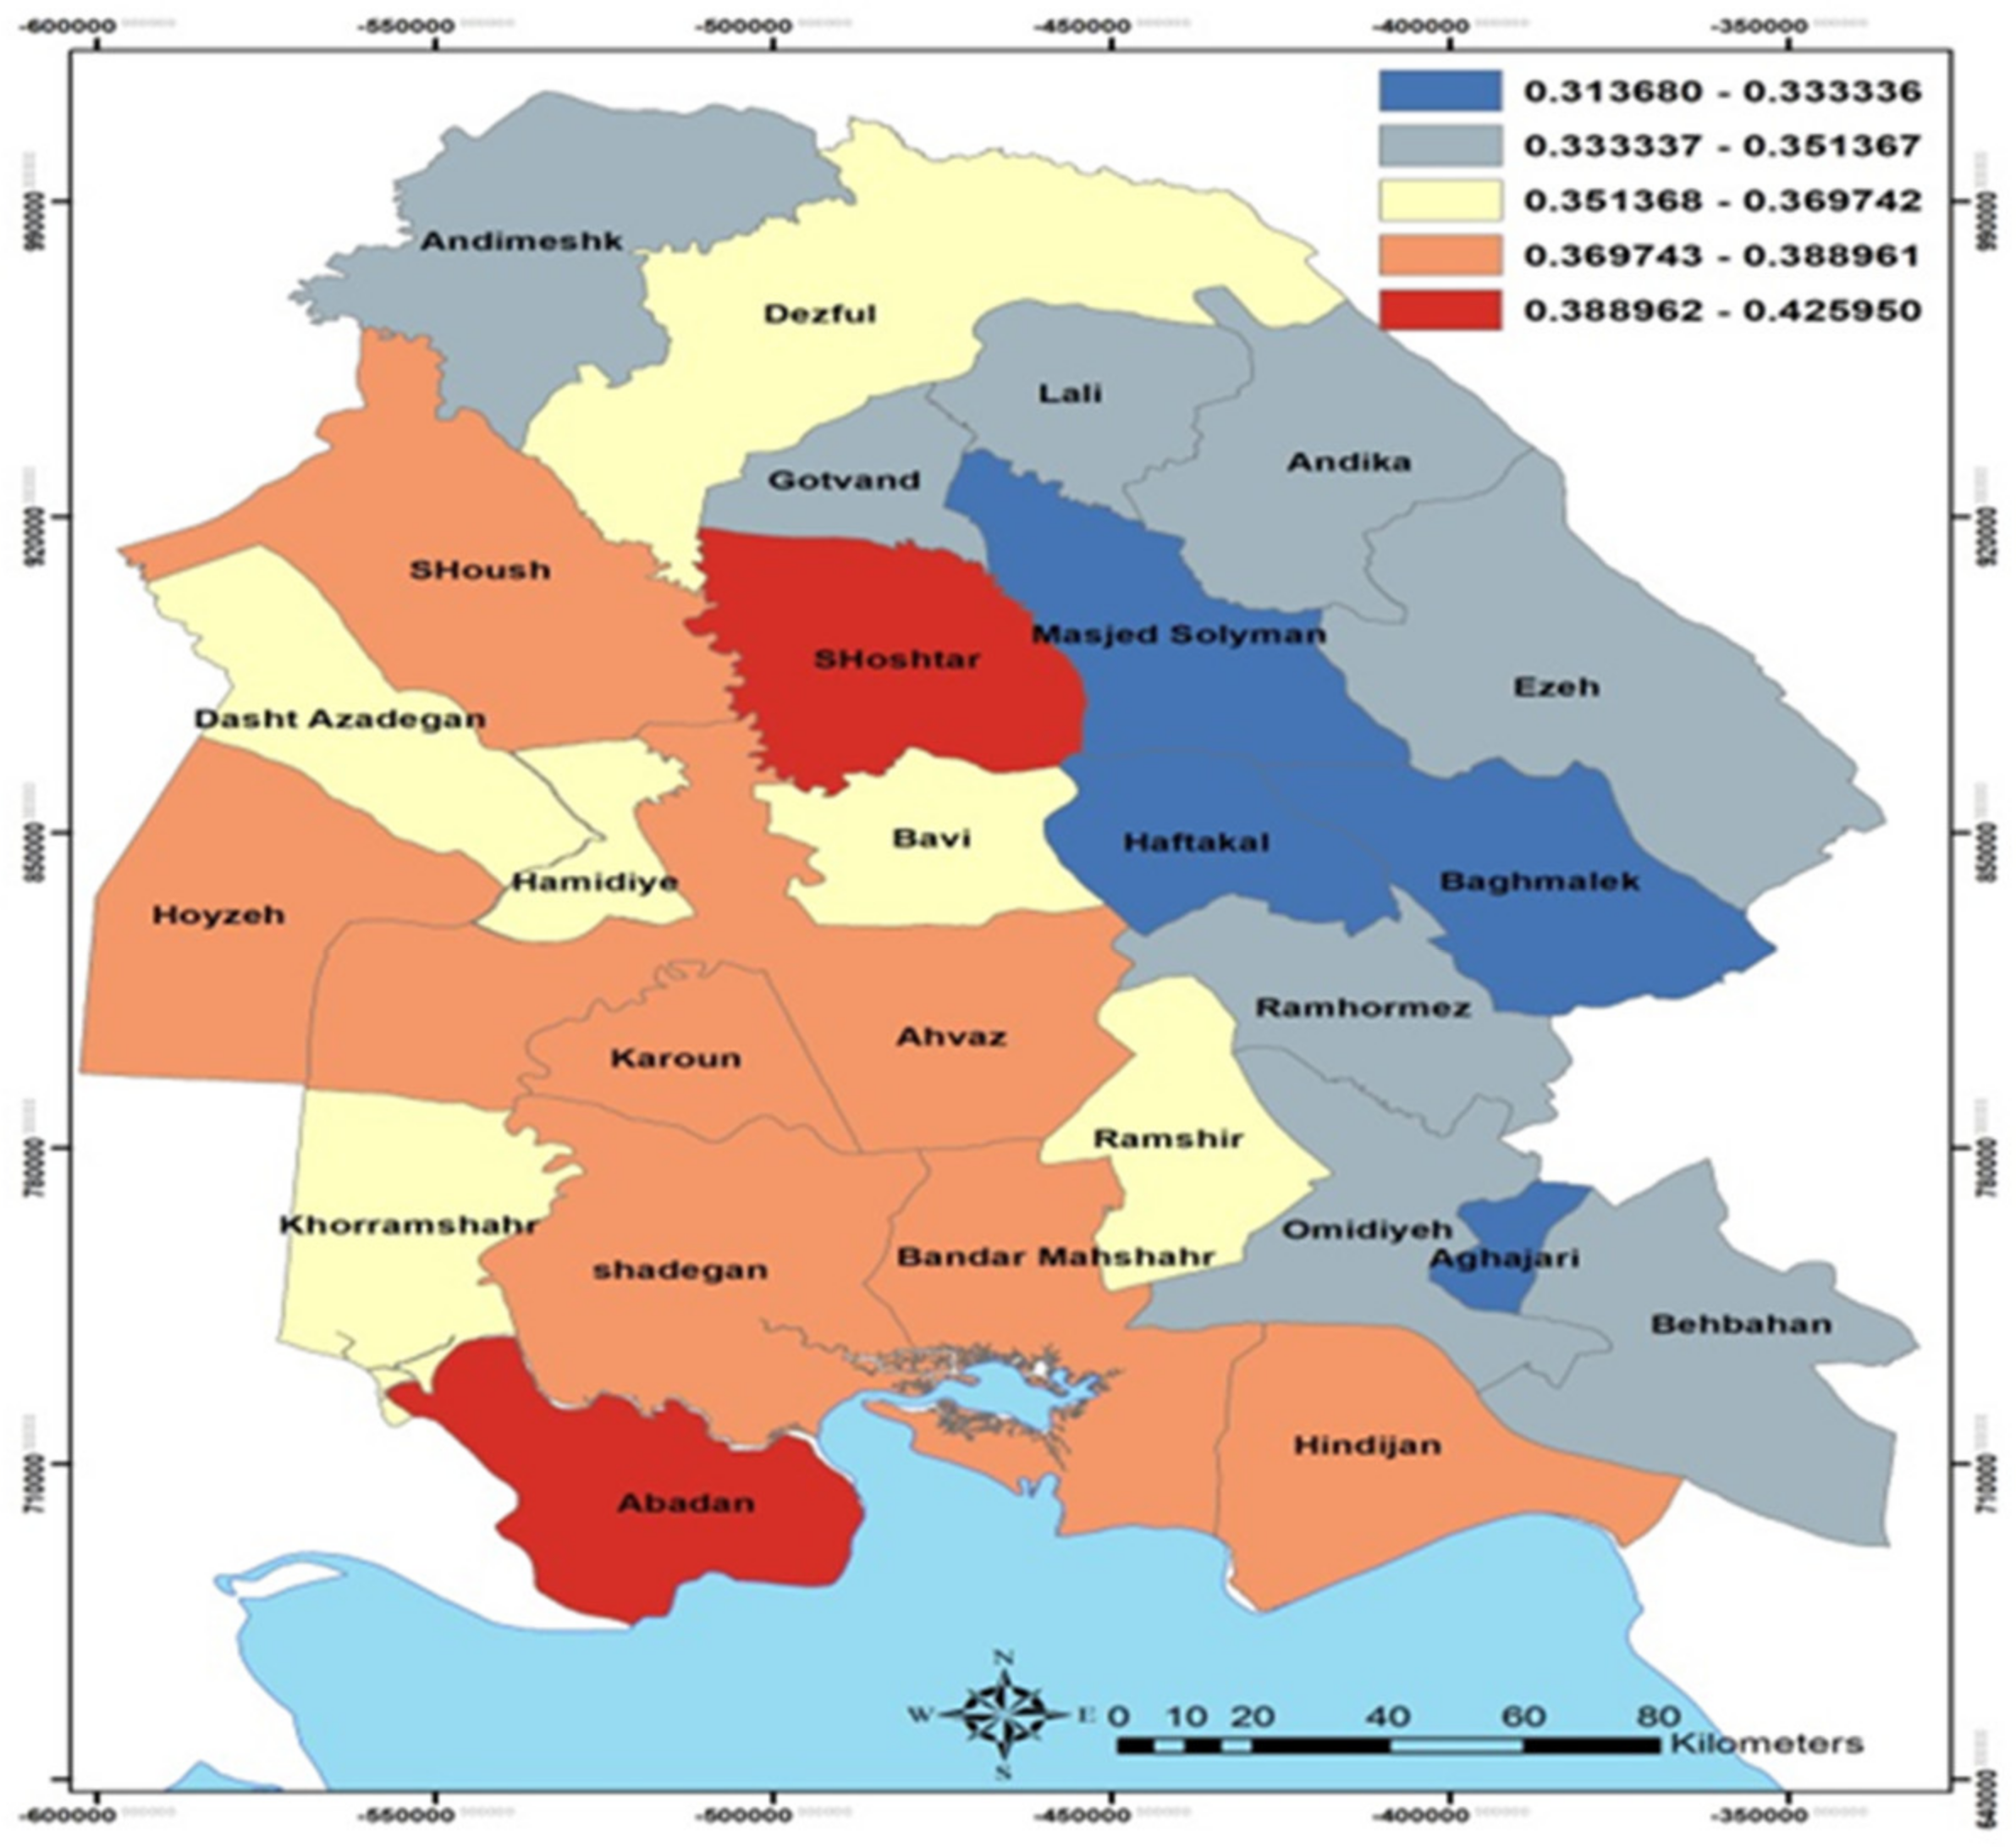
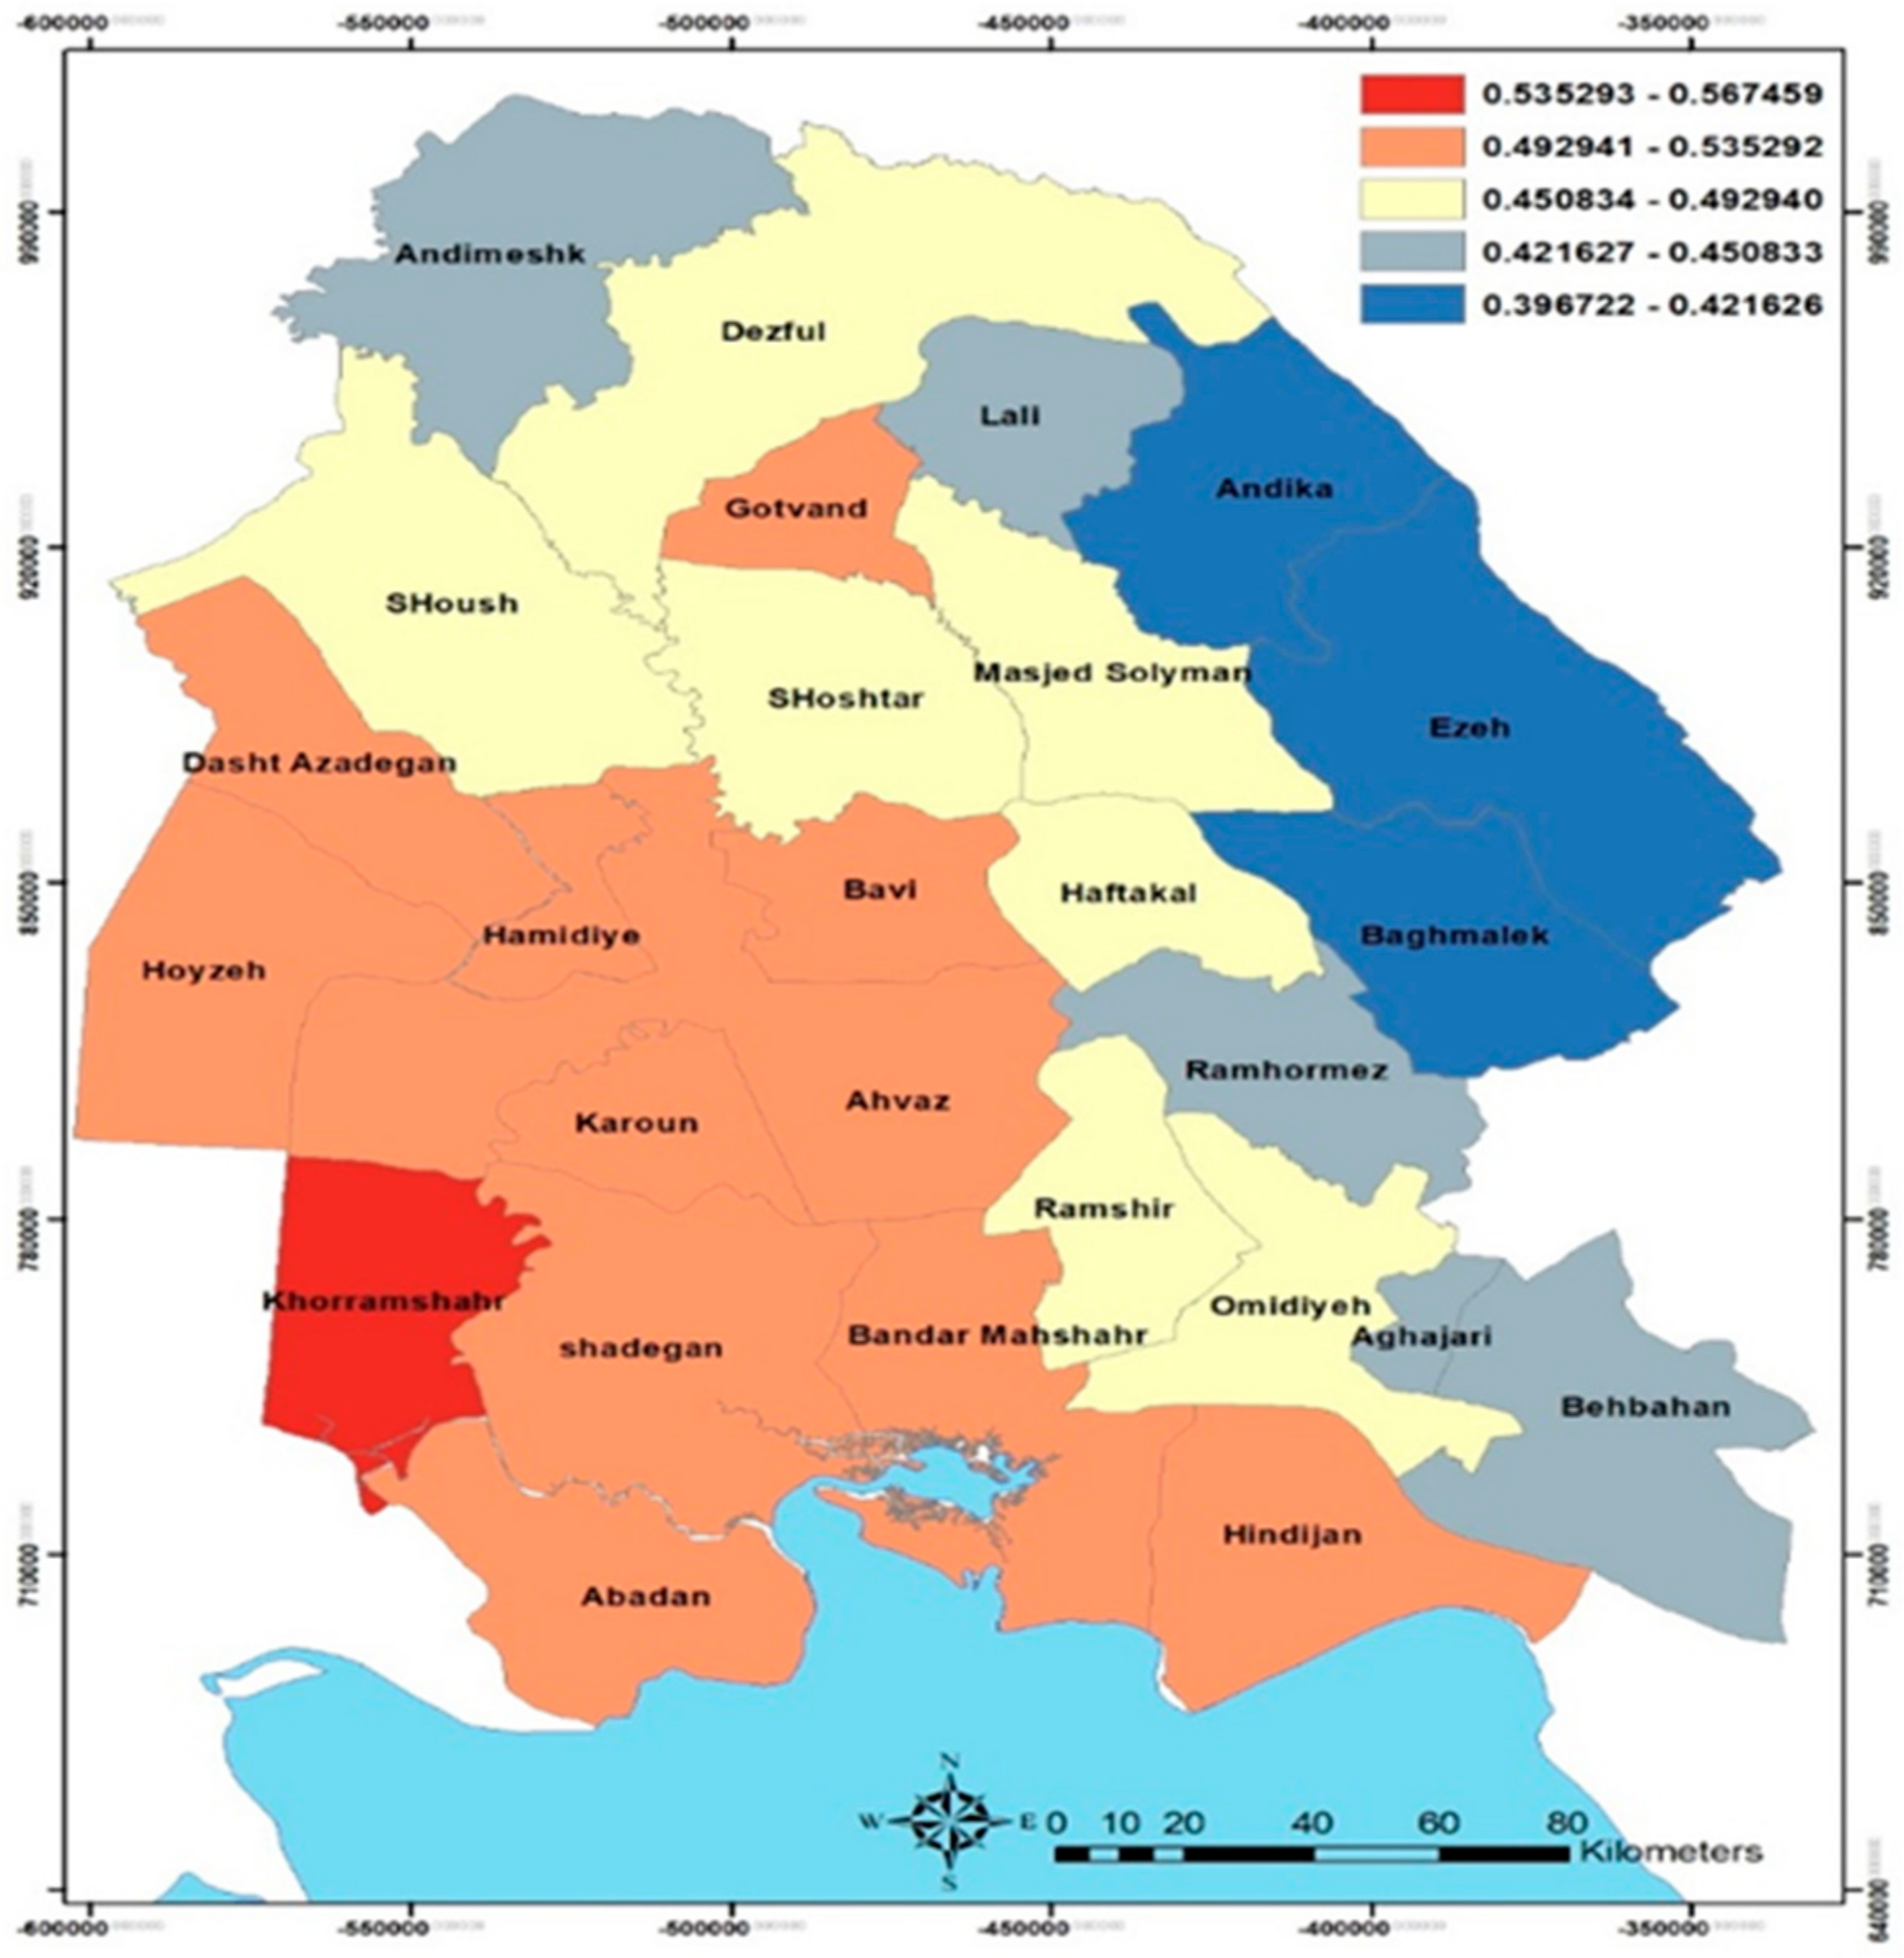
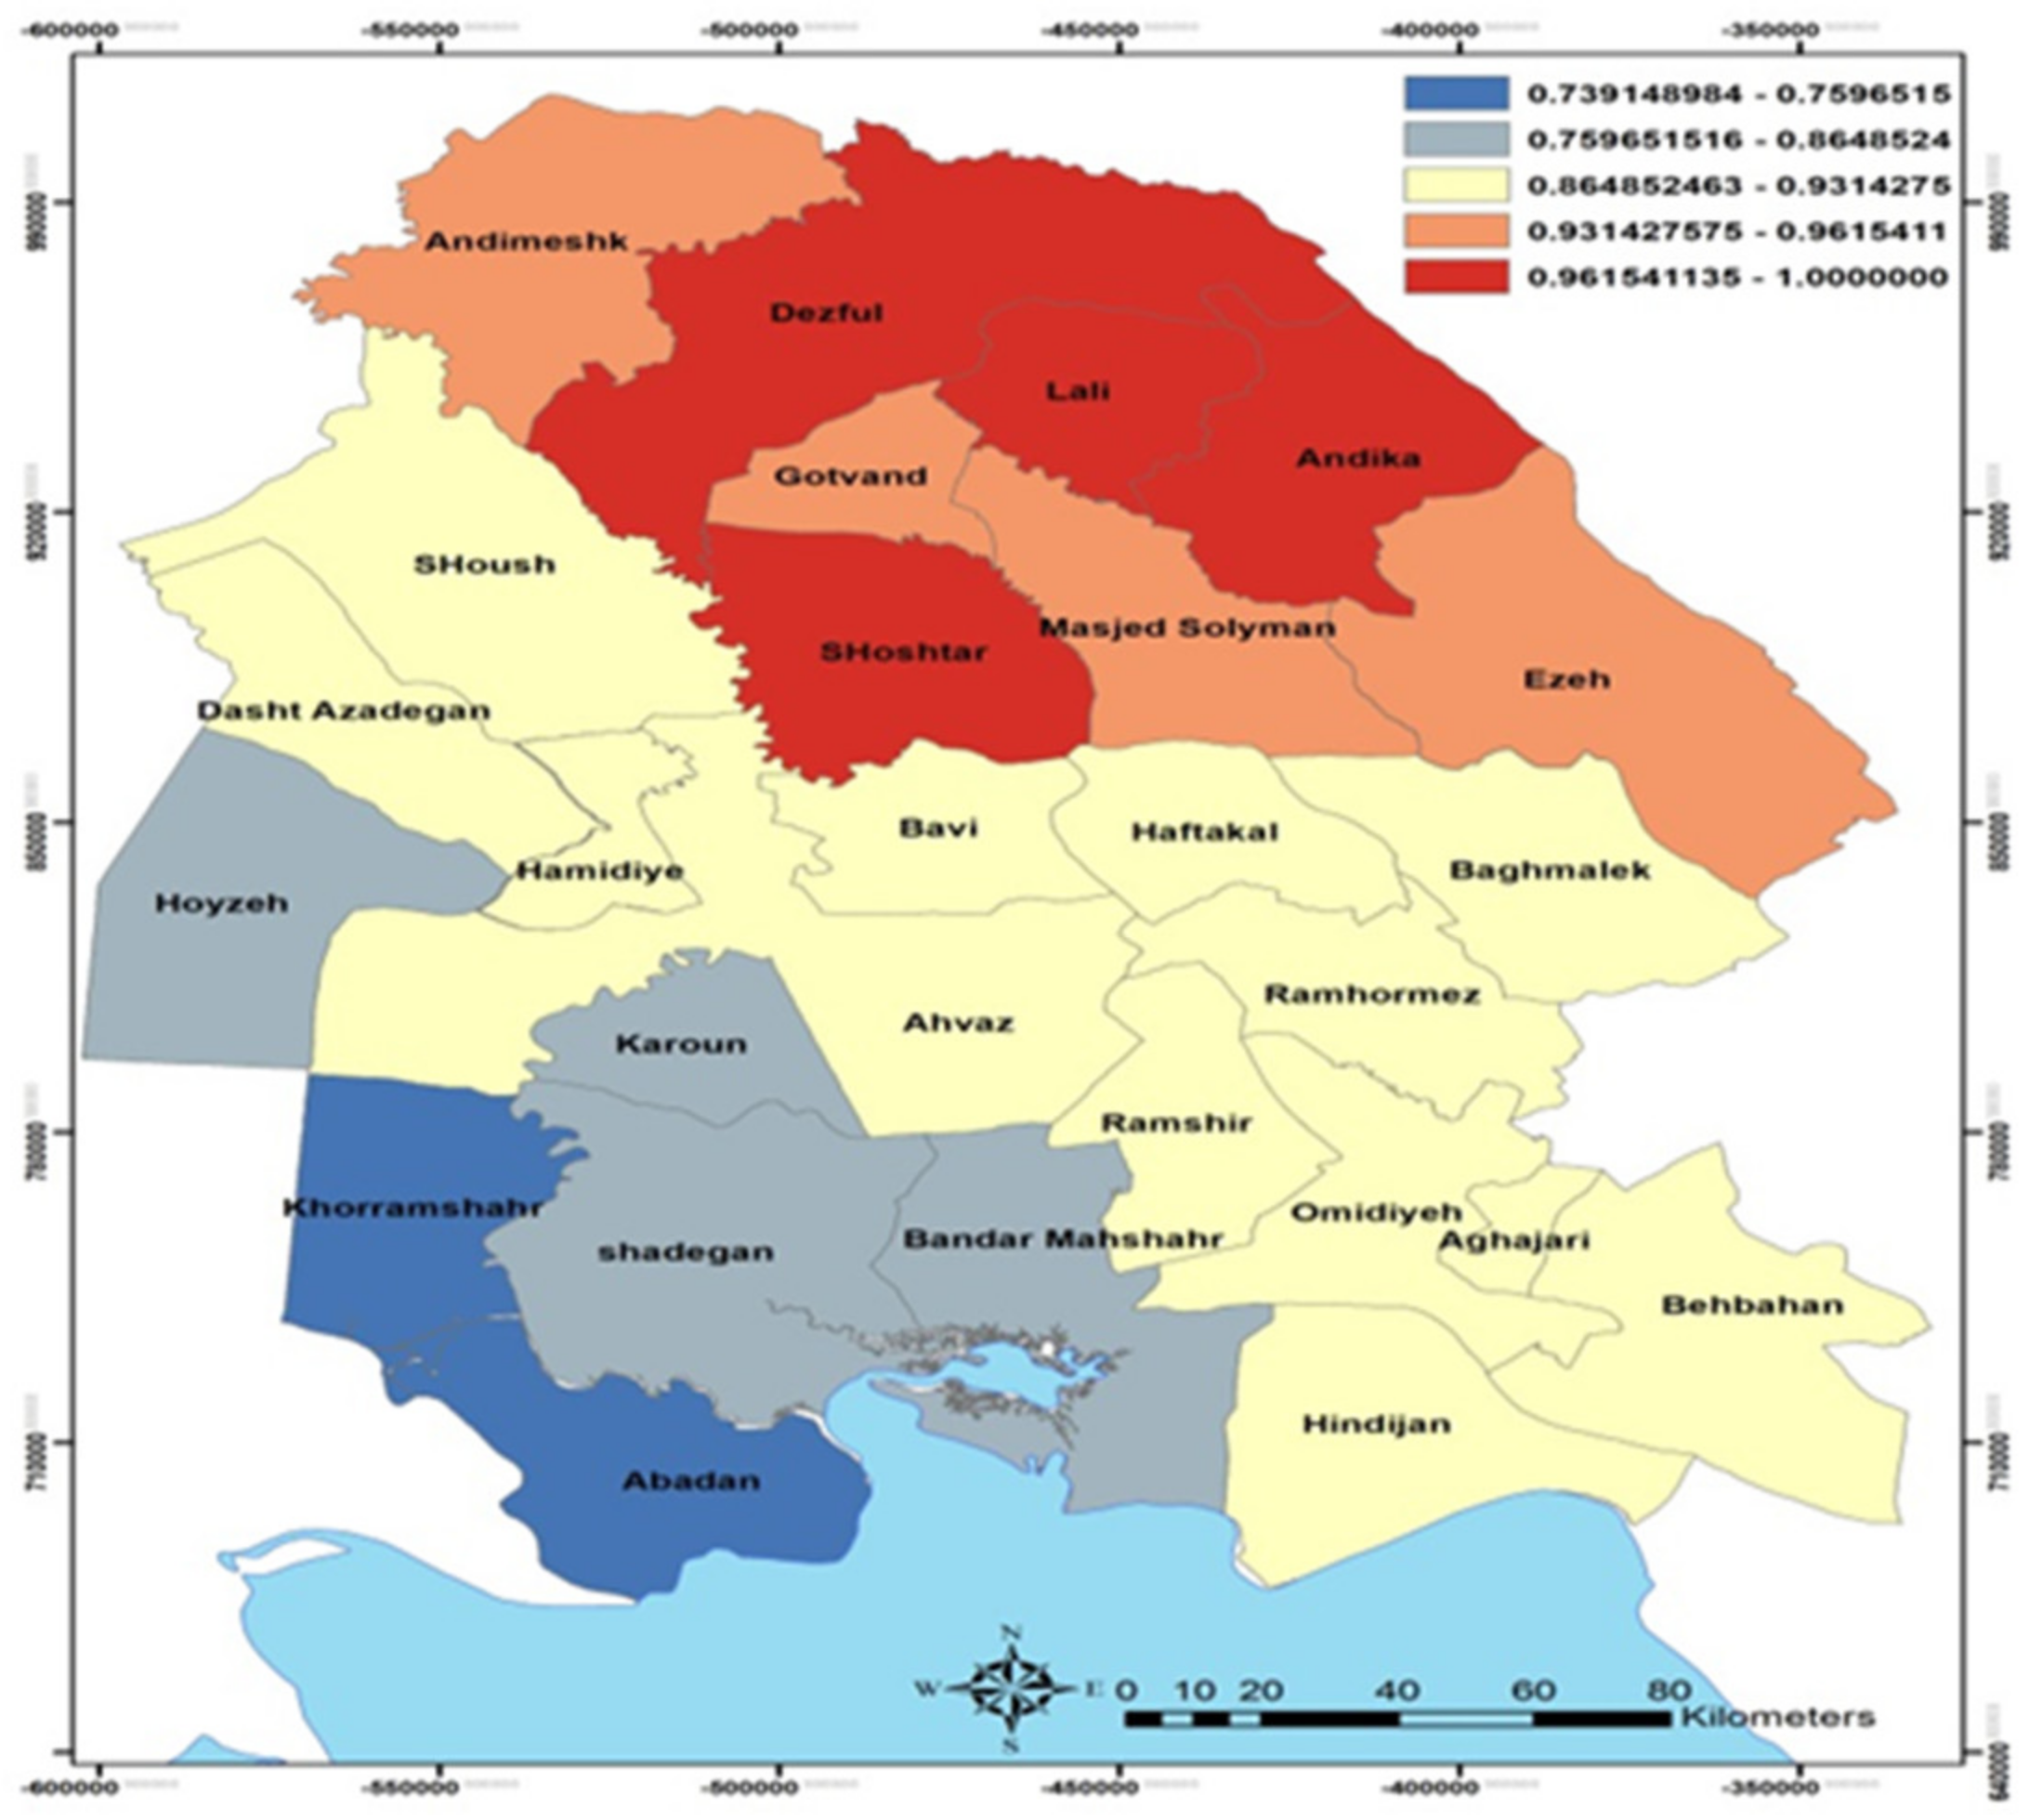
5.1. Hazard Assessment in Khuzestan Province

The present study assessed the four hazards of earthquakes, flood exposure, flood absorption, and drought in the counties in Khuzestan Province.
Earthquake: As can be seen in Figure 3, the northern zone and the eastern zone of the province and parts of the central regions have the highest risk of earthquakes, and the southwestern regions show the lowest level of seismicity. To analyze the seismicity by county using the Zonal Statistics tool, the weighted average for seismicity was calculated for each county, as shown in Figure 4. Accordingly, the northern counties (Andimshek, Dezful, Lali, Andika, Masjed Soleyman, and Izeh), followed by the counties on the eastern belt and parts of the northern areas (Gotvand, Shushtar, Haftkel, Bagh-e Malek, Ramhormoz, Omidiyeh, Aghajari, and Behbahan), can be considered the most dangerous seismic areas in the province. On the other hand, the counties of Abadan and Khorramshahr, followed by the counties of Bandar Mahshahr, Shadegan, Karun, and Hoveyzeh, show the lowest probability of earthquakes.
Flood exposure: As can be seen in Figure 5, the areas marked with purple color have the highest risk of flooding, and those marked green have the lowest exposure to flooding. Moreover, the northern and northeastern areas, as well as the riverbeds and flood zones, marked purpose, have the highest intensity of flooding. The county-level distribution of flood exposure also shows that the northern counties and the counties adjacent to them have the highest risk of flooding. However, the counties located in the southwest, including Abadan, Khorramshahr, Shadegan, and Karun, have the lowest flooding risks. In addition, the western and central counties gave a moderate level of exposure to floods (Figure 6):
Flood absorption: Like flood exposure, flood absorption (Figure 7) was assessed using nine criteria, with the difference that the flood absorption index mainly shows the effects of flooding in the downstream areas, flood exposure analysis, which focuses on the source of floods and the areas that are considered the starting point of rainfall. Thus, the difference between the two indicators can be attributed to the quality and the intensity of the influence of the criteria, especially the land slope. For example, the areas with a higher slope are exposed to a higher flooding risk due to high-speed water flows affecting the surrounding areas. In contrast, the downstream areas, especially the low-slope areas, have a higher flood absorption rate. Thus, the indicators affecting flood exposure and flood absorption, based on the degree of influence, are slope, flood zones, distance from the river, soil permeability, precipitation, land use, vegetation density, drainage density, and erosion rate.
Drought: Drought was assessed in this study using six criteria, including precipitation, temperature, evaporation, water network density, altitude, and land use in ascending order. Figure 8 shows the results of spatial analysis for the areas exposed to drought. As can be seen, the areas marked yellow, especially areas shown in clusters in the central, northern, western, and southern regions, have the highest level of drought, and the areas located in the northwestern and eastern parts of the province (mostly the elevated areas) have the lowest risk of drought. The spatial distribution of drought by county shows that Khorramshahr County has the highest drought risk, while Andika, Izeh, and Bagh-e Malek counties have the lowest drought risk (Figure 9).
Overall hazard zoning: The spatial analysis of hazards in Khuzestan Province was performed by integrating the weighted standardized layers for 31 criteria with the best-worst and VIKOR methods, as shown in Figure 10. As can be seen, the maximum and minimum hazard rates are 0.883 and 0.523, respectively. has been carried out in the color spectrum with the highest value equal to 0.883 and the highest value equal to 0.523 is shown in Figure 10. The northern and eastern areas, the riverbeds, wetlands, and flood zones are the most hazardous in the province, while the areas in the central and southern parts, especially the southwest part, are less exposed to hazards. The distribution of hazards by county shows that Dezful, Lali, Andika, and Masjed Soleyman have the highest level of exposure to hazards, while Abadan, Khuzestan, and Shadegan have the lowest exposure to hazards (Figure 11 and Figure 12).
Following the output maps, the counties were ranked in terms of their exposure to earthquakes, floods, drought, and the integrated exposure index as shown in Table 3. As can be seen, Dezful, Lali, and Shushtar counties are ranked one to three based on the integrated exposure index, and Shadegan, Khorramshahr, and Abadan counties are ranked last.

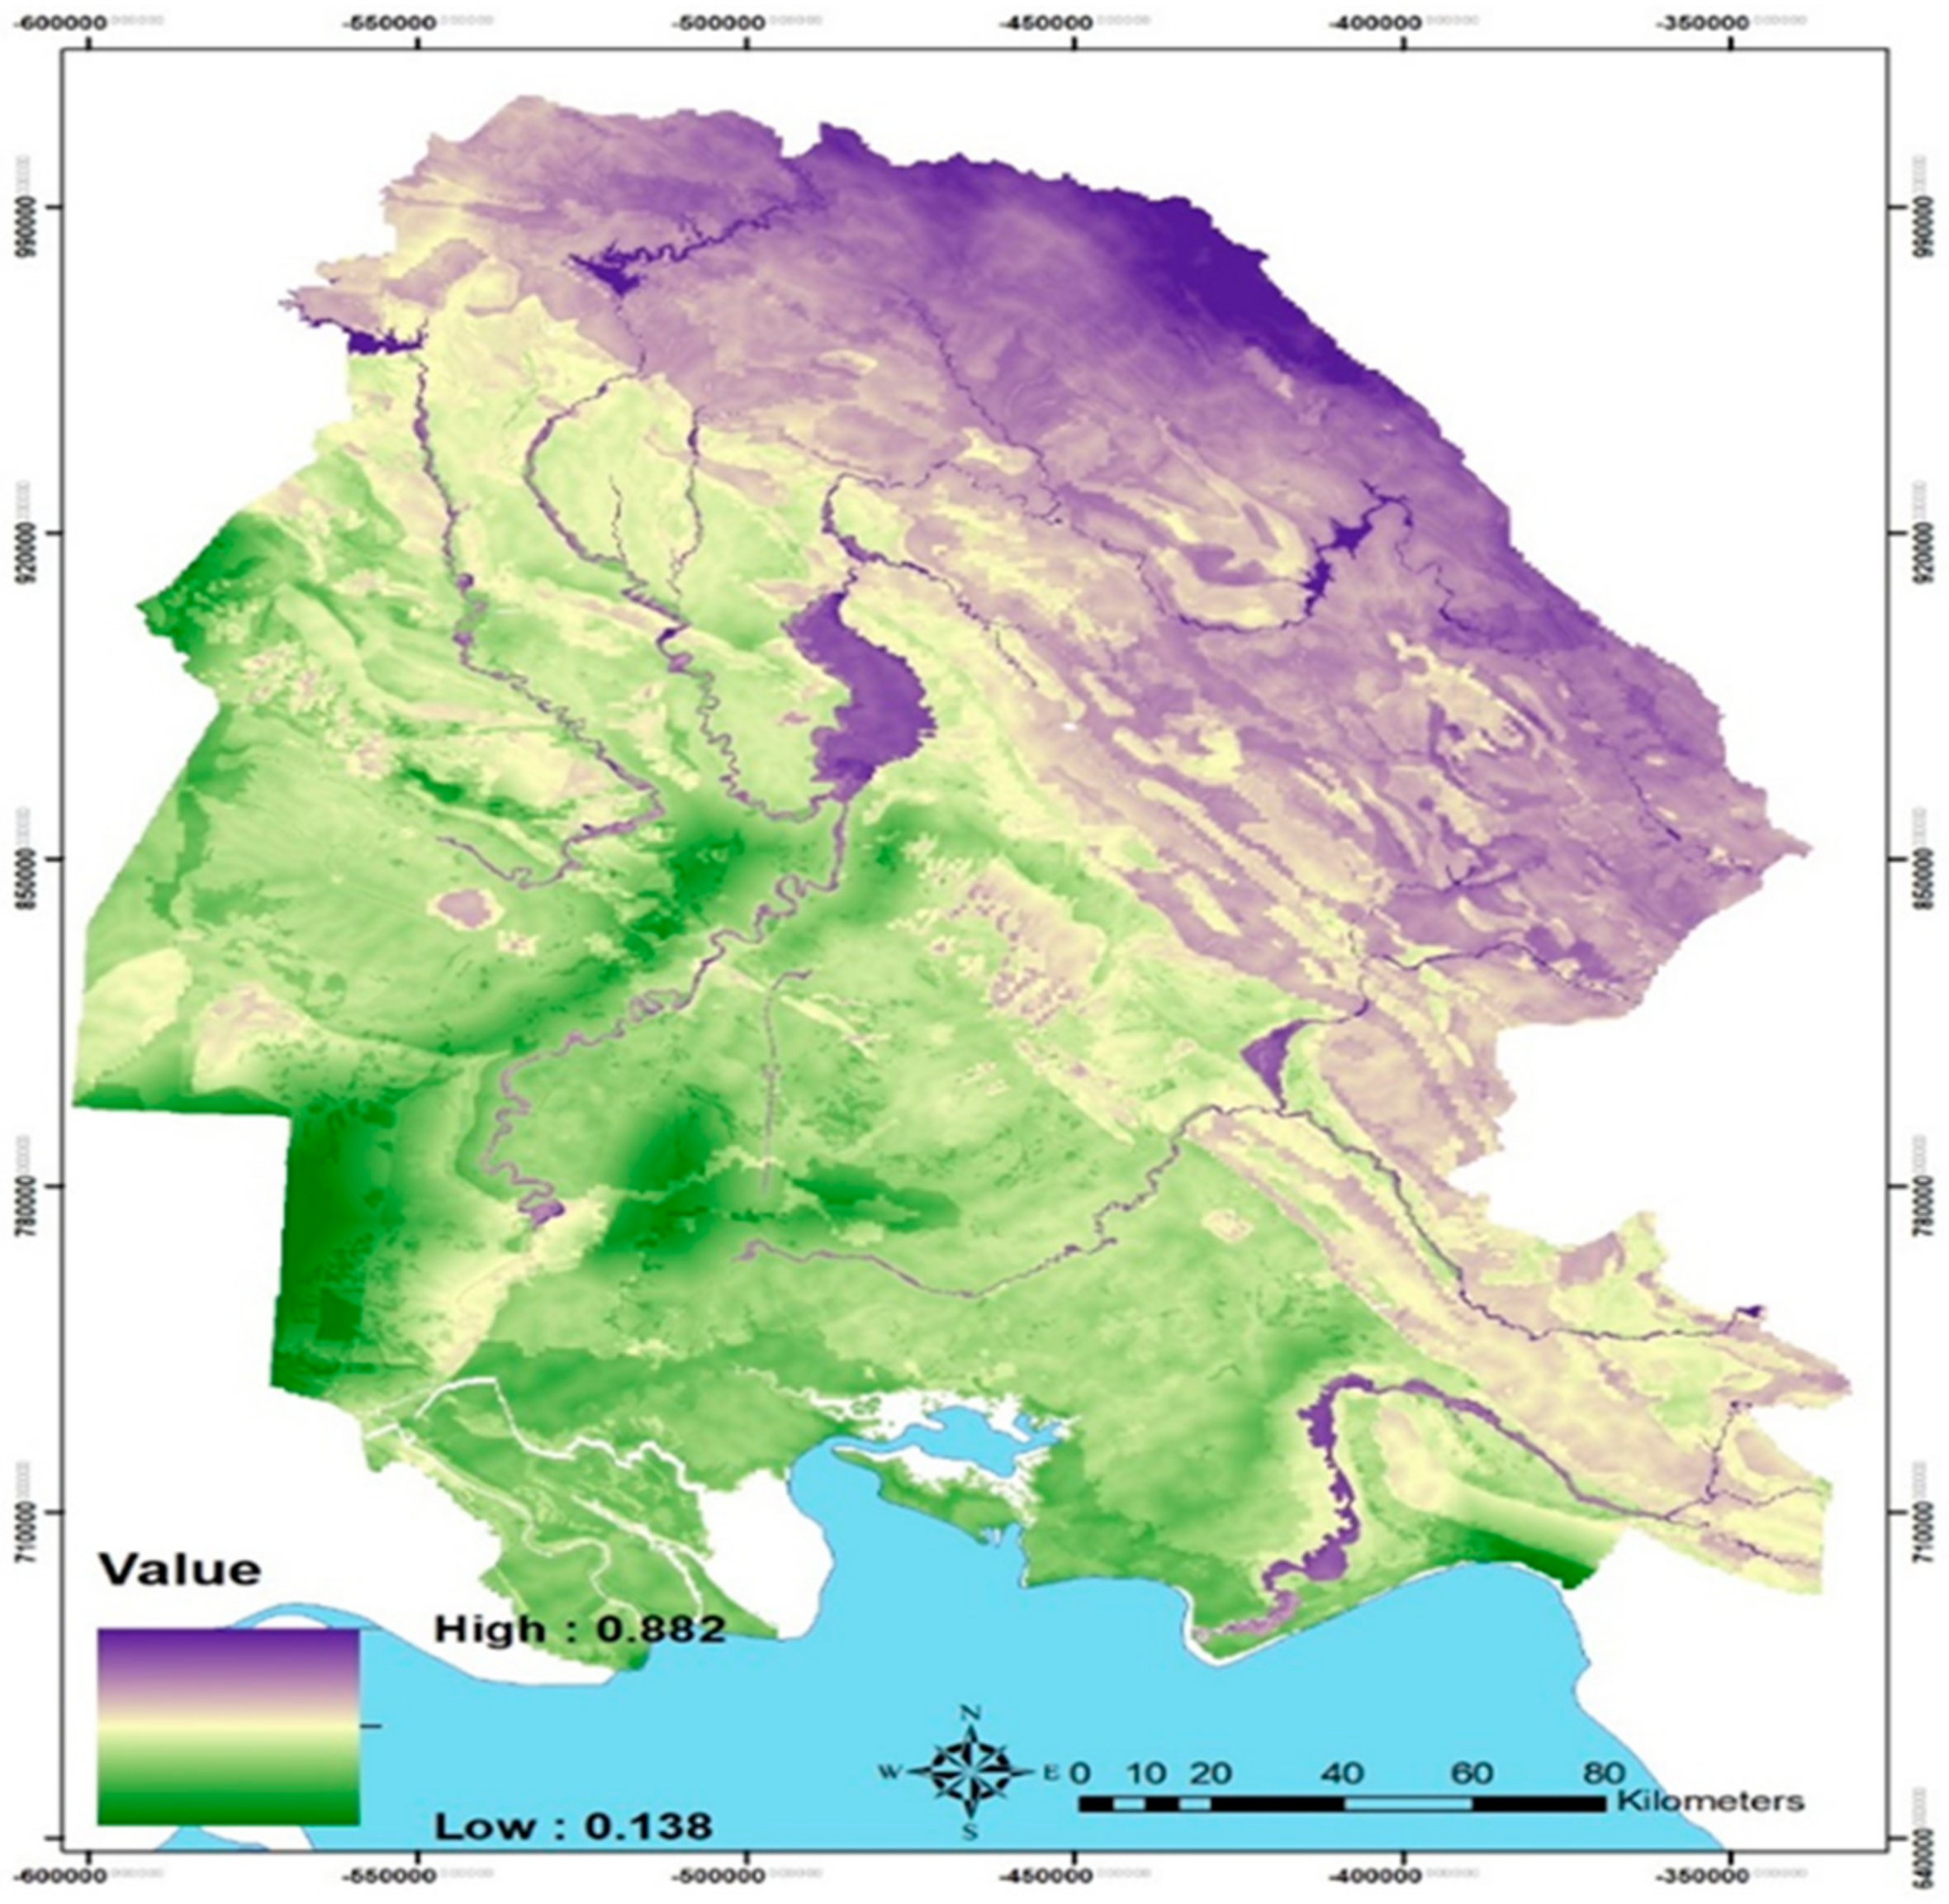
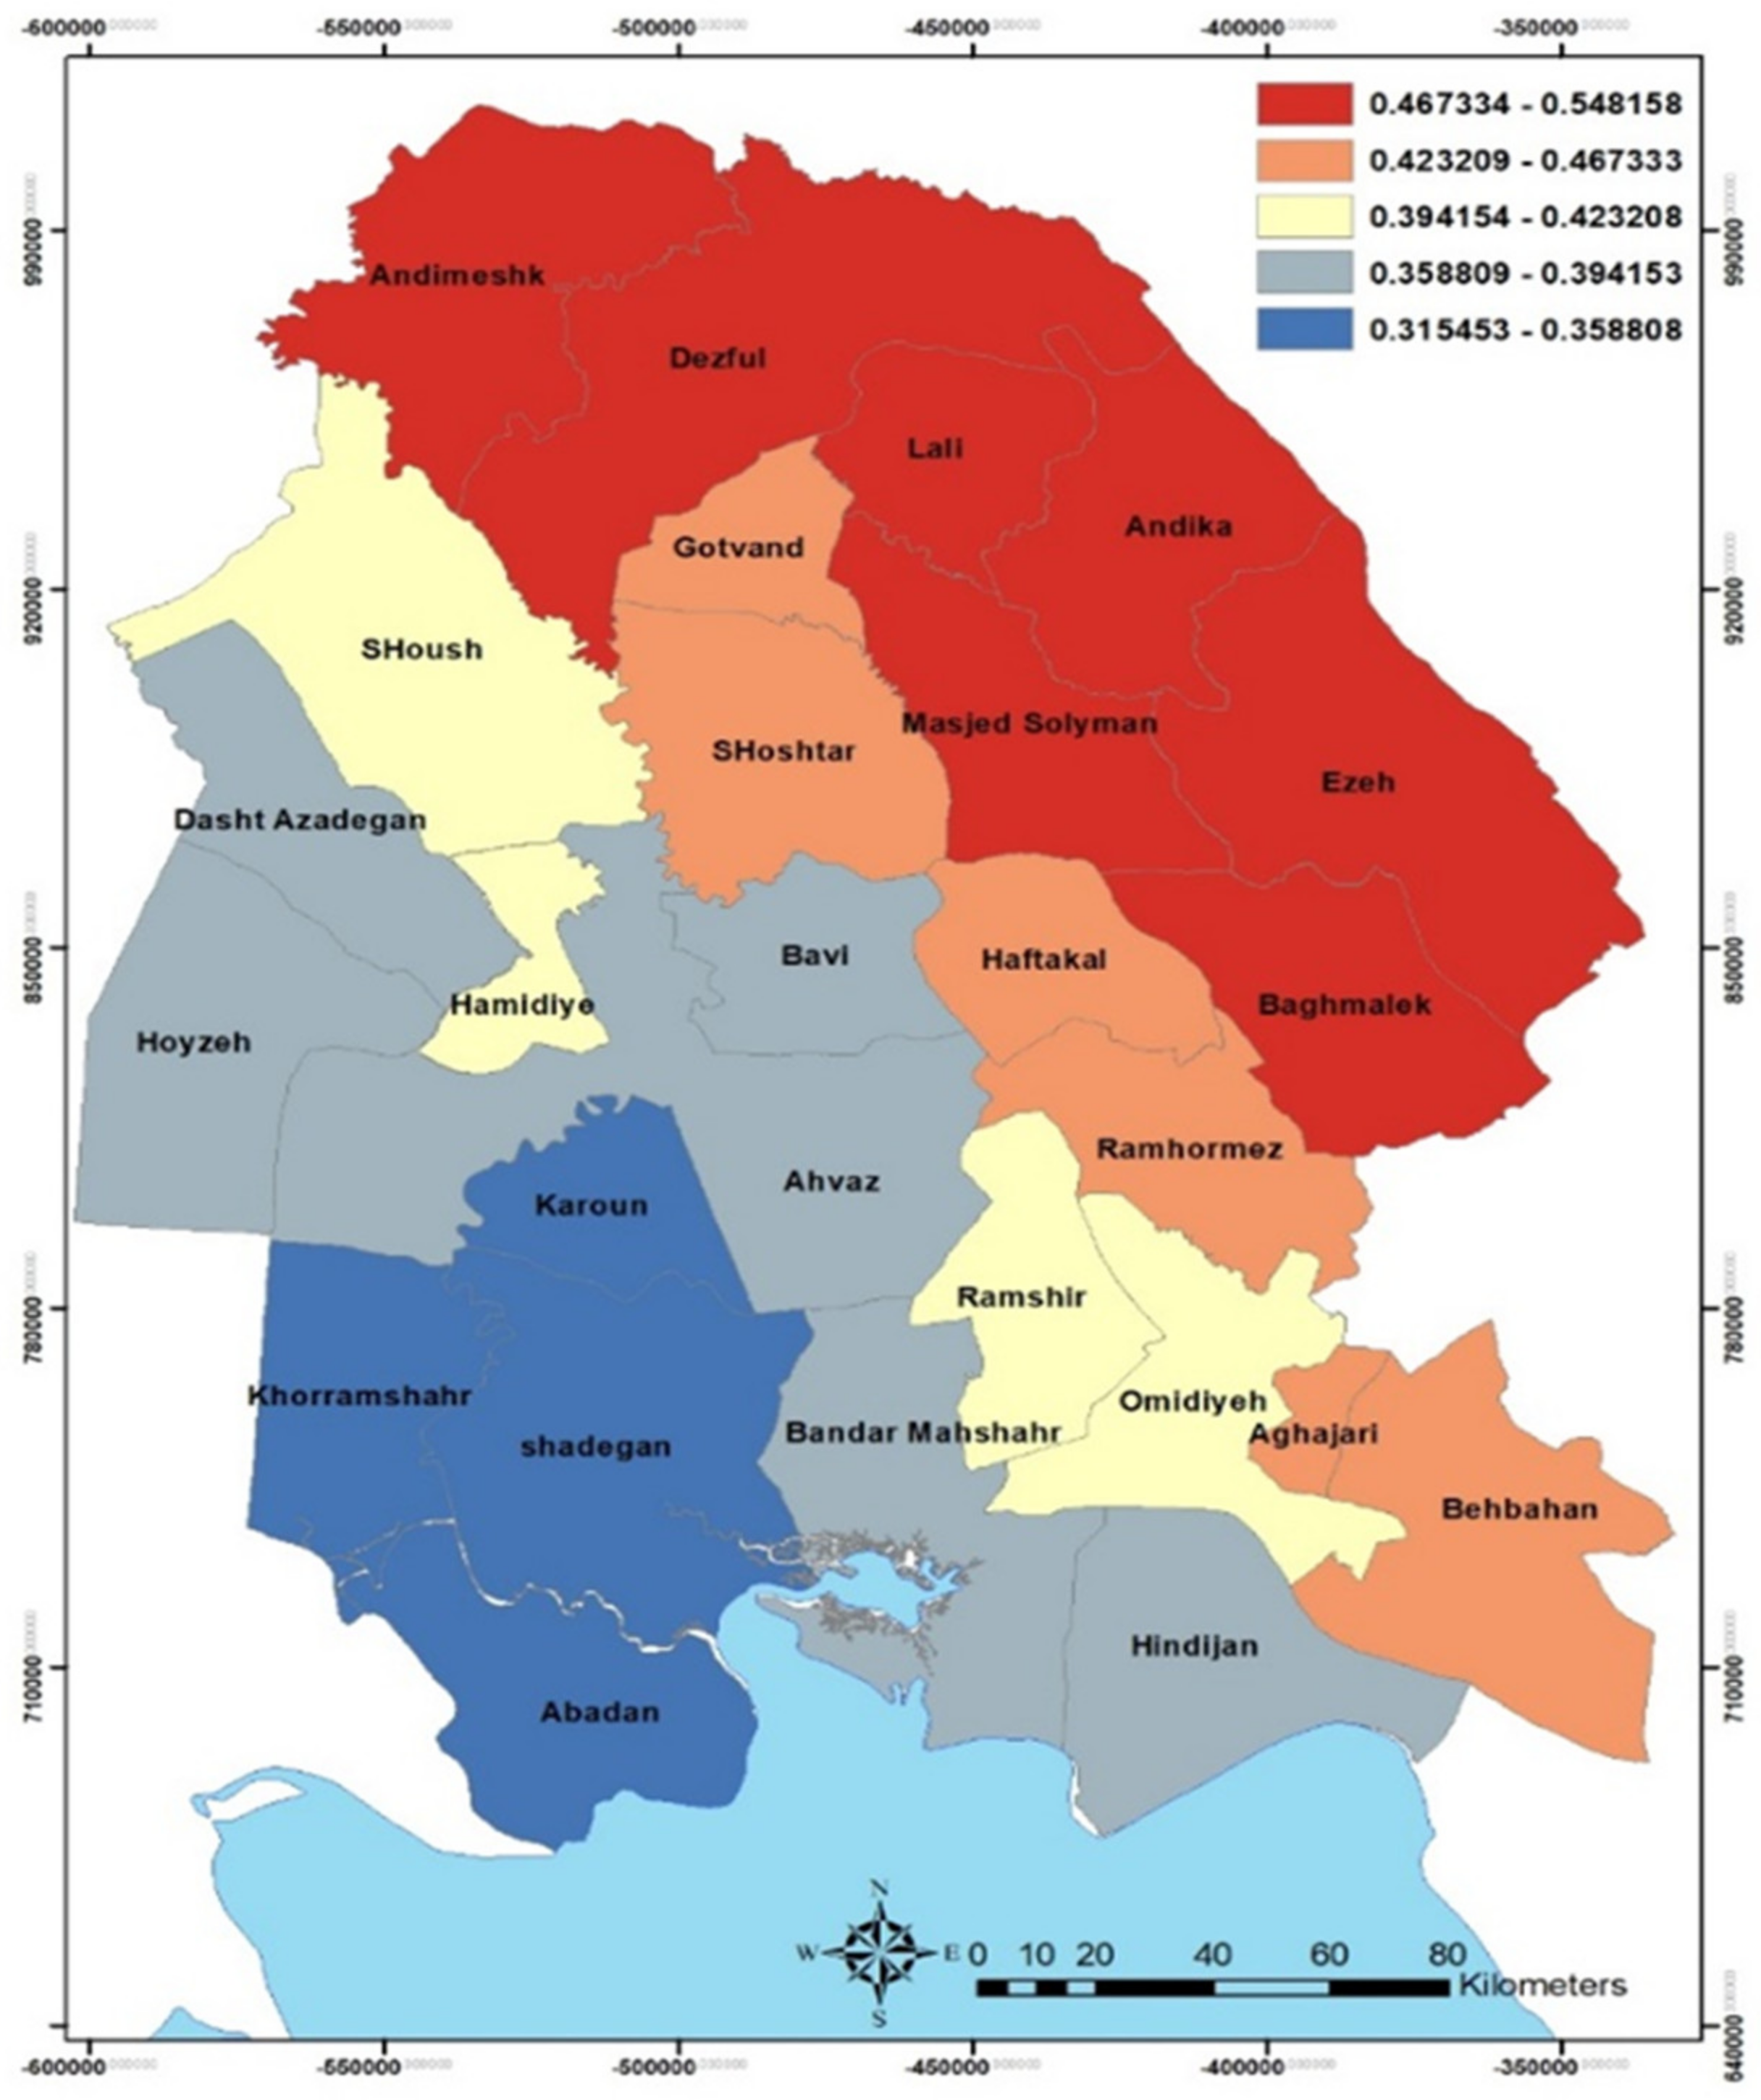
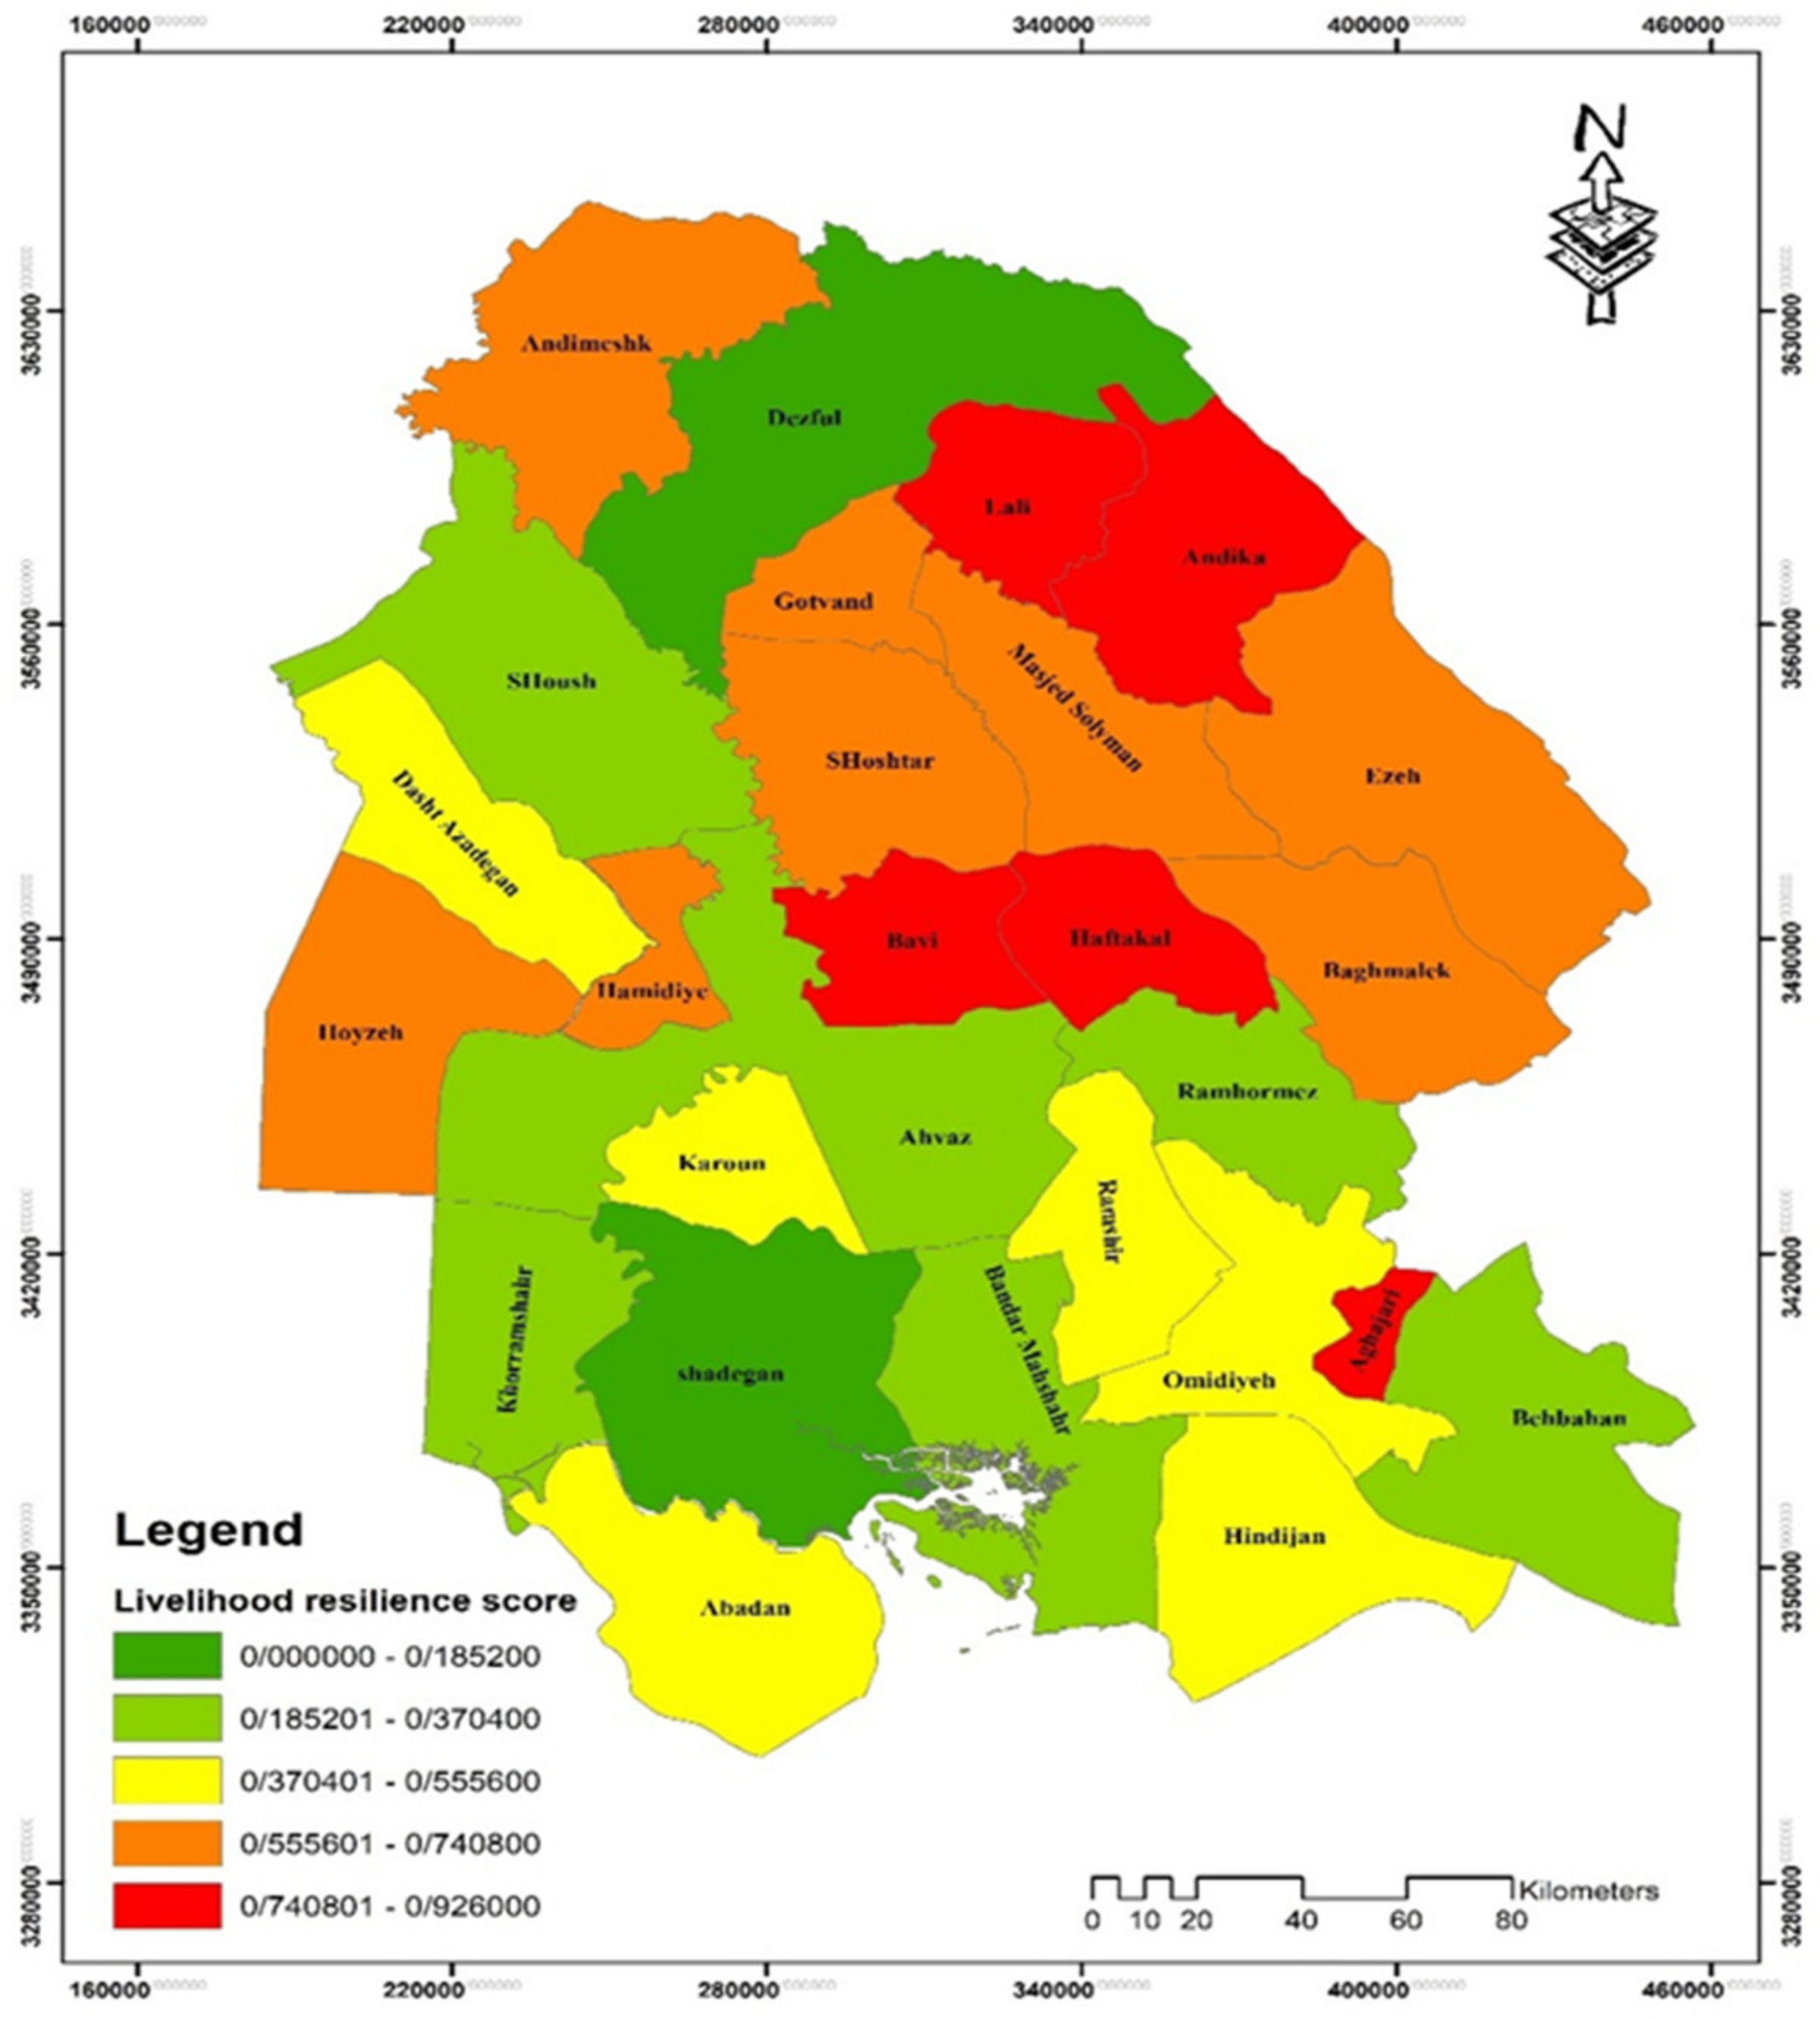
5.2. Livelihood Resilience Assessment

The livelihood resilience of the counties in Khuzestan Province was assessed in this study using eight indicators. The highest per capita saving was related to Mahshahr County, and the lowest per capita saving was related to Andika County. Hendijan County has the highest employment rate of men, and the lowest employment rate is related to Masjed Soleyman County. In addition, Masjed Soleyman has the highest employment rate for women, and Haftkel has the lowest rate. Shush County has the highest, and Aghajari County has the lowest area of irrigated land compared to other counties in the province. The eastern counties, including Izeh and Bagh-e Malek, have the highest area of rainfed lands among the counties in the province. However, there are no rainfed lands in Hoveyzeh, Mahshahr, and Abadan counties. Dezful and Hoveyzeh have the highest and lowest levels of animal products, respectively. Dezful County has the highest garden production among the counties in the province, and Aghajari has the lowest level of garden products. Ahvaz County has the highest rangeland area compared to the other counties in the province, and Hoveyzeh, Karun, Hamidiyeh, Bavi, and Aghajari counties have no rangeland.
The weights of the indicators were calculated using the DEMATEL technique (Table 4). The per capita saving gained the highest weight, followed by employed men, employed women, irrigated lands, animal products, garden products, rainfed lands, and rangelands.
The calculated weights were applied to the VIKOR model, and the counties were ranked in terms of livelihood resilience indicators, as shown in Table 5.
Dezful County ranks first in terms of livelihood resilience, followed by Shadegan, Ahvaz, Mahshahr, Behbahan, Shush, Khorramshahr, Ramhormoz, Hendijan, Karun, Abadan, Dashte Azadegan, Ramshir, Omidiyeh, Bagh-e Malek, Hoveyzeh, Andimeshk, Izeh, Gotvand, Shushtar, Hamidiyeh, Masjed Soleyman, Bavi, Aghajari, Lali, Haftkel, and Andika that occupy the next ranks, respectively (Figure 13).

6. Discussion

Livelihood resilience is the ability of a group to maintain functioning and continue to live when a shock occurs. A lot of economic losses occur when a hazard happens. These losses occur at the macro level for the government and the micro level for individuals. If the community and its members are in a bad economic situation with low employment rates, savings, and production, they will have more problems in the post-hazard phase. Furthermore, services and facilities will be provided with difficulty, and people will not have the ability to rebuild and recover from the conditions caused by hazards, or they need more time for recovery. For example, if there is a high level of income and savings in a community, people can buy facilities for accommodation and housing reconstruction. Thus, financial ability is more important in a community that is always affected by various hazards because as soon as the process of recovery from one hazard is completed, another hazard occurs. Thus, it is necessary to identify the hazards and shocks that affect a given region before examining the livelihood conditions of the residents. To this end, the present study investigated livelihood resilience in the multi-hazard areas in Khuzestan Province. This study was conducted in two phases. In the first phase, multi-criteria decision-making (MCDM) methods were used in ArcGIS for spatial analysis of hazard exposure in the counties. In the second phase, multi-criteria decision-making methods were used to analyze the livelihood resilience of counties. Thus, the counties were ranked in terms of exposure to hazards (earthquakes, flooding risks, flood absorption, and drought). The results indicated that Dezful, Lali, and Shushtar counties have the worst position in terms of exposure, and Shadegan, Khorramshahr, and Abadan counties have the best situation. Moreover, Andika, Lali, and Gotvand counties were ranked one or three in terms of earthquake risk. In addition, Andika, Izeh, and Lali counties were ranked first to third in terms of flood exposure. Abadan, Shushtar, and Karun counties have the highest level of flood exposure. Abadan, Khorramshahr, and Shadegan counties have the highest ranks in terms of drought. Previous studies have used similar indicators for hazard assessment in provinces neighboring Khuzestan Province. For instance [6] assessed multiple hazards (flood, earthquake, landslide) in Lorestan Province, located in the north of Khuzestan Province and on the slopes of the Zagros mountain range.
Natural hazards cause the most damage to the economic position through the destruction of infrastructure, assets, and resources and the redirection of assets to help restore and rebuild the affected areas, greatly limiting economic growth and hindering development. Thus, the evaluation of the economic status and livelihood of residents is one of the main priorities in risk management and reduction. In the second phase of the study, the composite livelihood resilience index was estimated for the counties in Khuzestan Province. The results indicated that Aghajari, Lali, Haftkel, and Andika counties have the worst situation and Dezful, Shadegan, and Ahvaz counties have the best situation in terms of livelihood resilience. The counties ranked last in resilience are the small counties in the province in terms of population and area. The capitals of these counties are sparsely populated cities, and they are not in good condition in terms of natural resources, such as agricultural lands, and the river does not flow in these counties. Limited access to natural resources, facilities, and infrastructure and lower employment rates in neighboring industries have limited the economic opportunities and income generation for the residents of these counties. Factors such as access to rivers, agricultural lands, horticultural productions, and large oil and petrochemical industries have created suitable economic conditions in Dezful, Shadegan, Ahvaz, and Mahshahr counties. Therefore, it is the location and environmental conditions that affect the difference in livelihoods and the adoption of livelihood resilience strategies [67].
The composite integrated livelihood vulnerability index is a very important tool that helps to identify priorities and implement effective policies and reveal the true picture of existing socio-economic vulnerability. This study developed the composite index for hazards and livelihood resilience. By combining several indices, the composite index represents the overall situation of the counties. Using the composite index for prioritizing counties is very effective in allocating financial resources and risk reduction measures. The index can also be used in prioritizing on other scales, such as neighborhood, county, and province, in other regions. Previous studies have highlighted the importance of the composite index for community resilience assessment because the assessment of community resilience is a multifaceted issue and requires the assessment of several indicators [68].
Concerning the differences between villagers and urban dwellers in terms of livelihood resilience, it can be argued that villagers have a much higher dependence on natural resources, and when their only source of income is rainfed agriculture, they will experience worse conditions with the occurrence of drought or the destruction of agricultural lands by floods. The current level of livelihood dependence on environmental income is reported to be high in many developing countries. Livelihood dependence on natural resources is one of the prominent issues in Iran, especially in the communities located in the Zagros mountains [55]. Thus, given the strong dependence of such communities on natural resources, it is very difficult to recover the conditions without the help of the government and external organizations, forcing the residents to migrate to other areas. Accordingly, Ref. [69] suggested that the intensification and acceleration of hazards increase the problems faced by vulnerable communities, especially those that are highly dependent on natural resources.
One of the main indicators for measuring livelihood resilience is financial assets. Financial assets primarily refer to savings and access to credit from formal and informal sources [55]. Furthermore, more access to credit contributes to adopting the business strategy and less dependence on natural resources. Residents in counties like Bandar Mahshahr have higher average financial assets and savings due to the presence of petrochemical and oil industries. High financial assets create better conditions for people in the pre- and post-disaster phases. In times of hazards, they can provide necessary items such as tents and food, and after the occurrence of hazards such as earthquakes and floods, they can reconstruct their houses and buy new equipment, and they are less dependent on external sources. However, some counties with greater rural populations, such as Andika, Izeh, and Baghmolek, are dependent on natural resources such as agriculture and traditional animal husbandry. A large number of villagers in these counties are supported by charity organizations such as the Relief Committee. Thus, in the event of a disaster, they are highly dependent on services provided by the government. And without the help of government agencies, their lives would be disrupted. The occurrence of hazards leaves destructive effects on settlements. Moreover, rural communities and their production activities are more damaged due to their close relationship with the natural environment, and their activity centers and residences are destroyed. Individuals and households with better financial conditions have more access to facilities, so they can provide new job opportunities for themselves. However, domestic animals and agricultural lands are the only assets of poor families, and if they are damaged during natural disasters, they will have difficulty finding other jobs. In general, access to financial capital is critical for self-employed people and small businesses, especially in the recovery phase.
The weight of savings as a proxy of financial capital in this study was higher than other indicators because other capitals (natural, physical, human, and social) should ultimately result in financial capital. It should also be argued that natural and physical capital will be lost due to hazards such as floods and earthquakes, but financial and human capital will remain. When villagers are faced with risks or effects caused by natural hazards, famine, or environmental degradation, they often change their livelihood strategies according to their capital. If the natural capital is destroyed and they do not have access to financial capital, they cannot adopt a livelihood strategy.
One of the important strategies for strengthening the livelihood resilience of villagers and poor residents of informal settlements is empowerment from the government. It is better to predict and implement this strategy before the occurrence of hazards so people can have better functioning during and after hazards. Identifying weaknesses and planning to empower and increase adaptive capacity are more difficult after the occurrence of hazards and disasters. Thus, an effective strategy should be adopted to strengthen the adaptive capacity and improve livelihood resilience in more vulnerable communities along with physical approaches such as retrofitting buildings and strengthening infrastructure before the occurrence of hazards and disasters, as pointed out by [70]. They have also suggested that livelihood resilience should be strengthened before all dimensions of resilience because it increases self-sufficiency and reduces reliance on external aid. Moreover, livelihood resilience can contribute to creating opportunities and economic capacities for the revival of the region. For example, residents in Andika County with a high ratio of the rural population, traditional agriculture, and animal husbandry are not able to provide basic facilities, such as tents, in the event of an earthquake and they depend on government loans and assistance to rebuild houses.
Adequate expertise and skills are also important factors in coping with livelihood challenges when losing a job. The low information literacy and knowledge of villagers make their engagement in business and service jobs more difficult. One of the most important ways to strengthen resilience is to increase job diversity. The lack of job diversity is one of the characteristics of the villages of Iran. Thus, most villagers are engaged in husbandry and agricultural jobs. Only paying attention to agricultural production strategies in villages cannot increase resilience. Hence, non-agricultural jobs and skills should also be taken into account at the same time. Examining the education, experiences, and skills of people, especially villagers and residents in informal settlements and slums in the pre-disaster phase and strengthening them, is one of the important measures to strengthen livelihood resilience because skills, networks, and abilities of people can help them find a job and create a source of income in the post-disaster stage. Likewise, Ref. [71] argued that post-disaster businesses belong to those who experienced them before the disaster.
The counties with the lowest rank in the resilience index become more vulnerable when they are exposed to several hazards at the same time. They may even be forced to adopt strategies such as relocation of villages, evacuation of the population, and mass migration. Counties with a high level of hazard exposure that experience frequent hazards, such as floods and droughts, are less developed due to previous disasters. Without reducing vulnerability, preventing settlement, and increasing population density in multi-hazard areas, residents’ assets and resources will always be at risk, and their level of resilience will be low. Therefore, efforts to improve livelihoods and accelerate the development process will fail without risk reduction and vulnerability management.
One of the most important indicators that affect livelihood resilience in Iran and Khuzestan Province is the country’s macroeconomic position. The economic situation and the effective function of the national economy provide more financial resources and credits to cope with hazards and improve the recovery process. Moreover, economic instability and economic shocks are among the most important factors affecting the reduction of livelihood resilience, especially among villagers and informal settlements. Ref. [19] also suggested that livelihood shocks come from the economic-political system in addition to environmental issues.
Hazards such as flood risks, flood absorption, landslides, dust, and even temperature hazards are intensified in the areas with human manipulation in nature. Such issues are more evident in Khuzestan Province with its unstable and diverse climatic conditions. Thus, activities such as constructing roads in wetlands, indiscriminate cattle grazing, the failure to control rangeland uses, and repurposing riverbeds and river boundaries have increased the intensity of hazards such as floods. Accordingly, sustainable livelihood has been suggested as an effective approach to improving individuals’ capabilities and preventing damage to nature and natural resources. Furthermore, the destruction of rangelands and biodiversity directly affects livelihood flexibility. In general, livelihood and the escalation of hazards are interrelated. Thus, the destruction of the environment for livelihood leads to the escalation of hazards, and the escalation of hazards causes the loss of natural resources (agricultural lands, rangelands, and the reduction of underground water).
Exposure assessment and livelihood resilience assessment can contribute to careful planning and taking pre-disaster measures to minimize potential destructive effects. In addition, the county-level exposure and livelihood resilience assessment is important as credits and financial resources are allotted to counties. Hence, managers and policymakers can distribute credit based on the position of the county in terms of vulnerability to hazards, development activities, and requirements.
The findings from this study can have significant implications for improving decision-making processes related to risk management and resilience in different areas in Khuzestan Province. The findings from this study can contribute to formulating local policies to implement targeted measures according to the vulnerability and existing capacities in each county. For example, identifying areas with low resilience allows managers to direct financial resources and development programs to areas most in need of strengthening infrastructure and livelihoods. For counties that face a shortage of natural resources or weak infrastructure, this study can provide some solutions, such as promoting employment in alternative industries, improving agricultural irrigation systems, or developing local cooperatives. On the other hand, the findings of this study can help improve planning to promote livelihood resilience. For example, some regions need multi-dimensional strategies when faced with hazards, due to their economic dependence on a specific field, such as agriculture or industry.
The results of this research are of great significance in the assessment of natural hazards in Khuzestan Province and can have wide applications in crisis management decision-making as well as urban and rural planning. This study identifies and analyzes high-risk areas exposed to hazards such as earthquakes, floods, inundation, and drought, employing advanced modeling methods to evaluate and prioritize these risks.
In practice, these findings can assist managers and local authorities in Khuzestan Province in designing and implementing risk reduction and crisis preparedness programs. Specifically, the earthquake risk assessment results, identifying high-risk areas in the northern and eastern parts of the province, can influence the planning of construction projects and the improvement of infrastructure in these regions. Additionally, given the identification of flood-prone areas, particularly along rivers and wetlands in the northern and eastern regions, preventive measures for flood management, such as building dams, water channels, and enhancing vegetation cover in these areas, should be prioritized.
Moreover, the drought analysis can assist provincial authorities in tailoring water and agricultural policies specifically for high-drought-risk areas, such as Khorramshahr County. Ultimately, this research can serve as a model for other regions with similar conditions in Iran and even in other countries with comparable climates and geographical contexts. It can be utilized as a guide for preventing natural hazards and mitigating their damage on a national and regional scale.

7. Conclusions

The present study assessed livelihood resilience and hazard exposure in counties in Khuzestan Province. An integrated approach using decision-making models and spatial analysis was applied in ArcGIS. This study was conducted in two phases. In the first phase, multi-criteria decision-making (MCDM) methods were used in ArcGIS for spatial analysis of exposure to floods, earthquakes, and drought in the counties. Furthermore, an integrated index was developed for each county. The results indicated that the northern and northeastern counties of the province have the highest level of exposure, and the southwestern county has the lowest level of exposure to natural hazards. The flooding risk was assessed in terms of flood exposure and flood absorption. The data showed that the counties in the northern and northeastern parts of the province, which are located in the mountainous areas and on the slopes of the Zagros Mountain, are more prone to flooding due to more precipitation and steep slopes. Moreover, central and southern counties have the highest flood absorption rate because in these areas the slope is close to zero and large rivers flow. In addition, the areas in the central, northern, western, and southern parts of the province have the highest level of drought, and the areas located in the northwestern and eastern parts of the province (mostly the elevated areas) have the lowest risk of drought. Landslides, extreme heat, dust, and subsidence are other frequent hazards in the province. These hazards need to be comprehensively evaluated in future studies, and a composite index should be developed for all hazards in the province and the counties.
The second phase of the study assessed livelihood resilience in the counties in the province, and multi-criteria decision-making methods were used for weighting and developing a composite livelihood resilience index. The results indicated that Shadegan, Ahvaz, and Mahshahr countries rank first to third in terms of infrastructure resilience, and Lali, Haftkel, and Andika counties have the lowest level of infrastructure resilience. Livelihood resilience differs from one household to another. Thus, its integrated analysis at the county level cannot show livelihood resilience within the county, between villages, and between cities and villages. One of the limitations of this study was the unavailability of objective data for households and the difficulty of assessing households on a large scale. Thus, hazards were assessed at the county level. A detailed assessment of the level of exposure and sensitivity of each village and county to hazards was also not possible in this study. Moreover, it was not possible to use qualitative methods and questionnaires for the subjective evaluation of households and residents in each county.
Despite the limitations detailed above, this study made several contributions. This study was the first attempt to assess livelihood resilience using a multi-hazard assessment approach in this province. The use of multi-criteria decision-making methods in the study area was another contribution of this study due to their multi-dimensional and multi-indicator nature of hazards, and MCDM techniques can be used in other areas for evaluating neighborhoods, counties, villages, and counties. Since spatial decision-making was performed on different data and criteria, the integration of GIS-MCDM has made the process of spatial decision-making and analysis easier, and this technique can be applied effectively to other risk areas (vulnerability, exposure, resilience) to process different GIS-based data. Using spatial analysis in response to the question of where and multi-criteria decision-making methods to answer the question of what and how much, this study tried to develop an efficient integrated risk management assessment approach.
The assessment of livelihood resilience at the community level or larger scale is important in the sense that when hazards occur, they do not affect only one household or one village, but a whole county or province is affected. If a county does not have a good economic and resilience position, a large number of the households and people living in the county cannot recover from hazards. Many livelihood resilience assessments have been performed using qualitative, conceptual, and survey methods. Due to the complexity and multidimensionality of livelihood resilience and hazards, they can be assessed more effectively using quantitative models with objective data. Previous studies have not assessed hazard exposure to develop an integrated index of hazard exposure and an integrated index of livelihood resilience. The type and intensity of hazards occurring in a community highlight the significance of the role of people and the socioeconomic position against hazards with a focus on environmental and technical approaches.
Following the findings and limitations of this study, livelihood resilience needs to be assessed at the micro and household levels to specify the difference between villages and urban areas in detail. In addition to financial assets, livelihood resilience includes other assets such as relationships and social networks, beliefs, and values. Thus, assessing the cultural and psychological aspects of individuals and households can be an important topic for future studies.
The low resilience and high exposure levels in a county indicate the county’s high level of exposure to hazards. To this end, managers and executive organizations should give priority to counties with higher levels of exposure. Furthermore, executives and policymakers can strengthen livelihood resilience by supporting entrepreneurship and small businesses, especially in villages and informal settlements, granting low-interest loans to support employment, replacing agricultural activities, especially in oil-producing counties, providing skill training for the local workforce in each county, supporting home businesses, increasing the diversity of job opportunities, directing resources and credits for investment in line with the economic potential of counties, improving irrigation methods, assessing the resilience of development-oriented projects such as the development of oil fields in the province, creating a database of the hazards of each county, and increasing villagers’ awareness of the use of forests and rangelands. One of the most important measures to strengthen livelihood resilience, reduce the distance between counties, and increase social justice is the effective execution of land use planning projects based on a multi-hazard assessment and the integrated distribution of activities and population based on hazard exposure and livelihood resilience.

Author Contributions

A.E.: Conceptualization, Writing—original draft, Methodology. M.A.: Methodology, Investigation. M.E.: Formal analysis, Data curation, Conceptualization. M.K.G.: Validation, Review and editing. Z.A.G.: Methodology, Validation. All authors have read and agreed to the published version of the manuscript.

Funding

This research received no external funding.

Data Availability Statement

Data will be made available on reasonable request from the corresponding author. The data are not available publicly due to ongoing research.

Conflicts of Interest

The authors declare that they have no known competing financial interests or personal relationships that could have appeared to influence the work reported in this paper.

References

  1. Kappes, M.S.; Keiler, M.; von Elverfeldt, K.; Glade, T. Challenges of analyzing multi-hazard risk: A review. Nat. Hazards 2012, 64, 1925–1958. [Google Scholar] [CrossRef]
  2. Argyroudis, S.A.; Mitoulis, S.A.; Hofer, L.; Zanini, M.A.; Tubaldi, E.; Frangopol, D.M. Resilience assessment framework for critical infrastructure in a multi-hazard environment: Case study on transport assets. Sci. Total Environ. 2020, 714, 136854. [Google Scholar] [CrossRef] [PubMed]
  3. Kariminejad, N.; Kazemi Garajeh, M.; Hosseinalizadeh, M.; Golkar, F.; Pourghasemi, H.R. Harnessing the Power of Remote Sensing and Unmanned Aerial Vehicles: A Comparative Analysis for Soil Loss Estimation on the Loess Plateau. Drones 2023, 7, 659. [Google Scholar] [CrossRef]
  4. Gill, J.C.; Malamud, B.D. Reviewing and visualizing the interactions of natural hazards. Rev. Geophys. 2014, 52, 680–722. [Google Scholar] [CrossRef]
  5. Marzocchi, W.; Garcia-Aristizabal, A.; Gasparini, P.; Mastellone, M.L.; Di Ruocco, A. Basic principles of multi-risk assessment: A case study in Italy. Nat. Hazards 2012, 62, 551–573. [Google Scholar] [CrossRef]
  6. Pourghasemi, H.R.; Gayen, A.; Panahi, M.; Rezaie, F.; Blaschke, T. Multi-hazard probability assessment and mapping in Iran. Sci. Total Environ. 2019, 692, 556–571. [Google Scholar] [CrossRef]
  7. Akiyama, M.; Frangopol, D.M.; Ishibashi, H. Toward life-cycle reliability-, risk-and resilience-based design and assessment of bridges and bridge networks under independent and interacting hazards: Emphasis on earthquake, tsunami and corrosion. Struct. Infrastruct. Eng. 2020, 16, 26–50. [Google Scholar] [CrossRef]
  8. Garajeh, M.K.; Guariglia, A.; Paridad, P.; Santangelo, R.; Satriano, V.; Tramutoli, V. A Robust Satellite Technique for Monitoring Landslides Impact on Electrical Infrastructures. In Proceedings of the IGARSS 2024—2024 IEEE International Geoscience and Remote Sensing Symposium, Athens, Greece, 7–12 July 2024; pp. 3960–3962. [Google Scholar]
  9. Teodoro, A.; Duarte, L. The role of satellite remote sensing in natural disaster management. In Nanotechnology-Based Smart Remote Sensing Networks for Disaster Prevention; Elsevier: Amsterdam, The Netherlands, 2022; pp. 189–216. [Google Scholar]
  10. Ghosh, S.; Mistri, B. Assessing coastal vulnerability to environmental hazards of Indian Sundarban delta using multi-criteria decision-making approaches. Ocean Coast. Manag. 2021, 209, 105641. [Google Scholar] [CrossRef]
  11. Meyer, M.A. Climate change, environment hazards and community sustainability. In Routledge International Handbook of Rural Studies; Routledge: Oxfordshire, UK, 2016; pp. 335–346. [Google Scholar]
  12. Paudel Khatiwada, S.; Deng, W.; Paudel, B.; Khatiwada, J.R.; Zhang, J.; Wan, J. A gender analysis of changing livelihood activities in the rural areas of central Nepal. Sustainability 2018, 10, 4034. [Google Scholar] [CrossRef]
  13. Abrishami, M.; Chamberlain, B. Comparing transportation metrics to measure accessibility to community amenities. J. Digit. Landsc. Arch. 2023, 8, 342–350. [Google Scholar]
  14. Khosravi, H.; Abrishami, M.; Mehrian, M.R.; Chamberlain, B. The positive impact of transit-oriented-development characteristics on Metro Station usage: A case study of Tehran’s metro stations and TOD index calculation. Cities 2024, 148, 104840. [Google Scholar] [CrossRef]
  15. Sarker, M.; Cao, Q.; Wu, M.; Hossin, M.; Alam, G.; Shouse, R. Vulnerability and livelihood resilience in the face of natural disaster: A critical conceptual review. Appl. Ecol. Environ. Res. 2019, 17, 12769–12785. [Google Scholar] [CrossRef]
  16. Kaushik, G.; Sharma, K. Climate change and rural livelihoods-adaptation and vulnerability in Rajasthan. Glob. NEST J. 2015, 17, 41–49. [Google Scholar]
  17. Ratter, B.M.; Ratter, B.M. Island vulnerability and resilience. Geogr. Small Isl. Outposts Glob. 2018, 14, 173–199. [Google Scholar]
  18. Cooper, S.J.; Wheeler, T. Adaptive governance: Livelihood innovation for climate resilience in Uganda. Geoforum 2015, 65, 96–107. [Google Scholar] [CrossRef]
  19. Quandt, A. Measuring livelihood resilience: The household livelihood resilience approach (HLRA). World Dev. 2018, 107, 253–263. [Google Scholar] [CrossRef]
  20. Belay, D.; Fekadu, G. Influence of social capital in adopting climate change adaptation strategies: Empirical evidence from rural areas of Ambo district in Ethiopia. Clim. Dev. 2021, 13, 857–868. [Google Scholar] [CrossRef]
  21. Phuong, T.T.; Tan, N.Q.; Dinh, N.C.; Van Chuong, H.; Ha, H.D.; Hung, H.T. Livelihood vulnerability to climate change: Indexes and insights from two ethnic minority communities in Central Vietnam. Environ. Chall. 2023, 10, 100666. [Google Scholar] [CrossRef]
  22. Ahmad, D.; Afzal, M. Impact of climate change on pastoralists’ resilience and sustainable mitigation in Punjab, Pakistan. Environ. Dev. Sustain. 2021, 23, 11406–11426. [Google Scholar] [CrossRef]
  23. Speranza, C.I.; Wiesmann, U.; Rist, S. An indicator framework for assessing livelihood resilience in the context of social–ecological dynamics. Glob. Environ. Chang. 2014, 28, 109–119. [Google Scholar] [CrossRef]
  24. Li, T.; Cai, S.; Singh, R.K.; Cui, L.; Fava, F.; Tang, L.; Xu, Z.; Li, C.; Cui, X.; Du, J. Livelihood resilience in pastoral communities: Methodological and field insights from Qinghai-Tibetan Plateau. Sci. Total Environ. 2022, 838, 155960. [Google Scholar] [CrossRef] [PubMed]
  25. Bakhtiari, A. Country Report: The Islamic Republic of Iran on Disaster Risk Management. Iranian National Disaster Management Organization (NDMO) and Visiting Researcher at ADRC. 2014. Available online: https://www.adrc.asia/countryreport/IRN/2013/IRN_CR2013B.pdf (accessed on 10 September 2024).
  26. Arvin, M.; Beiki, P.; Hejazi, S.J.; Sharifi, A.; Atashafrooz, N. Assessment of infrastructure resilience in multi-hazard regions: A case study of Khuzestan Province. Int. J. Disaster Risk Reduct. 2023, 88, 103601. [Google Scholar] [CrossRef]
  27. Khavarian-Garmsir, A.R.; Pourahmad, A.; Hataminejad, H.; Farhoodi, R. Climate change and environmental degradation and the drivers of migration in the context of shrinking cities: A case study of Khuzestan province, Iran. Sustain. Cities Soc. 2019, 47, 101480. [Google Scholar] [CrossRef]
  28. Hejazi, S.J.; Sharifi, A.; Arvin, M. Assessment of social vulnerability in areas exposed to multiple hazards: A case study of the Khuzestan Province, Iran. Int. J. Disaster Risk Reduct. 2022, 78, 103127. [Google Scholar] [CrossRef]
  29. Mendonça, D.; Amorim, I.; Kagohara, M. An historical perspective on community resilience: The case of the 1755 Lisbon Earthquake. Int. J. Disaster Risk Reduct. 2019, 34, 363–374. [Google Scholar] [CrossRef]
  30. Amadu, I.; Armah, F.A.; Aheto, D.W. Assessing livelihood resilience of artisanal fisherfolk to the decline in small-scale fisheries in Ghana. Sustainability 2021, 13, 10404. [Google Scholar] [CrossRef]
  31. Singh, R.; Bhardwaj, R.; Sureja, A.; Kumar, A.; Singh, A.; Hazarika, B.; Hussain, S.; Singh, A.; Lego, J.; Rallen, O. Livelihood resilience in the face of multiple stressors: Biocultural resource-based adaptive strategies among the vulnerable communities. Sustain. Sci. 2021, 17, 275–293. [Google Scholar] [CrossRef]
  32. Nuvey, F.S.; Addo-Lartey, A.; Nortey, P.A.; Addo, K.K.; Bonfoh, B. Coping with adversity: Resilience dynamics of livestock farmers in two agroecological zones of Ghana. Int. J. Environ. Res. Public Health 2021, 18, 9008. [Google Scholar] [CrossRef]
  33. Tanner, T.; Lewis, D.; Wrathall, D.; Bronen, R.; Cradock-Henry, N.; Huq, S.; Lawless, C.; Nawrotzki, R.; Prasad, V.; Rahman, M.A. Livelihood resilience in the face of climate change. Nat. Clim. Chang. 2015, 5, 23–26. [Google Scholar] [CrossRef]
  34. Mallick, B. The Nexus between Socio-Ecological System, Livelihood Resilience, and Migration Decisions: Empirical Evidence from Bangladesh. Sustainability 2019, 11, 3332. [Google Scholar] [CrossRef]
  35. Mohimi, A.; Esmaeily, A. Spatiotemporal analysis of urban sprawl using a multi-technique approach and remote sensing satellite imagery from 1990 to 2020: Kerman/Iran. Environ. Dev. Sustain. 2024, 26, 18033–18068. [Google Scholar] [CrossRef]
  36. Pratiwi, N.; Karuniasa, M.; Suroso, D. Self-organization and crop insurance to enhance livelihood resilience: A case of rice farmers in Cirebon Regencym, Indonesia. ASEAN J. Community Engagem. 2018, 2, 1. [Google Scholar] [CrossRef]
  37. Liu, H.; Pan, W.; Su, F.; Huang, J.; Luo, J.; Tong, L.; Fang, X.; Fu, J. Livelihood resilience of rural residents under natural disasters in China. Sustainability 2022, 14, 8540. [Google Scholar] [CrossRef]
  38. Lee, K.-C.; Karimova, P.G.; Yan, S.-Y.; Li, Y.-S. Resilience assessment workshops: A biocultural approach to conservation management of a rural landscape in Taiwan. Sustainability 2020, 12, 408. [Google Scholar] [CrossRef]
  39. Salehi Mava, F.; Khatami, S.M.; Ranjbar, E. An Analysis on the Factors Affecting the Creation of Event-Oriented Urban Public Spaces Case Study: Central Part of Tehran (District 12). Mon. Sci. J. Bagh-E Nazar 2022, 19, 85–98. [Google Scholar]
  40. Simmie, J.; Martin, R. The economic resilience of regions: Towards an evolutionary approach. Camb. J. Reg. Econ. Soc. 2010, 3, 27–43. [Google Scholar] [CrossRef]
  41. Kazemi Garajeh, M.; Guariglia, A.; Paridad, P.; Santangelo, R.; Satriano, V.; Tramutoli, V. Detecting small-scale landslides along electrical lines using robust satellite-based techniques. Geomat. Nat. Hazards Risk 2024, 15, 2409203. [Google Scholar] [CrossRef]
  42. Kazemi Garajeh, M.; Weng, Q.; Hossein Haghi, V.; Li, Z.; Kazemi Garajeh, A.; Salmani, B. Learning-based methods for detection and monitoring of shallow flood-affected areas: Impact of shallow-flood spreading on vegetation density. Can. J. Remote Sens. 2022, 48, 481–503. [Google Scholar] [CrossRef]
  43. Spiker, E.C.; Gori, P. National Landslide Hazards Mitigation Strategy, a Framework for Loss Reduction; US Geological Survey: Reston, VA, USA, 2003. [Google Scholar]
  44. López-Saavedra, M.; Martí, J. Reviewing the multi-hazard concept. Application to volcanic islands. Earth-Sci. Rev. 2023, 236, 104286. [Google Scholar] [CrossRef]
  45. Sadegh, M.; Moftakhari, H.; Gupta, H.V.; Ragno, E.; Mazdiyasni, O.; Sanders, B.; Matthew, R.; AghaKouchak, A. Multihazard scenarios for analysis of compound extreme events. Geophys. Res. Lett. 2018, 45, 5470–5480. [Google Scholar] [CrossRef]
  46. Wang, J.; He, Z.; Weng, W. A review of the research into the relations between hazards in multi-hazard risk analysis. Nat. Hazards 2020, 104, 2003–2026. [Google Scholar] [CrossRef]
  47. Yaraghi fard, M.; Shokouhibidhendi, M. Futuristic research of resilience of water resources with scenario planning approach based on case study: Zayandeh Rood watershed. Water Soil Manag. Model. 2024. [Google Scholar] [CrossRef]
  48. Vahedifard, F.; AghaKouchak, A.; Jafari, N.H. Compound hazards yield Louisiana flood. Science 2016, 353, 1374. [Google Scholar] [CrossRef] [PubMed]
  49. Zarasvandi, A.; Carranza, E.; Heidari, M.; Mousapour, E. Environmental factors of urinary stones mineralogy, Khouzestan Province, Iran. J. Afr. Earth Sci. 2014, 97, 368–376. [Google Scholar] [CrossRef]
  50. Bathrellos, G.D.; Skilodimou, H.D.; Chousianitis, K.; Youssef, A.M.; Pradhan, B. Suitability estimation for urban development using multi-hazard assessment map. Sci. Total Environ. 2017, 575, 119–134. [Google Scholar] [CrossRef]
  51. Darvishzadeh, R.; Hosseiniasl, A.; Ebrahimi Khusfid, M.; Ebrahimi Khusfie, Z. Knowledge based drought risk zonation in arid regions using GIS (Case study: Sheitoor, Yazd). J. Clim. Res. 2011, 1390, 103–116. [Google Scholar]
  52. Fang, Y.-p.; Zhu, F.-b.; Qiu, X.-p.; Zhao, S. Effects of natural disasters on livelihood resilience of rural residents in Sichuan. Habitat Int. 2018, 76, 19–28. [Google Scholar] [CrossRef]
  53. Alam, G.M.; Alam, K.; Mushtaq, S.; Leal Filho, W. How do climate change and associated hazards impact on the resilience of riparian rural communities in Bangladesh? Policy implications for livelihood development. Environ. Sci. Policy 2018, 84, 7–18. [Google Scholar] [CrossRef]
  54. Ahmadi, R.; Asemani, M.; Hamidi, N.; Rezaei, S.S.; Ahmadi, A.; Amirahmadi, F.; Aghaei, S.; Bayat, F. Analyzing the relationship between place attachment and residential satisfaction through the mediation of social capital-the case of affordable housing. J. Hous. Built Environ. 2024, 39, 1–23. [Google Scholar] [CrossRef]
  55. Pour, M.D.; Barati, A.A.; Azadi, H.; Scheffran, J. Revealing the role of livelihood assets in livelihood strategies: Towards enhancing conservation and livelihood development in the Hara Biosphere Reserve, Iran. Ecol. Indic. 2018, 94, 336–347. [Google Scholar] [CrossRef]
  56. Zhou, W.; Guo, S.; Deng, X.; Xu, D. Livelihood resilience and strategies of rural residents of earthquake-threatened areas in Sichuan Province, China. Nat. Hazards 2021, 106, 255–275. [Google Scholar] [CrossRef] [PubMed]
  57. Zhang, H.; Yang, J.; Li, L.; Shen, D.; Wei, G.; Dong, S. Measuring the resilience to floods: A comparative analysis of key flood control cities in China. Int. J. Disaster Risk Reduct. 2021, 59, 102248. [Google Scholar] [CrossRef]
  58. Liu, W.; Li, J.; Ren, L.; Xu, J.; Li, C.; Li, S. Exploring livelihood resilience and its impact on livelihood strategy in rural China. Soc. Indic. Res. 2020, 150, 977–998. [Google Scholar] [CrossRef]
  59. Olowo, S.F.; Omotayo, A.O.; Lawal, I.O.; Aremu, A.O. Improving rural livelihood through the cultivation of indigenous fruits and vegetables: Evidence from Ondo State, Nigeria. Agriculture 2022, 12, 372. [Google Scholar] [CrossRef]
  60. Singh, P.K.; Nair, A. Livelihood vulnerability assessment to climate variability and change using fuzzy cognitive mapping approach. Clim. Chang. 2014, 127, 475–491. [Google Scholar] [CrossRef]
  61. Chanotra, S.; Bali, K.; Bali, R. Sericulture: An opportunity for the upliftment of rural livelihood. J. Entomol. Zool. Stud 2019, 7, 1100–1103. [Google Scholar]
  62. Das, S.; Majumder, S.; Sharma, K.K. Assessing integrated agricultural livelihood vulnerability to climate change in the coastal region of West Bengal: Implication for spatial adaptation planning. Reg. Stud. Mar. Sci. 2023, 57, 102748. [Google Scholar] [CrossRef]
  63. Temiz, N.; Tecim, V. The use of GIS and multi-criteria decision-making as a decision tool in forestry. OR Insight 2009, 22, 105–123. [Google Scholar] [CrossRef]
  64. Ghodsi, V.B.; Terzi, F. Measuring the Accessibility and Capacity Sufficiency of Private and Public Health Centers in the Istanbul Metropolitan Area. Appl. Spat. Anal. Policy 2024, 17, 729–752. [Google Scholar] [CrossRef]
  65. Malczewski, J. GIS and Multicriteria Decision Analysis; John Wiley & Sons, Inc.: Hoboken, NJ, USA, 1999. [Google Scholar]
  66. Mesran, M.; Siregar, D.; Nasution, S.D.; Sahir, S.H.; Diansyah, T.M.; Agustina, I.; Supriyanto, S.; Wardayani, W.; Hasibuan, N.A.; Lubis, D.S.W. The VIKOR Method to Support the Effectiveness of Decisions in Determining Work Incentive Recipients. Proc. J. Phys. Conf. Ser. 2019, 1175, 012043. [Google Scholar] [CrossRef]
  67. Van den Berg, M. Household income strategies and natural disasters: Dynamic livelihoods in rural Nicaragua. Ecol. Econ. 2010, 69, 592–602. [Google Scholar] [CrossRef]
  68. Parsons, M.; Reeve, I.; McGregor, J.; Hastings, P.; Marshall, G.R.; McNeill, J.; Stayner, R.; Glavac, S. Disaster resilience in Australia: A geographic assessment using an index of coping and adaptive capacity. Int. J. Disaster Risk Reduct. 2021, 62, 102422. [Google Scholar] [CrossRef]
  69. Nurzaman, A.; Shaw, R.; Roychansyah, M.S. Measuring community resilience against coastal hazards: Case study in Baron Beach, Gunungkidul Regency. Prog. Disaster Sci. 2020, 5, 100067. [Google Scholar] [CrossRef]
  70. Sina, D.; Chang-Richards, A.Y.; Wilkinson, S.; Potangaroa, R. A conceptual framework for measuring livelihood resilience: Relocation experience from Aceh, Indonesia. World Dev. 2019, 117, 253–265. [Google Scholar] [CrossRef]
  71. Thorburn, C. Livelihood recovery in the wake of the tsunami in Aceh. Bull. Indones. Econ. Stud. 2009, 45, 85–105. [Google Scholar] [CrossRef]
Figure 1. Location of Khuzestan Province.
Earth 05 00054 g001
Figure 2. An overview of the applied methodology in the present study.
Earth 05 00054 g002
Figure 3. The VIKOR output for seismicity.
Earth 05 00054 g003
Figure 4. Ranking the counties in terms of seismicity.
Earth 05 00054 g004
Figure 5. The VIKOR output for flooding risk across the province.
Earth 05 00054 g005
Figure 6. Ranking the counties in terms of flood exposure.
Earth 05 00054 g006
Figure 7. The VIKOR output for flood absorption across the province.
Earth 05 00054 g007
Figure 8. Ranking the counties in terms of flood exposure (flood absorption).
Earth 05 00054 g008
Figure 9. The VIKOR output for drought risk across the province.
Earth 05 00054 g009
Figure 10. Ranking the counties in terms of drought risk.
Earth 05 00054 g010
Figure 11. The integrated (multi-hazard) exposure index for Khuzestan Province.
Earth 05 00054 g011
Figure 12. Ranking of the counties based on the integrated exposure index.
Earth 05 00054 g012
Figure 13. The livelihood ranks of the counties.
Earth 05 00054 g013
Table 1. The hazard assessment indicators of Khuzestan Province.
HazardIndicatorReferenceFeature/Character/NatureEffectWeight by the Best-Worst Method
EarthquakeDistance from the fault[50]MeterDecreasing0.4017
Distance from previous earthquake centers MeterDecreasing0.1674
The density of previous earthquakes DensityIncreasing0.1255
The intensity of previous earthquakes[50]RichterIncreasing0.1004
Earthquake depth MeterDecreasing0.0837
Soil type[6]TypeIncreasing0.0837
Slope[50]DegreeIncreasing0.0377
Total weight1
FloodDistance from the river[50]MeterDecreasing0.2879
Flood zones FieldIncreasing0.1892
Precipitation[6]MillimeterIncreasing0.1344
Slope[50]DegreeIncreasing0.1008
Drainage density[50]DensityIncreasing0.0806
Vegetation density DensityDecreasing0.0672
Erosion rate[50]TypeIncreasing0.0576
Soil permeability TypeDecreasing0.0576
Land use[50]TypeIncreasing0.0247
Total weight1
Flood absorptionSlope[50]DegreeDecreasing0.2288
Flood zones[6]FieldIncreasing0.1945
Distance from the river[6]MeterDecreasing0.1236
Soil permeability[6,50]TypeDecreasing0.1121
Precipitation MillimeterIncreasing0.0847
Land use[50]TypeIncreasing0.0778
Vegetation density DensityDecreasing0.0686
Drainage density[6]DensityIncreasing0.0572
Erosion rate[50]TypeIncreasing0.0526
DroughtTotal weight1
Precipitation[6]MillimeterDecreasing0.3501
Temperature[50]CelsiusIncreasing0.2387
Evaporation[6]Cubic meterIncreasing0.1592
Water network density[51]DensityDecreasing0.1194
Height[6]MeterDecreasing0.0955
Land use[6]TypeIncreasing0.0371
Total weight1
Table 2. The livelihood resilience indicators.
IndicatorDefentionReferencesImpact
Per capita savingThe average amount of bank deposits per person in a particular community or region.[56,57]Increasing
Irrigated lands (area)Cultivated areas using water resources[58]Increasing
Rainfed lands (area)Rainfed land areas refer to lands that depend solely on natural rainfall.[58]Increasing
Animal productsThe amount of production of livestock products per ton.[32]Increasing
Garden productsThe amount of production of garden products per ton[59]Increasing
RangelandsAmount of land covered with natural vegetation for grazing per hectare.[60]Increasing
Women’s occupationsWomen’s employment rate[61]Increasing
Men’s occupationsMen’s employment rate[61]Increasing
Table 3. Ranking of counties in terms of exposure using the best-worst and VIKOR methods.
CountyEarthquakeFlood ExposureFlood AbsorptionDroughtMulti-Hazard Index
ValueRankValueRankValueRankValueRankValueRank
Dezful0.76950.54240.363130.482151.0001
Lali0.78520.54230.342220.451200.9832
Shoshtar0.75570.464110.40420.493130.9813
Andika0.79310.54810.348170.422250.9794
Masjed Solyman0.78130.50270.314270.478170.9625
Gotvand0.742110.46780.351160.505120.9586
Andimeshk0.76760.51060.345190.442220.9587
Ezeh0.77340.54220.343210.397270.9548
Baghmalek0.745100.51450.333240.412260.9319
Haftakal0.736120.462120.327260.475180.92710
Behbahan0.75280.456130.344200.432240.92011
Aghajari0.75290.46590.328250.435230.91812
Ramhormez0.730130.465100.341230.443210.91713
Shoush0.690150.416150.37380.492140.91314
Bavi0.687160.394180.368110.511100.90915
Hamidiye0.678170.398170.366120.51650.90816
Omidiyeh0.718140.423140.346180.463190.90517
Hindijan0.664200.393190.37760.51280.90218
Dasht Azadegan0.675190.382210.362140.51460.89619
Ramshir0.678180.403160.361150.478160.89020
Ahvaz0.645210.374220.37290.508110.88121
Karoun0.605220.359240.38930.51270.86522
Hoyzeh0.553240.383200.37370.52040.84823
Bandar Mahshahr0.567230.367230.37950.51190.84624
Shadegan0.483250.351260.38640.52430.80925
Khorramshahr0.385260.315270.370100.56710.76026
Abadan0.280270.352250.42610.53520.73927
Table 4. DIMATEL results.
IndicatorRJR + JR − J w j W ¯ j
Per capita saving1.72.543.71−1.373.950.175
Employed men1.472.233.70−0.763.780.167
Employed women1.122.193.31−1.083.480.154
Irrigated lands2.240.332.571.913.200.142
Rainfed lands1.70.231.390.941.680.074
Animal production1.391.432.83−0.042.830.125
Garden production1.101.472.57−0.362.600.115
Range lands0.750.000.750.751.070.047
Table 5. The final livelihood resilience ranks of the counties.
CountiesQCountiesQ
Abaden0.46Dashte Azadeghan0.47
Aghajari0.77Ramshir0.48
Omidiyeh0.50Ramhormoz0.37
Andika0.93Shadegan0.16
Andimeshk0.58Shush0.32
Ahvaz0.27Shushtar0.69
Izeh0.60Karun0.46
Bagh-e Malek0.57Gotvand0.62
Bavi0.75Lali0.81
Mahshahr0.28Masjed Soleyman0.72
Behbahan0.31Haftgel0.83
Hamidiyeh0.70Hendijan0.46
Khoramshahr0.35Hoveyzeh0.58
Dezful0.00
Disclaimer/Publisher’s Note: The statements, opinions and data contained in all publications are solely those of the individual author(s) and contributor(s) and not of MDPI and/or the editor(s). MDPI and/or the editor(s) disclaim responsibility for any injury to people or property resulting from any ideas, methods, instructions or products referred to in the content.

