1. Introduction
The agricultural development of a country plays a strategic role in successfully reducing poverty. Some countries with the highest annual GDP growth achieved this through agricultural development programs focused on poverty alleviation in rural areas [
1]. Increased investment in agriculture contributes to eradicating hunger and reducing poverty and inequality while strengthening the resilience of rural households [
2]. Agricultural sector growth increases productivity and incomes for small farmers, as well as employment and wages for agricultural workers. With increased productivity, food prices decrease, and inflation is kept in check, which also contributes to reducing poverty [
3].
Likewise, agriculture is closely related to other productive sectors; therefore, strengthening the dynamic relationship between agriculture and industry and closing the gap between urban and rural areas is a key strategy for rural development and for reducing inequality and poverty [
4]. Various authors have shown that the agricultural sector is a key factor in mitigating poverty and ultimately achieving economic development in many countries [
5,
6,
7].
It has been demonstrated that a 1% increase in agricultural production is directly related to a reduction in poverty and an improvement in food security between 5.4% and 0.22% [
8]. Based on this, investments and policies to promote the growth of the agricultural economy are essential strategies for fostering inclusive growth in the rural sector [
3]. This is particularly important considering that poverty levels are higher in rural areas than in urban areas [
9].
In Colombia, between 2019 and 2020, the rate of multidimensional poverty incidence in the rural population increased three times more than in departmental capitals [
10]. Factors such as transportation difficulties and limited access to education, healthcare, and public services, among others, affect the quality of life of rural inhabitants and lead to higher multidimensional poverty rates [
11]. As Amartya Sen states, economic poverty is not the only factor that impoverishes human life.
A comprehensive description of the multidimensional nature of poverty not only addresses its multiple manifestations but also its intrinsic interconnections [
12]. The Multidimensional Poverty Index (MPI), developed by the Oxford Poverty and Human Development Initiative (OPHI), is an indicator that reflects the degree of deprivation of people in a set of dimensions. The index allows the nature of the deprivation (according to the selected dimensions) and its intensity to be determined.
Considering that in Latin America, approximately 120 million people live in rural areas, poverty-related problems are concentrated in this population. In Central America, around 40% of the population is rural, equivalent to approximately 19 million inhabitants, and it is estimated that more than half of the Central American population lives in poverty [
13]. In Colombia, rural populations, particularly those in remote areas, have experienced persistent poverty and have borne the brunt of the internal armed conflict [
14].
Nonetheless, Colombia has latent agricultural production potential, with climatic conditions that account for a variety of thermal floors, natural resources, and a strategic geographical position, among other benefits, making it a potential hub for developing productive agricultural sector projects [
15]. By 2023, the added value in agriculture, livestock, hunting, forestry, and fishing was one of the economic activities that showed growth, with an increase of 0.5% between January and September compared to the same period in 2022. Coffee, bananas, plantains, flowers, cocoa, fruits, and vegetables are some of the highlighted crops that have recorded significant production increases [
16].
In this context, it is essential to identify whether the production and yields of these crops are related to the Multidimensional Poverty Index (MPI). Therefore, this research determined the current relationship between agricultural growth and economic development in Colombia. It tested whether there is a correlation between the Multidimensional Rural Poverty Index (MPI-Rural), area, production, and yield for coffee, plantain, and corn crops for the period 2018–2021.
The novelty of this study lies in its approach to the research question. It looks at the specific relationships between agricultural growth and economic development in Colombia by examining the correlation between the Multidimensional Rural Poverty Index (MPI-Rural) and the area, production, and yield of three key crops: coffee, plantain, and corn. This micro-level analysis provides insights into the effectiveness of agricultural strategies for poverty reduction in Colombia, focusing on these specific crops and their impact on rural poverty. The contribution of the study is further enhanced using the Malmquist Productivity Index, which assesses changes in efficiency over time, to draw parallels between productivity analysis and the multidimensional nature of poverty assessment. This approach adds a unique dimension to the understanding of the complex interplay between agricultural productivity and multidimensional poverty. This research addresses the gap in understanding the specific impact of these key crops on rural poverty levels in Colombia, providing insights for targeted poverty reduction strategies.
2. Materials and Methods
The methodology used for this study consisted of several stages summarized in
Figure 1. To understand the relationships between the MPI and agricultural production, a literature review was conducted through a bibliometric analysis using the Scopus database. Keywords related to the Multidimensional Poverty Index and agriculture were used by constructing the equation described in
Table 1.
Certain search criteria were considered to ensure the accuracy of the information, such as keywords in English, various types of documents including articles and secondary sources, and a search range from 1966 to 2024.
The Scopus database identified the percentage of documents addressing the study topic by areas of action and the countries predominantly producing scientific output on the subject. The VOS Viewer tool was also used to conduct a co-occurrence analysis, establishing semantic networks. A combination of all the keywords with co-occurrence was performed to enhance visualization.
Furthermore, a citation analysis by documents was conducted, considering a minimum of five citations per document, as well as a citation analysis by journal, using a criterion of at least five documents per journal.
The second stage consisted of collecting and systematizing secondary information from the Agricultural Sector Statistical Yearbook for the years 2018 to 2022 [
17] and the Multidimensional Poverty Indicators by regions and departments for the years 2018 to 2021 [
18]. This study analyzed data for coffee, plantain, and corn crops concerning productive area, production in tons, yield per hectare, national production in tons, and regional production in tons.
The third stage involved constructing a database with information on coffee, plantain, and corn crops versus the Multidimensional Rural Poverty Index for each crop and municipality in the country.
In the fourth methodological stage, a quantitative statistical analysis was conducted to establish the relationships between productive area, production in tons, yield per hectare, national production in tons, and regional production in tons for corn, plantain, and coffee crops and their relationship with the Multidimensional Poverty Index in Colombia for the years 2018 to 2022. The statistical analysis primarily focuses on establishing the relationship between agricultural productivity (measured by area, production, and yield) and the Multidimensional Rural Poverty Index (MPI-Rural) in Colombia from 2018 to 2021. A quantitative approach was used, likely employing Pearson correlation analysis to determine the strength and direction of the association between these variables. For all data, the univariate and multivariate normality assumptions were verified, as well as the homogeneity of variances assumption. The analysis aims to test the hypothesis that higher agricultural yields correspond to lower levels of multidimensional rural poverty. We also leverage the concept of the Malmquist Productivity Index, which evaluates changes in efficiency over time, to draw parallels between productivity analysis and the multidimensional nature of poverty assessment.
3. Results and Discussion
In the bibliometric analysis, 173 documents were found, of which 83% correspond to scientific articles; the remaining 17% are distributed among conference papers, reviews, book chapters, and others. Scientific production by year highlights an increase in 2001, with three published documents. From 2002 to 2007, two publications are reported. From 2008 to 2016, there were fluctuations in production, with an average of four articles per year. However, from 2017 onwards, a significant growth is evident, with an average of 16 articles published per year in the scientific literature (
Figure 2).
Likewise, the areas that most address this topic were identified, including environmental sciences, agriculture and biological sciences, earth and planetary sciences, computer science, and social sciences, among others, as shown in
Figure 3.
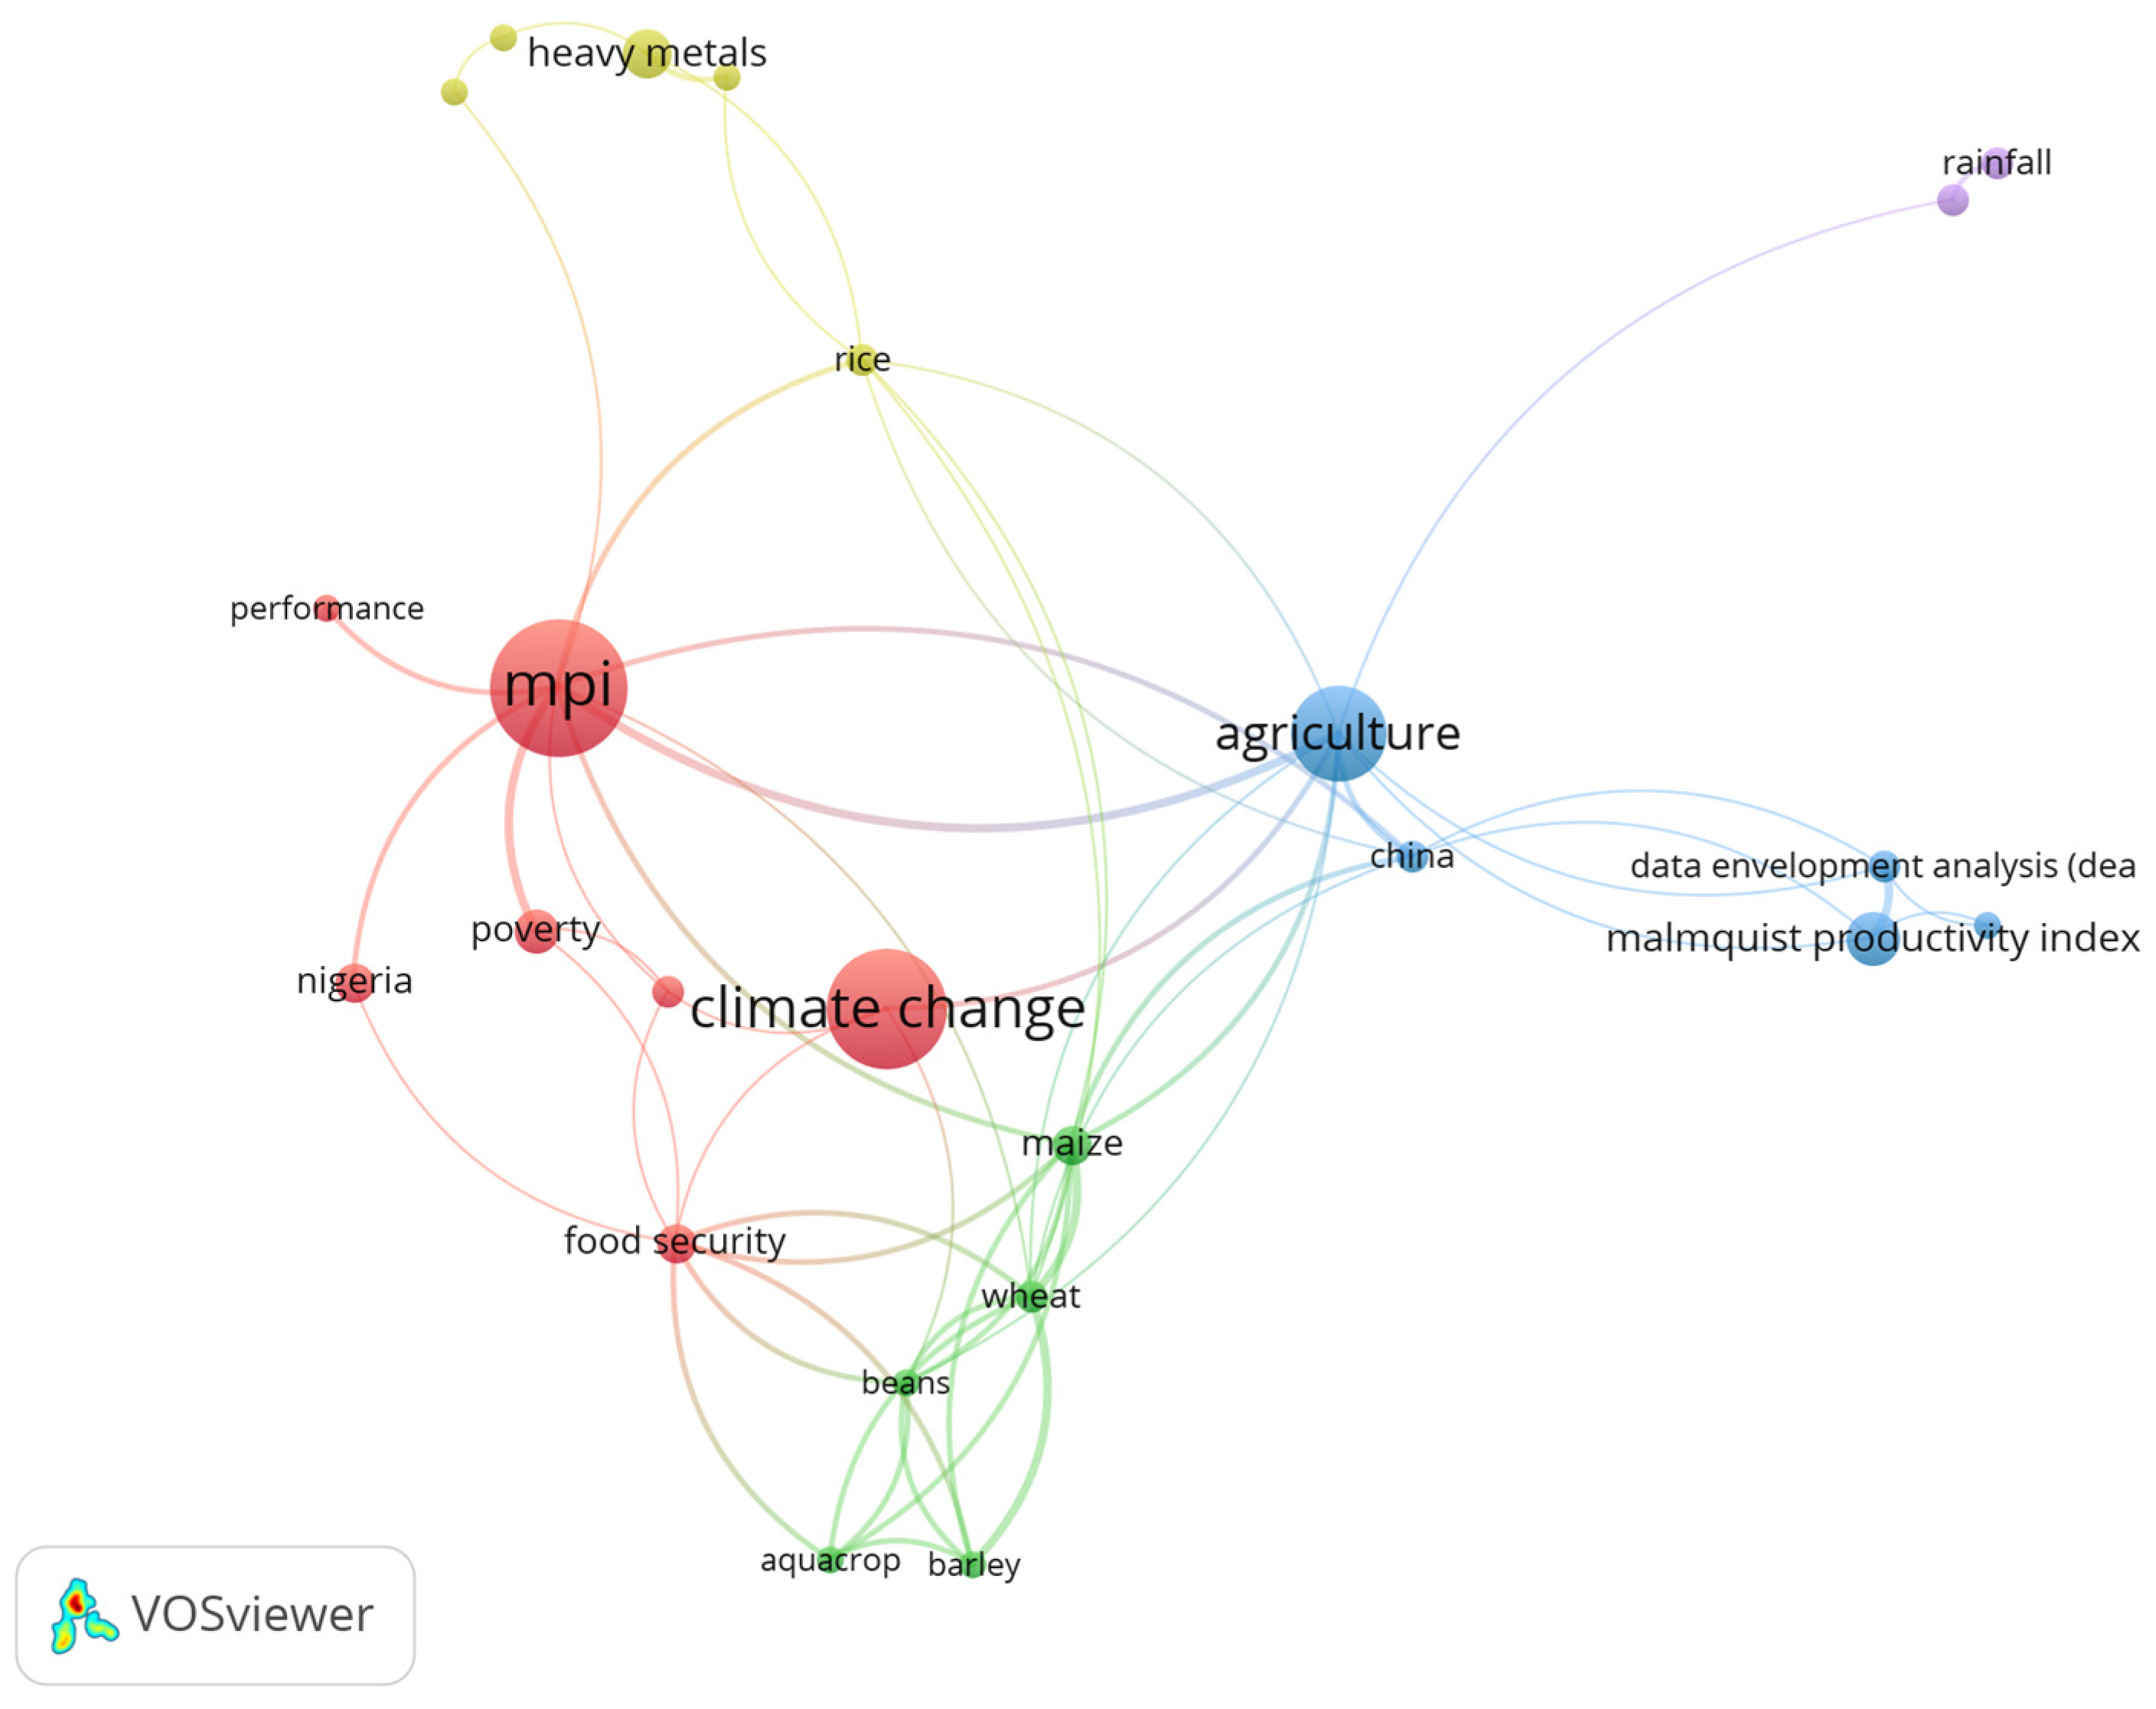
The results of the semantic networks (VOSViewer [
19,
20]) allow one to visualize how the descriptors related to the Multidimensional Poverty Index show correlations between climate change, food, environment, yields, efficiency, crops, agriculture, poverty, education, and industry and how these, in turn, present a strong correlation with the Malmquist Productivity Index, as shown in
Figure 4.
Once the descriptors are grouped through terms disambiguation, a close correlation is presented between the Multidimensional Poverty Index, climate change, and agriculture. Similarly, descriptors such as poverty, productive yields, food security, and the Malmquist Productivity Index show significant correlations. Additionally, crops such as corn, wheat, beans, rice, and barley show correlations (
Figure 5).
The correlation between the Multidimensional Poverty Index and the Malmquist Productivity Index is intrinsic, as both analyze multiple inputs or variables. The Malmquist Productivity Index, first introduced in 1953 by Professor Sten Malmquist, evaluates changes in efficiency over time within the framework of multiple inputs and outputs [
21]. This type of measurement is part of data envelopment analysis (DEA), a robust methodology for assessing efficiency in various areas, including the banking industry, educational systems, and agricultural production, among others [
22].
In agriculture, DEA analyses have been used to evaluate agricultural performance in terms of yield and revenue in order to determine technical efficiency, production efficiency, and factors influencing eco-efficiency between land area and population [
23,
24,
25,
26,
27,
28].
The MPI, on the other hand, comprises several dimensions and indicators corresponding to a data envelopment analysis that reflects the degree of deprivation of individuals across a set of dimensions. In this way, a person is identified as multidimensionally poor if they are deprived in at least one-third of the weighted indicators [
12].
Regarding the correlations between the Multidimensional Poverty Index, climate change, agriculture, productive yields, food security, and crops such as corn, wheat, beans, and rice, they are explained by the fact that the impacts of climate change have considerable effects on well-being and economic development, especially in areas with agricultural potential, where productive yields depend heavily on natural resources and climatic patterns. In turn, productive yields determine rural employment rates and, therefore, households’ capacities in terms of their well-being and livelihoods [
29]. Thus, agricultural productivity and yields determine the degree of deprivation of individuals across a set of dimensions according to the MPI. In this way, climatic risks increase households’ vulnerability and exposure, hindering their ability to overcome poverty due to their inability to increase their assets and continue with limited resources to protect themselves in adverse situations [
30].
Figure 6 shows the percentage distribution (%) of production (tons) for coffee, plantain, and corn crops in Colombia.
In Colombia, the results of the 2014 National Agricultural Census determined that total agricultural production amounted to 33,998,002 million tons, and the harvested area corresponded to 6,705,677 million hectares. For coffee cultivation, the departments with the highest participation in harvested area were Antioquia (16.6%), Huila (13.7%), Cauca (11.4%), and Tolima (10.7%); more than 52.3% of the production (tons) was concentrated in these departments. In the case of plantain cultivation, the departments of Antioquia, Meta, Tolima, Nariño, and Córdoba represented 54.0% of production. Regarding corn cultivation, the departments with the highest participation in production were Meta, Tolima, Chocó, Bolívar, and Córdoba, with 49.2% [
31].
In the next sections, the results of the correlation analysis between the variables of area, production, yield, and the Multidimensional Rural Poverty Index (MPI-Rural) in Colombia for coffee, plantain, and corn crops for the period 2018 to 2021 are shown.
Table 2 shows the descriptive statistics of the variables analyzed.
3.1. Coffee Cultivation
Colombia has consolidated itself as the third-largest coffee producer in the world and the leading producer of Arabica beans grown in the highlands of the Andean mountains [
32]. In the 2022/23 coffee year, national production was 10.6 million bags, with domestic consumption of 2.2 million bags, and exports amounted to approximately 10.3 million bags. The coffee sector in Colombia represents 15% of the agricultural GDP and demands around 2.5 million direct and indirect jobs [
16]. This crop provides livelihoods to about 25 million peasant families, and around 540,000 families directly rely on coffee cultivation, which is produced on small farms of no more than two hectares; only 5% of coffee plots are larger.
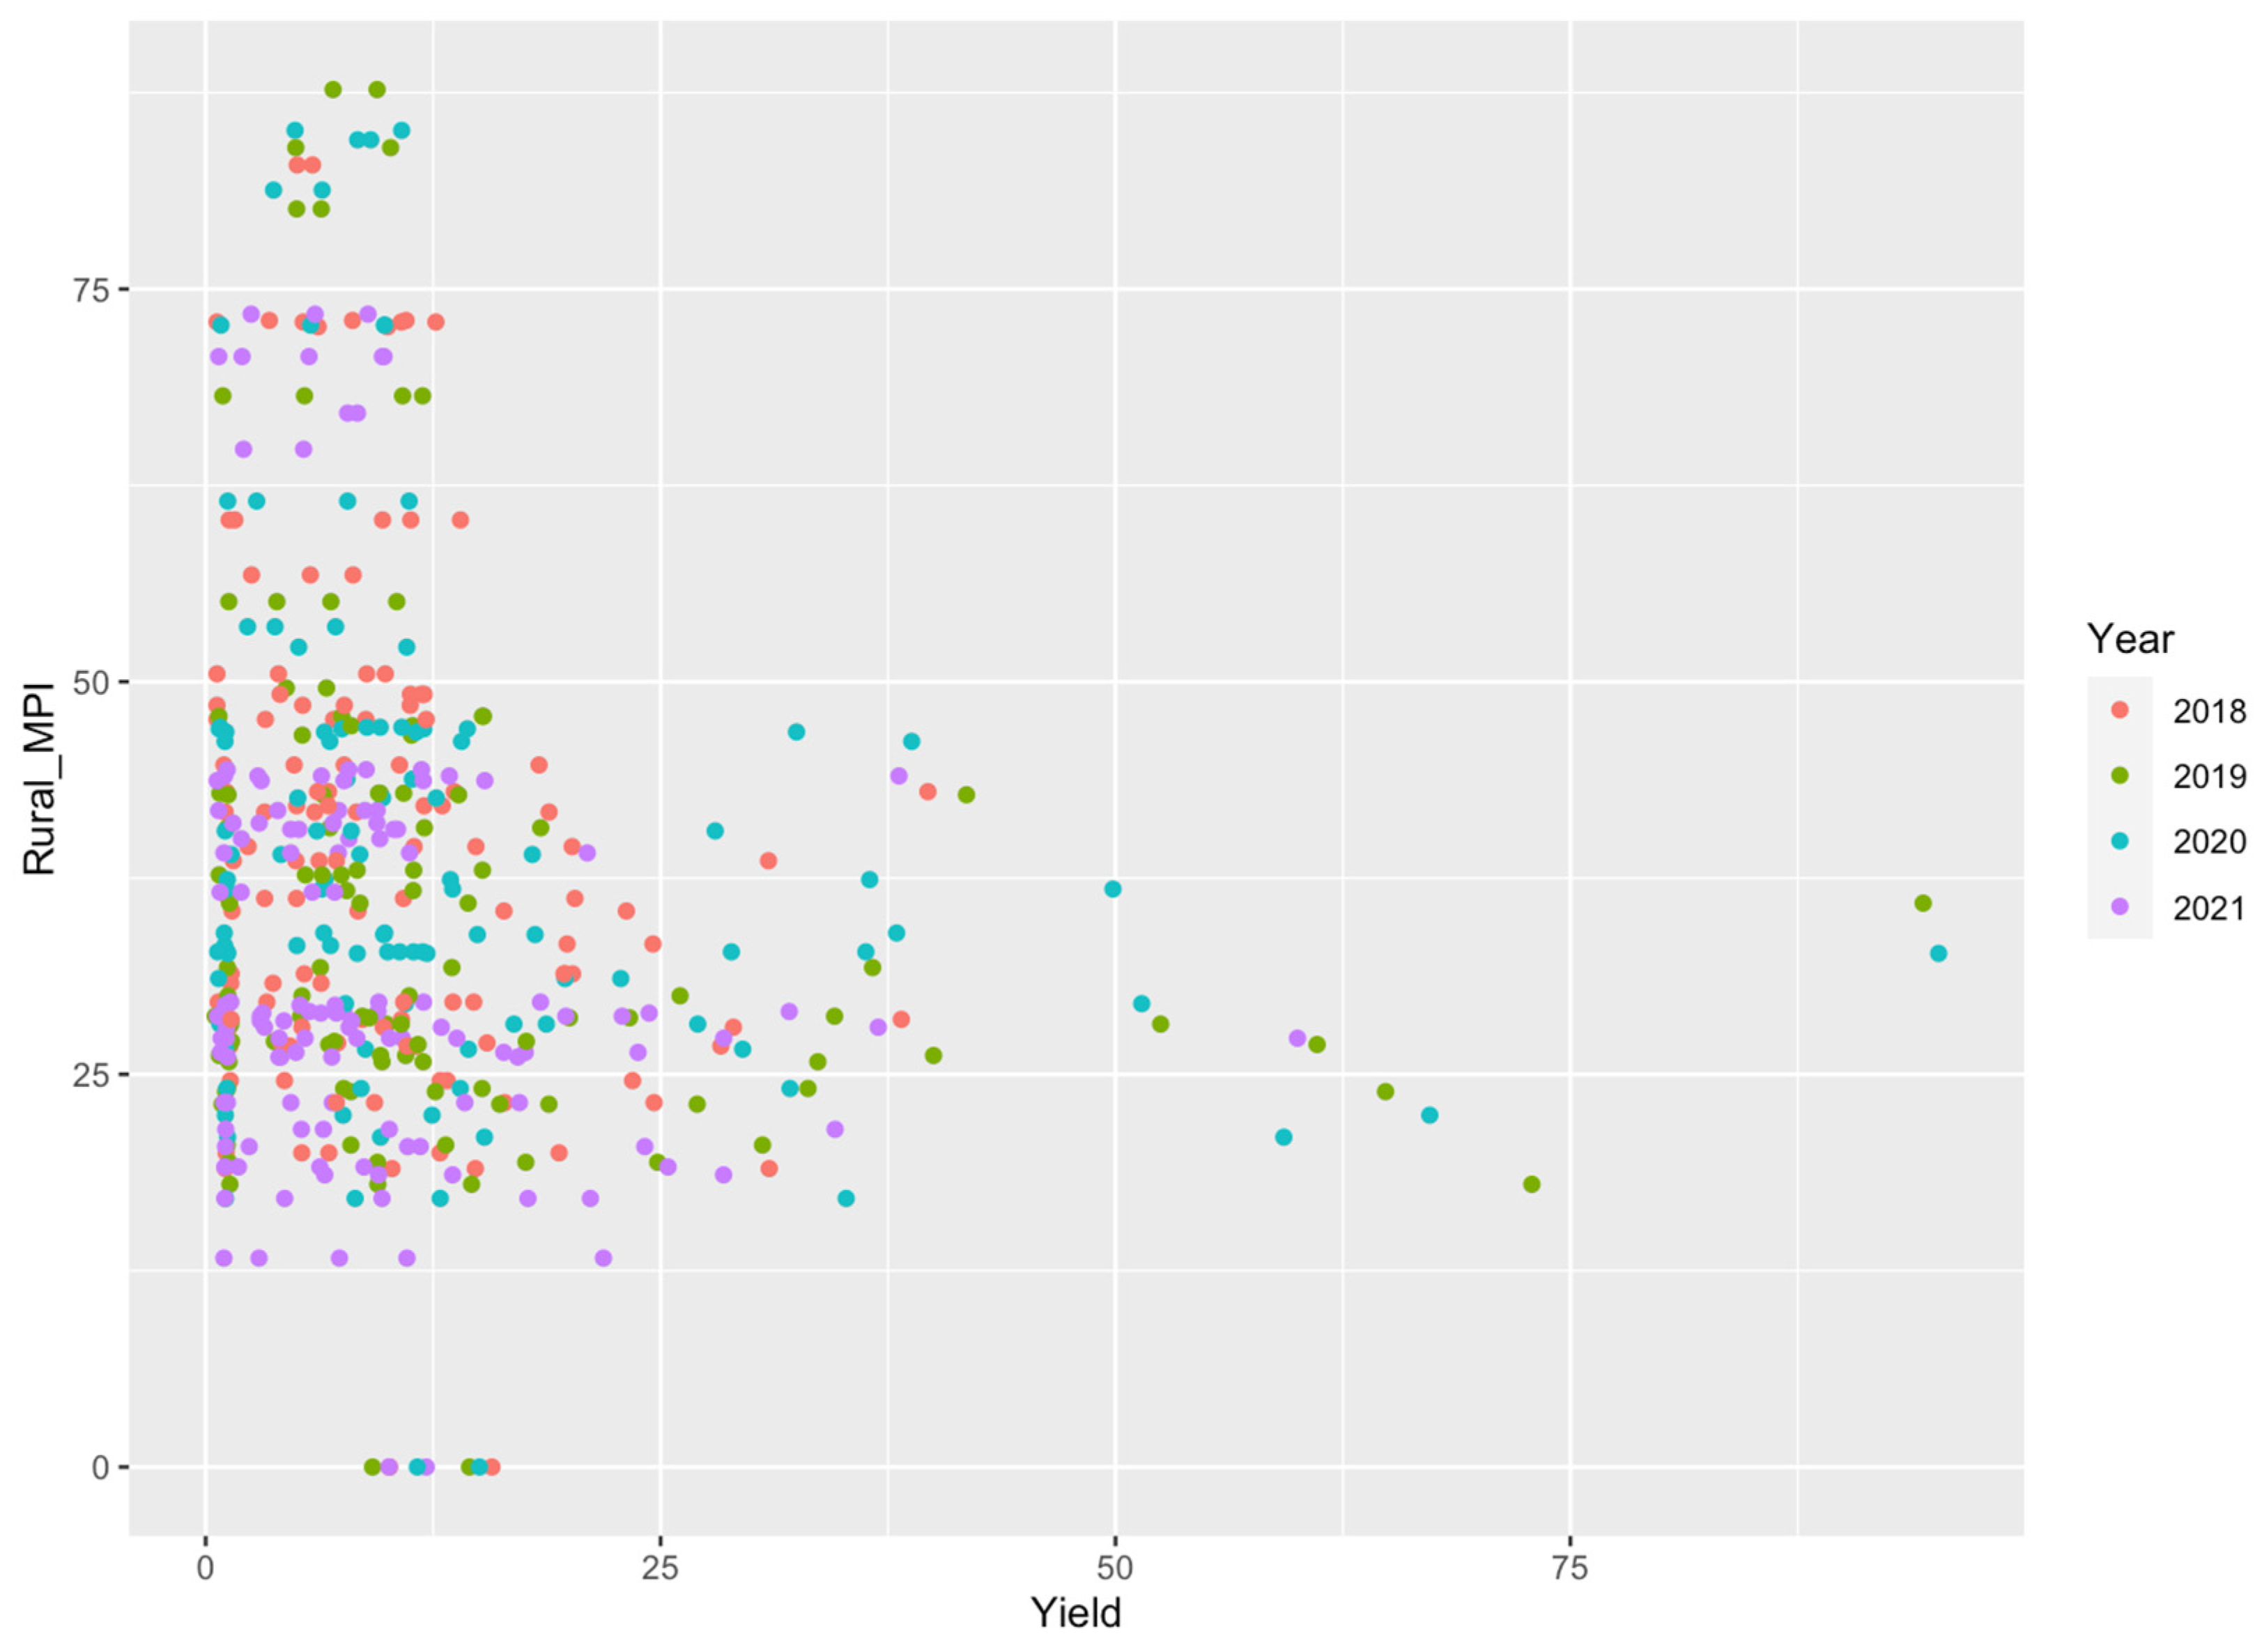
The results obtained in this study for coffee crop yields concerning the MPI from 2018 to 2021 demonstrate that higher productive yields are associated with lower MPI (
Figure 7). This coincides with previous studies [
1].
In this sense, efficient coffee farming contributes to eradicating rural poverty, increasing peasant families’ incomes, and improving their living conditions. Several countries in Asia and Africa have successfully lifted large rural populations out of absolute poverty through this crop. Even countries with a long-standing coffee production tradition, such as Brazil, have shown significant economic and social progress by involving more regions and rural populations in the coffee industry [
33]. In Indonesia, in the province of Aceh Tengah, it was determined that coffee producers have greater access to education and food and possess more assets such as motorcycles, refrigerators, air conditioners, computers, and television screens, among others. Thus, the impact of the coffee-growing profession on poverty reduction is positive [
34]. In Bondowoso, Indonesia, the “Republic of Coffee” program was successfully promoted, empowering the community through job creation and income generation, which reduced poverty between 2016 and 2020 [
35].
In the results, there is a trend of decreasing MPI with higher productive yields of coffee cultivation. This is evidenced by observing the data separated by years (2018 to 2021), adding the trend line as well as the significance (
Figure 8). The trend lines consistently show a downward slope, indicating a clear negative relationship between productive yield and MPI. This trend is statistically significant (
) for all years, reinforcing the observation that higher coffee yields are associated with lower MPI.
According to [
12], the population close to the threshold of one-third, i.e., those deprived of 20 to 33.33% of the weighted indicators, is identified as vulnerable to poverty, while extreme poverty is represented by those deprived in 50% or more of the dimensions. Similarly, [
36] agrees in defining the extreme multidimensional poverty line within a percentage of deprivations greater than or equal to 50%, represented by households with deprivation in approximately six or more dimensions.
The results obtained in this study indicate that coffee cultivation has yields clustered above one, with an MPI below 50, which suggests that coffee is an alternative for reducing poverty rates (
Figure 9). The majority of data points cluster around yields above 1 and an MPI below 50%. However, there are a few outliers with a high MPI despite high yields, suggesting that other factors might be influencing poverty levels in these specific cases.
Governments such as those of Indonesia and China have launched several agricultural production and development programs based on poverty alleviation in rural areas through coffee cultivation. The sector’s growth substantially contributed to food security, low and stable prices, job creation, income generation, and foreign savings. China and Indonesia are excellent examples of the role of agriculture in economic development and poverty reduction [
1]. In Colombia, coffee production stands out as an alternative for the socioeconomic growth of families and the overcoming of poverty [
37].
3.2. Plantain Cultivation
Cultivation of tropical fruits, particularly plantain, constitutes an important source of economic growth, income, food security, and nutrition for rural areas in many developing countries. It is estimated that 56% of the global production of plantain originates in Asia, 26% originates in Latin America and the Caribbean (LAC), and 15% originates in Africa. It is estimated that by 2028, plantains could represent approximately 53% of the total global production of tropical fruits [
38].
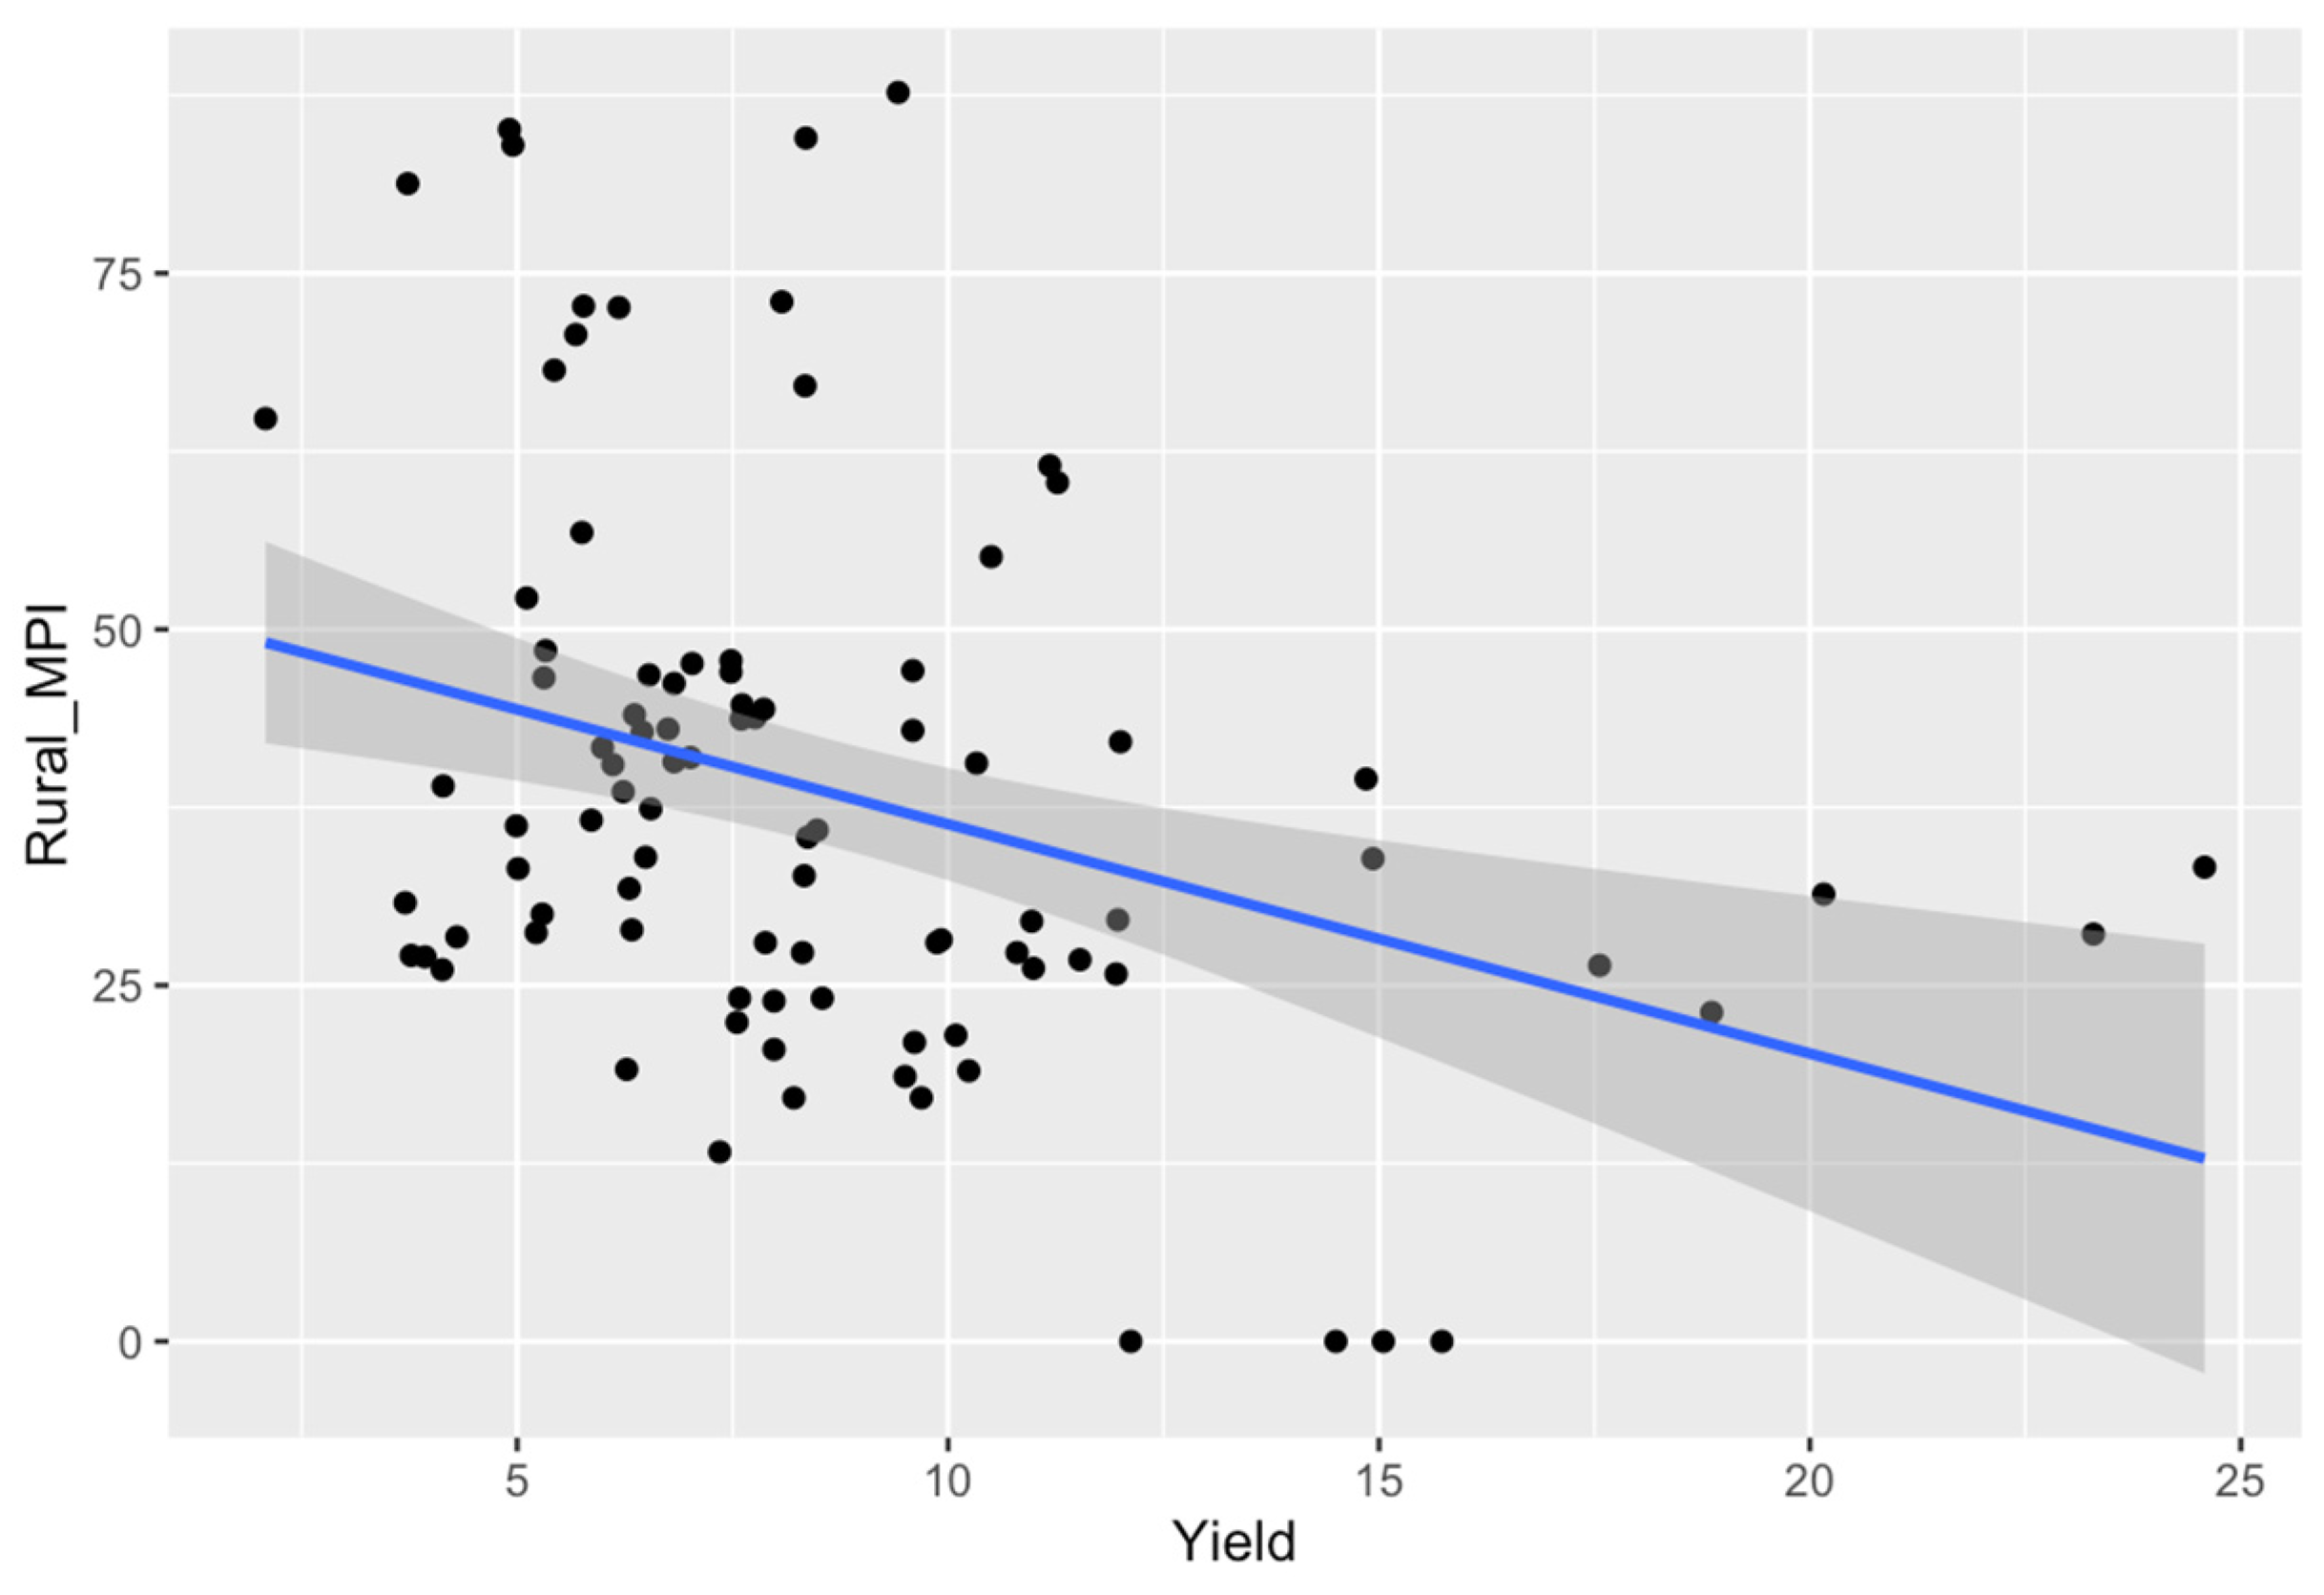
This study found that higher productive yields in plantain cultivation correspond to a lower Multidimensional Poverty Index (MPI) (
Figure 4). This trend is similar to that found for coffee cultivation; higher yields correspond to a lower MPI. In the case of plantains, the most clustered yields are between 5 and 10, with an MPI between 20 and 50 (
Figure 10).
In regions like the Chitwan district (Nepal), plantain is considered a high-income-generating crop [
39]. These authors found that 92.85% of the population’s income source comes from plantain cultivation, making this fruit the primary means of improving the living conditions of the area’s inhabitants.
Similarly, plantain is the most important fruit crop in India. This country is the world’s largest producer, with an average production of 29 million tons per year. A total of 2.4% of the country’s total plantain production is generated in the state of Assam, creating significant socio-economic and cultural importance [
40]. In Kerala, this crop has been identified as a potential solution for reducing unemployment, not only from its primary production but also by supporting the small and artisanal industries sector to obtain by-products such as chips, figs, flour, powder, banana pulp, baby food, and clarified banana juice, among others [
41].
In Colombia, plantain cultivation is widely spread across the territory, from mountainous areas to the plains. The supply of plantains has remained above 30,000 tons per month from 2018 to 2022 [
42]. By 2022, the plantain production chain encompassed 213,950 families across the 32 departments of the national territory and 71% of the municipalities in the country. The subsector generated 967,743 jobs, making it, along with coffee and panela, one of the main products generating employment in the country’s agricultural sector, reaching 117,524 tons in exports. The primary export destination is the United States, accounting for 41% of the market, with 46,813 tons, followed by the United Kingdom, with exports of 40,435 tons, representing 36% of the market [
43]. In this sense, plantain is a strategic crop in Colombia, constituting one of the most important staple foods at the socio-economic level due to the generation of direct and indirect jobs, as well as the income it can provide to the rural population [
44].
Producing one kilogram of plantain costs, on average, COP 580 Colombia (approximately USD 0.14), and the average selling price to the final consumer is COP 1500. However, there is a difference between the price paid to the producer and the selling price to the consumer, largely due to product intermediation. Despite this condition, the price for producers in the country has remained stable in recent years, providing profit margins ranging from 10% to 15%, depending on the level of technological advancement [
43], representing an excellent source of income for farmers and, therefore, the possibility of reducing multidimensional poverty indices. Additionally, the economic potential of plantain waste along the value chain must be considered. Approximately 30% to 40% of the entire plantain is peel, making it an excellent provider of industrial waste. In this sense, plantain is an agricultural product that not only can be used for food purposes and as a fundamental axis of food security but also plays an important role in poverty reduction [
45].
3.3. Technified Corn Cultivation
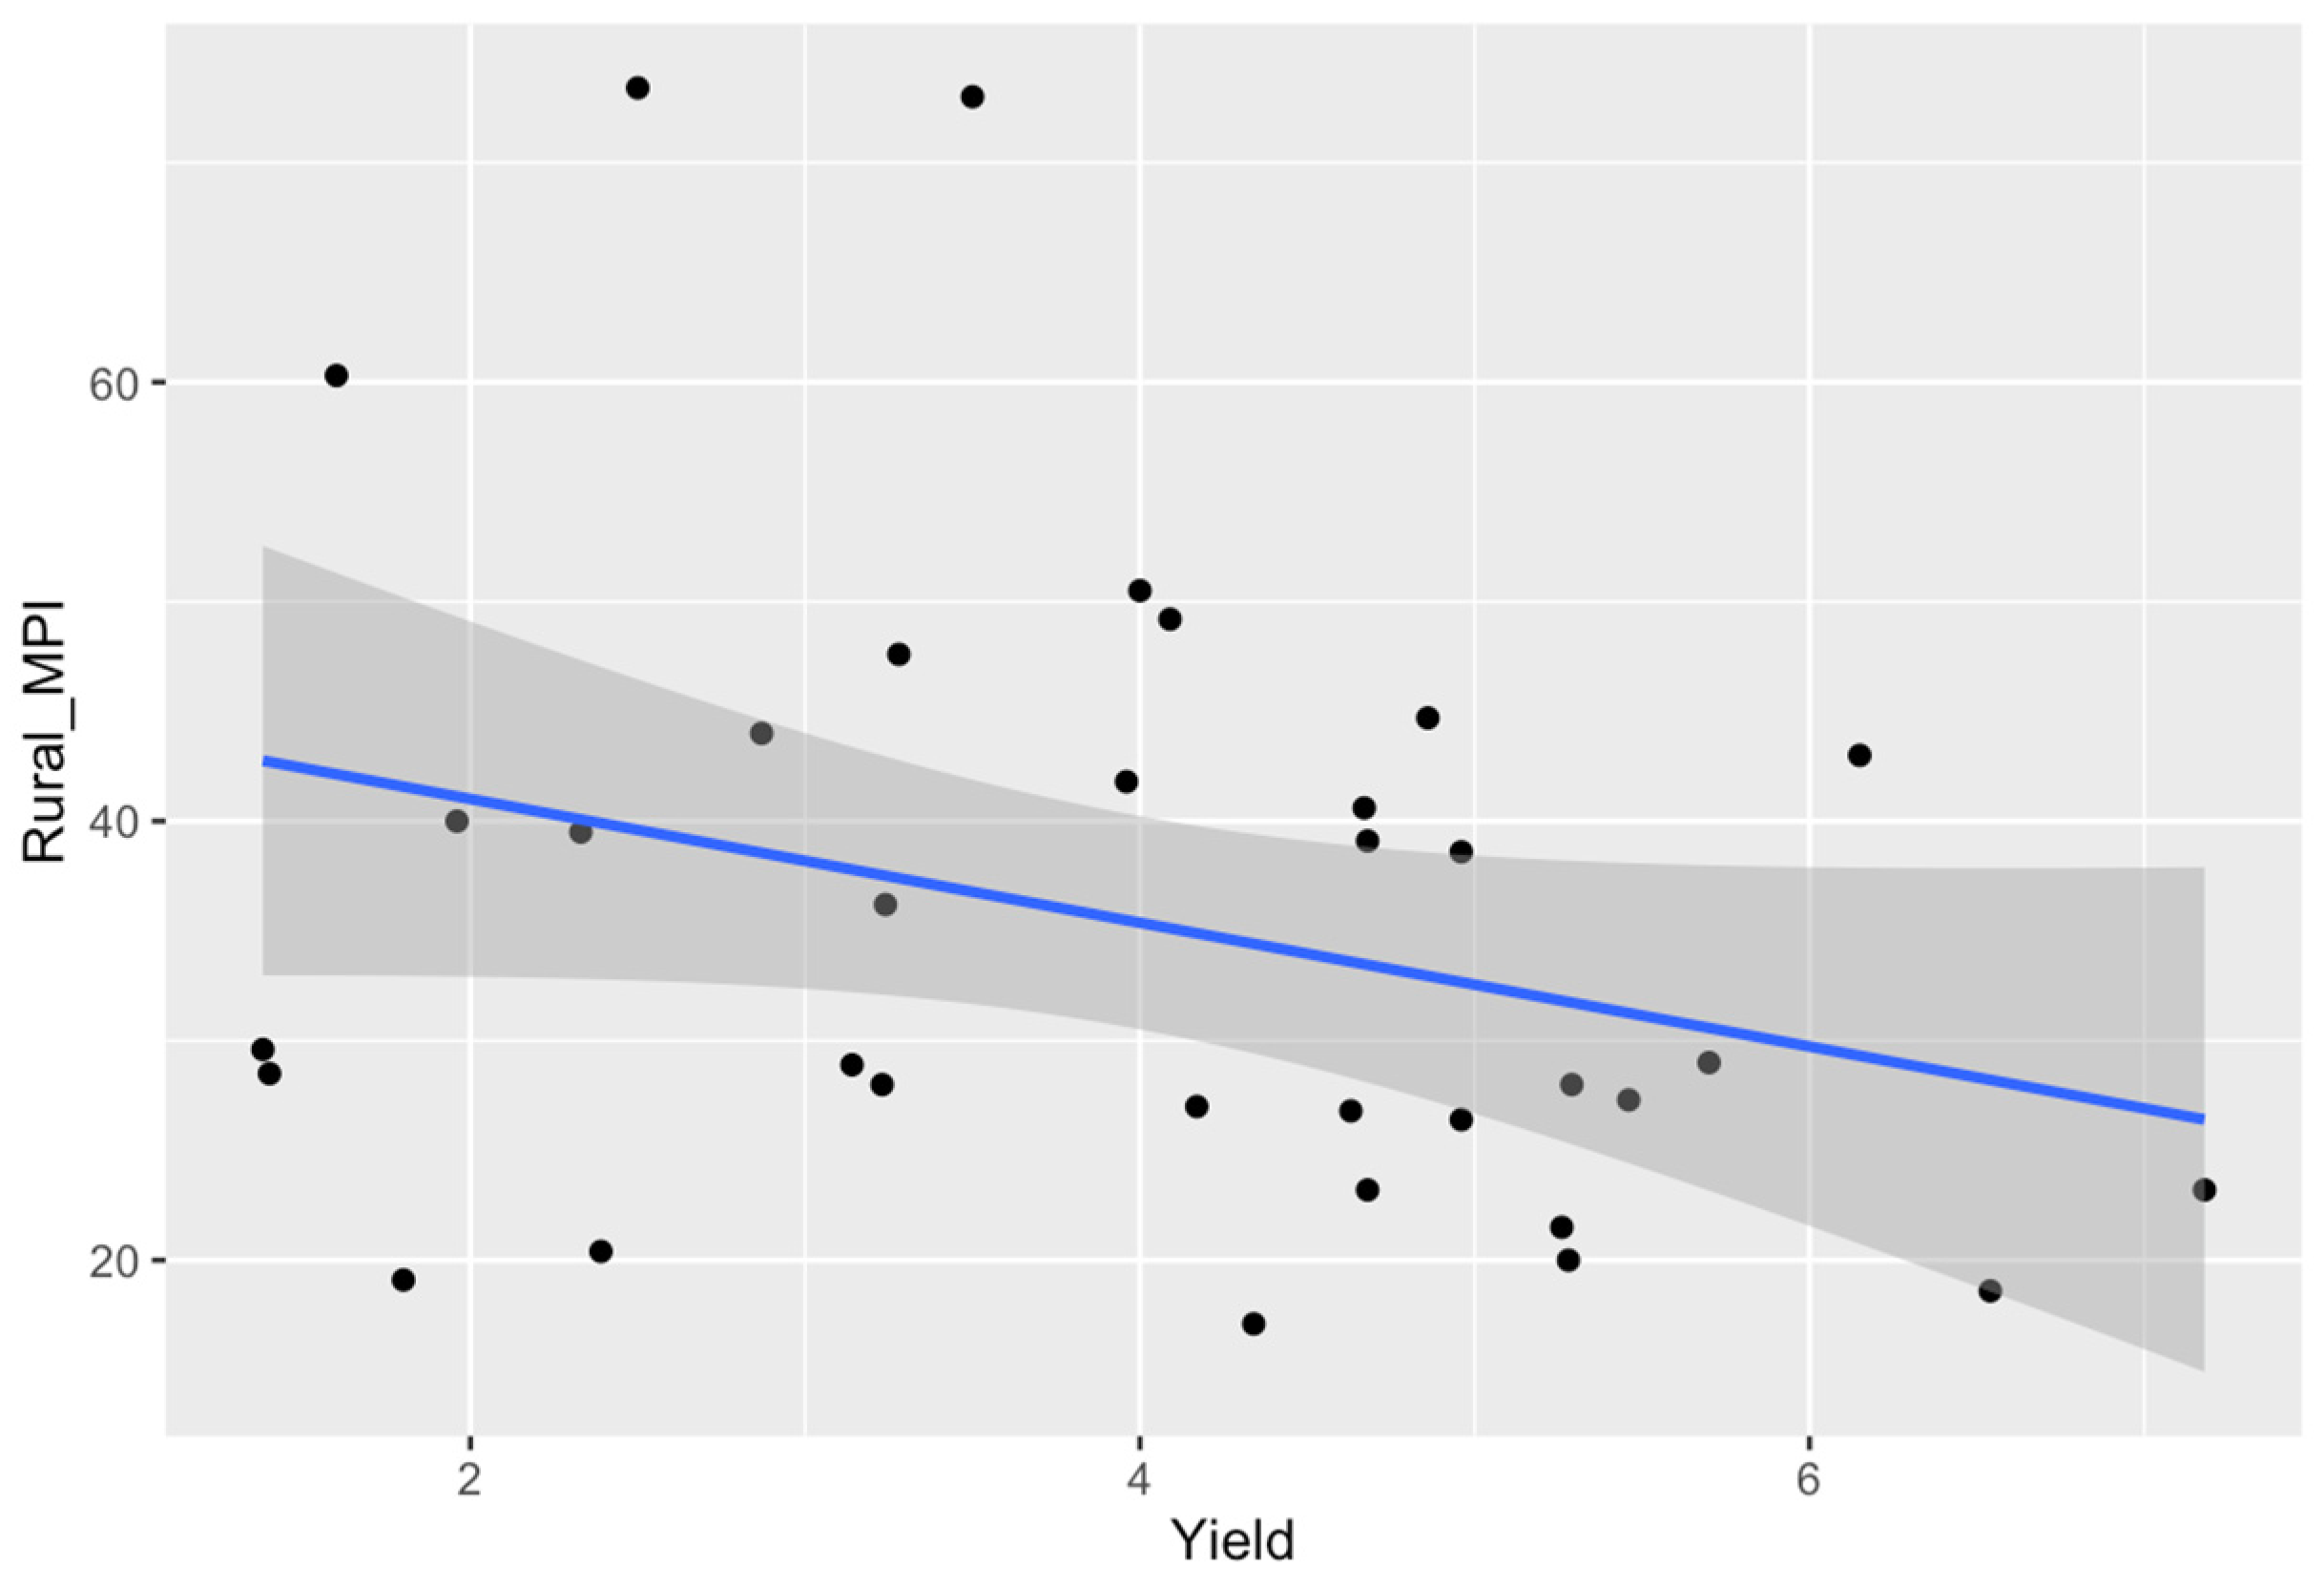
As found in the previous crops (coffee and plantain), the same trend continues: higher productive yield of corn corresponds to a lower Multidimensional Poverty Index. For technified corn cultivation, the data appear more dispersed; the yields are high, clustered mainly between 4 and 6, with an MPI between 20 and 30 (
Figure 11), representing an efficient alternative for reducing poverty indices.
As shown in the previous graph, technified corn cultivation represents an efficient alternative for reducing poverty indices. This is explained by the fact that technified corn cultivation is characterized by monoculture production, high fertility, use of machinery, and technical assistance, which allows for higher productive and economic yields [
46].
In this technified production system, the United States stands as the main producer and exporter of corn, followed by mainland China, and in Latin America, by Argentina and Brazil. The United States’ export dominance is based on high yields per hectare (above 11 t/ha) achieved through the implementation of technology [
47].
In Latin America, corn is a fundamental axis of agriculture; about 90% of the production is cultivated in family agriculture, where the technological gap remains mainly due to the minimal use of technological resources. This situation generates low yields in crop productivity and, therefore, low profitability margins in production [
48].
In Colombia, cultivation is carried out under two production systems: technified and traditional. The first represents 57% of the total corn area, characterized by production in areas larger than five hectares (monoculture), soil of medium to high fertility, and the use of agricultural implements, allowing for higher yields. In the traditional system, peasant farming predominates, characterized by family labor, areas smaller than 5 ha, low-fertility soils with low mechanization, and little technical assistance [
46].
This has led to lower productivity indices for corn production in Colombia compared to other countries. In 2016, the yield of the crop in the United States reached 11 tons per hectare (t/ha); in Brazil, the yield reached 5.6 t/ha; while in Colombia, it was 3.6 t/ha [
49]. By 2022, 462,625 hectares of corn were cultivated in the country, producing 1,921,177 tons of cereal. This production barely satisfies 21% of the country’s corn consumption, leaving a market with an unmet demand of 79% that is supplied with imported corn [
50]. Even though corn production in Colombia dates back to pre-Colombian times and the product is an important part of the country’s diet, national production has not been able to adapt to the new demands, especially in the demand for cereal as raw material for animal feed production [
51].
In this sense, the corn production sector in Colombia is characterized by low competitiveness and productivity. This condition greatly affects this sector, mainly composed of medium and small producers, as it generates low economic income, which impacts the quality of life of producers who see fewer and fewer possibilities for progress [
46]. The quality of life of corn producers is threatened by the high multidimensional poverty indices presented by the agricultural production units linked to the crop, as they mostly exceed 50%.
When reviewing the index for each of the cultivation systems, it is found that the traditional system presents higher multidimensional poverty compared to the technified system, with 59% and 53%, respectively [
51], a situation also reported in this study, given that productivity is directly related to MPI.
Similarly, in Vietnam, it was found that the financial security associated with corn cultivation (compared to alternative crops) was the decisive factor in land management choices [
52]. However, the study also revealed that farmers were dissatisfied with the low incomes associated with the low productivity of the crop.
Nevertheless, in regions like Asia, the area cultivated with corn has increased nearly fifteen-fold over the last few decades, from 78,000 to 1,190,000 tons. For several countries in this region, corn cultivation, accompanied by public policies that favor modernization and the implementation of technologies to improve productive yields, has become a fundamental axis for escaping poverty. The expansion of corn has provided cash income to farmers and globally contributed to rural poverty alleviation [
53].
The data analyzed above demonstrate that growth in agricultural productivity, accompanied by state policies, leads to higher productive yields and, consequently, to poverty reduction [
54]. It has been shown that through policies focused on agricultural development, it is possible to achieve higher incomes and, therefore, a reduction in poverty for rural households [
55].
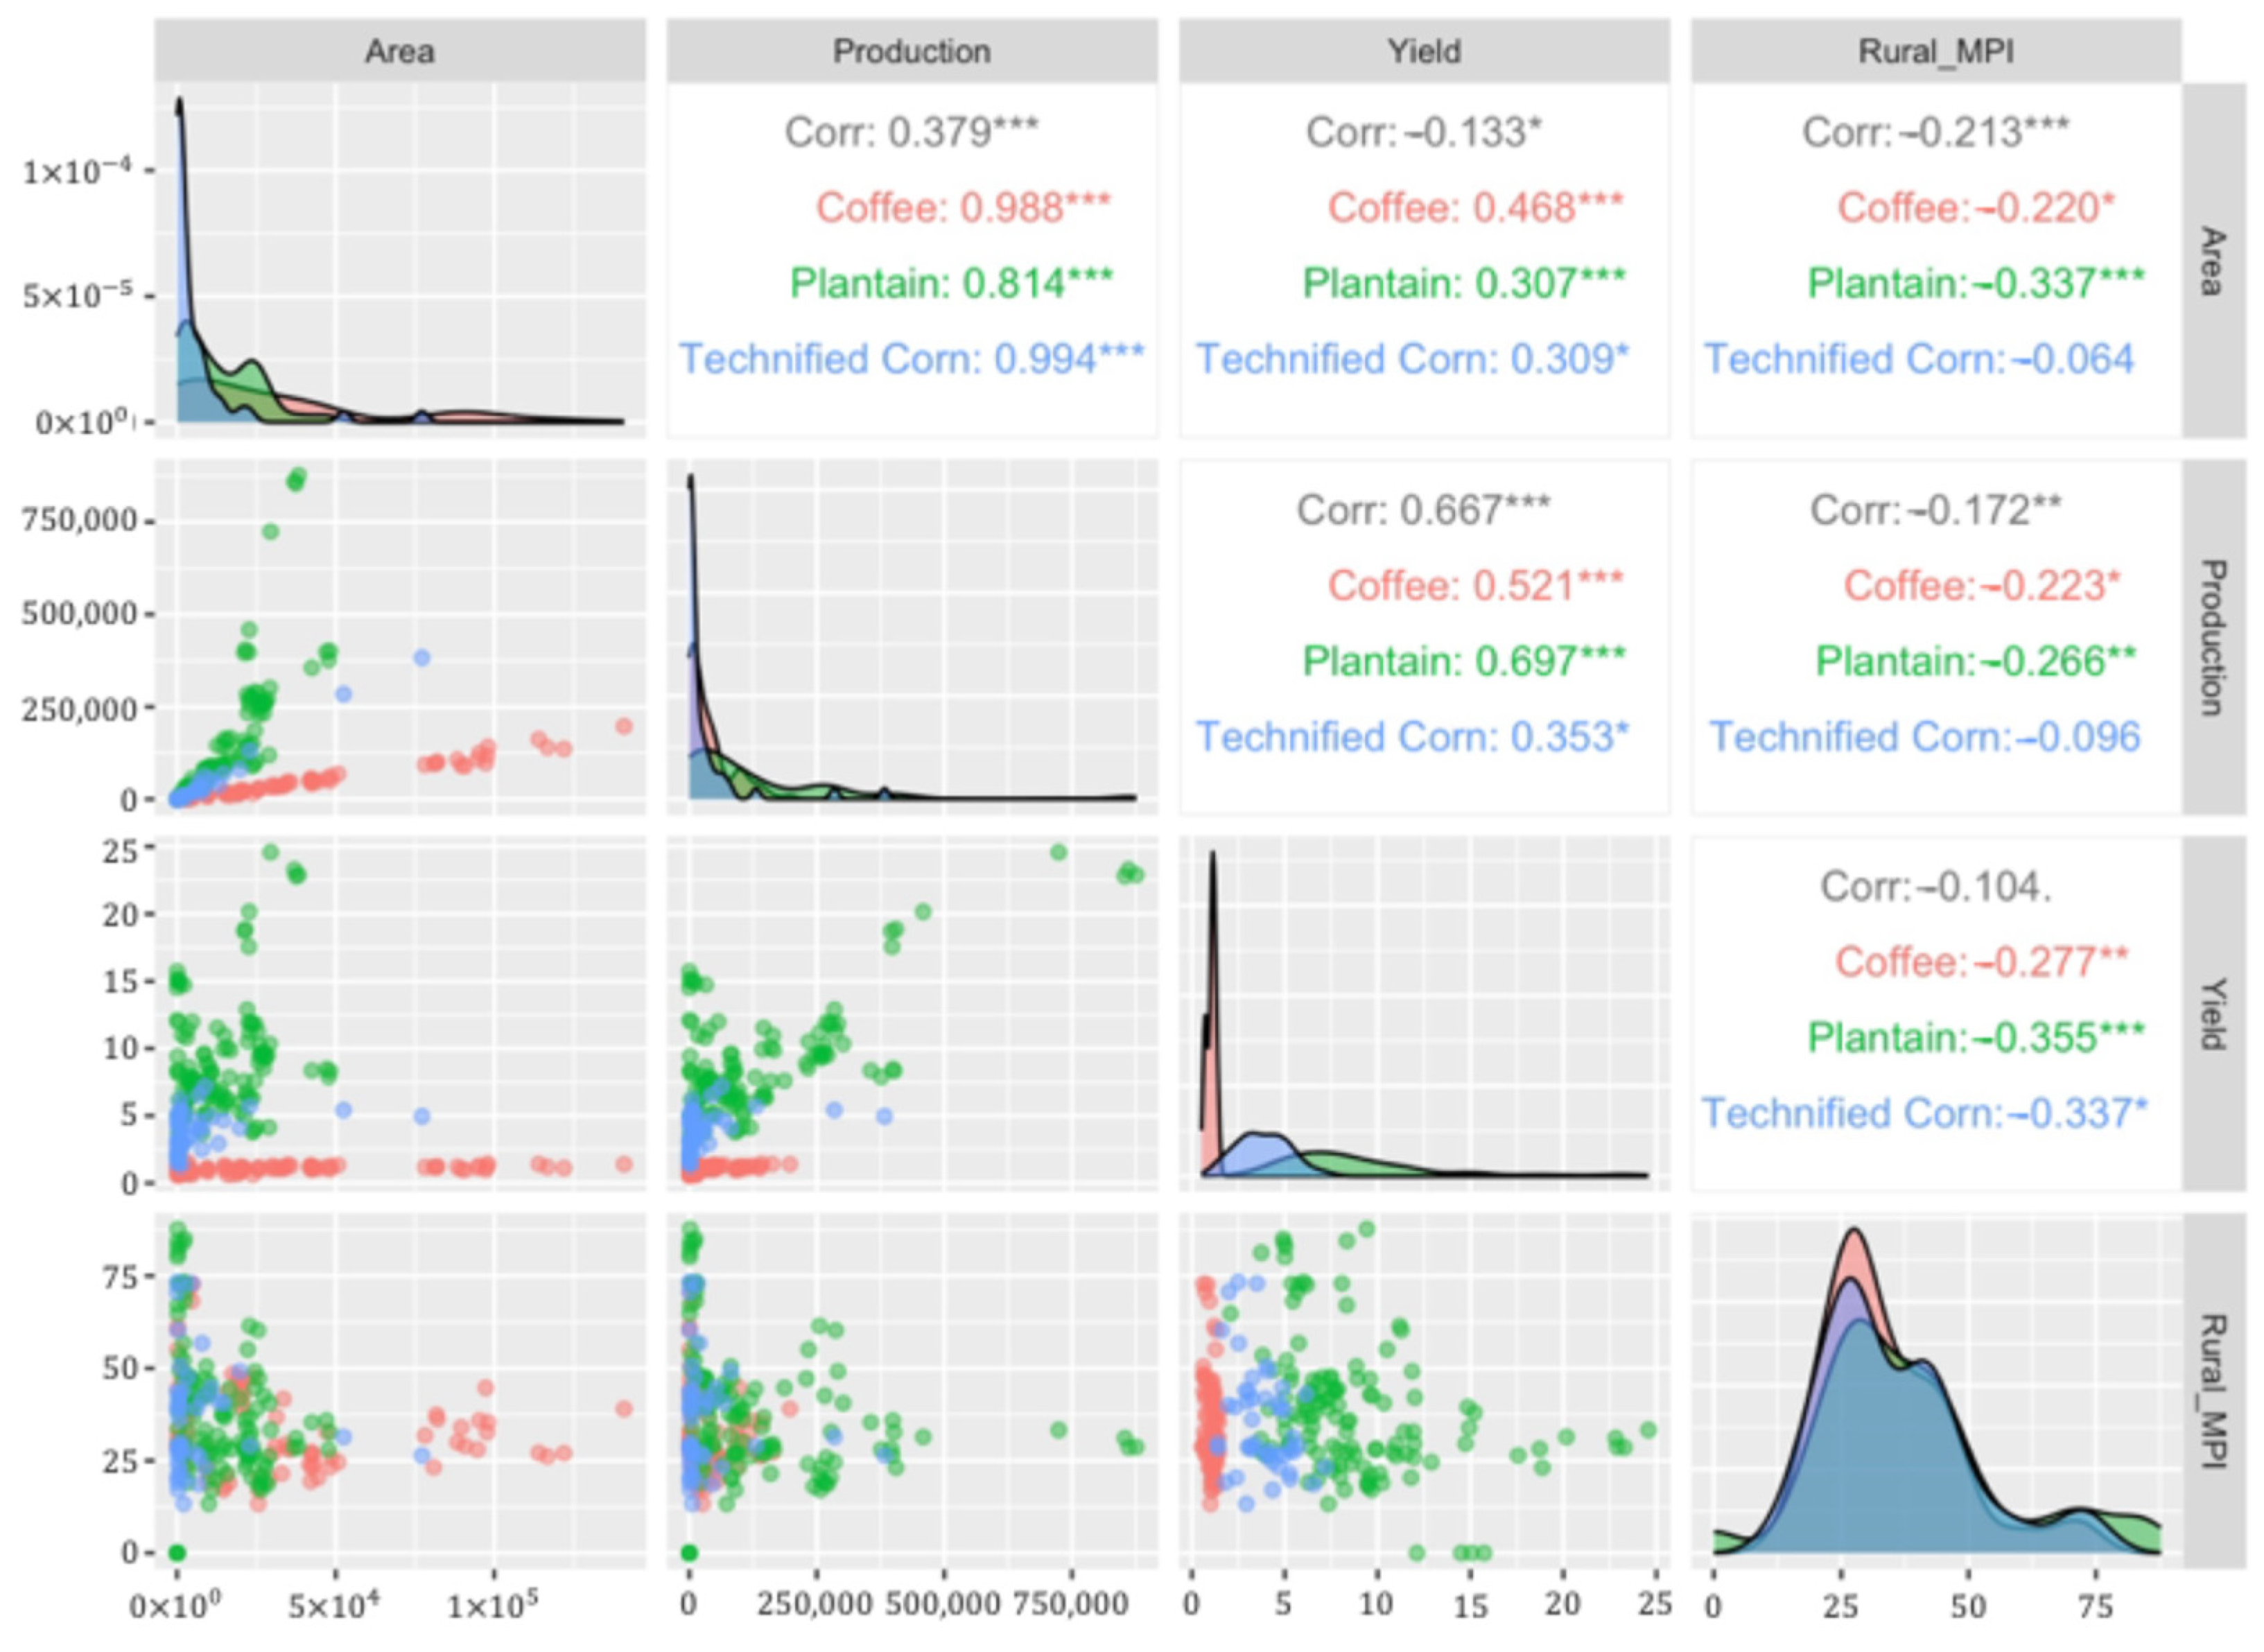
This study found that the correlations between the variables area, production, yield, and the Multidimensional Rural Poverty Index (MPI-Rural) in Colombia for coffee, plantain, and technified corn crops for the period of 2018 to 2021 are highly significant; that is, as the productive yield of the crops increases, the Multidimensional Poverty Index decreases (
Figure 12). While all three crops show a negative relationship between yield and MPI, the trend is more pronounced for coffee and plantain compared to corn. This difference could be attributed to the higher market value and export potential of coffee and plantain, leading to greater income generation and poverty reduction.
4. Conclusions
The results of this study indicated that the correlations between the variables area, production, and yield for coffee, plantain, and corn crops and the Multidimensional Rural Poverty Index (MPI-Rural) in Colombia for the period 2018 to 2021 are highly significant; that is, as the productive yield of the crops increases, the Multidimensional Poverty Index decreases, making these crops a viable alternative to reduce multidimensional poverty indices in Colombia.
The results also showed that coffee cultivation presents yields clustered with a Multidimensional Poverty Index below 50%; in the case of plantain, a Multidimensional Poverty Index between 20% and 50% is observed, and for technified corn cultivation, the data show an MPI between 20% and 30%. Technified corn presents lower percentages in the Multidimensional Poverty Index. These results are because technified corn is characterized by monoculture production, high fertility, use of machinery, and technical assistance, which allows for higher productive and economic yields. As the productive yield of crops increases, the Poverty Index decreases, as found in this analysis.
Coffee, plantain, and traditional corn crops are part of the peasant economy, characterized by family labor, areas smaller than 5 ha, low-fertility soils with low mechanization, and little technical assistance. The results of this study indicate that the traditional system presents higher multidimensional poverty compared to the technified system, given that productivity is directly related to MPI.
In the bibliometric analysis, this study found a close correlation between the Multidimensional Poverty Index, climate change, and agriculture. Similarly, descriptors such as poverty, productive yields, and food security show significant correlations.
The results demonstrate a close correlation between the Multidimensional Poverty Index and the Malmquist Productivity Index. This is because both indices analyze multiple inputs or variables and are part of data envelopment analysis (DEA); a robust methodology for evaluating efficiency in various areas, including the banking industry, educational systems, and agricultural production.
Similarly, this study reports correlations between the Multidimensional Poverty Index, climate change, agricultural productive yields, and food security. This is because the impacts of climate change have considerable effects on well-being and economic development, particularly in areas with agricultural potential, where productive yields depend heavily on natural resources and climatic patterns. In turn, productive yields determine rural employment rates and, therefore, households’ capacities in their well-being and livelihoods. Thus, agricultural productivity and yields determine the degree of deprivation of individuals across a set of dimensions according to the MPI.
The findings indicate a significant negative correlation between the productive yields of these crops and the MPI, suggesting that enhancing agricultural productivity can contribute to poverty reduction. These results underscore the importance of investing in agricultural development, particularly in technified farming practices, as a means to improve the economic well-being of rural communities in Colombia. Further research could explore the impact of specific agricultural interventions, such as technology adoption and access to credit, on MPI and delve into the social and environmental dimensions of agricultural productivity. By understanding these multifaceted aspects, policymakers can design more effective strategies to leverage agricultural development for sustainable poverty reduction and rural prosperity.


