Communication

A Case Study of the Possible Meteorological Causes of Unexpected Fire Behavior in the Pantanal Wetland, Brazil

by
Flavio T. Couto
1,2,*,
Filippe L. M. Santos
2,
Cátia Campos
2,
Carolina Purificação
2,
Nuno Andrade
3,
Juan M. López-Vega
4 and
Matthieu Lacroix
5
1
Departamento de Física, Escola de Ciências e Tecnologia, Universidade de Évora, Rua Romão Ramalho, 59, 7000-671 Evora, Portugal
2
Earth Remote Sensing Laboratory (EaRS Lab), Instituto de Investigação e Formação Avançada—IIFA, Instituto de Ciências da Terra—ICT (Polo de Évora), Universidade de Évora, Rua Romão Ramalho, 59, 7000-671 Evora, Portugal
3
Programa de Doctorado en Turismo, Universidad de Extremadura, 06006 Badajoz, Spain
4
Department of Physics and Astronomy, University of Lethbridge, 4401 University Drive, Lethbridge, AB T1K 3M4, Canada
5
École Doctorale ED 483 Sciences Sociales, Université Lumière Lyon 2, UMR 5600 EVS-IRG, 5 Avenue Pierre Mendès, 69500 Bron, France
*
Author to whom correspondence should be addressed.
Earth 2024, 5(3), 548-563; https://doi.org/10.3390/earth5030028
Submission received: 14 August 2024 / Revised: 15 September 2024 / Accepted: 16 September 2024 / Published: 18 September 2024

Abstract

:
This study provides insights into large fires in the Pantanal by analyzing the atmospheric conditions that influenced the rapid fire evolution between 13 and 14 November 2023, when fire fronts spread rapidly, leading to critical situations for firefighters. The observation-based analysis helped us to identify some characteristics of the fire’s evolution and the meteorological conditions in the region. Furthermore, two simulations were run with the Meso-NH model, which was configured with horizontal resolutions of 2.5 km and 5 km. The fire behavior, characterized by satellite observations, revealed periods with a sudden increase in active fire numbers. High temperatures and low relative humidity in the region characterized the fire weather conditions. The simulations confirmed the critical fire condition, showing the benefits of increasing the resolution of numerical models for the Pantanal region. The convection-resolving simulation at 2.5 km showed the repeated development of gust fronts in the late afternoon and early evening. This study highlights this dynamic that, coupled with intense surface wind gusts, was crucial for the intensification of the fire spread and unexpected behavior. This study is a first step toward better understanding fire dynamics in the Pantanal through atmospheric modeling, and it can support strategies for firefighting in the region.

1. Introduction

Fires in tropical and subtropical regions contribute to global issues, such as those occurring at higher latitudes. Fires in the Amazon, Africa, and Southeast Asia are often the result of a combination of human activities, agricultural practices, and atmospheric conditions [1], and climate variability can be an important factor leading to unexpected fires [2,3,4]. In the case of the Pantanal wetland in South America, climate conditions favor extreme fire outbreaks over the region during the dry season. The Pantanal is the world’s largest freshwater wetland with a seasonally flooded plain, straddling Brazil’s border with Paraguay and Bolivia in the tropical latitudes [5,6,7].
The loss of biodiversity during the 2020 Pantanal fires was a remarkable feature, which was marked by an unprecedented environmental crisis in the region, with species facing the destruction of their habitats [8,9,10]. Considering a protected area in the Pantanal region, Silva et al. [11] showed that 2020 was an atypical year, with the occurrence of large, burned areas being uncommon. In natural parks, the impacts of fires go beyond ecological and biodiversity issues, extending to the tourism sector. In addition to the immediate disruption of tourism activities, the fires affect the essence of what attracts tourists to these areas [12,13,14]. Thapa et al. [15] assert that such events contribute to changes in tourists’ travel behavior depending on the perceived level of risk. The impacts of wildfires on tourist destinations are substantial but also pose risks to local communities, including threats to health and food security [16].
On the other hand, multiple studies have shown the critical role of climate conditions in the devastating fires in the region, e.g., [11,17,18,19], yet the meteorological aspects are rarely discussed in the literature. However, it is well known that numerous extreme fire events around the world can present abrupt changes in behavior due to a variety of factors, such as fuel availability, terrain features, and weather conditions [20,21,22,23,24,25,26,27,28]. In this context, such situations present numerous challenges to firefighters, emergency responders, and the community. As a result, fire risk assessment can be highly supported by a deeper understanding of the weather conditions producing unexpected fire behavior.
Large-scale conditions can generally influence air temperature and relative humidity near the surface, which are the main determinants of fuel flammability. Specific patterns, such as the Santa Ana winds in California, can exacerbate fires by producing strong, hot, and dry winds that intensify and spread large fires [3,29,30,31]. In Portugal, local effects have been documented in recent years as the main factor producing some large fires. In these cases, the orographic effects intensify the weather conditions in some mountainous regions, thereby increasing the fire risk [4,32,33].
Simulating real atmospheric environments is an important aspect of the Meso-NH research model [34]. In Portugal, it has been successfully used in the fire meteorology context. High-resolution simulations have allowed us to better understand the meteorological conditions associated with the occurrence of large fires, for example, the identification of mesoscale circulation patterns and local effects created by complex terrains [32,35], the applicability of the electrical scheme to assess the occurrence of natural fires [36], or even the use of a fire propagation model to explore the impacts of fire on the atmosphere [37,38,39].
In this sense, the present communication calls attention to the Pantanal fires from a meteorological perspective, mainly because the fires may occur over remote regions. In such cases, firefighting efforts can be difficult due to the delays in identifying the ignition, potentially leading to uncontrolled fires if fuel availability and meteorological conditions are favorable. In many cases, fires can affect large areas and persist for days or weeks. Therefore, increasing the knowledge about critical fire conditions can drive innovative strategies for fire services, particularly in firefighter training related to combat techniques and safety measures. This leads to the following questions: (1) What atmospheric conditions contribute to the sudden increase in the number of active fires and the expansion of burned areas in Pantanal? (2) How does increasing the spatial resolution of atmospheric models benefit fire risk evaluation in the Pantanal region?
Therefore, aiming to increase the knowledge base of critical fire situations, this study provides insights into the fires in the Pantanal wetland, structured into the following four sections: Section 2 outlines the data and methodology, whereas Section 3 presents the results and a brief discussion, starting from the description of the study period, followed by numerical results and a summary of findings. The main conclusions are presented in Section 4.

2. Data and Methodology

This study explores a fire episode that burned for several days in the Pantanal region in early November 2023, with a specific focus on 13 and 14 November, when the fire spread rapidly and presented an unexpected increase in active fire number (AFN). This study is based on satellite observations, weather station data, and two numerical simulations (EXP1 and EXP2), all of which are described in this section.

2.1. Study Region

The Pantanal is the world’s largest tropical wetland, and it is situated primarily in western Brazil, with portions extending into Bolivia and Paraguay [5,6,7]. The Brazilian Pantanal wetland covers an area of 138,183 km2, forming a vast, low-lying basin in south-central South America [40]. The region’s flat topography, with an average elevation between 80 and 150 m above sea level (Figure 1a), plays a pivotal role in the gradual movement of floodwaters that inundate the area. The climate is characterized by the presence of distinct wet and dry seasons, with an annual rainfall total ranging from 1000 to 1500 mm, with the majority of this precipitation concentrated between October and April. The seasonal flood pulse in the Pantanal results in the inundation of up to 80% of its floodplains during the rainy season, with the water level in the Paraguay River rising by 2 to 5 m. The region’s soil composition exhibits considerable variation. Soils at higher elevations are predominantly sandier, whereas those in proximity to river systems contain greater quantities of clay and silt. The Pantanal is an extensive network of floodplains situated in a quaternary sedimentary lowland, shaped by the deposition of alluvial fans from multiple tributaries. The Pantanal’s unique phytogeographic location gives rise to a complex mosaic of vegetation (Figure 1b), comprising the following four major biomes: the Amazon rainforest in the northwest, the Cerrado tropical savanna in the east, the Chaco steppe savanna in the southwest, and the Atlantic Forest in the South. Forests typically flourish at higher elevations, while grasslands dominate the seasonally flooded areas. The Pantanal is home to approximately 2000 plant species and supports a high level of biodiversity, which makes it one of the most ecologically rich regions in South America [40].

2.2. Remote Sensing Data

The satellite observation serves as the starting point for this study, as outlined in Section 3.1. The satellite datasets enable us to identify some characteristics of the fire’s evolution. For example, to explore aspects such as the AFN evolution and smoke plume transport, we analyzed available imagery from the true-color RGB composite from the moderate resolution imaging spectrometer (MODIS) sensor onboard the Aqua satellite [42]. The satellite images were extracted from the Google Earth Engine platform [43], an online platform developed by Google that allows access to a wide range of remote sensing databases derived from remote sensing without a large computational resource, as the platform is capable of manipulation using cloud processing.
The VNP14IMG product was also used, i.e., hotspots from the VIIRS sensor onboard the Suomi-NPP, NOAA-20, and NOAA-21 satellites processed by NASA’s Land, Atmosphere Near real-time Capability for EOS (LANCE). The product was extracted from the Fire Information for Resource Management System (FIRMS). Each active fire represents the center of a 375 m spatial resolution pixel that the algorithm identified as containing one or more fires within the pixel. It was filtered to only consider hotspots derived from the NOAA-20 satellite [44].
The hotspots from the GOES-16 satellite were also used, which were retrieved from the BDQueimadas database. The BDQueimadas is a constantly updated active fire database that receives information from various satellite sources and is disseminated by the Instituto Nacional de Pesquisas Espaciais (INPE) [45]. The GOES-16 satellite is a geostationary orbit satellite giving us the advantage of capturing images of the same location at different times throughout the day. However, the sensor’s distance of 36,000 km limits the spatial resolution, whereas the advanced baseline imager (ABI) onboard GOES-16 provides a spatial resolution of 2 km.

2.3. Surface Weather Observations

The Instituto Nacional de Meteorologia (INMET) manages the weather station network, and the data are available online [46]. The INMET provides various meteorological products on its website and is responsible for the quality control data obtained from the automatic and conventional weather stations based on international protocols. In this study, we analyze hourly observational data from the weather stations located in Mato Grosso do Sul state, namely the Nhumirim (A717), Aquidauana (A719), and São Gabriel do Oeste (A732) stations (Figure 1a). For each weather station, the temporal behaviors of the meteorological variables related to fire danger (i.e., air temperature, relative humidity) are examined, as well as wind gusts at the surface.

2.4. Model Description and Configuration

The Meso-NH French atmospheric research model [34] is a mesoscale, non-hydrostatic model that can simulate atmospheric motions at different scales by solving a set of dynamic and thermodynamic equations. The model uses prognostic variables, such as the three wind components, potential temperature, and water in its different phases, with up to seven classes of hydrometeors (vapor, cloud droplets, raindrops, ice crystals, snow, graupel, and hail), which are considered through their mixing ratios.
Meso-NH considers a set of parametrizations of several physical processes that occur in the atmosphere, such as convection [47], shallow convection [48], cloud microphysics [49,50], cloud electrical activity [51,52], turbulence [53], and surface processes [54], among others. In terms of surface characteristics, the model considers different types of land cover, allowing it to represent the orography and the type of landscape present in each location. In terms of soil composition, it is assumed to be uniform throughout its depth but varies horizontally and is defined by sand and clay fractions.
In this study, two simulations were carried out with different spatial resolutions, both centered on the Pantanal region (latitude: −17.5; longitude: −57.0). The first experiment (EXP1; Figure 1a) was configured with 500 × 500 grid points at a resolution of 2.5 km (1250 × 1250 km2). The second experiment (EXP2) was set up with 5 km resolution and 500 × 500 grid points, covering an area of 2500 × 2500 km2. The model was initialized using standard databases for land cover (ecoclimap_v1.9, [55]) and soil type (Harmonized World Soil Database—HWSD v1, global, [56]), while the orography was obtained from the SRTM database [57]. Regarding the model’s vertical configuration, the simulation was configured with 50 vertical levels following the terrain (Sigma-Z coordinate).
Because the Meso-NH is a limited-area model, the numerical experiment requires initial and boundary atmospheric conditions. These fields were obtained in this study by the European Centre for Medium-Range Weather Forecasts (ECMWF), with a spatial resolution of around 9 km [58]. Meso-NH ran with a complete set of physical parameterizations; turbulence is based on a 1.5-order closure scheme [53], whereas radiation is based on the rapid radiative transfer model—RRTM [59]. The cloud microphysics is represented according to the ICE3 scheme [49], which is a one-moment microphysical scheme that predicts the mass-mixing ratios of cloud water, rain, graupel, snow, and ice crystals. Shallow convection is parameterized according to [48]. Furthermore, convection is only parameterized in EXP2 using a mass-flux scheme [47] and explicitly resolved at a 2.5 km resolution (EXP1). Finally, fire effects are not considered in these experiments.
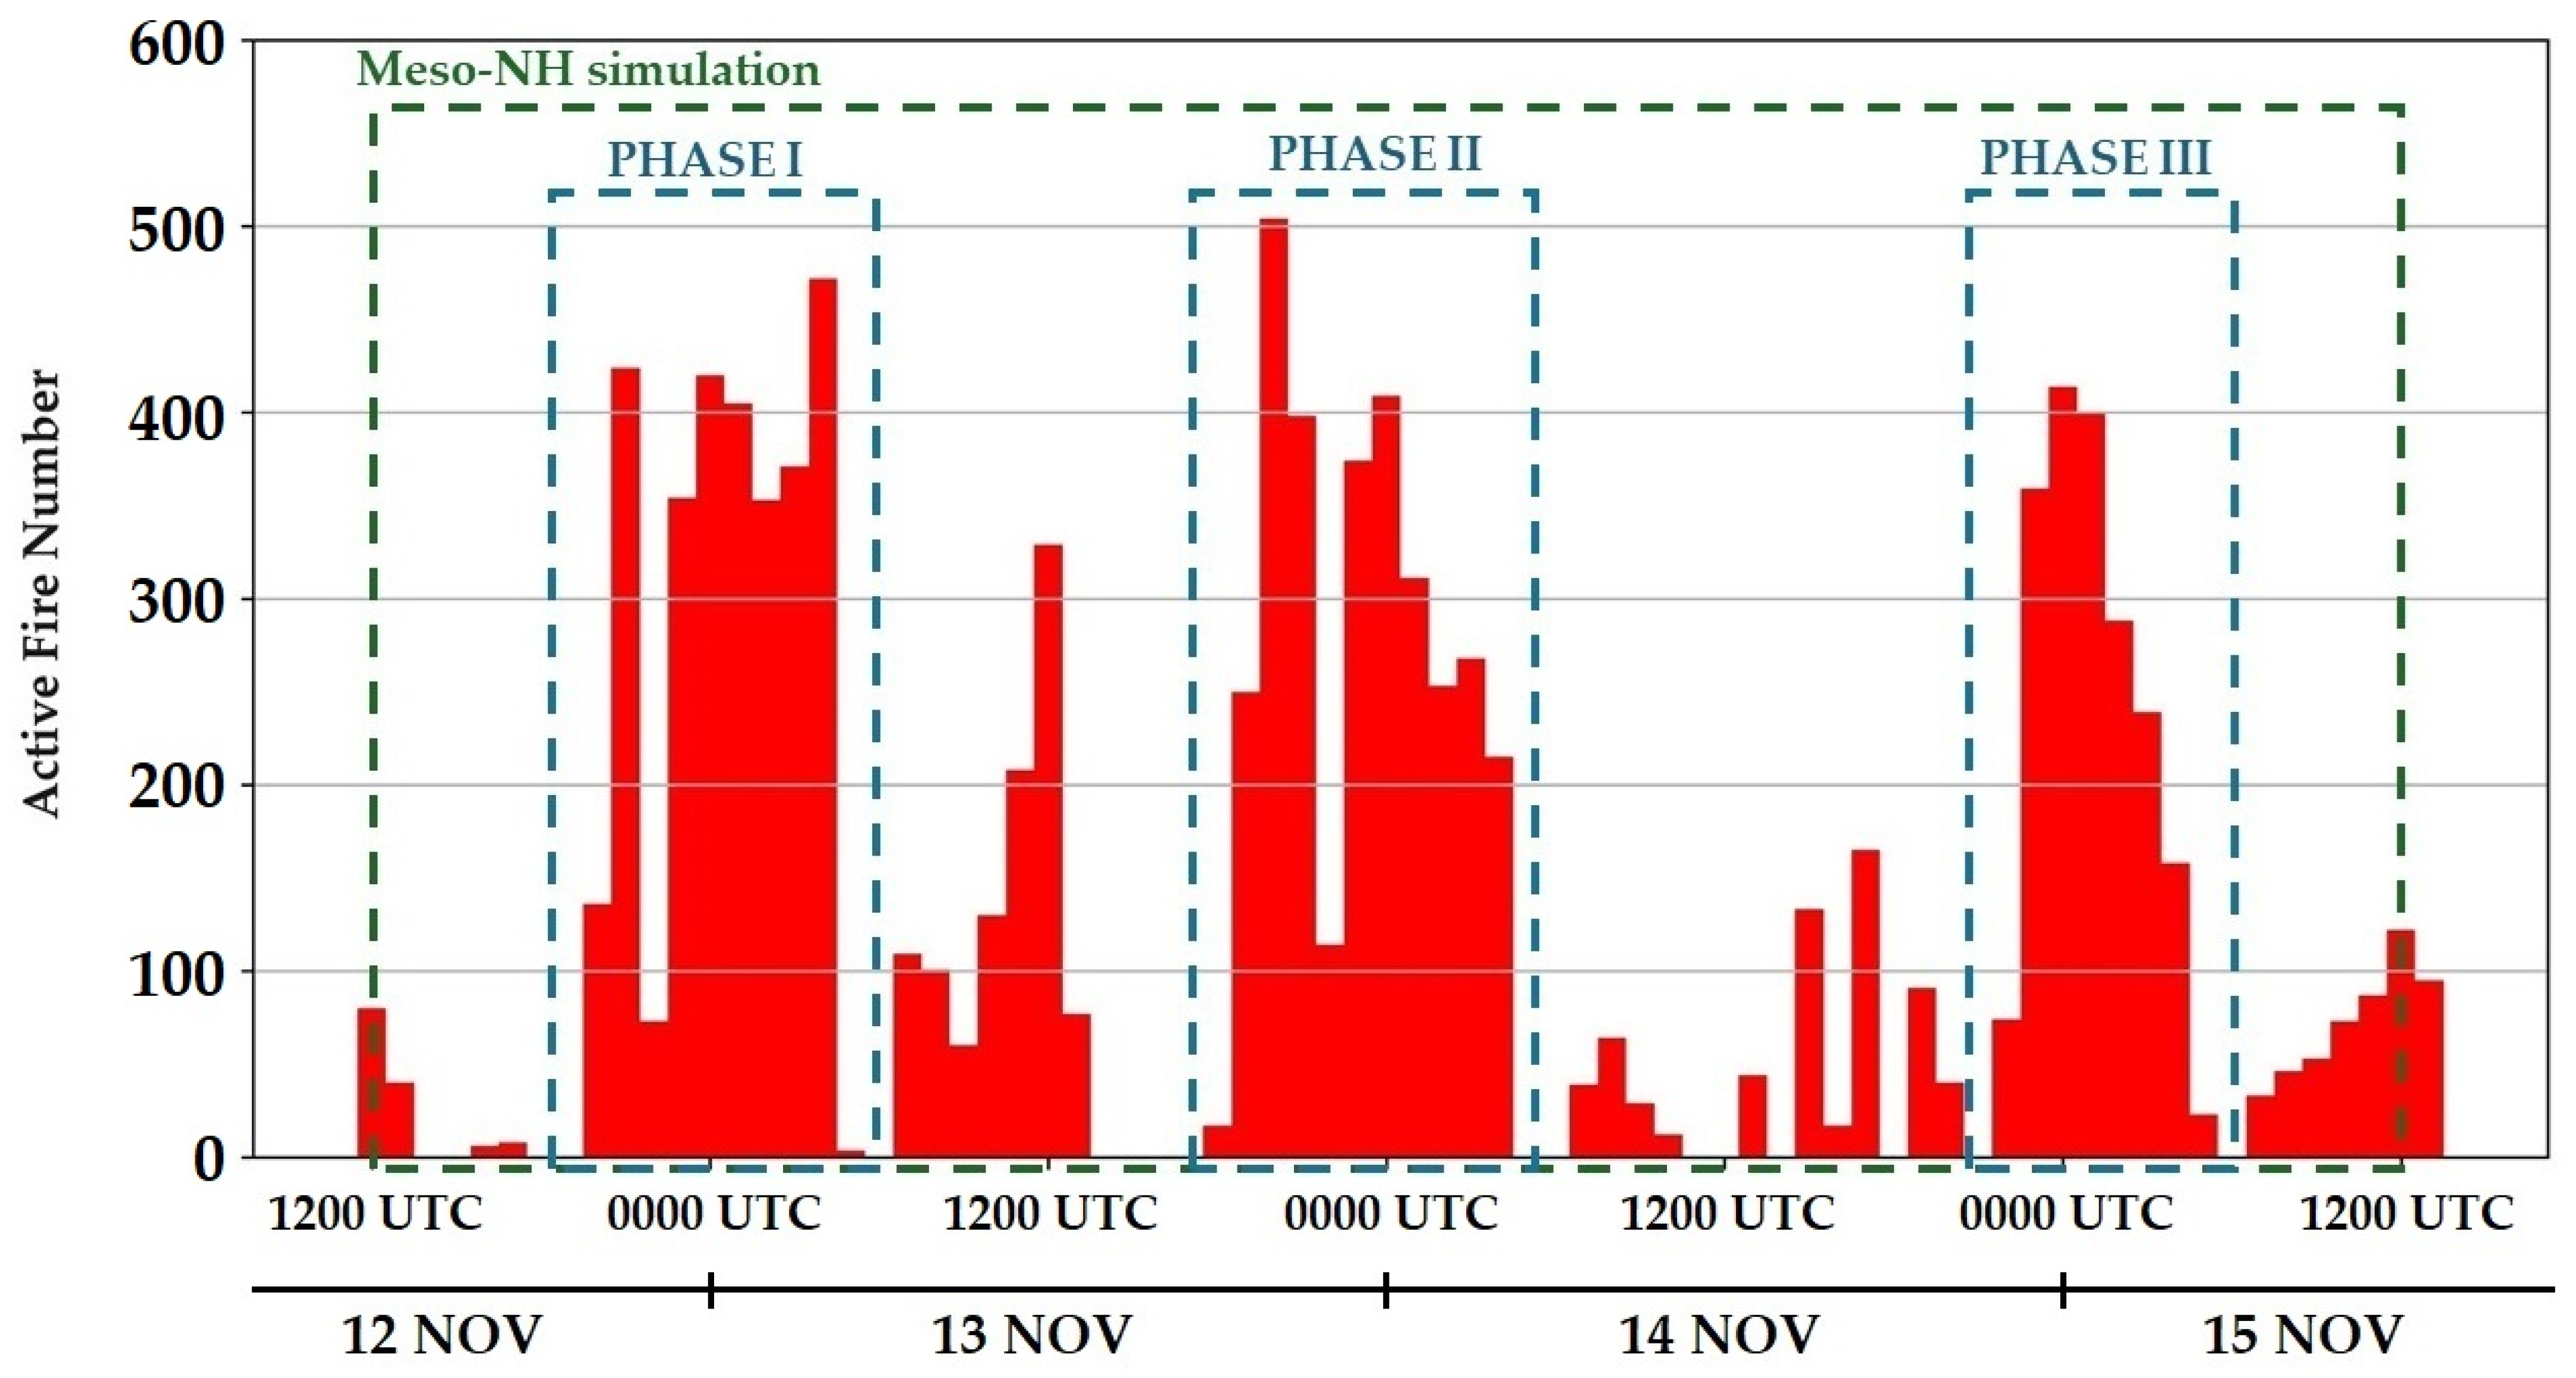
The model temporal integration was performed from 1200 UTC on 12 November to 1200 UTC on 15 November 2023 (green dashed-line box in Figure 2), covering a total of 72 h of simulation, with outputs analyzed hourly. The first 6 h were considered the simulation spin-up period. To assess the model’s performance in representing near-surface meteorological variables, observed data on air temperature, relative humidity, and wind gusts from three weather stations mentioned in Section 2.3 were compared with the corresponding simulated fields. The results are presented in Section 3.2.

3. Results and Discussion

This section presents the results, starting from the case study description and followed by the numerical results, which correspond to model validation and the analysis of the meteorological conditions.

3.1. Period Study

Figure 2 shows the hourly average active fire number distribution between 0600 UTC on 12 November and 1800 UTC on 15 November 2023 obtained from GOES-16 satellite observations. The blue dashed-line box highlights the following three periods: PHASE I, PHASE II, and PHASE III. These phases represent periods when the AFN levels suddenly surge. Each phase includes at least one instance when the hourly average AFN exceeds 400 (four times in PHASE I, twice in PHASE II, and once in PHASE III). It is noteworthy that the sudden increase in AFN typically begins in the early evening, with peaks occurring at the end of the day around 0000 UTC on the three days shown in Figure 2.
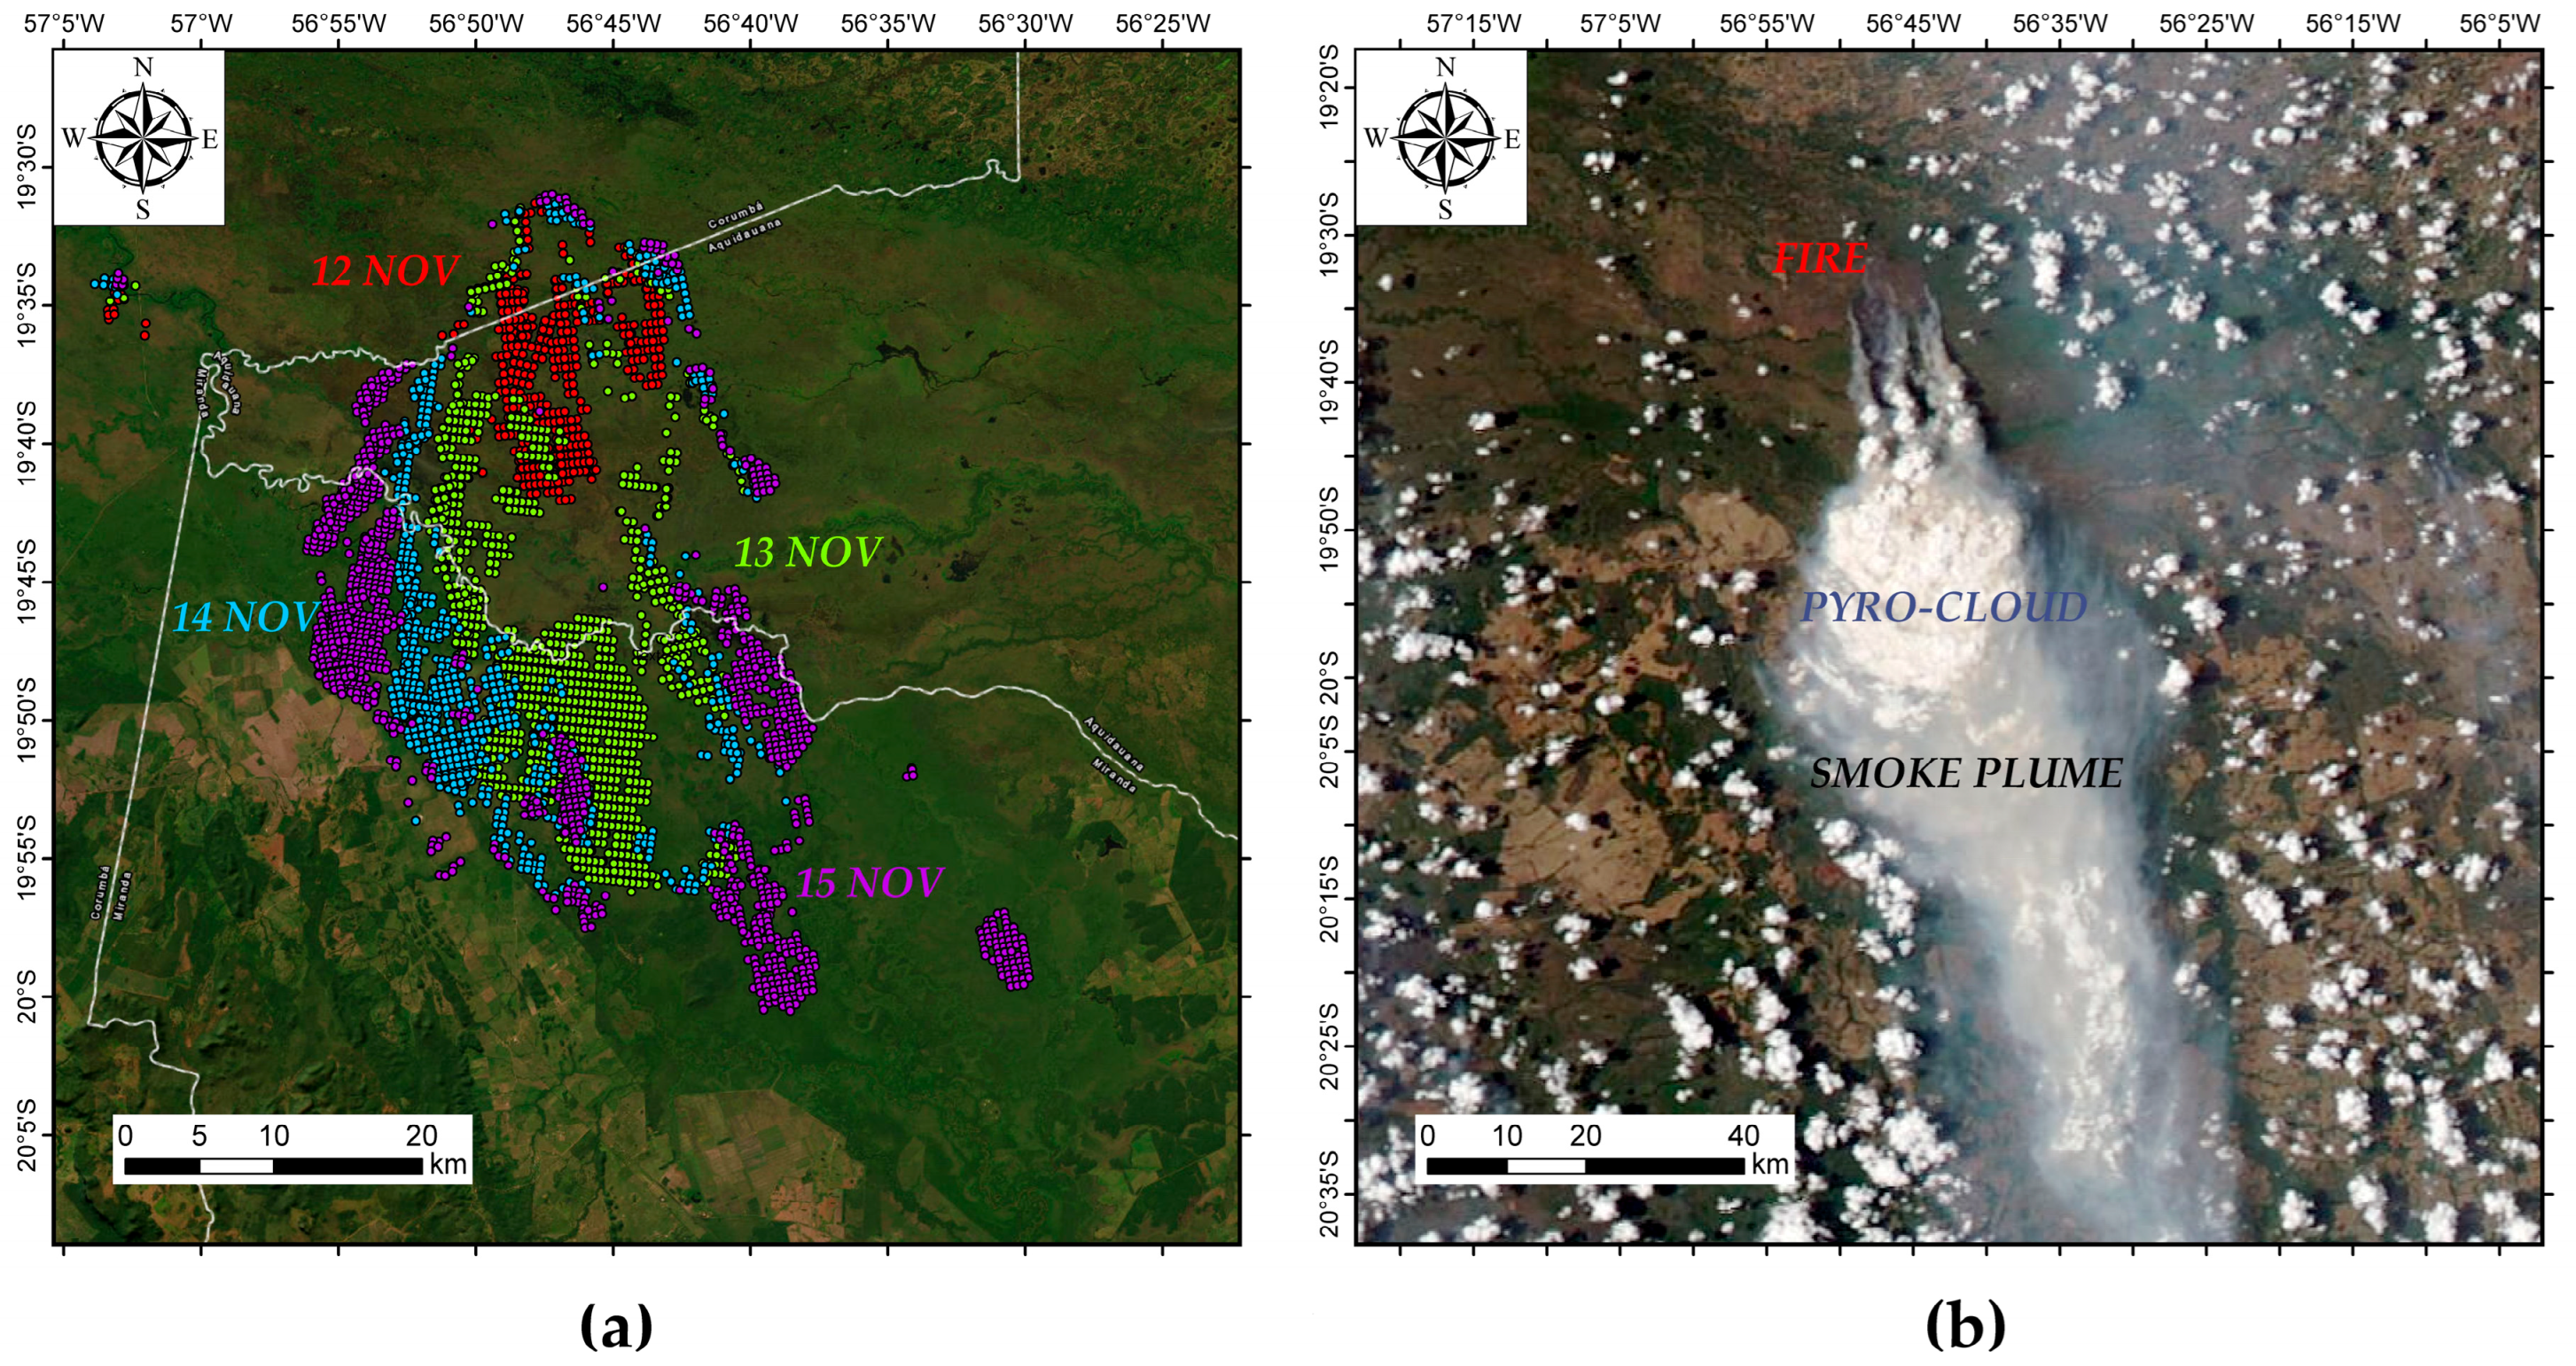
Figure 2 is complemented by Figure 3, which displays the spatial distribution of the AFN from the NOAA-20 satellite. Figure 3a shows that the AFN on 12 November (red area) extends about 20 km southward, but the AFN on 13 November (green area) covers a region of approximately 25 km of extension, likewise headed southward. The same figure illustrates a lateral fire spread on 14 November (blue area) and 15 November 2023 (purple area). Figure 3b shows a satellite image taken in the afternoon on 12 November, around 15:00 local time (1800 UTC). It can be seen that throughout the day, the fire emitted a large number of aerosols. Additionally, the smoke plume generated by the fire is transported southward and probably had a large vertical development, clearly indicating the development of pyroconvective clouds.

3.2. Numerical Results

This section focuses on validating the simulation results against observational data to understand the main atmospheric driving conditions for the increase in AFN, both in terms of spatial distribution and magnitude, as illustrated in Figure 2 and Figure 3a.

3.2.1. Model Validation

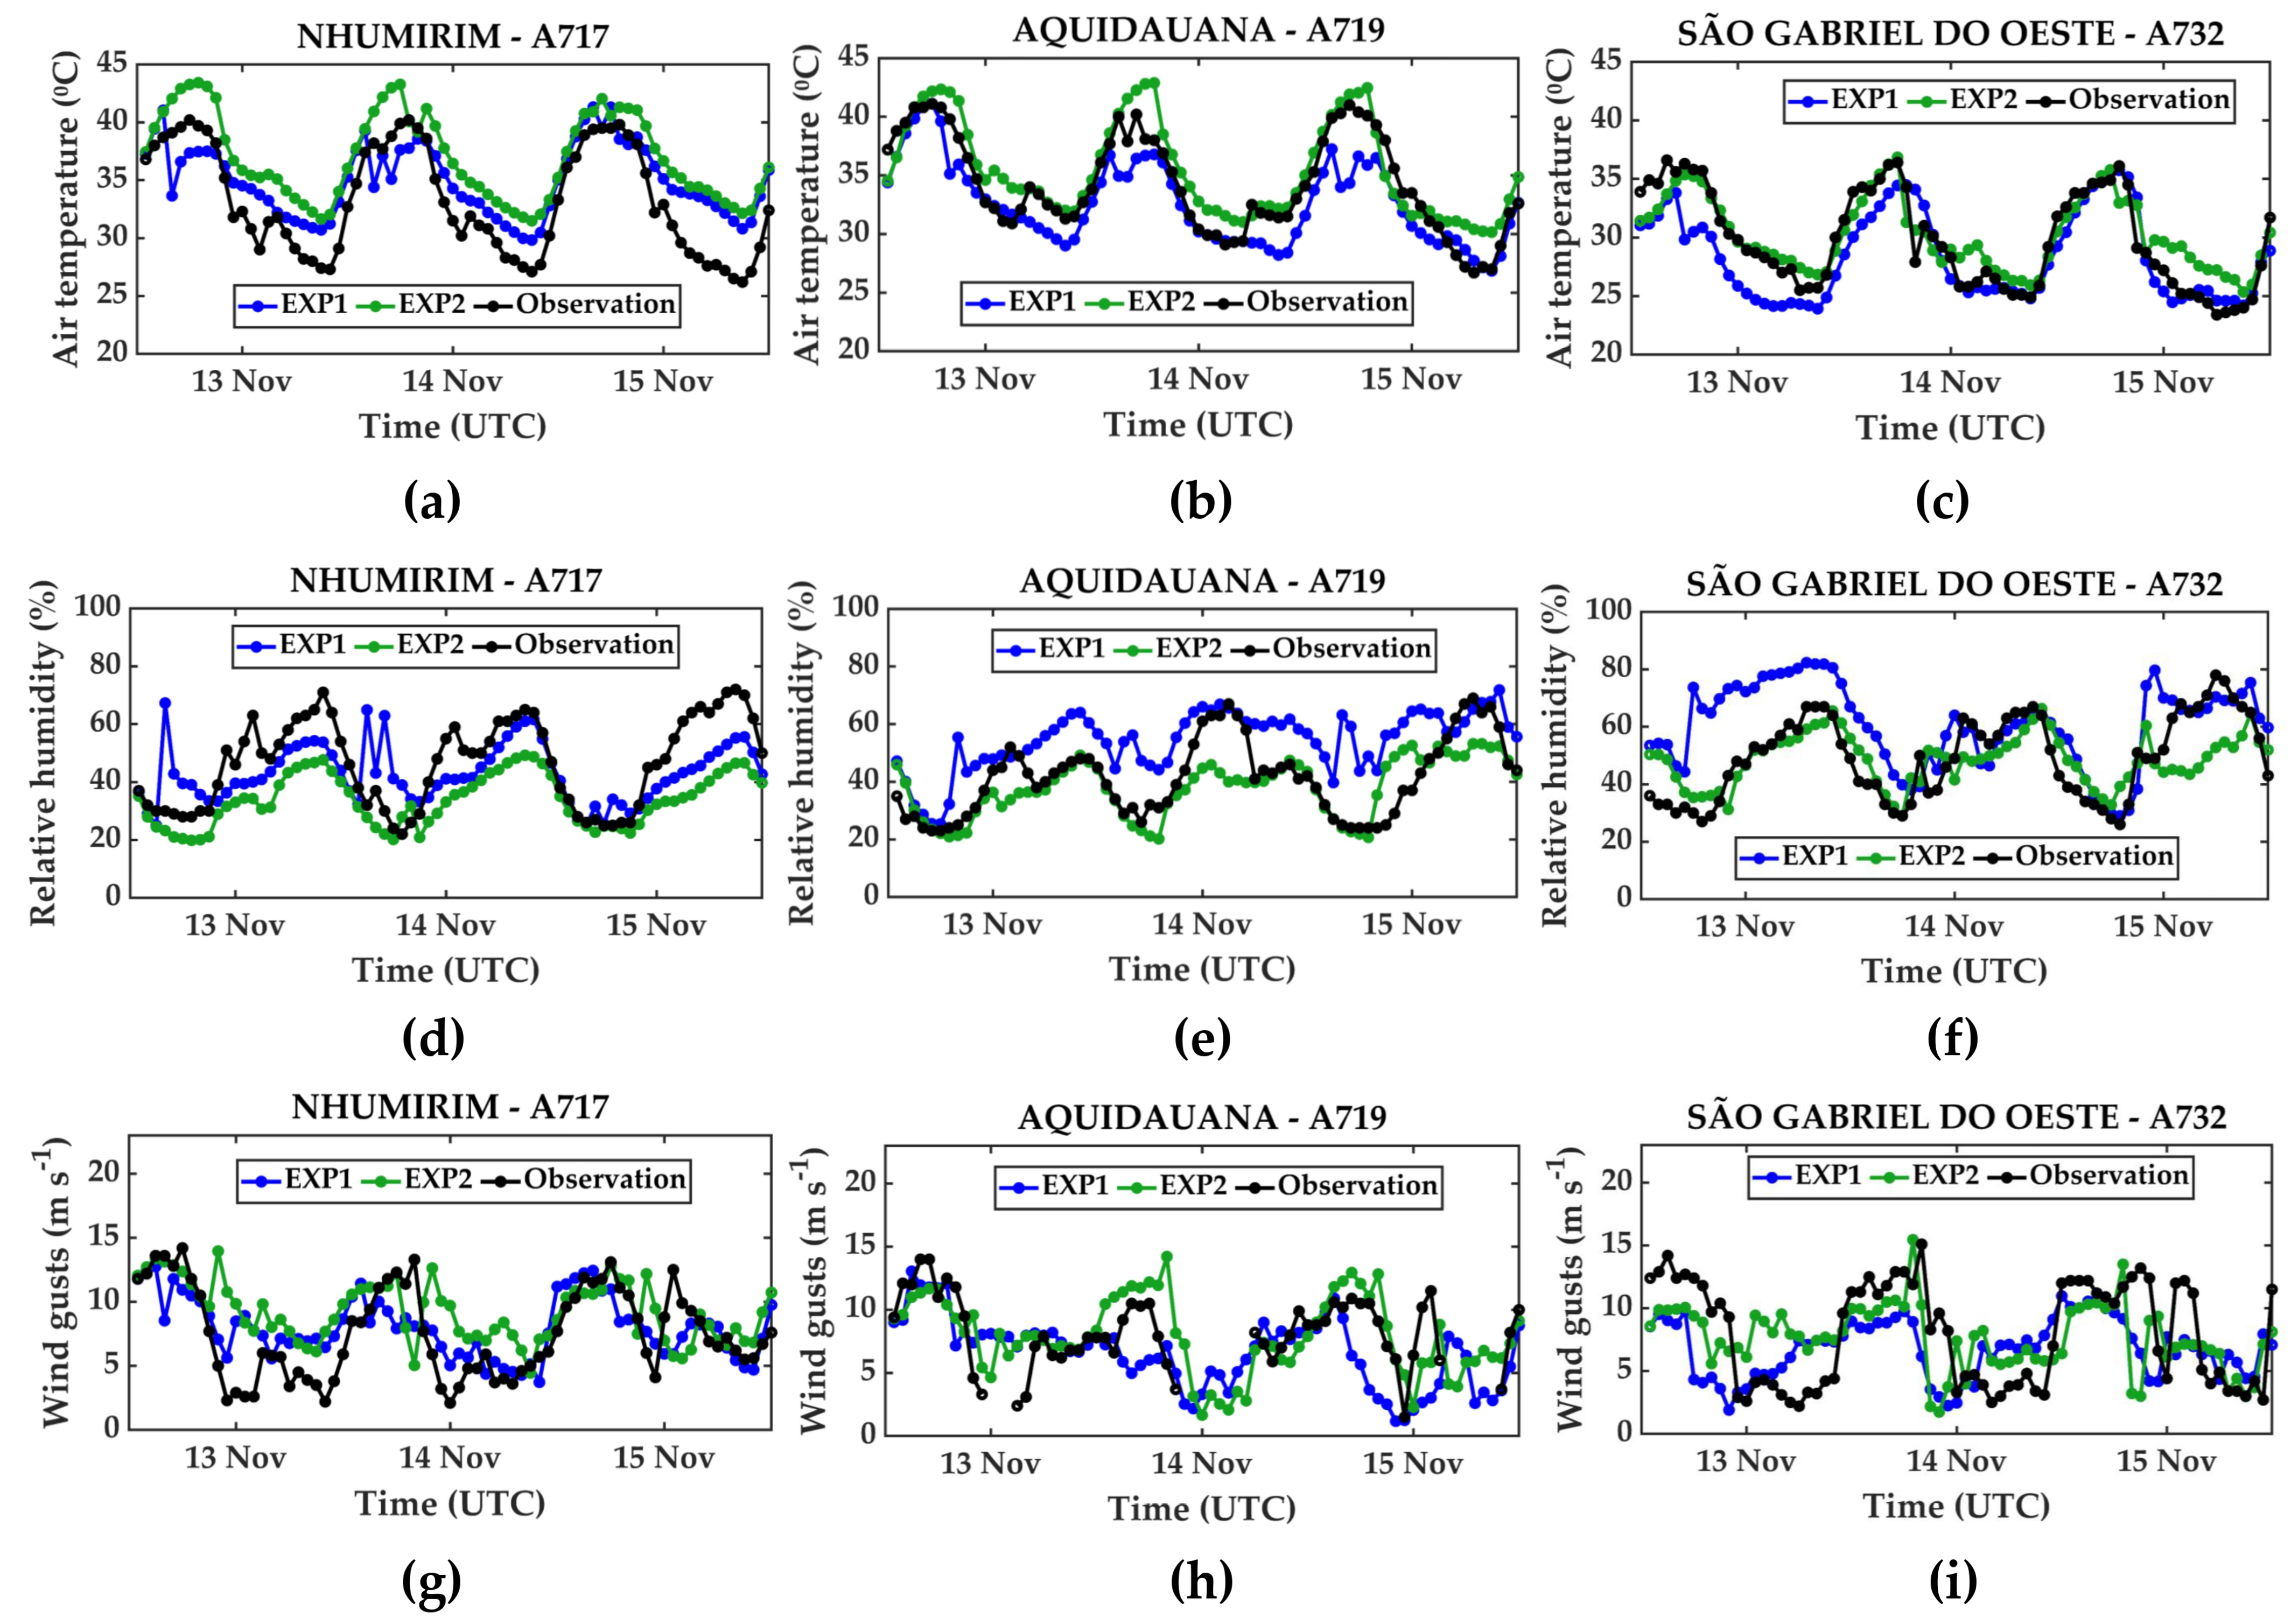
Figure 4 compares the observed and simulated values for air temperature at 2 m (Figure 4a–c), air relative humidity at 2 m (Figure 4d–f), and wind gust field at 10 m (Figure 4g–i). Overall, the model accurately represents the variables’ behavior throughout the day, with some instances of both the overestimation and underestimation of observations.
For example, it is worth noting that the EXP2 (5 km resolution) overestimates temperatures above 40 °C, as observed at stations A717 (Figure 4a) and A719 (Figure 4b), while it accurately represents the maximum values at A732 (Figure 4c). In contrast, EXP1 (2.5 km resolution) generally underestimates the observation (Figure 4a–c), except for the minimum temperatures in Figure 4a. Overall, the maximum air temperatures were recorded around 1800 UTC at all weather stations (Figure 4a–c).
For relative humidity, EXP2 accurately recreated the observed minima, which was below 30%, in all stations during the late afternoon (Figure 4d–f). However, EXP1 performed poorly at the A719 station (Figure 4e) throughout most of the period. In contrast, EXP1 effectively captured the temporal behavior of relative humidity at the other stations, A717 and A732 (Figure 4d,f).
Regarding wind gusts (Figure 4g–i), the model generally captures the variations in wind gusts, with the exception of some instances when EXP1 and EXP2 overestimate the observation in all stations, mainly during the night and early morning. On the other hand, the maximum wind gust values are captured by the model, despite some significant underestimation by EXP1.
Table S1 displays the mean error (ME) and root mean squared error (RMSE) calculated for each station, considering the EXP1. For the air temperature values, the ME indicates that the model tended to overestimate the temperature (positive values) at A717 and underestimate it at the A719 and A732 stations, with a maximum RMSE of around 2.5 °C in all weather stations. In general, the relative humidity was overestimated by the model, with the ME around 13% and the RMSE at 16% in A719. In the case of wind gusts, the values were well-captured by the simulation, with errors close to zero at A717 and a maximum RMSE of 3.9 m.s−1 at A732. For the EXP2 (Table S2), the ME of the air temperature was overestimated by the model, with a maximum RMSE of around 4 °C (A717 station). In the case of relative humidity, the mean error indicates an underestimation, with the ME at around 12% and a maximum RMSE of around 15% at the A717 station. The ME of wind gusts indicates that it was well-simulated by the model, with errors close to zero and a maximum RMSE of about 3.74 m.s−1 at the A732 station. Despite the low number of available weather stations, and thus fewer observational data, in the Pantanal region, the validation of the model through the calculation of some scores demonstrated that the model is able to quantitatively simulate the observed values, even with some under- or overestimation.

3.2.2. Meteorological Environment

Fire weather conditions are explored through three meteorological fields that influence fire behavior. For example, near-surface air temperature and relative humidity affect the state of vegetation, which can affect flammability. Meanwhile, strong wind gusts directly influence the propagation of fire fronts.
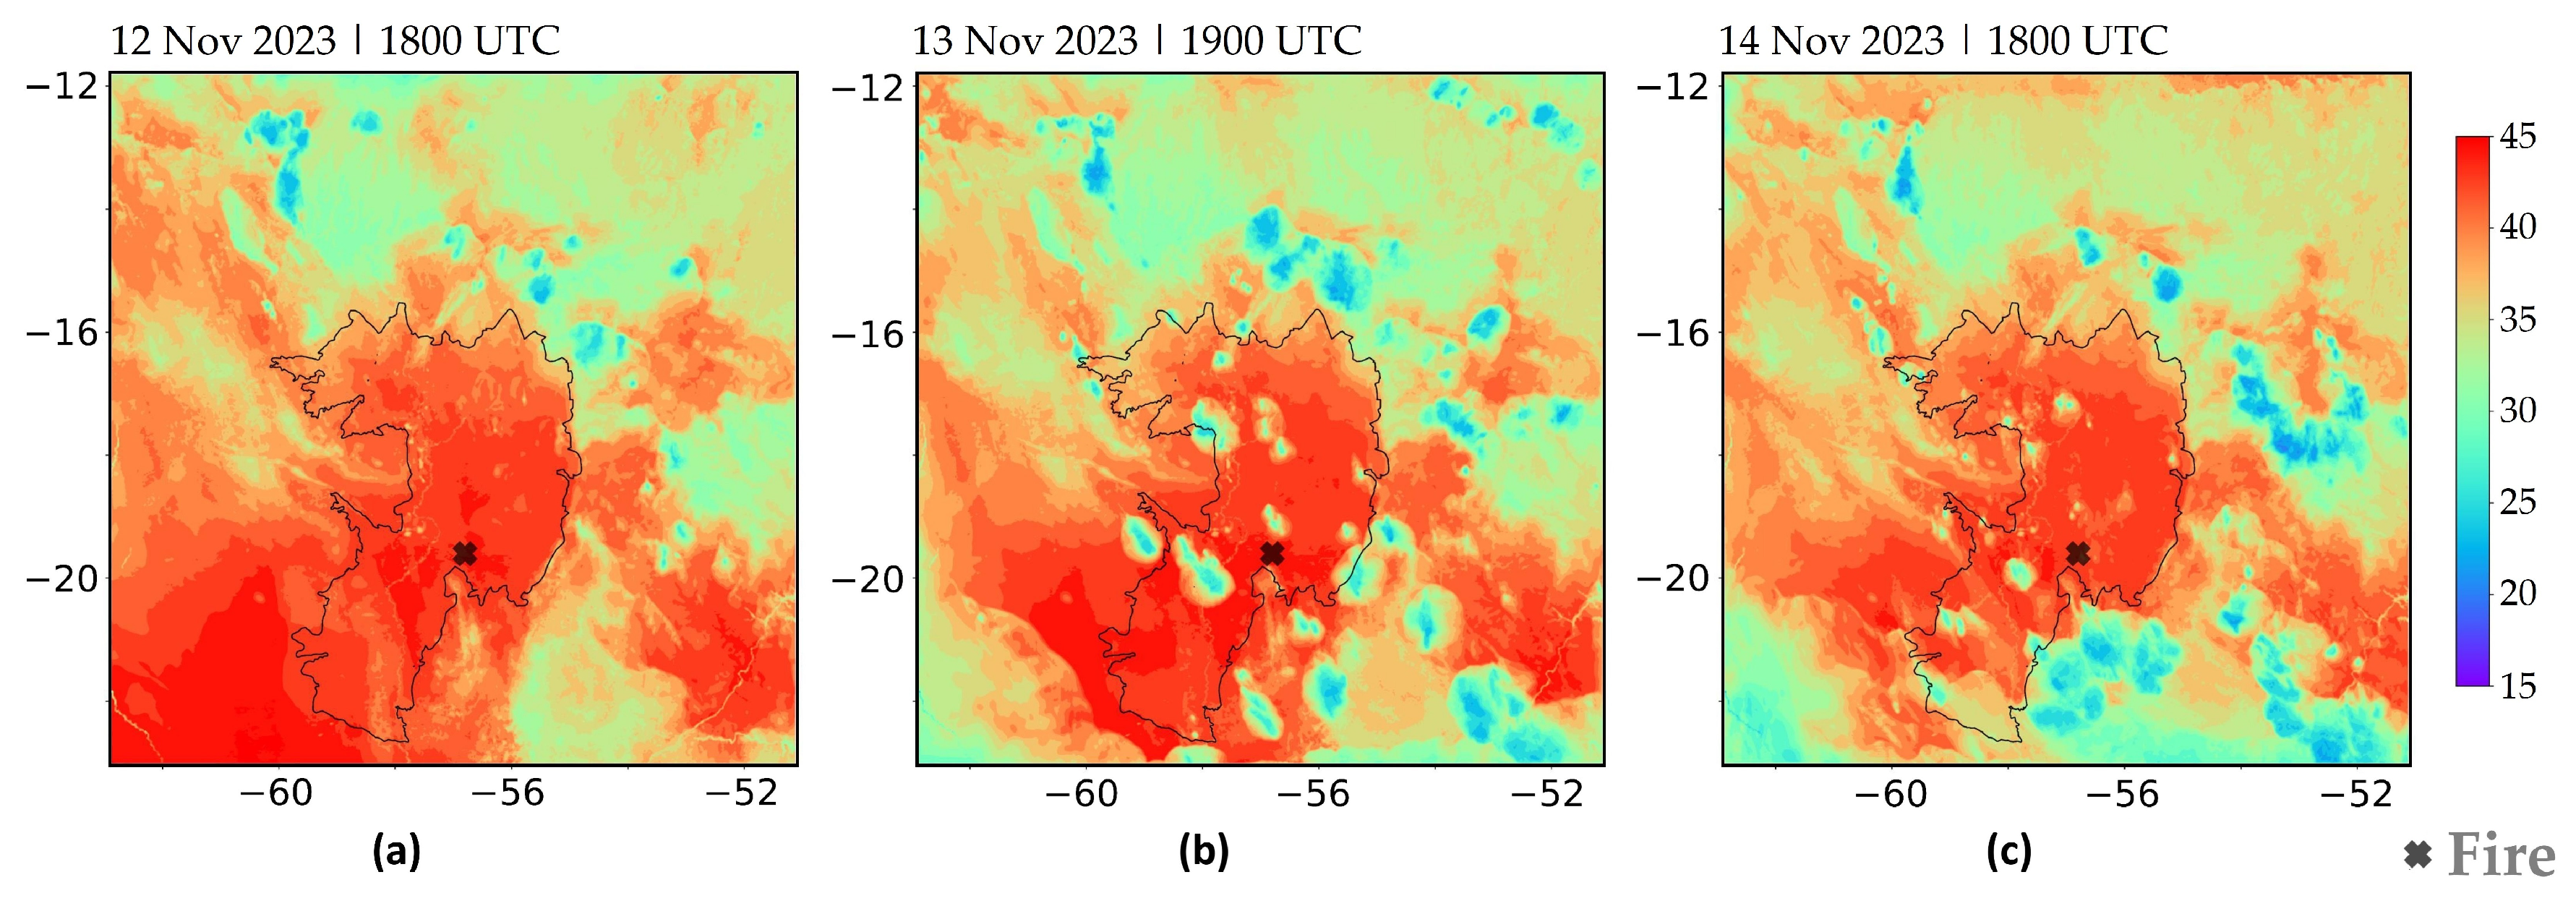
Figure 5 displays the spatial distribution of air temperature, highlighting key moments throughout the period and preceding the peak AFN values. The maximum temperatures are simulated around 1800 UTC, presenting a greater spatial extension of values above 40 °C, particularly over the Southern Pantanal (Figure 5a). However, some cores with relative minima (around 25 °C) appear from the late afternoon in the Pantanal (not shown). Since the air temperature field at 1800 UTC on 13 November is similar to the present in Figure 5a, Figure 5b displays the environment one hour later (1900 UTC), showing the relative air temperature minimums over Pantanal. This moment represents the change in the wind regime over the region after 1800 UTC. By 14 November, these cooler areas become more localized and appear earlier, but high temperatures persist across the region (Figure 5c).
Figure 6 shows the simulated relative humidity at 2 m for the same times as Figure 5. The Pantanal region has values of around 20% during the afternoon, and it is possible to verify that the relative maxima are found in cores, in which the temperature is relatively lower (Figure 6b,c), showing evidence of the development of “cold pools” or “convective outflows” reaching the ground from convective clouds. Nonetheless, relative humidity remains below 40% across the Pantanal in a regional context.
Regarding the wind gust simulated at 10 m, weaker wind gusts were simulated throughout the night and early morning, which intensified by the end of the morning, with values above 10 m.s−1 over the Pantanal during the afternoon (data not shown). Such a behavior is also identified by observations presented in Figure 4g–i.
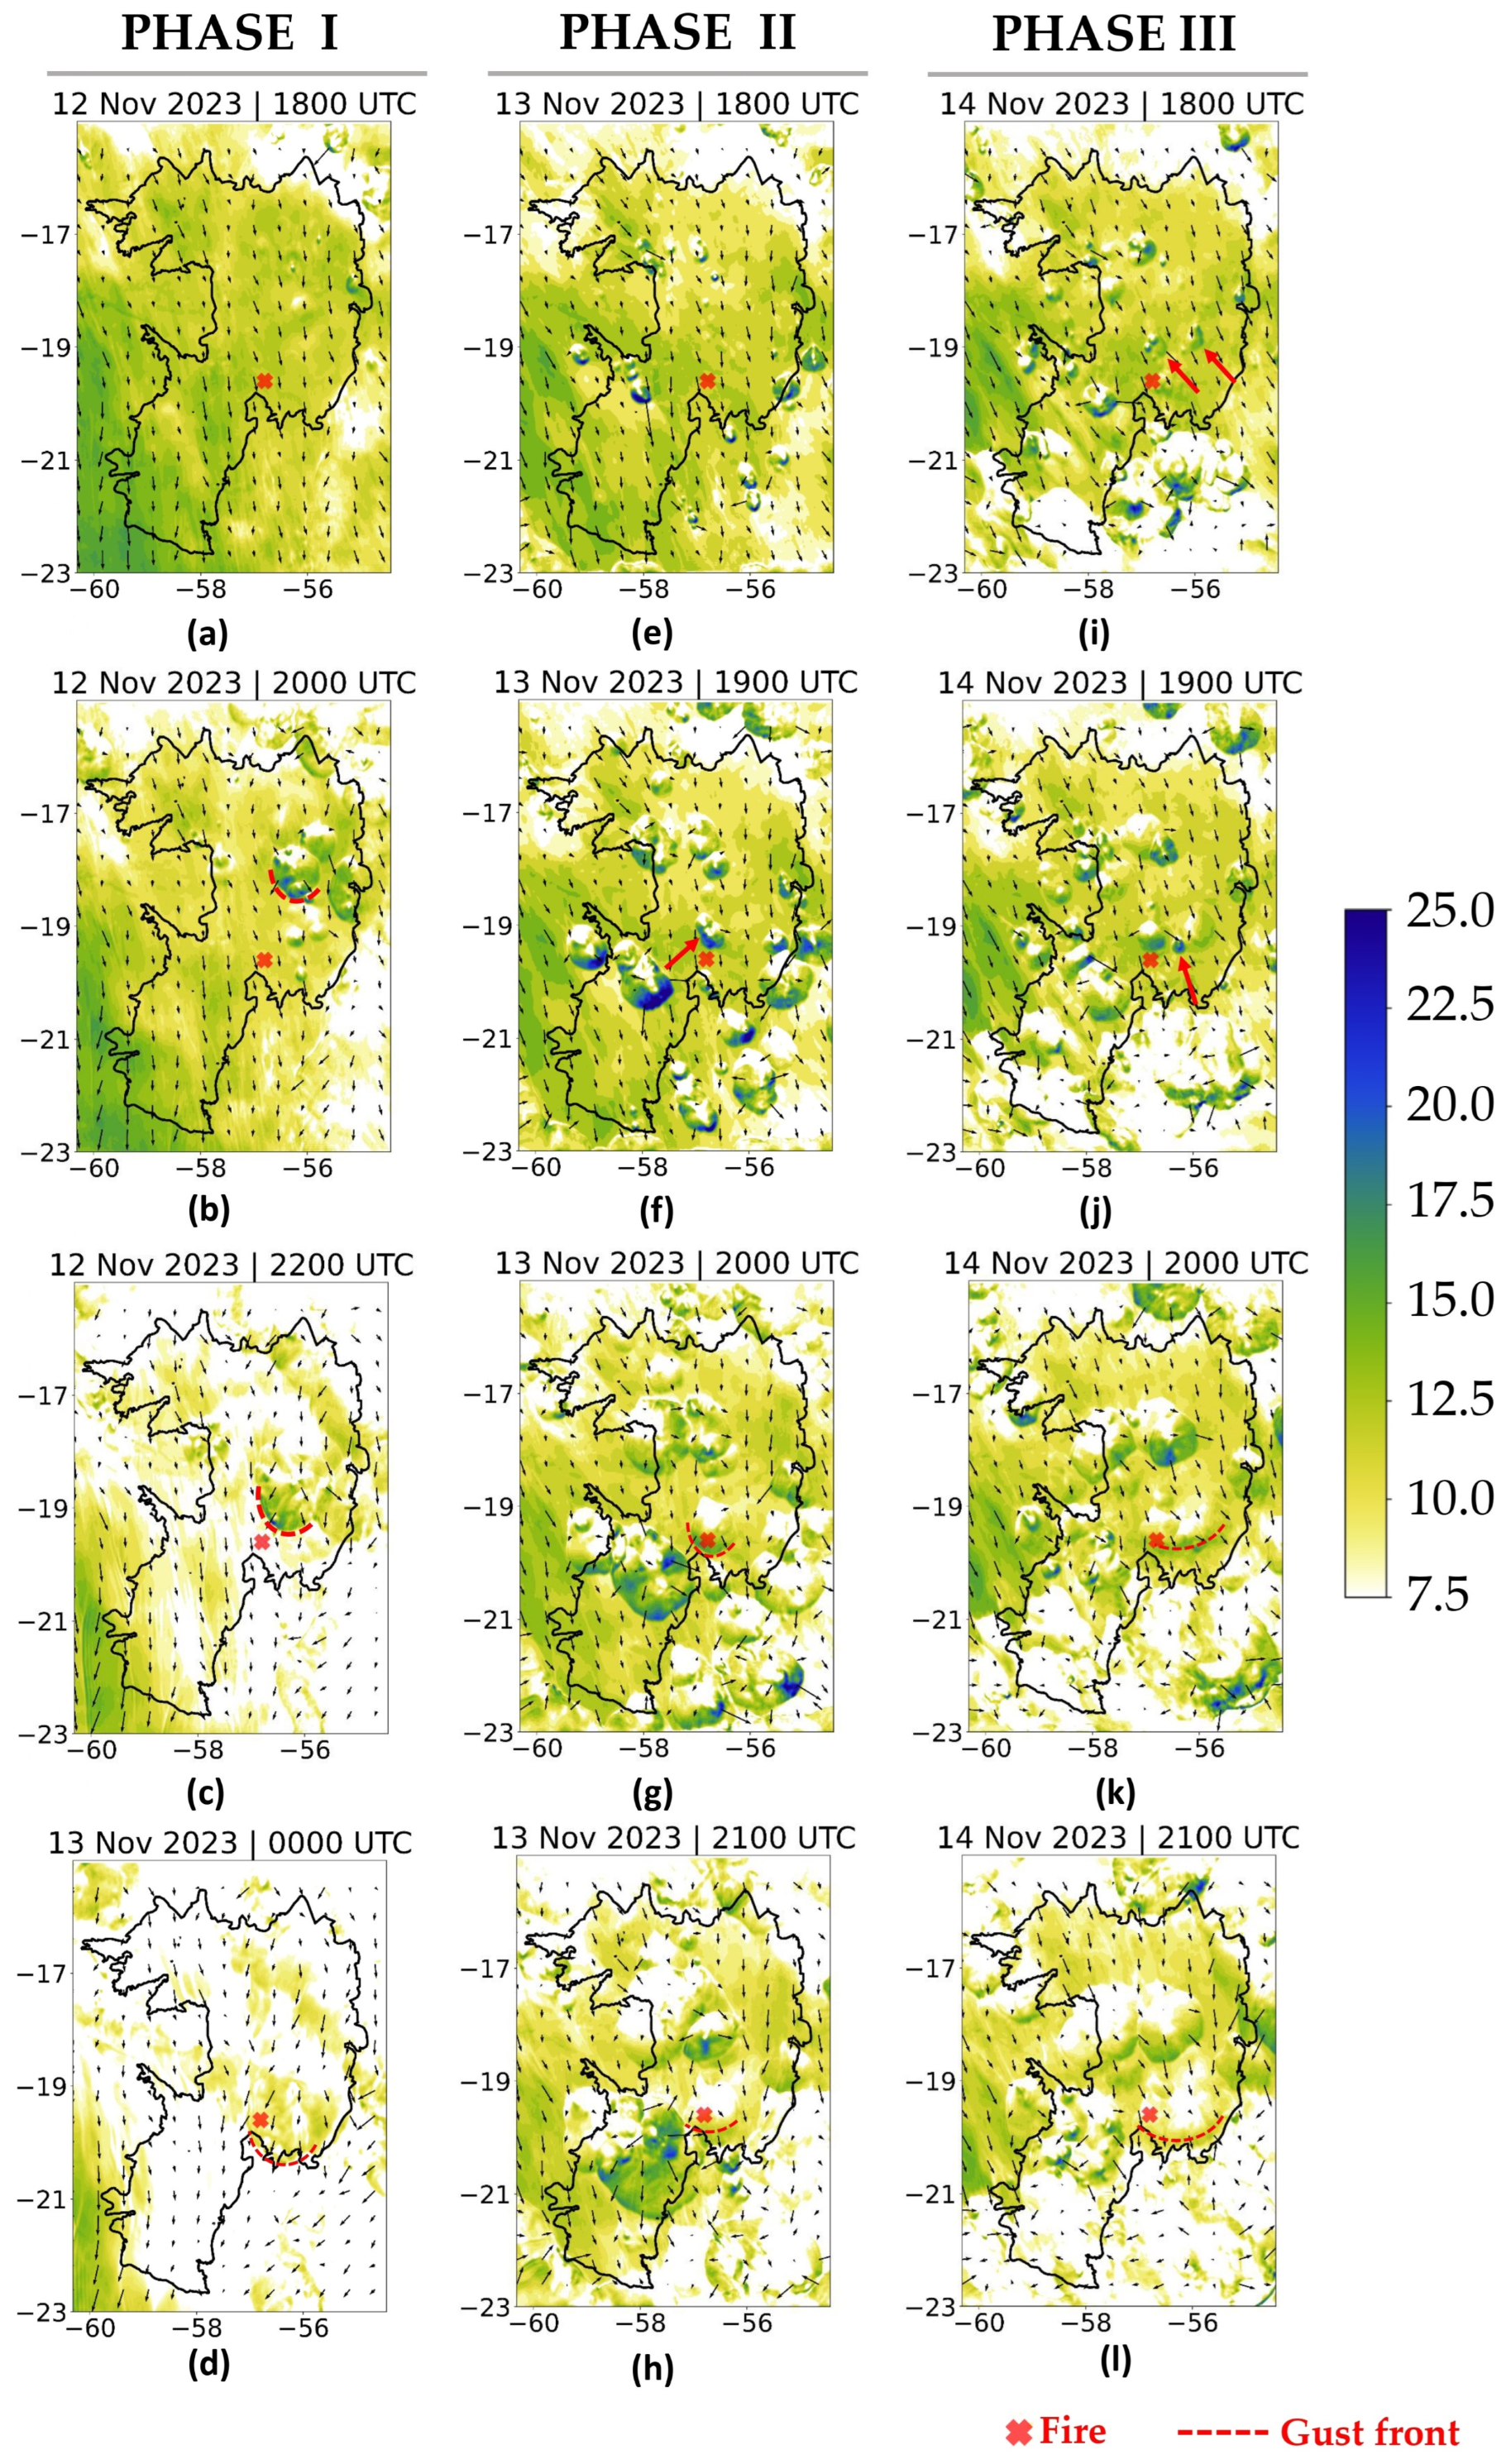
Figure 7 presents the wind gust field divided into three phases. In PHASE I, intense wind gusts are observed westward, influenced by orographic effects from the Andes Mountain, extending southward with values exceeding 16 m.s−1 (Figure 7a). However, in the late afternoon, it is possible to observe the development of several gust fronts in the northeastern Pantanal, with wind gusts of around 20 m.s−1 (Figure 7b). The gust front identified in Figure 7b (red dashed lines) propagates southwards in the following hours (Figure 7c) and diminishes in strength upon reaching the fire region, with gust velocities of 10 ms−1 at 0000 UTC on 13 November 2023 (Figure 7d).
In PHASE II, a similar circulation pattern is observed over the region, i.e., a moderate northerly flow in the afternoon. At 1800 UTC on 13 November (Figure 7e), many gust fronts appear southeast of Pantanal. A particular gust front is highlighted at 1900 UTC in Figure 7f (red arrow), with gusts above 22 m.s−1. This gust front propagates southward, reaching the fire region at 2000 UTC, with wind gusts of 14 m.s−1 (Figure 7g). The fire region remains under the influence of this gust front, although gust intensities have decreased to around 12 m.s−1 (Figure 7h).
In PHASE III, the development of gust fronts was also observed in the late afternoon and early evening. At 1800 UTC, two cores of intense wind gusts are identified (Figure 7i; red arrows), which merge with a third core (Figure 7j) to form a single gust front (Figure 7k). This gust front presents wind gusts above 12 m.s−1 over the fire region (Figure 7j), moving southward in the following hour (2100 UTC), although the gusts decrease to around or below 12 m.s−1 (Figure 7l). These instances are consistent with fire evolution presented in Figure 3a and also precede the maximum of AFN presented in Figure 2.
Figure 8 presents the wind field for the EXP2 simulation (5 km of resolution) for some moments that were previously analyzed from the EXP1 (Figure 7). The figure reveals some limitations in representing convective outflows reaching the surface and generating gust fronts; it is not possible to identify the gust fronts identified in Figure 7. All the figures show the fire region with weaker winds, contrasting significantly with the more intense wind environments shown in the corresponding EXP1 figures.
The difference between EXP1 and EXP2, displayed in Figure 9, supports the idea that the 2.5 km resolution simulation (EXP1) simulated more wind gusts than the 5 km resolution simulation (EXP2). A positive difference in the study region reflects the circular structure of the gust fronts (Figure 9a), with a clearer representation on 13 November, at 2000 UTC (Figure 9b). In PHASE III, intense wind gusts are simulated by EXP1 over the fire region (Figure 9c), underscoring the important role that high-resolution atmospheric modeling can play in developing effective fire combat strategies in the Pantanal region.
In general, strong gust fronts are linked to severe weather conditions, namely, convective storms. They can develop from thunderstorms, and their strength can be associated with the intensity of the cold pools [61,62]. On the other hand, another meteorological phenomenon that can influence the gust front’s dynamics is convective outflows, also known as downbursts, which have been extensively studied due to their impact on the surface, e.g., [63,64,65,66,67]. A downburst is a downdraft that spreads outward upon touching the ground, creating strong, often highly divergent horizontal winds [68].
In the context of wildfires, the development of convective outflows and gust fronts at the surface is recognized as a factor that increases the danger of fire propagation in certain regions, such as the Iberian Peninsula [33]. This phenomenon resembles the occurrence of convective systems (i.e., dry thunderstorms) over dry atmospheric layers, in which most of the precipitation evaporates before reaching the ground, creating surface outflows and strong gust fronts that can influence fire behavior, e.g., [36].
In the case of the Pantanal fires, our study highlights the evolution of several gust fronts from the late afternoon. It is noteworthy that these gust fronts are dependent on convective processes and their representation by the numerical models, and some gust fronts can present a slight temporal or spatial displacement. Figure S1 displays an instance that represents such a situation. For example, Figure S1a shows some convective clouds over the Pantanal (red square), which are identified in the EXP1 simulation southwestward red square in Figure S1b,c. Figure S1b represents the thickness of cloud water, whereas Figure S1c depicts the thickness of frozen water, represented by the sum of the thickness of graupel, snow, and ice. In addition, Figure S1d displays the vertical velocity field at around a 1 km altitude, indicating the presence of downward motion below the convective clouds (white square). Even with such a discrepancy, the results showed the benefits of atmospheric modeling to identify this phenomenon. We consider such a result to be a starting point for future studies in the region related to fire risk based on the meteorological conditions, which can be crucial for the rapid fire spread. The Pantanal is one of the most important biomes, with a spectacular abundance and diversity of vegetation and animal life [7].
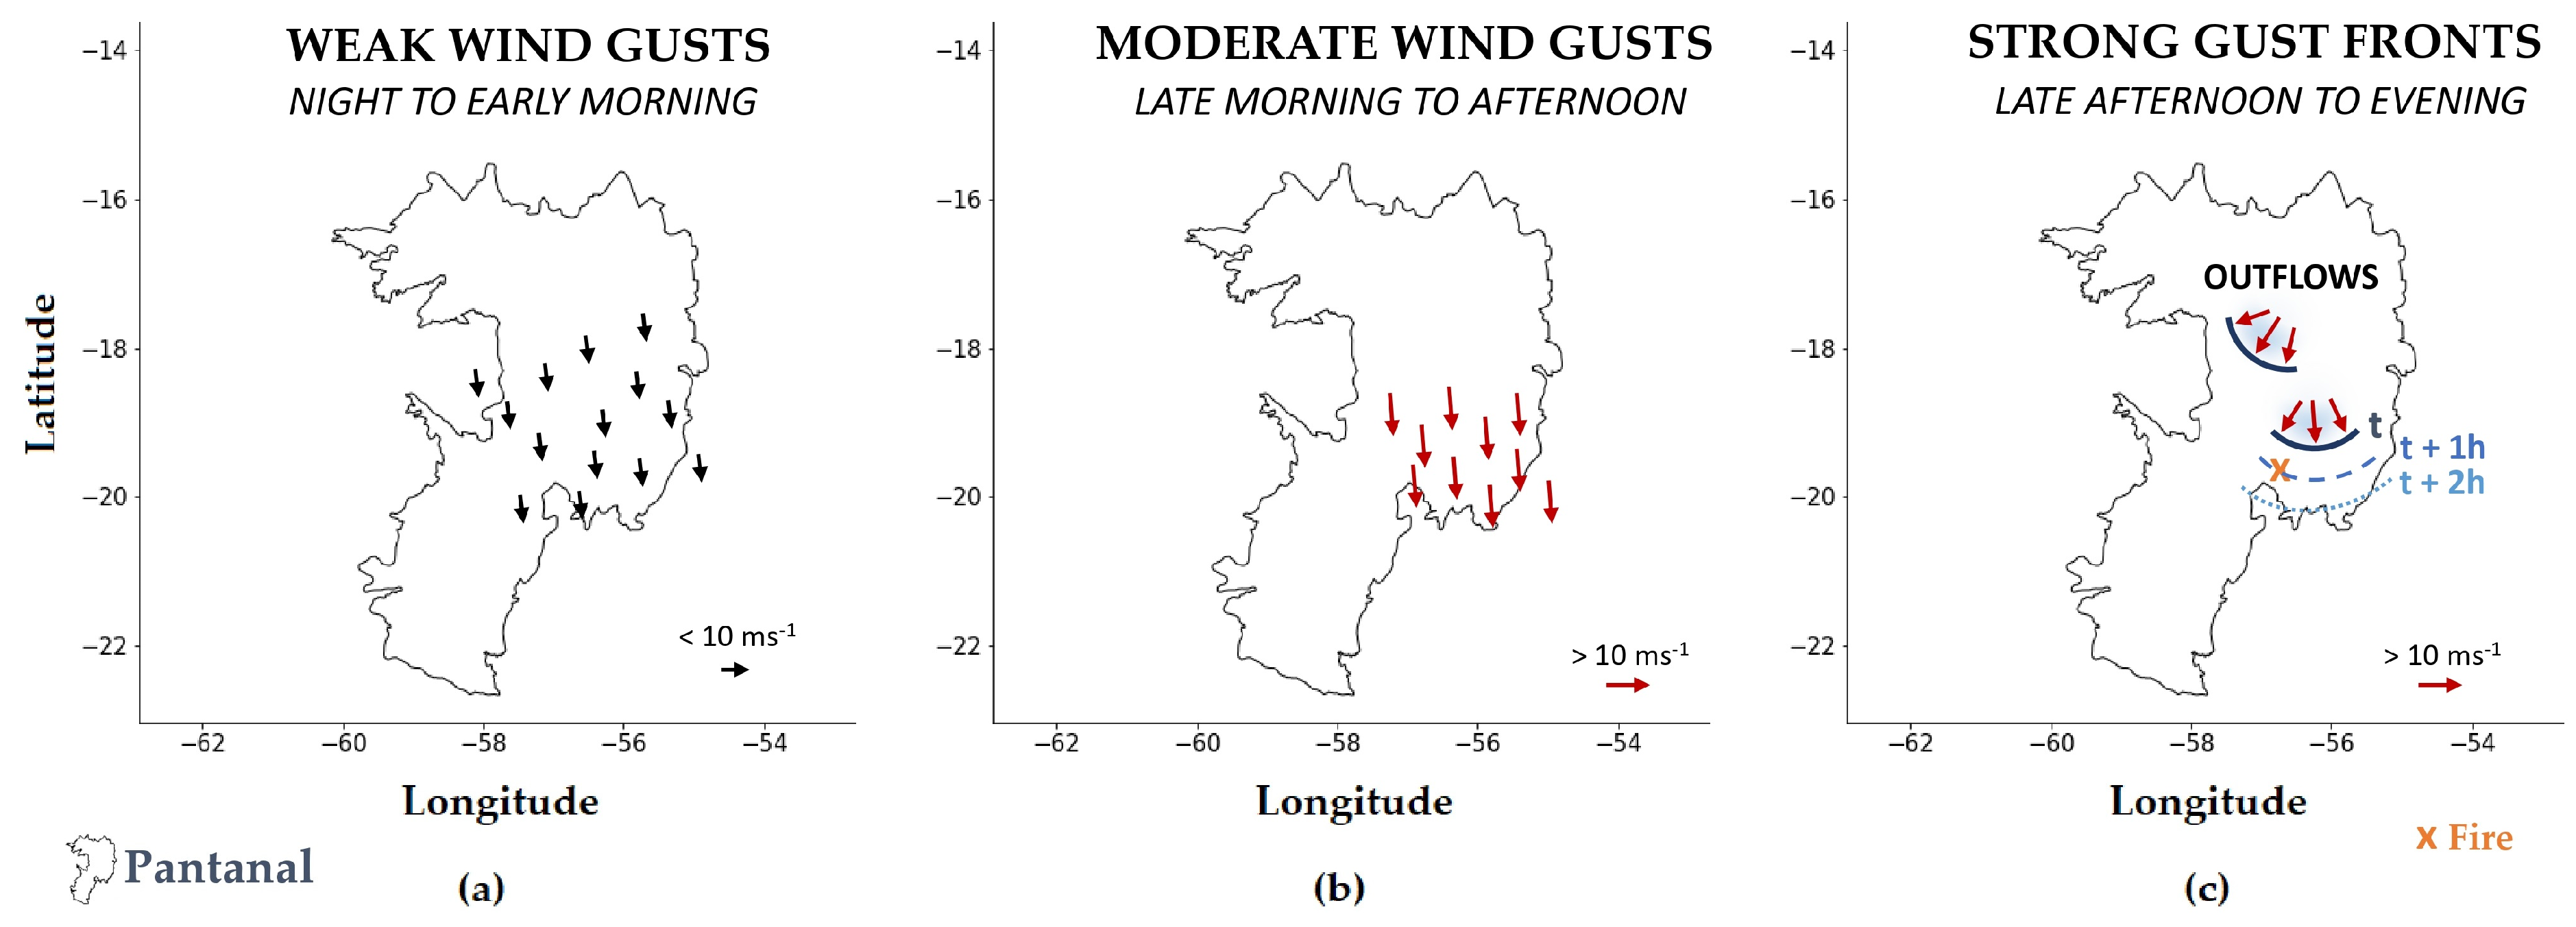
Schematic diagrams of airflow dynamics, which represent the pathways of air parcels along the events, can be very useful for summarizing critical situations. For the present study period, a schematic diagram is proposed and depicted in Figure 10. It categorizes the environments found in this study into three periods. PERIOD I corresponds to the southward airflow over the Pantanal during the night and early morning, resulting in weaker wind gusts in the study region (Figure 10a). PERIOD II (Figure 10b) corresponds to the intensification of the wind gusts on a regional scale along the day and prevailing from the north. Finally, PERIOD III represents the gust fronts at the surface produced by convective outflows that reach the ground and spread radially. Here, the gust fronts were simulated with more intensity propagating southward, as indicated in Figure 10c from the notation time (t), t + 1 h and t + 2 h.

4. Conclusions

This study is a step toward a better understanding of meteorological conditions that favor the development of large fires in the Pantanal wetland, highlighting the benefits of using atmospheric modeling to support critical situations. The results may constitute helpful information to improve the identification of such situations or during firefighting training actions over the region.
The Meso-NH is a research model; however, other numerical weather prediction models (e.g., WRF model, ICON model) could also be used to forecast the atmospheric conditions over the region in an operational context, as well as configured with high-resolution. Generally, increasing spatial resolution is recommended over regions with complex terrain; however, the simulation at 2.5 km resolution (EXP1) encompassing the Pantanal showed good results when compared to weather station data.
The analysis of meteorological variables influencing fire behavior revealed the critical fire environment characterized by high temperatures (around 40 °C) and low relative humidity (below 30%) in the region. The cloud-resolving simulation at a 2.5 km resolution provided evidence about the causes of a sudden active fire number increase, quick fire front expansion, and extensively burned areas. Considering the 72 h simulated period between 12 and 15 November 2023, this case study highlighted a daily cycle of gust fronts during the late afternoon and early evening. This dynamic associated with intense wind gusts at the surface played a crucial role in both the generation of active fires and the intensification of their spread, leading to unexpected fire behavior.
Increasing knowledge of critical fire situations can help to improve firefighting strategies, whereas atmospheric models can help in short-term fire risk evaluation. In this sense, this study shows that high-resolution numerical simulations, which explicitly resolve convection, are important for representing atmospheric phenomena on both regional and local scales. Such simulations effectively captured intense wind gusts, which complemented the satellite observation and helped us understand the fire dynamics and high active fire number. However, some limitations were found in this study, mainly regarding the gust front validation. Although the numerical experiment has shown the occurrence of several gust fronts from the late afternoon, future studies should focus on the identification and characterization of these gust fronts from an observational perspective.
The encouraging results found here motivate future studies, also considering other specific situations, in order to better understand the meteorological factors behind large fires and provide new insights into the fires over the Pantanal wetland.

Supplementary Materials

The following supporting information can be downloaded at https://www.mdpi.com/article/10.3390/earth5030028/s1: Table S1. Mean error (ME) and root mean squared error (RMSE) for 2 m air temperature and relative humidity and wind gusts at 10 m. Scores are calculated for the nearest point of each weather station, considering EXP1 simulation; Table S2. Mean error (ME) and root mean squared error (RMSE) for the 2 m air temperature and relative humidity and wind gusts at 10 m. Scores are calculated for the nearest point of each weather station, considering EXP2 simulation; Figure S1. 13 November 2023 at 1900 UTC: (a) GOES-16 brightness temperature (unit: °C) satellite image (Band 13 at 10.3 µm), a geostationary satellite disseminated by National Oceanic and Atmospheric Administration (NOAA); (b) thickness of cloud water (unit: mm); (c) thickness of frozen water (graupel + snow + ice; unit: mm); and (d) vertical velocity at 1 km altitude (m.s–1).

Author Contributions

Conceptualization, F.T.C. and F.L.M.S.; methodology, F.T.C. and F.L.M.S.; software, F.T.C., F.L.M.S., C.C., C.P. and J.M.L.-V.; validation, C.P.; formal analysis, F.T.C., F.L.M.S., C.C., C.P., N.A., J.M.L.-V. and M.L.; investigation, F.L.M.S. and F.T.C.; resources, F.T.C. and F.L.M.S.; data curation, F.L.M.S., C.C. and C.P.; writing—original draft preparation, F.T.C.; writing—review and editing, F.L.M.S., C.C., C.P., N.A., J.M.L.-V. and M.L.; visualization, F.L.M.S., C.C. and C.P.; supervision, F.T.C.; project administration, F.T.C.; funding acquisition, F.T.C. All authors have read and agreed to the published version of the manuscript.

Funding

This research was cofounded by FCT-Fundação para a Ciência e a Tecnologia, I.P., under the PyroC.pt project (Ref. PCIF/MPG/0175/2019) and ICT project (UIDB/04683/2020 | UIDP/04683/2020). Filippe L. M. Santos was supported by FCT through the Ph.D. grant (Ref. 2022.11960.BD).

Data Availability Statement

The raw data supporting the conclusions of this article will be made available by the authors upon request.

Acknowledgments

The authors are grateful to the European Centre for Medium-Range Weather Forecasts (ECMWF) for the provided meteorological analysis, the Instituto Nacional de Meteorologia (INMET) for providing weather station data, the Instituto Nacional de Pesquisas Espaciais—INPE (BDQueimadas), and the Google Earth Engine platform for the satellite dataset.

Conflicts of Interest

The authors declare no conflicts of interest.

Abbreviations

AFNActive fire number
ECMWFEuropean Centre for Medium-Range Weather Forecasts
FIRMSFire Information for Resource Management System
GOESGeostationary operational environmental satellites
HWSDHarmonized World Soil Database
ICONIcosahedral non-hydrostatic model framework
INMETInstituto Nacional de Meteorologia
INPEInstituto Nacional de Pesquisas Espaciais
LANCELand, Atmosphere Near real-time Capability for EOS
MEMean error
Meso-NHMesoscale non-hydrostatic model
MODISModerate resolution imaging spectrometer
NASANational Aeronautics and Space Administration (U.S.A)
NOAANational Oceanic and Atmospheric Administration (U.S.A.)
RMSERoot mean squared error
RRTMRapid radiative transfer model
SRTMShuttle Radar Topography Mission
Suomi-NPPSuomi National Polar-orbiting Partnership
VIIRSVisible infrared imaging radiometer suite
WRFWeather research and forecasting model

References

  1. Bowman, D.M.J.S.; Kolden, C.A.; Abatzoglou, J.T.; Johnston, F.H.; van der Werf, G.R.; Flannigan, M. Vegetation fires in the Anthropocene. Nat. Rev. Earth Environ. 2020, 1, 500–515. [Google Scholar] [CrossRef]
  2. Dowdy, A.J. Climatological Variability of Fire Weather in Australia. J. Appl. Meteorol. Clim. 2018, 57, 221–234. [Google Scholar] [CrossRef]
  3. Brewer, M.J.; Clements, C.B. The 2018 Camp Fire: Meteorological Analysis Using In Situ Observations and Numerical Simulations. Atmosphere 2020, 11, 47. [Google Scholar] [CrossRef]
  4. Couto, F.T.; Santos, F.L.M.; Campos, C.; Andrade, N.; Purificação, C.; Salgado, R. Is Portugal Starting to Burn All Year Long? The Transboundary Fire in January 2022. Atmosphere 2022, 13, 1677. [Google Scholar] [CrossRef]
  5. Pott, A.; Pott, V.J. Features and conservation of the Brazilian Pantanal wetland. Wetl. Ecol. Manag. 2004, 12, 547–552. [Google Scholar] [CrossRef]
  6. Boin, M.N.; Martins, P.C.S.; da Silva, C.A.; Salgado, A.A.R. Pantanal: The Brazilian Wetlands. In The Physical Geography of Brazil. Geography of the Physical Environment; Salgado, A., Santos, L., Paisani, J., Eds.; Springer: Cham, Switzerland, 2019; pp. 75–91. [Google Scholar] [CrossRef]
  7. UNESCO. 2024. Available online: https://whc.unesco.org/en/list/999/ (accessed on 31 July 2024).
  8. Tomas, W.M.; Berlinck, C.N.; Chiaravalloti, R.M.; Faggioni, G.P.; Strüssmann, C.; Libonati, R.; Abrahão, C.R.; Alvarenga, G.D.V.; Bacellar, A.E.d.F.; Batista, F.R.d.Q.; et al. Distance sampling surveys reveal 17 million vertebrates directly killed by the 2020’s wildfires in the Pantanal, Brazil. Sci. Rep. 2021, 11, 23547. [Google Scholar] [CrossRef]
  9. Mataveli, G.A.V.; Pereira, G.; de Oliveira, G.; Seixas, H.T.; Cardozo, F.d.S.; Shimabukuro, Y.E.; Kawakubo, F.S.; Brunsell, N.A. 2020 Pantanal’s widespread fire: Short- and long-term implications for biodiversity and conservation. Biodivers. Conserv. 2021, 30, 3299–3303. [Google Scholar] [CrossRef]
  10. De Barros, A.E.; Morato, R.G.; Fleming, C.H.; Pardini, R.; Oliveira-Santos, L.G.R.; Tomas, W.M.; Kantek, D.L.Z.; Tortato, F.R.; Fragoso, C.E.; Azevedo, F.C.C.; et al. Wildfires disproportionately affected jaguars in the Pantanal. Commun. Biol. 2022, 5, 1028. [Google Scholar] [CrossRef]
  11. Silva, P.S.; Rodrigues, J.A.; Nogueira, J.; Moura, L.C.; Enout, A.; Cuiabália, C.; DaCamara, C.C.; Pereira, A.A.; Libonati, R. Joining forces to fight wildfires: Science and management in a protected area of Pantanal, Brazil. Environ. Sci. Policy 2024, 159, 103818. [Google Scholar] [CrossRef]
  12. Kim, M.-K.; Jakus, P.M. Wildfire, national park visitation, and changes in regional economic activity. J. Outdoor Recreat. Tour. 2019, 26, 34–42. [Google Scholar] [CrossRef]
  13. Andrade, N.; Couto, F.T.; Serra, J. Assessing Fire Risk Perception in the Vale do Guadiana Natural Park, Portugal. Fire 2023, 6, 243. [Google Scholar] [CrossRef]
  14. Carrillo, J.; Pérez, J.C.; Expósito, F.J.; Díaz, J.P.; González, A. Projections of wildfire weather danger in the Canary Islands. Sci. Rep. 2022, 12, 8093. [Google Scholar] [CrossRef] [PubMed]
  15. Thapa, B.; Cahyanto, I.; Holland, S.M.; Absher, J.D. Wildfires and tourist behaviors in Florida. Tour. Manag. 2013, 36, 284–292. [Google Scholar] [CrossRef]
  16. Silva, F.R.D.; Câmara, S.F.; Pinto, F.R.; Costa, F.J.D.; Freitas, L.M.D.; Oliveira Júnior, J.G.C.D.; De Paula, T.M.; Soares, M.O. Machine learning application to assess deforestation and wildfire levels in protected areas with tourism management. J. Nat. Conserv. 2023, 74, 126435. [Google Scholar] [CrossRef]
  17. Libonati, R.; Geirinhas, J.L.; Silva, P.S.; Russo, A.; Rodrigues, J.A.; Belém, L.B.C.; Nogueira, J.; Roque, F.O.; DaCamara, C.C.; Nunes, A.M.B.; et al. Assessing the role of compound drought and heatwave events on unprecedented 2020 wildfires in the Pantanal. Environ. Res. Lett. 2022, 17, 015005. [Google Scholar] [CrossRef]
  18. Teodoro, P.E.; Maria, L.d.S.; Rodrigues, J.M.A.; Silva, A.d.A.e.; Silva, M.C.M.d.; Souza, S.S.d.; Rossi, F.S.; Teodoro, L.P.R.; Della-Silva, J.L.; Delgado, R.C.; et al. Wildfire Incidence throughout the Brazilian Pantanal Is Driven by Local Climate Rather Than Bovine Stocking Density. Sustainability 2022, 14, 10187. [Google Scholar] [CrossRef]
  19. Pelissari, T.D.; Teodoro, P.E.; Teodoro, L.P.R.; Lima, M.; Santana, D.C.; Rossi, F.S.; dos Santos, D.H.; Silva, R.D.A.; Lourençoni, T.; Junior, C.A.d.S. Dynamics of major environmental disasters involving fire in the Brazilian Pantanal. Sci. Rep. 2023, 13, 21669. [Google Scholar] [CrossRef]
  20. Sharples, J.J. An overview of mountain meteorological effects relevant to fire behaviour and bushfire risk. Int. J. Wildland Fire 2009, 18, 737–754. [Google Scholar] [CrossRef]
  21. Kartsios, S.; Karacostas, T.; Pytharoulis, I.; Dimitrakopoulos, A.P. Numerical investigation of atmosphere-fire interactions during high-impact wildland fire events in Greece. Atmos. Res. 2021, 247, 105253. [Google Scholar] [CrossRef]
  22. Čavlina Tomašević, I.; Cheung, K.K.W.; Vučetić, V.; Fox-Hughes, P.; Horvath, K.; Telišman Prtenjak, M.; Beggs, P.J.; Malečić, B.; Milić, V. The 2017 Split wildfire in Croatia: Evolution and the role of meteorological conditions. Nat. Hazards Earth Syst. Sci. 2022, 22, 3143–3165. [Google Scholar] [CrossRef]
  23. Čavlina Tomašević, I.; Vučetić, V.; Cheung, K.K.W.; Fox-Hughes, P.; Beggs, P.J.; Telišman Prtenjak, M.; Malečić, B. Comparison of Meteorological Drivers of Two Large Coastal Slope-Land Wildfire Events in Croatia and South-East Australia. Atmosphere 2023, 14, 1076. [Google Scholar] [CrossRef]
  24. Peace, M.; Ye, H.; Greenslade, J.; Kepert, J.D. The Destructive Sir Ivan Fire in New South Wales, Australia; Simulations Using a Coupled Fire—Atmosphere Model. Fire 2023, 6, 438. [Google Scholar] [CrossRef]
  25. Fromm, M.; Lindsey, D.T.; Servranckx, R.; Yue, G.; Trickl, T.; Sica, R.; Doucet, P.; Godin-Beekmann, S. The Untold Story of Pyrocumulonimbus. Bull. Am. Meteorol. Soc. 2010, 91, 1193–1210. [Google Scholar] [CrossRef]
  26. McRae, R.H.D.; Sharples, J.J.; Fromm, M. Linking local wildfire dynamics to pyroCb development. Nat. Hazards Earth Syst. Sci. 2015, 15, 417–428. [Google Scholar] [CrossRef]
  27. Sharples, J.J.; Hilton, J.E. Modeling vorticity-driven wildfire behavior using near-field techniques. Front. Mech. Eng. 2020, 5, 69. [Google Scholar] [CrossRef]
  28. Lareau, N.P.; Nauslar, N.J.; Bentley, E.; Roberts, M.; Emmerson, S.; Brong, B.; Mehle, M.; Wallman, J. Fire-Generated Tornadic Vortices. Bull. Am. Meteorol. Soc. 2022, 103, E1296–E1320. [Google Scholar] [CrossRef]
  29. Abatzoglou, J.T.; Barbero, R.; Nauslar, N.J. Diagnosing Santa Ana Winds in Southern California with Synoptic-Scale Analysis. Weather Forecast. 2013, 28, 704–710. [Google Scholar] [CrossRef]
  30. Coen, J.L.; Schroeder, W. The High Park fire: Coupled weather-wildland fire model simulation of a windstorm-driven wildfire in Colorado’s Front Range. J. Geophys. Res. Atmos. 2015, 120, 131–146. [Google Scholar] [CrossRef]
  31. Coen, J.L.; Schroeder, W.; Quayle, B. The Generation and Forecast of Extreme Winds during the Origin and Progression of the 2017 Tubbs Fire. Atmosphere 2018, 9, 462. [Google Scholar] [CrossRef]
  32. Couto, F.T.; Salgado, R.; Guiomar, N. Forest Fires in Madeira Island and the Fire Weather Created by Orographic Effects. Atmosphere 2021, 12, 827. [Google Scholar] [CrossRef]
  33. Purificação, C.; Campos, C.; Henkes, A.; Couto, F.T. Exploring the atmospheric conditions increasing fire danger in the Iberian Peninsula. Q. J. R. Meteorol. Soc. 2024, 150, 3475–3494. [Google Scholar] [CrossRef]
  34. Lac, C.; Chaboureau, J.P.; Masson, V.; Pinty, J.P.; Tulet, P.; Escobar, J.; Leriche, M.; Barthe, C.; Aouizerats, B.; Augros, C.; et al. Overview of the Meso-NH model version 5.4 and its applications. Geosci. Model Dev. 2018, 11, 1929–1969. [Google Scholar] [CrossRef]
  35. Purificação, C.; Andrade, N.; Potes, M.; Salgueiro, V.; Couto, F.T.; Salgado, R. Modelling the Atmospheric Environment Associated with a Wind-Driven Fire Event in Portugal. Atmosphere 2022, 13, 1124. [Google Scholar] [CrossRef]
  36. Couto, F.T.; Iakunin, M.; Salgado, R.; Pinto, P.; Viegas, T.; Pinty, J.-P. Lightning modelling for the research of forest fire ignition in Portugal. Atmos. Res. 2020, 242, 104993. [Google Scholar] [CrossRef]
  37. Campos, C.; Couto, F.T.; Filippi, J.-B.; Baggio, R.; Salgado, R. Modelling pyro-convection phenomenon during a mega-fire event in Portugal. Atmos. Res. 2023, 290, 106776. [Google Scholar] [CrossRef]
  38. Couto, F.T.; Filippi, J.-B.; Baggio, R.; Campos, C.; Salgado, R. Triggering Pyro-Convection in a High-Resolution Coupled Fire–Atmosphere Simulation. Fire 2024, 7, 92. [Google Scholar] [CrossRef]
  39. Couto, F.T.; Filippi, J.-B.; Baggio, R.; Campos, C.; Salgado, R. Numerical investigation of the Pedrógão Grande pyrocumulonimbus using a fire to atmosphere coupled model. Atmos. Res. 2024, 299, 107223. [Google Scholar] [CrossRef]
  40. Silva, J.S.V.; Abdon, M.M. Delimitação do Pantanal Brasileiro e suas sub-regiões. Pesqui. Agropecuária Bras. 1998, 33, 1703–1711. [Google Scholar]
  41. Sentinel-2. 2024. Available online: https://www.arcgis.com/home/item.html?id=cfcb7609de5f478eb7666240902d4d3d (accessed on 12 September 2024).
  42. MODIS-Aqua. 2024. Available online: https://aqua.nasa.gov/modis (accessed on 12 September 2024).
  43. Gorelick, N.; Hancher, M.; Dixon, M.; Ilyushchenko, S.; Thau, D.; Moore, R. Google Earth Engine: Planetary-scale geospatial analysis for everyone. Remote Sens. Environ. 2017, 202, 18–27. [Google Scholar] [CrossRef]
  44. Earthdata. 2021. Available online: https://earthdata.nasa.gov/firms (accessed on 31 July 2024).
  45. INPE. BDQueimadas—Programa Queimadas. Available online: https://terrabrasilis.dpi.inpe.br/queimadas/bdqueimadas/ (accessed on 31 July 2024).
  46. INMET—Instituto Nacional de Meteorologia. Available online: https://portal.inmet.gov.br/ (accessed on 31 July 2024).
  47. Bechtold, P.; Bazile, E.; Guichard, F.; Mascart, P.; Richard, E. A mass flux convection scheme for regional and global models. Q. J. R. Meteor. Soc. 2001, 127, 869–886. [Google Scholar] [CrossRef]
  48. Pergaud, J.; Masson, V.; Malardel, S.; Couvreux, F. A Parameterization of Dry Thermals and Shallow Cumuli for Mesoscale Numerical Weather Prediction. Bound. Layer Meteorol. 2009, 132, 83–106. [Google Scholar] [CrossRef]
  49. Pinty, J.-P.; Jabouille, P. A mixed-phase cloud parameterization for use in mesoscale non-hydrostatic model: Simulations of a squall line and of orographic precipitation. In Proceedings of the Conference of Cloud Physics, Everett, WA, USA, 17–21 August 1998; pp. 217–220. [Google Scholar]
  50. Vié, B.; Pinty, J.-P.; Berthet, S.; Leriche, M. LIMA (v1.0): A quasi two-moment microphysical scheme driven by a multimodal population of cloud condensation and ice freezing nuclei. Geosci. Model Dev. 2016, 9, 567–586. [Google Scholar] [CrossRef]
  51. Barthe, C.; Molinié, G.; Pinty, J.-P. Description and first results of an explicit electrical scheme in a 3D cloud resolving model. Atmos. Res. 2005, 76, 95–113. [Google Scholar] [CrossRef]
  52. Barthe, C.; Chong, M.; Pinty, J.-P.; Bovalo, C.; Escobar, J. CELLS v1.0: Updated and parallelized version of an electrical scheme to simulate multiple electrified clouds and flashes over large domains. Geosci. Model Dev. 2012, 5, 167–184. [Google Scholar] [CrossRef]
  53. Cuxart, J.; Bougeault, P.; Redelsperger, J.L. A turbulence scheme allowing for mesoscale and large-eddy simulations. Q. J. R. Meteorol. Soc. 2000, 126, 1–30. [Google Scholar] [CrossRef]
  54. Masson, V.; Moigne, P.L.; Martin, E.; Faroux, S.; Alias, A.; Alkama, R.; Belamari, S.; Barbu, A.; Boone, A.; Bouyssel, F.; et al. The SURFEXv7.2 land and ocean surface platform for coupled or offline simulation of earth surface variables and fluxes. Geosci. Model Dev. 2013, 6, 929–960. [Google Scholar] [CrossRef]
  55. Masson, V.; Champeaux, J.L.; Chauvin, F.; Meriguet, C.; Lacaze, R. A Global Database of Land Surface Parameters at 1-km Resolution in Meteorological and Climate Models. J. Clim. 2003, 16, 1261–1282. [Google Scholar] [CrossRef]
  56. FAO/IIASA/ISRIC/ISS-CAS/JRC. Harmonized World Soil Database (Version 1.1). FAO, Rome, Italy and IIASA, Laxenburg, Austria. 2009. Available online: https://www.fao.org/3/aq361e/aq361e.pdf (accessed on 12 September 2024).
  57. SRTM database. Available online: https://bigdata.cgiar.org/srtm-90m-digital-elevation-database/ (accessed on 12 August 2024).
  58. Lang, S.; Schepers, D.; Rodwell, M. IFS Upgrade Brings Many Improvements and Unifies Medium-Range Resolutions. ECMWF Newsletter No. 176—Summer 2023. Available online: https://www.ecmwf.int/sites/default/files/elibrary/072023/81380-ifs-upgrade-brings-many-improvements-and-unifies-medium-range-resolutions.pdf (accessed on 12 September 2024). [CrossRef]
  59. Mlawer, E.J.; Taubman, S.J.; Brown, P.D.; Iacono, M.J.; Clough, S.A. Radiative transfer for inhomogeneous atmospheres: RRTM, a validated correlated-k model for the longwave. J. Geophys. Res. 1997, 102, 16663–16682. [Google Scholar] [CrossRef]
  60. Worldview. Available online: https://worldview.earthdata.nasa.gov/ (accessed on 31 July 2024).
  61. Xu, C.; Xiao, X. Comparison of Cold Pool Characteristics of Two Distinct Gust Fronts over Bohai Sea Bay in China. Atmosphere 2024, 15, 247. [Google Scholar] [CrossRef]
  62. Hoeller, J.; Haerter, J.O.; Da Silva, N.A. Characteristics of station-derived convective cold pools over equatorial Africa. Geophys. Res. Lett. 2024, 51, e2023GL107308. [Google Scholar] [CrossRef]
  63. Wang, H.; Chandrasekar, V.; He, J.; Shi, Z.; Wang, L. Characteristic Analysis of the Downburst in Greely, Colorado on 30 July 2017 Using WPEA Method and X-Band Radar Observations. Atmosphere 2018, 9, 348. [Google Scholar] [CrossRef]
  64. Parodi, A.; Lagasio, M.; Maugeri, M.; Turato, B.; Gallus, W. Observational and Modelling Study of a Major Downburst Event in Liguria: The 14 October 2016 Case. Atmosphere 2019, 10, 788. [Google Scholar] [CrossRef]
  65. Burlando, M.; Romanic, D.; Boni, G.; Lagasio, M.; Parodi, A. Investigation of the Weather Conditions During the Collapse of the Morandi Bridge in Genoa on 14 August 2018 Using Field Observations and WRF Model. Atmosphere 2020, 11, 724. [Google Scholar] [CrossRef]
  66. Abbasi, E.; Etemadi, H.; Smoak, J.M.; Rousta, I.; Olafsson, H.; Baranowski, P.; Krzyszczak, J. Investigation of Atmospheric Conditions Associated with a Storm Surge in the South-West of Iran. Atmosphere 2021, 12, 1429. [Google Scholar] [CrossRef]
  67. Yan, B.; Shen, R.; Ma, C.; Cheng, X.; Huang, G.; Yan, Z.; Li, X.; Zhang, Z. Numerical Study of the Flow Characteristics of Downburst-like Wind over the 3D Hill Using Different Turbulence Models. Appl. Sci. 2023, 13, 7098. [Google Scholar] [CrossRef]
  68. Markowski, P.; Richardson, Y. Mesoscale Meteorology in Midlatitudes; John Wiley and Sons: Hoboken, NJ, USA, 2010; 432p. [Google Scholar]
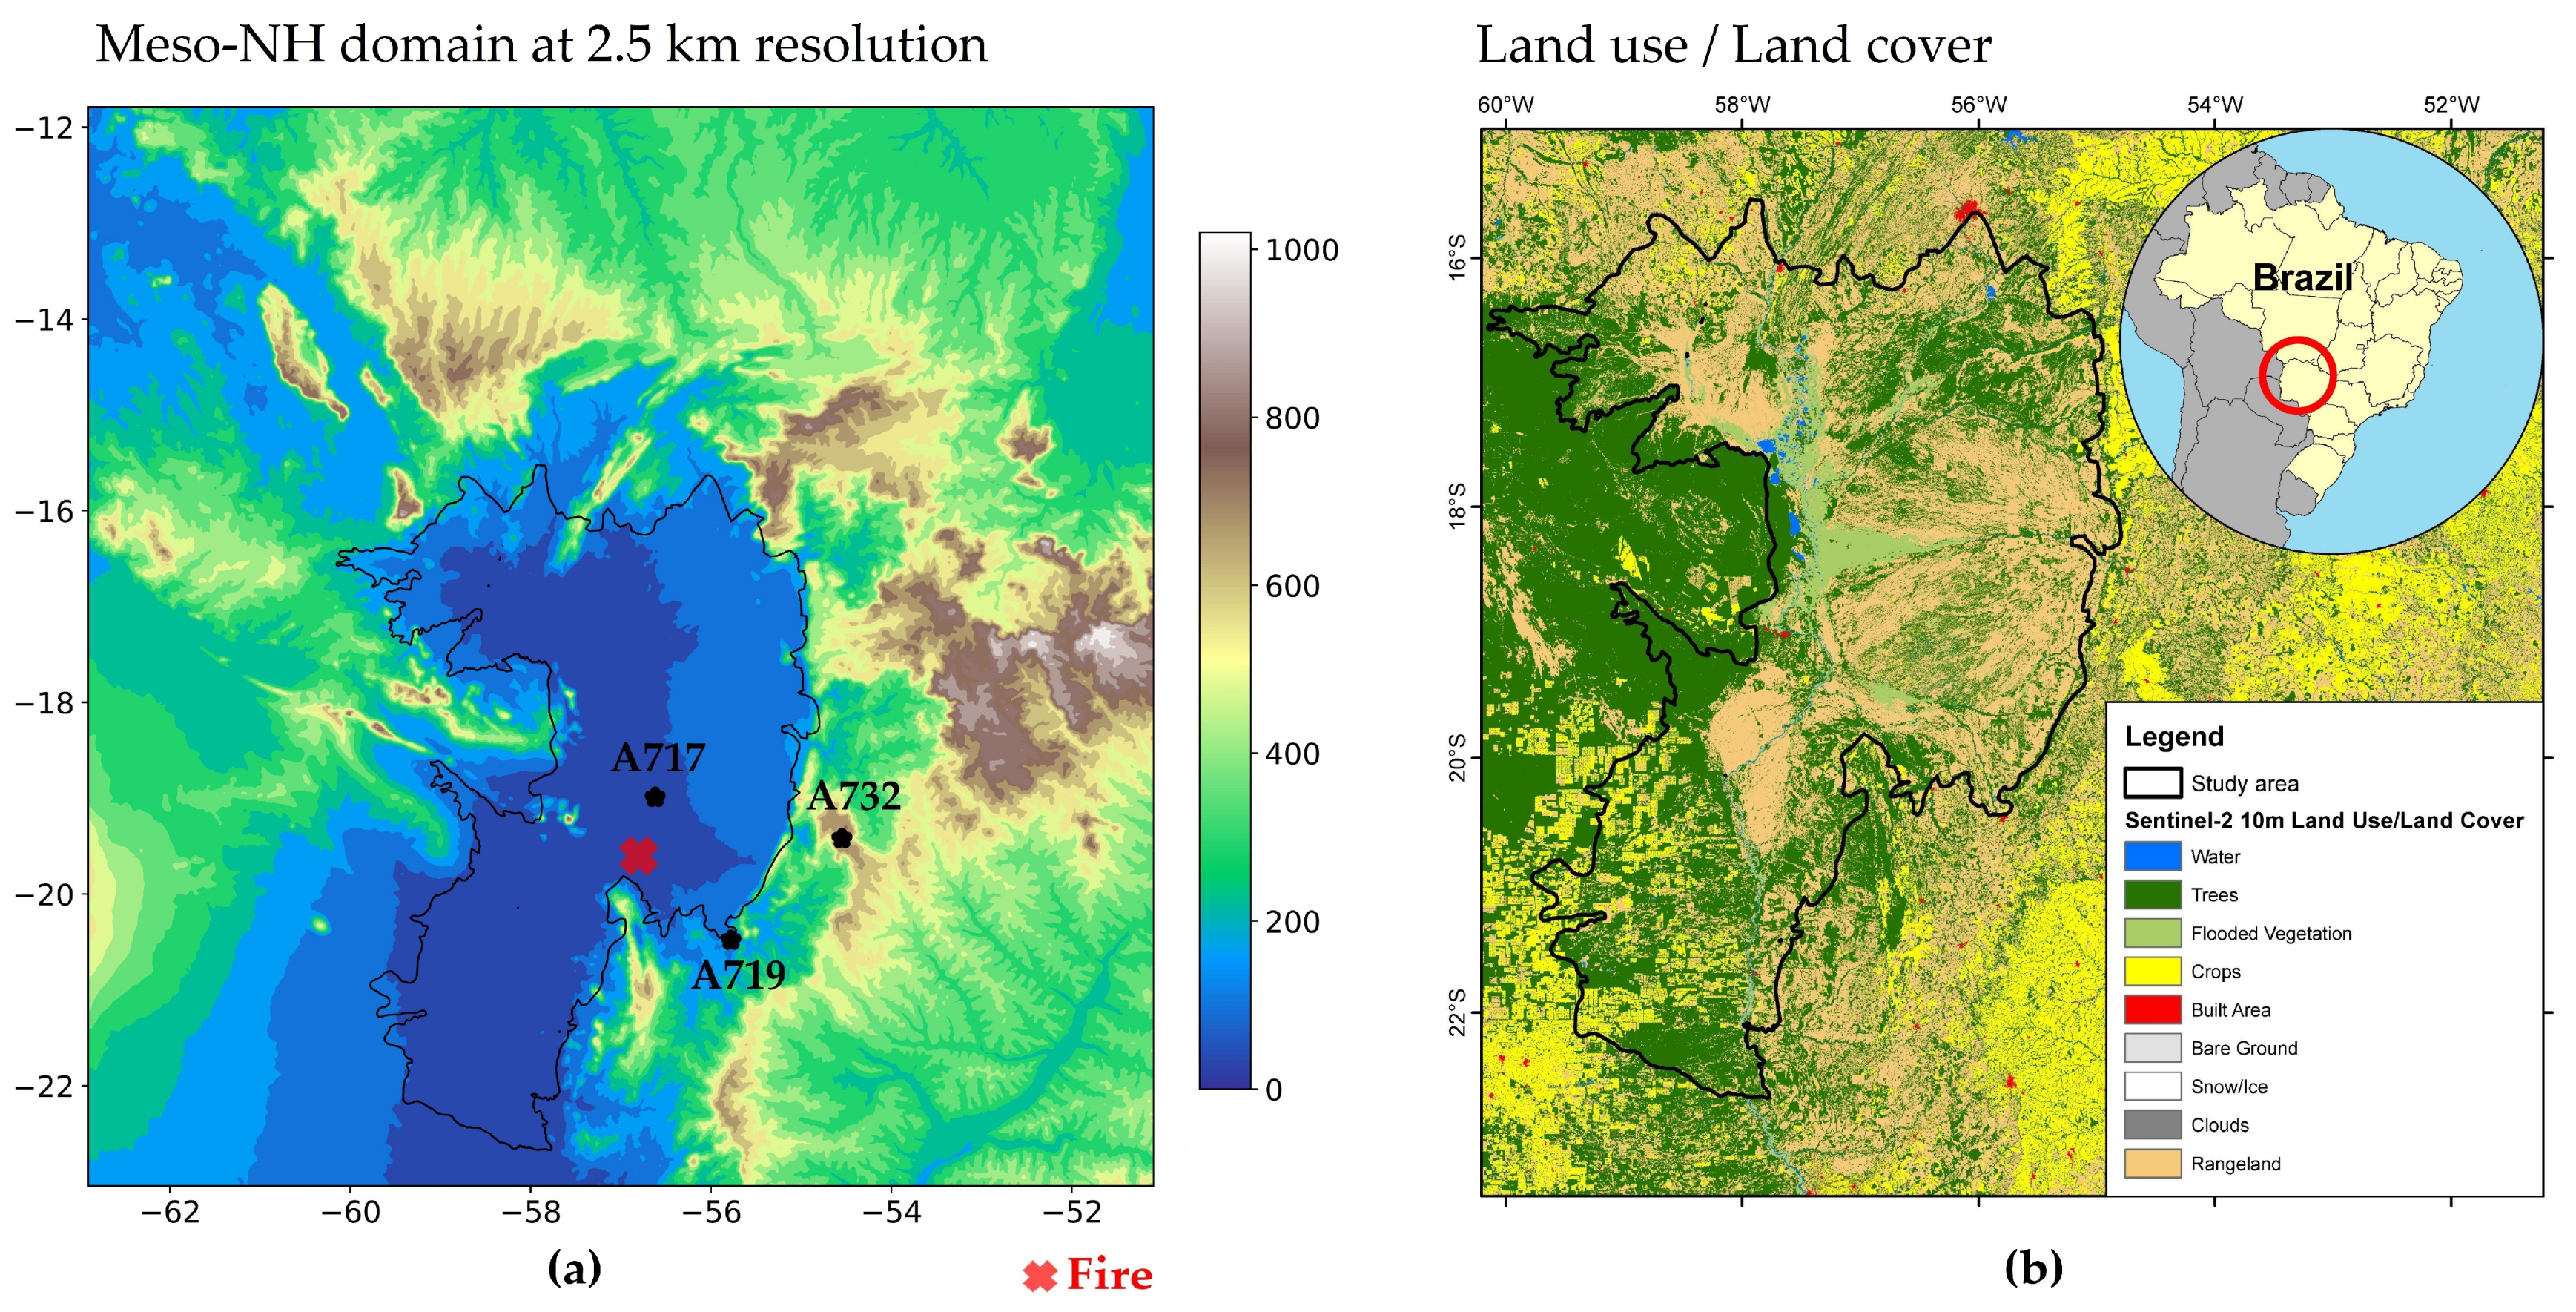
Figure 1. Study region: (a) model configuration covering the Pantanal wetland region representing EXP1 domain with 2.5 km horizontal resolution, with the orography data obtained from the Shuttle Radar Topography Mission (SRTM) database. The red “x” symbol indicates the fire location and black “stars” denote the weather stations; (b) Sentinel-2 10 m land use/land cover for 2023 produced by Impact Observatory and Esri [41].
Earth 05 00028 g001
Figure 2. Hourly active fire number (AFN) distribution between 0600 UTC on 12 November and 1800 UTC on 15 November 2023, from GOES-16 satellite. The blue dashed-line boxes, called PHASE I, PHASE II, and PHASE III represent the periods with the highest AFN values. Moreover, the green dashed-line box indicates the period simulated by the Meso-NH model.
Earth 05 00028 g002
Figure 3. (a) Spatial distribution of active fire number from NOAA-20 satellite between 12 and 15 November 2023; (b) MODIS corrected reflectance image on 12 November 2023 obtained from worldview on 12 November 2023 at 1800 UTC; source: [60].
Earth 05 00028 g003
Figure 4. Comparison between model (EXP1 and EXP2) and observation for the 72 h of simulation: (ac) air temperature at 2 m; (df) relative humidity at 2 m; (gi) wind gusts at 10 m.
Earth 05 00028 g004
Figure 5. Air temperature at 2 m (unit: °C) simulated at 2.5 km resolution [EXP1]: (a) 12 November 2023 at 1800 UTC, (b) 13 November 2023 at 1900 UTC, (c) 14 November 2023 at 1800 UTC. The black contour line represents the Pantanal international boundary.
Earth 05 00028 g005
Figure 6. Relative humidity at 2 m (unit: %) simulated with 2.5 km resolution [EXP1]: (a) 12 November 2023 at 1800 UTC, (b) 13 November 2023 at 1900 UTC, (c) 14 November 2023 at 1800 UTC. The black contour line represents the Pantanal international boundary.
Earth 05 00028 g006
Figure 7. Wind gusts (colored, unit: m.s−1) and wind direction at 10 m (arrows) simulated at 2.5 km resolution [EXP1] (ad) PHASE I; (eh) PHASE II; (il) PHASE III. The black contour line represents the Pantanal international boundary.
Earth 05 00028 g007
Figure 8. Wind gusts (colored areas, unit: m.s−1) and wind direction at 10 m (arrows) from EXP2 with 5 km resolution (a) PHASE I: 0000 UTC on 13 November 2023, (b) PHASE II: 2000 UTC on 13 November 2023, and (c) PHASE III: 2000 UTC on 14 November 2023.
Earth 05 00028 g008
Figure 9. Difference of wind gust at 10 m between EXP1 and EXP2: (a) PHASE I: 0000 UTC on 13 November 2023, (b) PHASE II: 2000 UTC on 13 November 2023, and (c) PHASE III: 2000 UTC on 14 November 2023.
Earth 05 00028 g009
Figure 10. Schematic diagram showing the PERIODS identified in the wind gusts field: (a) PERIOD I with weaker wind gusts over the Pantanal during the night and early morning; (b) PERIOD II presents moderate wind gusts; (c) PERIOD III represents the gust fronts, in particular propagating southward, as indicated from the notation time (t), t + 1 h and t + 2 h.
Earth 05 00028 g010
Disclaimer/Publisher’s Note: The statements, opinions and data contained in all publications are solely those of the individual author(s) and contributor(s) and not of MDPI and/or the editor(s). MDPI and/or the editor(s) disclaim responsibility for any injury to people or property resulting from any ideas, methods, instructions or products referred to in the content.