
Agro-Pastoral Expansion and Land Use/Land Cover Change Dynamics in Mato Grosso, Brazil


Abstract
:1. Introduction
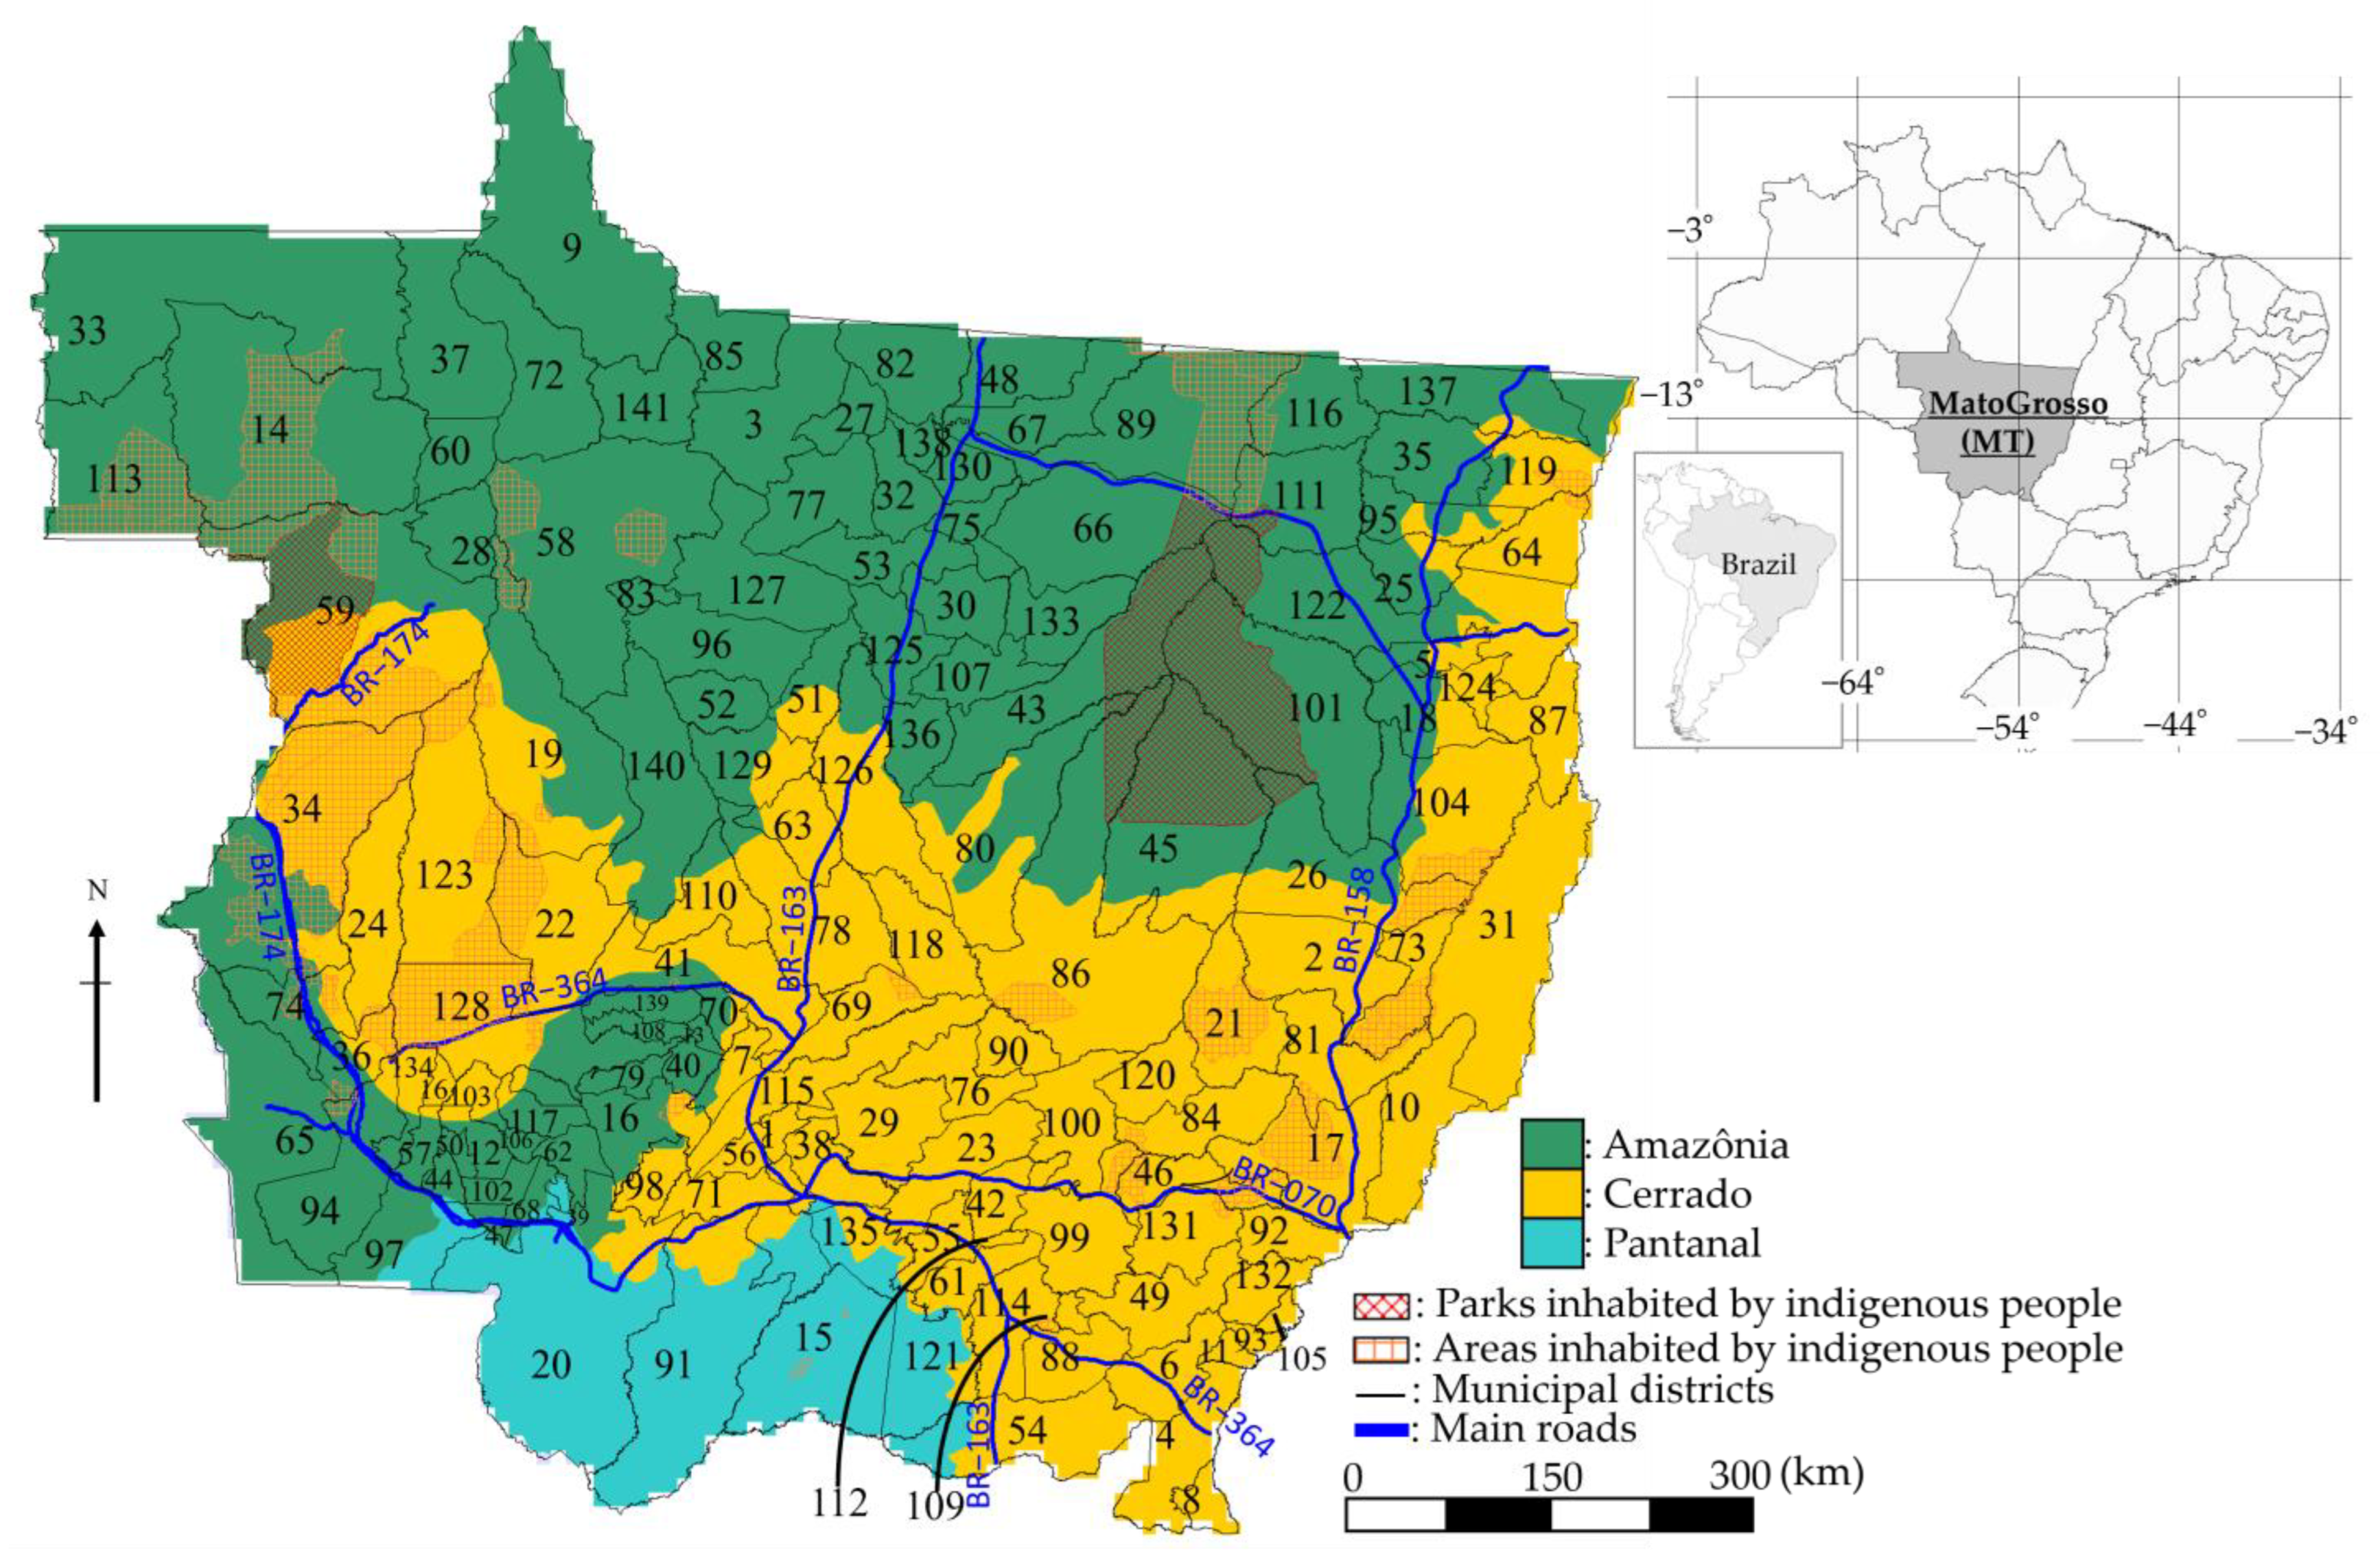
2. Study Site Description
3. Data Sources and Materials
3.1. 5-Year DVM Maps
3.2. SIDRA/IBGE Data
3.3. Export Data
4. Analysis Method
5. Results
5.1. Overall Vegetation Changes
5.2. Cattle Ranching
5.3. Cropland
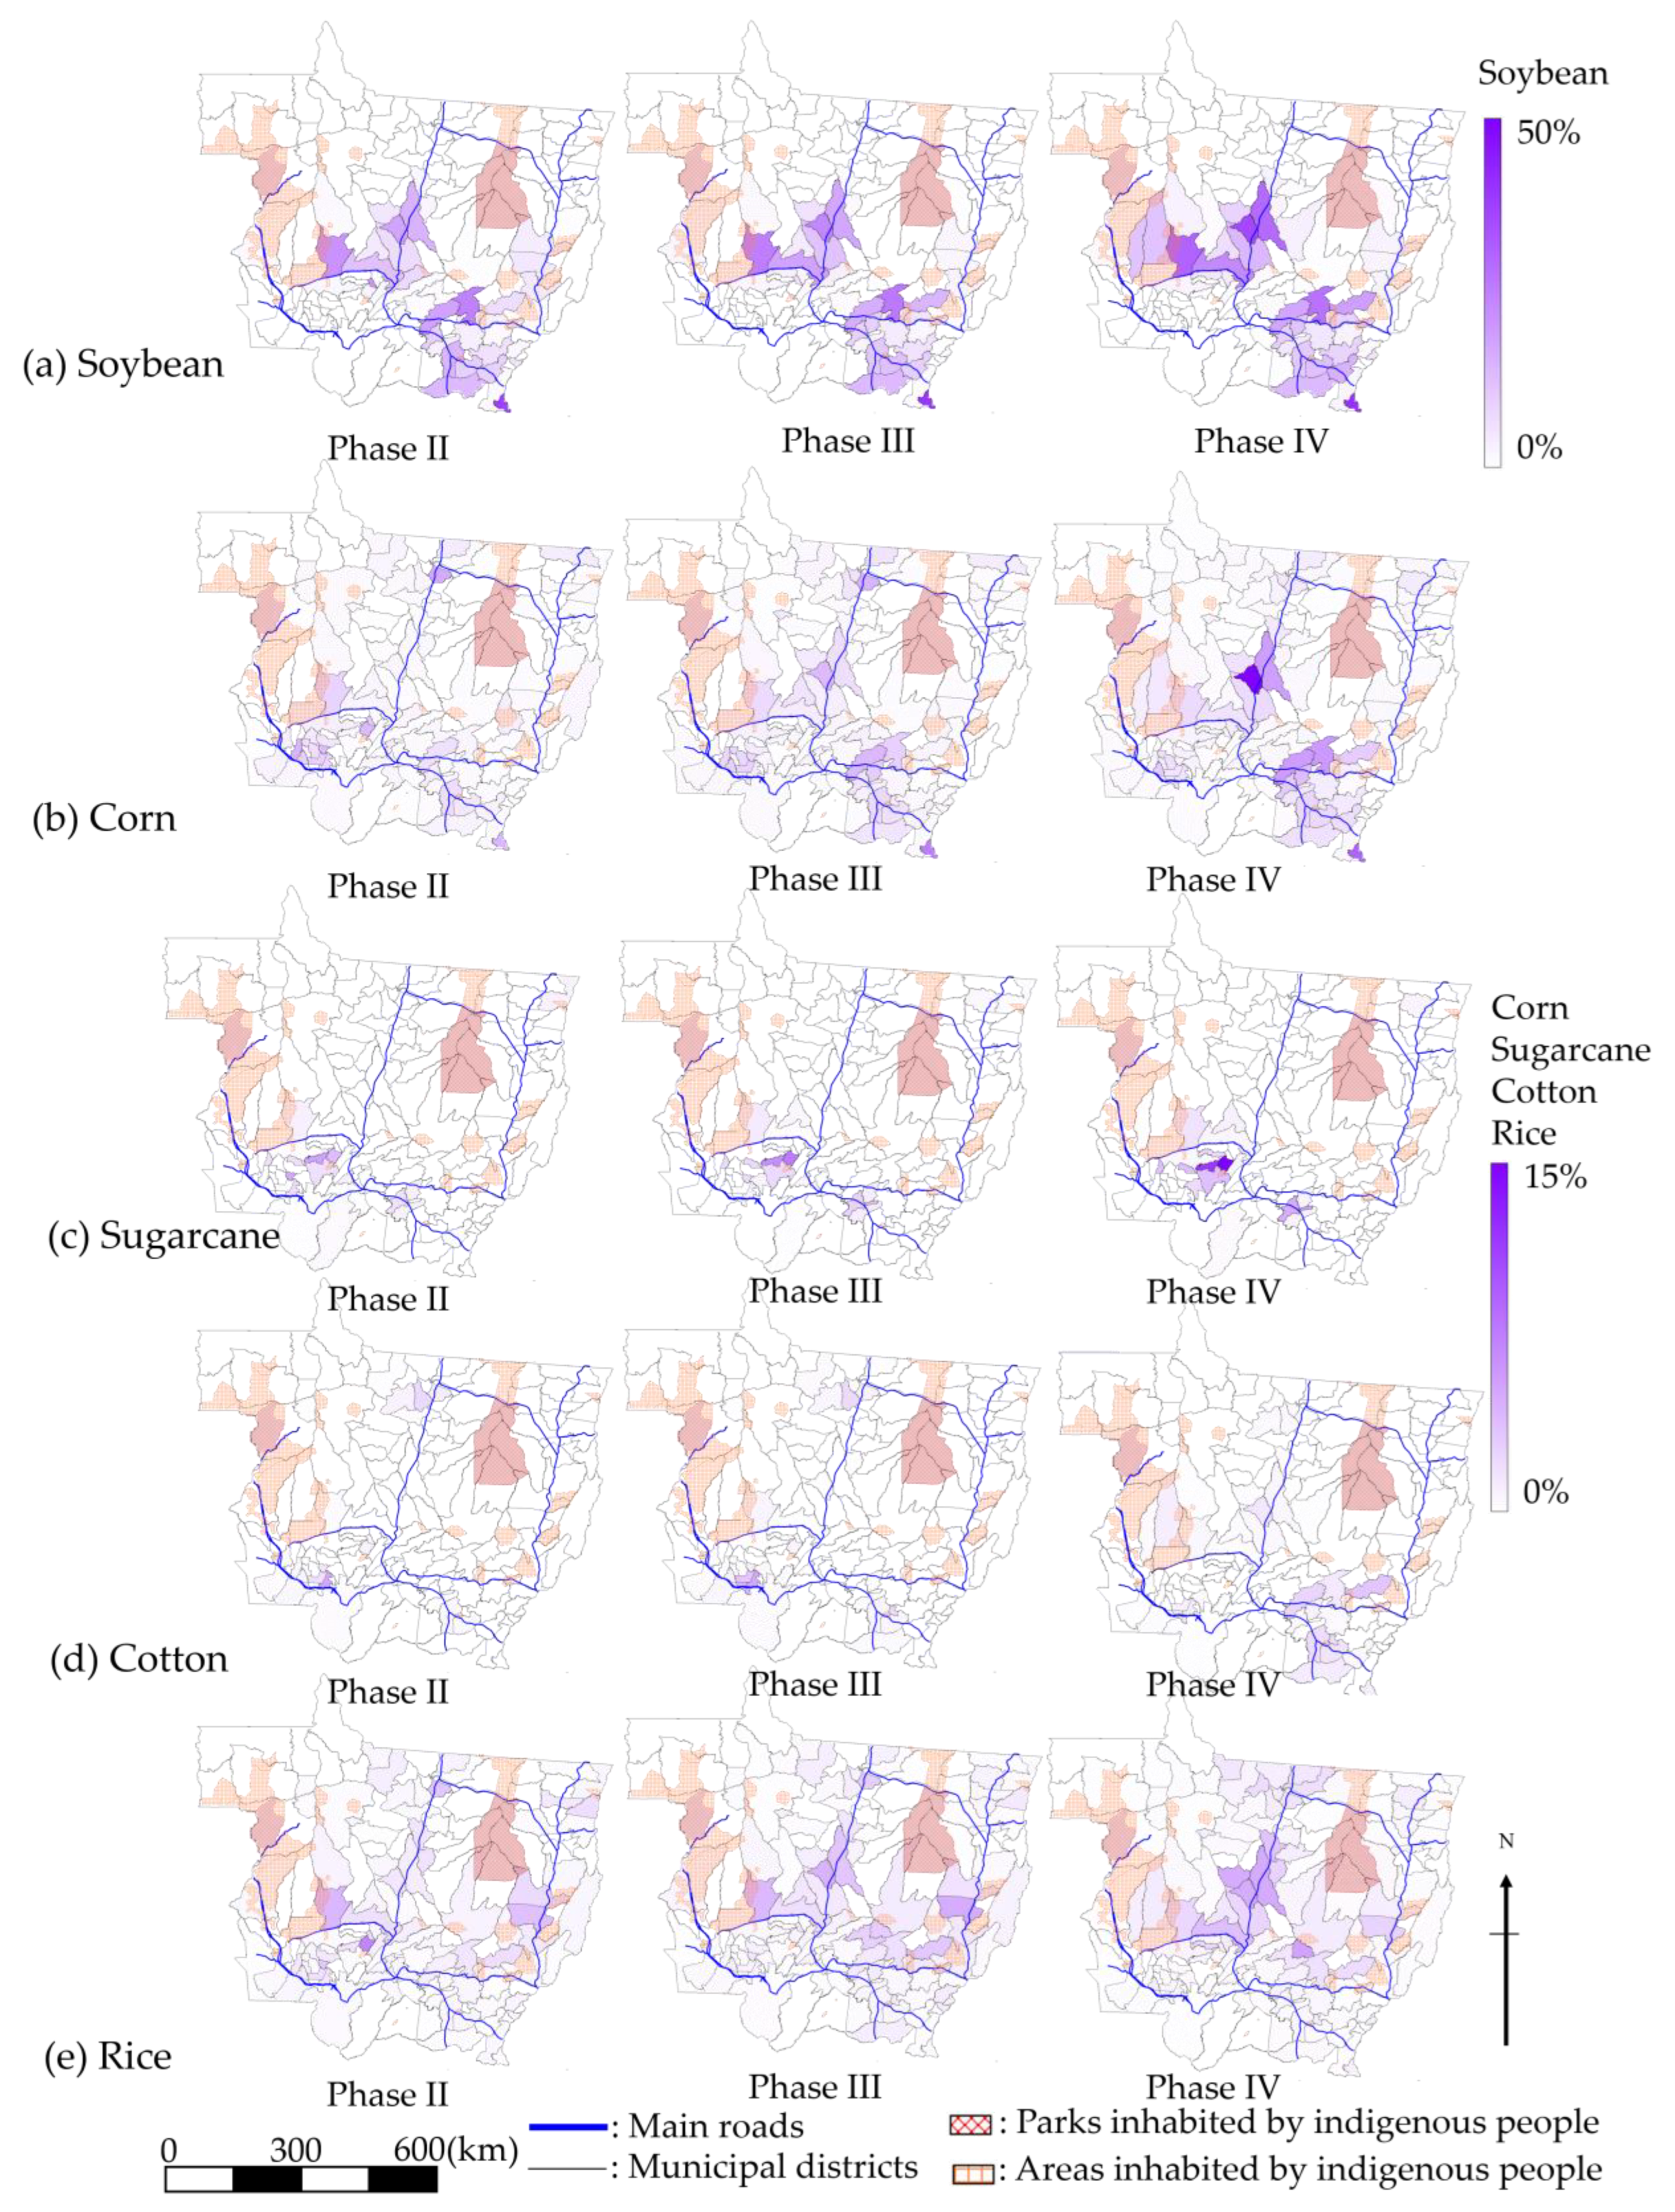
5.3.1. Soybean
5.3.2. Corn
5.3.3. Sugarcane
5.3.4. Cotton and Rice
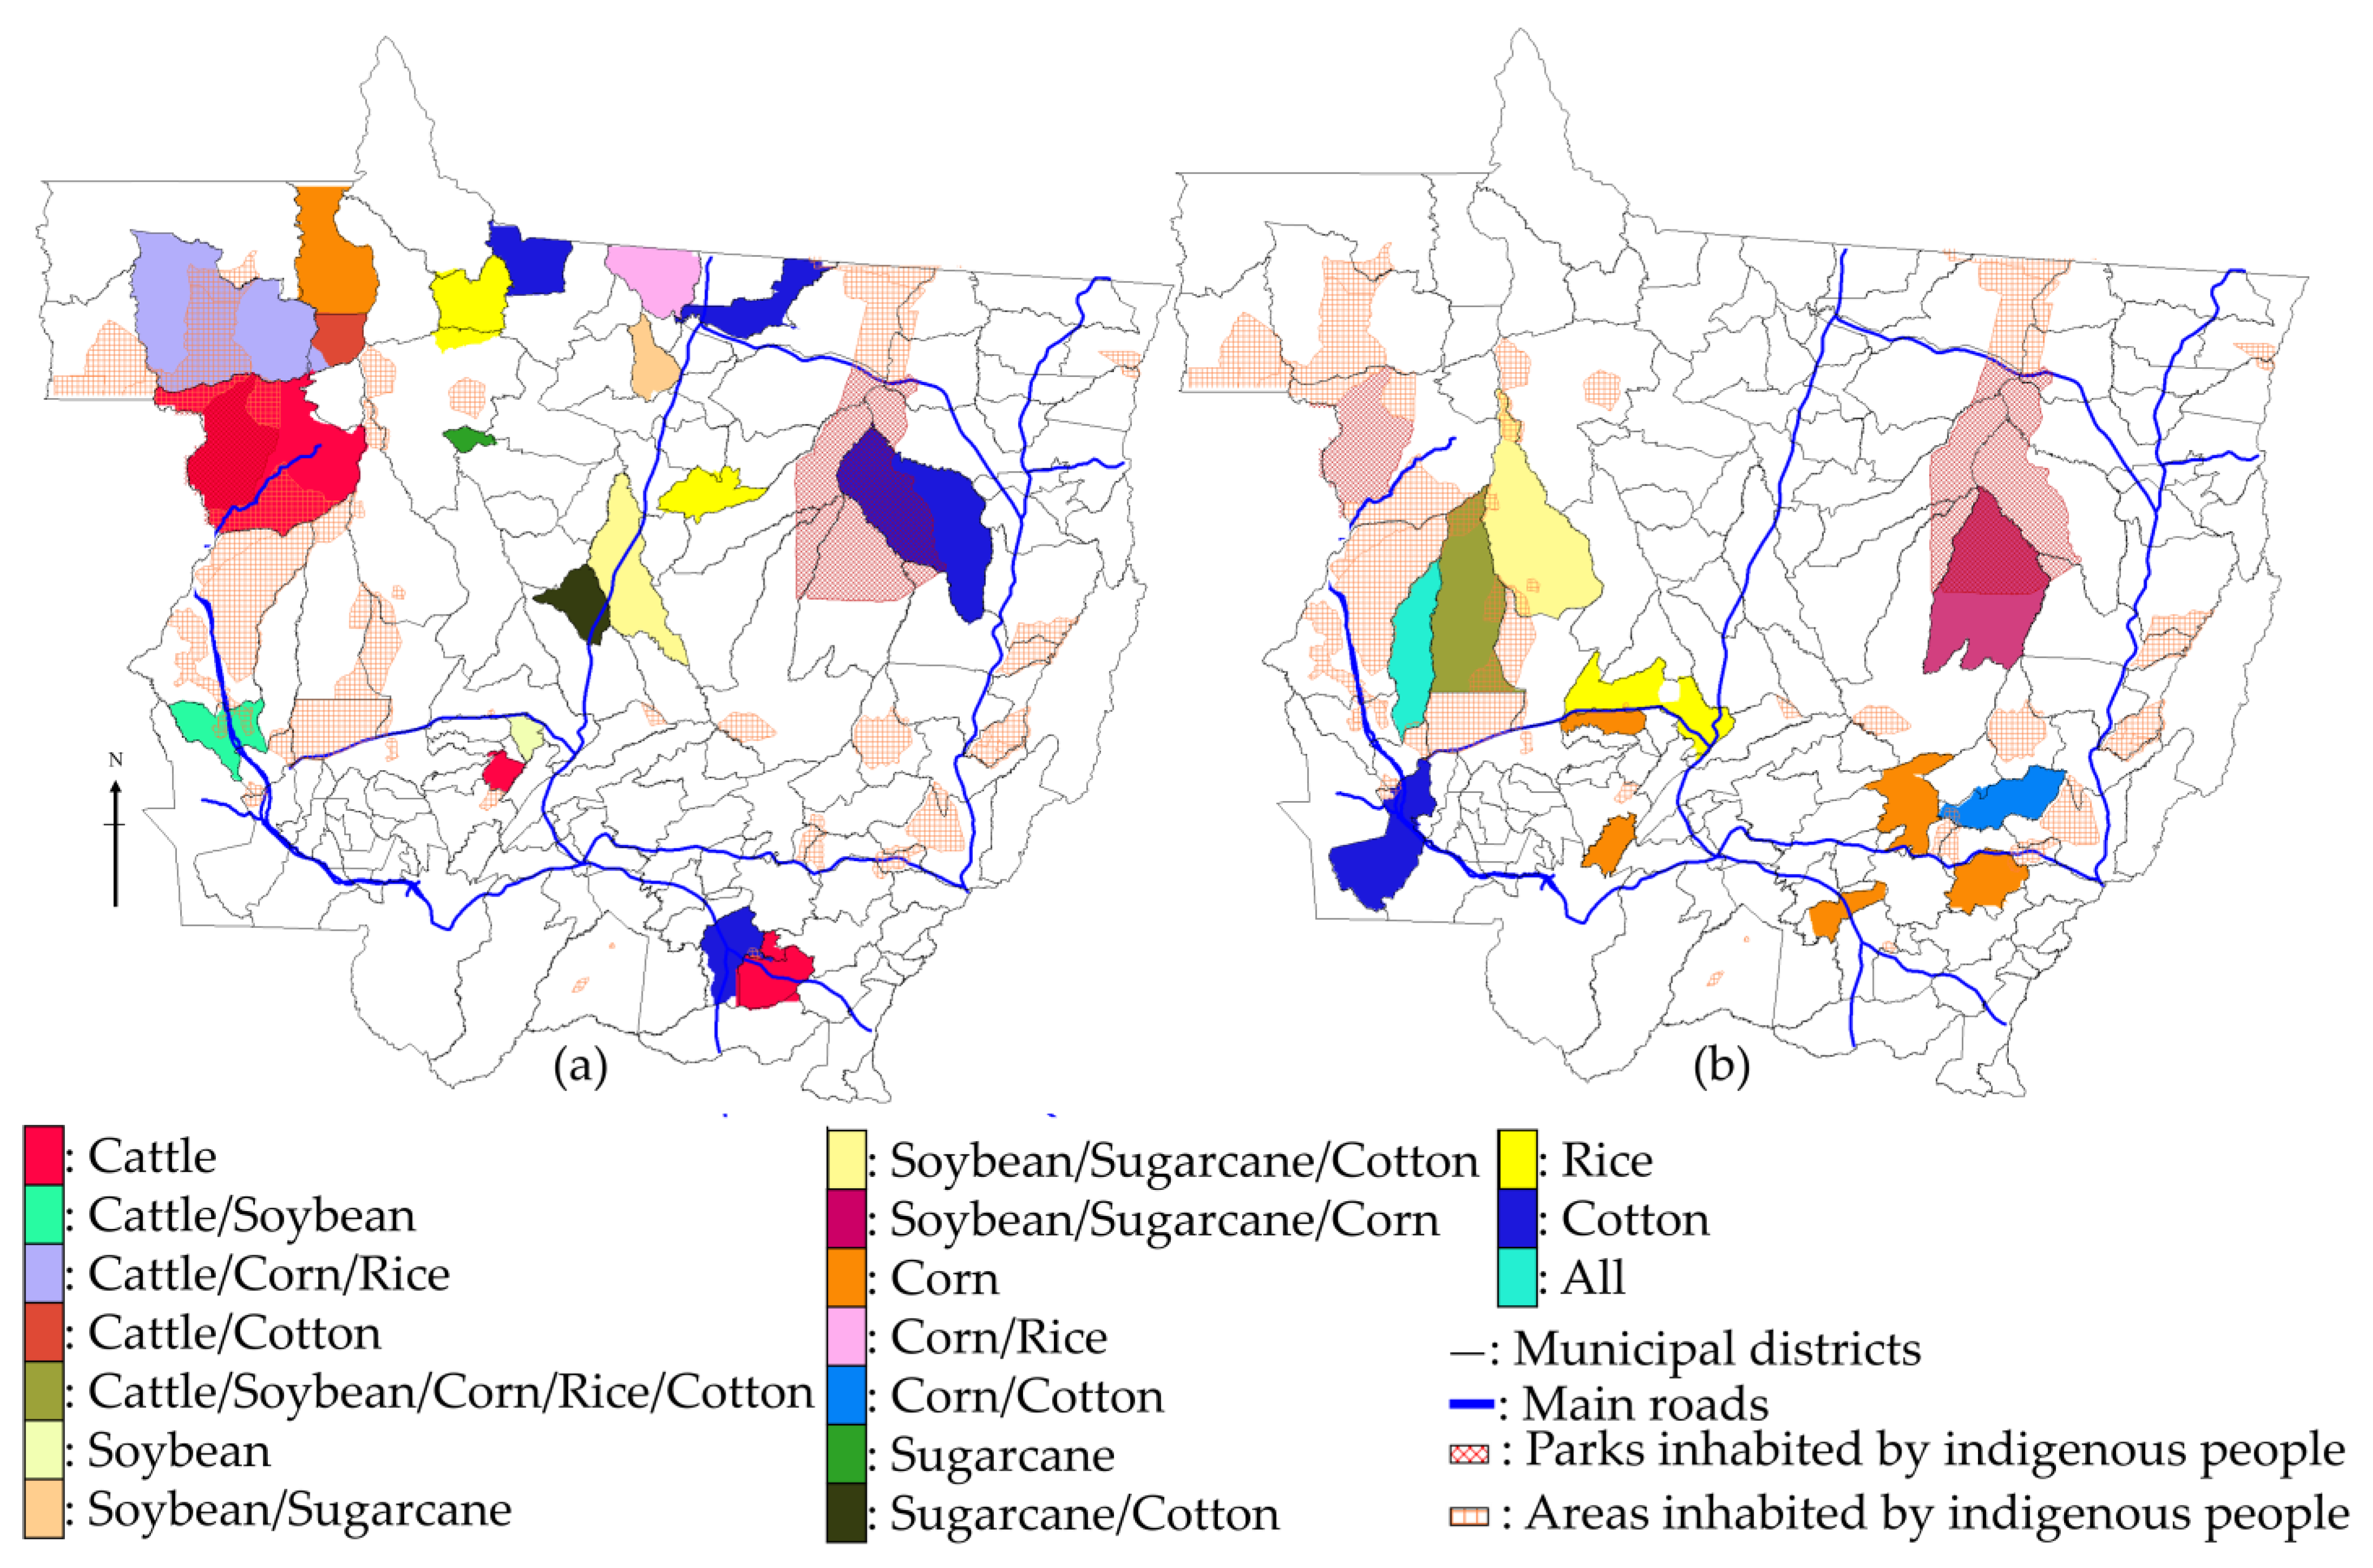
5.4. Land Use Change Patterns
5.5. Relevance to the Global Market
6. Discussion and Concluding Remarks
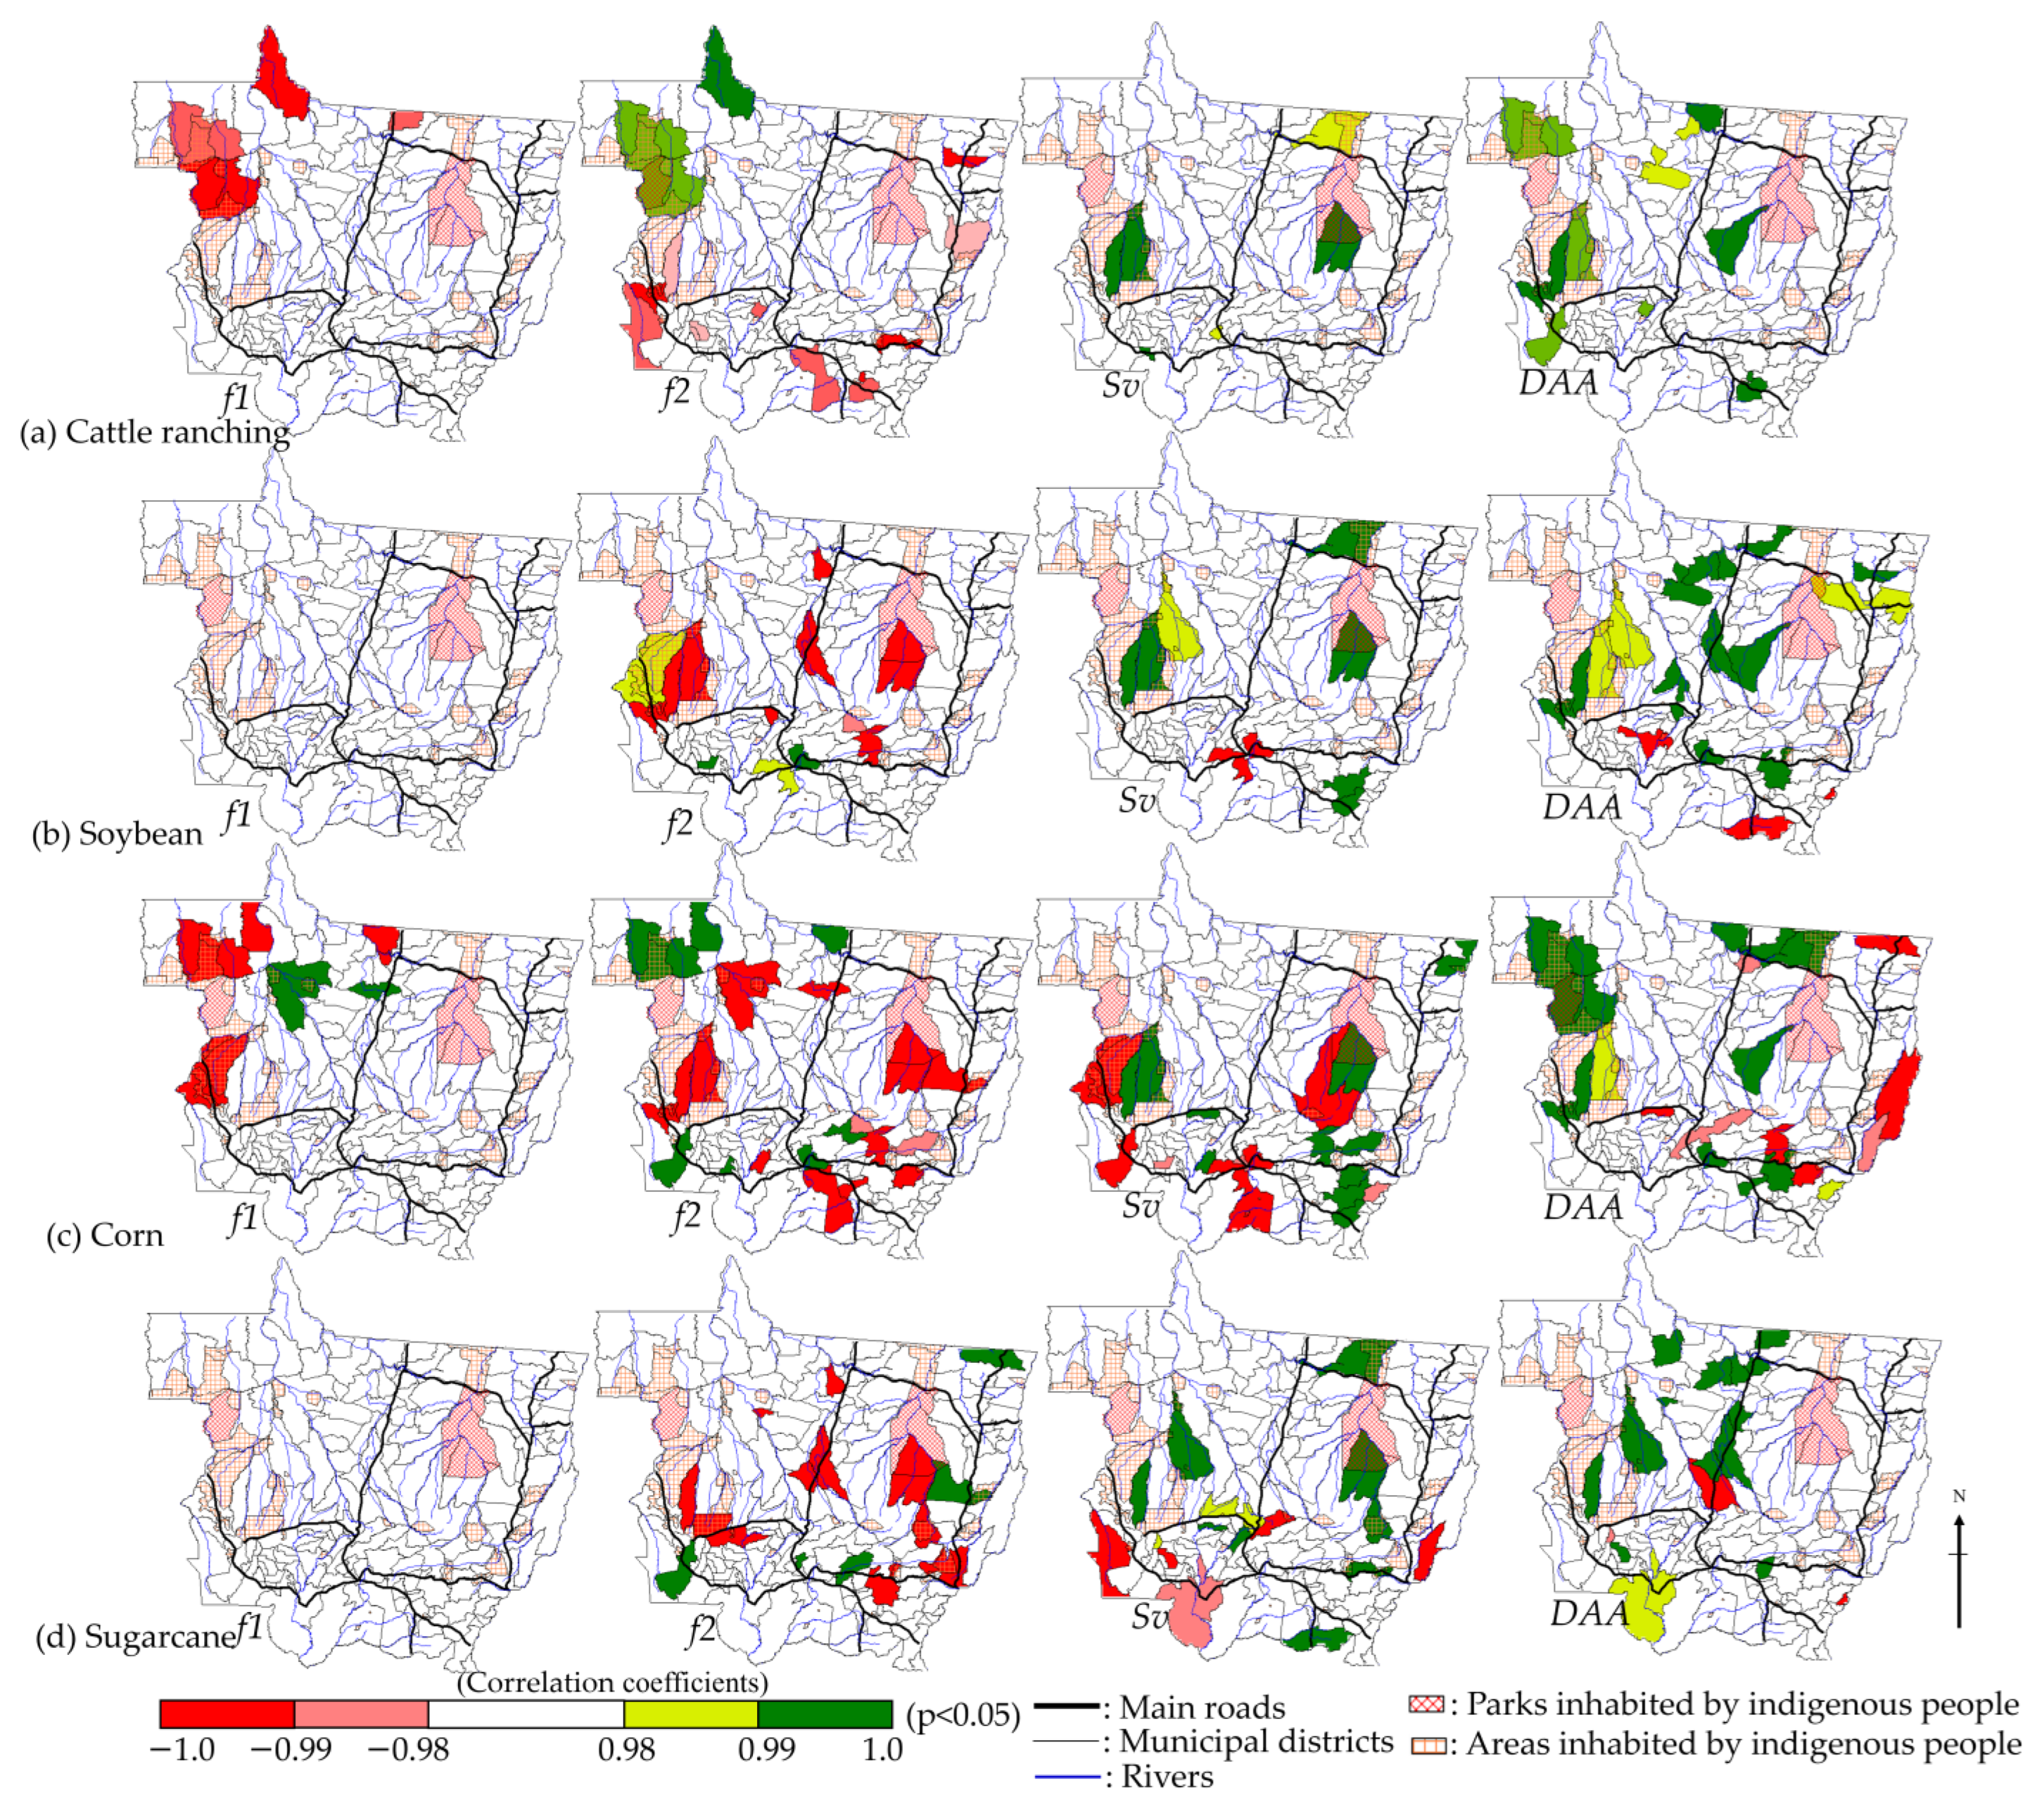
- In north and central MT, the f1 vegetation type has decreased wherever cattle ranching and corn, rice- and cotton-planted areas have increased. Similarly, the f2 vegetation type has decreased wherever soybean and sugarcane planting have increased. Therefore, it is clear that cattle ranching and corn cropping have large and direct associations with the deforestation of virgin forests f1. Soybean and sugarcane production affects the deforestation process through the cutting of f2 forests. These factors have a strong relationship with the steadily increasing amount of DAA over MT.
- Wherever areas of planted soybean, sugarcane, and corn have increased, the f2 and DAA vegetation types have decreased while Sv vegetation has increased, especially in south and west MT. In western MT, the main factors leading to an increase in the amount of DAA were the expansion of soybean, corn, sugarcane, rice and cotton areas. The increase in DAA along BR-364 is likely to have occurred due to the expansion of corn fields in this area.
7. Conclusions
Funding
Data Availability Statement
Acknowledgments
Conflicts of Interest
Appendix A

| No. | Name | Soybean | Corn | Sugarcane | Cotton | Rice | ||||||||||
|---|---|---|---|---|---|---|---|---|---|---|---|---|---|---|---|---|
| II | III | IV | II | III | IV | II | III | IV | II | III | IV | II | III | IV | ||
| 1 | Acorizal | 0 | 0 | 0 | 9.00 | 5.65 | 5.19 | 0.30 | 0.39 | 0.22 | 0 | 0 | 0 | 6.00 | 4.38 | 3.70 |
| 2 | Agua Boa | 350 | 142.84 | 166.04 | 25.00 | 25.60 | 33.33 | 0 | 0 | 0.20 | 0 | 0 | 0.02 | 282.00 | 370.77 | 197.34 |
| 3 | Alta Floresta | 0 | 0 | 0.80 | 52.50 | 61.98 | 21.00 | 0 | 0 | 0.47 | 6.00 | 30.38 | 3.70 | 84.00 | 93.40 | 70.20 |
| 4 | Alto Araguaia | 60 | 47.31 | 111.57 | 20 | 12.83 | 20.39 | 0 | 0 | 1.85 | 0 | 0 | 0 | 25.00 | 11.70 | 10.62 |
| 5 | Alto Boa Vista | 0 | 0 | 0 | 0 | 7.60 | 14.90 | 0 | 0 | 0 | 0 | 0 | 0 | 0 | 12.00 | 15.45 |
| 6 | Alto Garcas | 345.00 | 366.78 | 582.00 | 30 | 31.47 | 74.45 | 4.60 | 0.84 | 0.10 | 0 | 0.08 | 18.06 | 5.82 | 7.19 | 7.31 |
| 7 | Alto Paraguai | 25.00 | 18.34 | 18.83 | 5.60 | 4.07 | 5.55 | 1.50 | 1.02 | 13.58 | 0 | 0.02 | 0 | 18.00 | 14.98 | 7.10 |
| 8 | Alto Taquari | 540 | 567.14 | 587.18 | 60 | 110.99 | 133.38 | 0 | 0.04 | 0.03 | 0 | 0.04 | 13.71 | 2.00 | 5.27 | 12.40 |
| 9 | Apiacas | 0 | 0 | 0 | 6.50 | 7.71 | 14.60 | 0 | 0 | 0.10 | 0 | 0.01 | 0.32 | 6.00 | 5.68 | 12.00 |
| 10 | Araguaiana | 7.00 | 1.30 | 2.34 | 0.80 | 2.08 | 1.54 | 0.05 | 0.05 | 0 | 0 | 0 | 0 | 11.20 | 20.33 | 7.80 |
| 11 | Araguainha | 0 | 0 | 0 | 0.50 | 0.92 | 0.78 | 0 | 0.12 | 0 | 0 | 0 | 0 | 0.60 | 1.07 | 1.15 |
| 12 | Araputanga | 0 | 0 | 0 | 32.50 | 37.00 | 29.40 | 0.20 | 0.20 | 0.16 | 1.50 | 3.00 | 0.90 | 5.00 | 6.59 | 4.20 |
| 13 | Arenapolis | 85.00 | 23.30 | 4.49 | 12.00 | 2.62 | 2.33 | 0.20 | 0.08 | 0 | 0.80 | 0.60 | 0 | 9.00 | 5.50 | 4.46 |
| 14 | Aripuana | 0 | 0 | 0 | 12.00 | 12.40 | 28.39 | 1.50 | 2.10 | 2.10 | 0 | 0.94 | 0.40 | 10 | 11.24 | 28.90 |
| 15 | Barao de Melgaco | 0 | 0 | 0 | 7.00 | 5.53 | 4.80 | 0.50 | 0.58 | 0.40 | 0.31 | 0.13 | 0.02 | 5.00 | 4.03 | 2.79 |
| 16 | Barra do Bugres | 0 | 0.12 | 0 | 10 | 5.84 | 7.30 | 107.00 | 128.23 | 237.65 | 3.50 | 3.26 | 0.30 | 17.50 | 9.01 | 3.34 |
| 17 | Barra do Garcas | 75.50 | 44.91 | 19.12 | 8.00 | 4.46 | 6.17 | 0.25 | 0.26 | 0.50 | 0 | 0 | 0 | 34.20 | 80.07 | 16.39 |
| 18 | Bom Jesus do Araguaia | 0 | 0 | 0 | 0 | 0 | 0 | 0 | 0 | 0 | 0 | 0 | 0 | 0 | 0 | 0 |
| 19 | Brasnorte | 161.22 | 209.79 | 448.12 | 65.00 | 79.43 | 63.50 | 0 | 0 | 0.21 | 1.04 | 1.12 | 18.14 | 115.00 | 85.53 | 56.53 |
| 20 | Caceres | 1.00 | 1.03 | 0.31 | 84.84 | 75.37 | 56.00 | 27.94 | 9.33 | 4.06 | 42.17 | 63.50 | 15.20 | 89.23 | 50.57 | 27.70 |
| 21 | Campinapolis | 20 | 3.20 | 0.68 | 60 | 29.46 | 14.00 | 0.30 | 0.58 | 2.20 | 0 | 0 | 0 | 36.00 | 37.33 | 26.10 |
| 22 | Campo Novo do Parecis | 2008.00 | 2381.96 | 2901.14 | 246.90 | 199.42 | 200.74 | 84.50 | 116.15 | 172.83 | 20 | 57.06 | 47.99 | 400 | 394.39 | 225.14 |
| 23 | Campo Verde | 1018.20 | 910.27 | 984.98 | 101.00 | 235.38 | 327.49 | 0 | 0 | 1.27 | 0 | 0.83 | 141.05 | 53.00 | 74.00 | 45.82 |
| 24 | Campos de Julio | 0 | 0 | 787.37 | 0 | 0 | 68.62 | 0 | 0 | 7.39 | 0 | 0 | 16.50 | 0 | 0 | 70.96 |
| 25 | Canabrava do Norte | 0 | 0 | 0 | 0 | 10.20 | 17.96 | 0 | 0 | 0 | 0 | 0 | 0 | 0 | 19.50 | 17.80 |
| 26 | Canarana | 386.50 | 210.80 | 290.49 | 18.60 | 21.70 | 28.74 | 2.00 | 1.41 | 0.29 | 0 | 0 | 0 | 230 | 180.56 | 103.65 |
| 27 | Carlinda | 0 | 0 | 0.12 | 0 | 0 | 11.60 | 0 | 0 | 0.14 | 0 | 0 | 2.08 | 0 | 0 | 49.00 |
| 28 | Castanheira | 0 | 0 | 0 | 10 | 12.20 | 9.94 | 0.20 | 0.20 | 0.11 | 2.50 | 2.26 | 1.23 | 8.00 | 6.92 | 5.02 |
| 29 | Chapada dos Guimaraes | 38.30 | 57.20 | 47.07 | 14.00 | 26.88 | 30.28 | 0.50 | 0.50 | 0.50 | 0.30 | 0.16 | 0 | 12.00 | 20.47 | 16.64 |
| 30 | Claudia | 1.00 | 0 | 0.85 | 3.00 | 2.29 | 3.84 | 0 | 0 | 0 | 0.10 | 0 | 0.07 | 4.00 | 1.72 | 23.89 |
| 31 | Cocalinho | 0 | 1.60 | 0.58 | 95.00 | 5.96 | 4.88 | 0.05 | 0.05 | 0.05 | 0 | 0 | 0 | 81.30 | 117.53 | 30.68 |
| 32 | Colier | 0 | 0.12 | 2.10 | 20 | 44.00 | 22.10 | 0 | 0 | 0.32 | 70 | 66.32 | 11.40 | 12.50 | 31.66 | 33.00 |
| 33 | Colniza | 0 | 0 | 0 | 0 | 0 | 0 | 0 | 0 | 0 | 0 | 0 | 0 | 0 | 0 | 0 |
| 34 | Comodoro | 250 | 358.00 | 173.48 | 12.00 | 39.50 | 35.40 | 0 | 4.09 | 0 | 0.12 | 0.22 | 0.11 | 79.00 | 118.14 | 21.40 |
| 35 | Confresa | 0 | 0 | 0 | 0 | 11.83 | 68.00 | 0 | 26.61 | 41.94 | 0 | 0 | 0.03 | 0 | 41.80 | 54.60 |
| 36 | Conquista D’Oeste | 0 | 0 | 0 | 0 | 0 | 0 | 0 | 0 | 0 | 0 | 0 | 0 | 0 | 0 | 0 |
| 37 | Cotriguacu | 0 | 0 | 0 | 0 | 3.84 | 8.84 | 0 | 0.60 | 0.60 | 0 | 0.14 | 0.82 | 0 | 2.47 | 8.16 |
| 38 | Cuiaba | 11.00 | 5.40 | 0 | 15.00 | 9.84 | 6.01 | 3.80 | 2.84 | 0.32 | 0 | 0 | 0 | 20 | 7.83 | 2.01 |
| 39 | Curvelandia | 0 | 0 | 0 | 0 | 0 | 0 | 0 | 0 | 0 | 0 | 0 | 0 | 0 | 0 | 0 |
| 40 | Denise | 30 | 0.28 | 0 | 52.00 | 7.40 | 3.44 | 50.60 | 98.69 | 206.32 | 10.50 | 7.55 | 0.08 | 91.50 | 8.22 | 4.91 |
| 41 | Diamantino | 10.00 | 1512.22 | 1906.02 | 50 | 96.28 | 138.78 | 0 | 13.66 | 47.91 | 0 | 6.64 | 14.70 | 150.56 | 158.70 | 310.50 |
| 42 | Dom Aquino | 0 | 203.27 | 255.15 | 5.85 | 65.12 | 84.82 | 20.60 | 23.34 | 18.17 | 0 | 3.40 | 18.98 | 5.20 | 27.21 | 14.84 |
| 43 | Feliz Natal | 0 | 0 | 1.09 | 0 | 0 | 1.60 | 0 | 0 | 0 | 0 | 0 | 0 | 0 | 0 | 10.13 |
| 44 | Figueiropolis D’Oeste | 0 | 0 | 0 | 24.76 | 24.41 | 26.60 | 0.40 | 0.18 | 0.40 | 4.80 | 7.38 | 1.01 | 8.76 | 9.05 | 8.42 |
| 45 | Gaucha do Norte | 0 | 0 | 31.31 | 0 | 0 | 2.61 | 0 | 0 | 0.68 | 0 | 0 | 0 | 0 | 0 | 22.61 |
| 46 | General Carneiro | 108.80 | 188.26 | 317.36 | 7.00 | 18.46 | 37.00 | 0.05 | 0.05 | 0.08 | 0 | 0 | 2.80 | 25.00 | 48.58 | 12.40 |
| 47 | Gloria D’Oeste | 0 | 0.24 | 0 | 0 | 10.25 | 15.20 | 0 | 0.78 | 0.03 | 0 | 34.00 | 13.10 | 0 | 2.75 | 5.10 |
| 48 | Guaranta do Norte | 0 | 0 | 0 | 56.00 | 77.20 | 51.50 | 0.10 | 0.10 | 0.25 | 0 | 4.46 | 1.51 | 35.00 | 40 | 64.00 |
| 49 | Guiratinga | 294.72 | 277.31 | 424.50 | 15.00 | 18.52 | 62.66 | 0.15 | 0.15 | 0.15 | 0 | 0.52 | 2.91 | 15.00 | 15.51 | 13.40 |
| 50 | Indiavai | 0 | 0 | 0 | 5.00 | 4.34 | 6.82 | 0.09 | 0.09 | 0.10 | 2.00 | 1.48 | 0.30 | 4.00 | 1.89 | 1.00 |
| 51 | Ipiranga do Norte | 0 | 0 | 0 | 0 | 0 | 0 | 0 | 0 | 0 | 0 | 0 | 0 | 0 | 0 | 0 |
| 52 | Itanhang | 0 | 0 | 0 | 0 | 0 | 0 | 0 | 0 | 0 | 0 | 0 | 0 | 0 | 0 | 0 |
| 53 | Itauba | 0 | 0 | 7.42 | 13.00 | 10.80 | 10.90 | 0 | 0 | 0.12 | 10 | 2.22 | 0.52 | 16.00 | 6.96 | 17.54 |
| 54 | Itiquira | 1174.39 | 1183.88 | 1178.77 | 69.29 | 133.29 | 157.50 | 2.50 | 2.60 | 3.20 | 0 | 28.28 | 100.11 | 24.65 | 88.79 | 33.83 |
| 55 | Jaciara | 228.00 | 208.31 | 223.18 | 24.00 | 37.06 | 72.72 | 39.55 | 62.03 | 124.14 | 0.80 | 0.12 | 9.95 | 4.50 | 13.31 | 12.14 |
| 56 | Jangada | 1.40 | 1.28 | 5.17 | 3.80 | 10.46 | 7.58 | 11.00 | 6.90 | 1.73 | 0.92 | 1.34 | 0 | 6.00 | 10.07 | 6.60 |
| 57 | Jauru | 0 | 0 | 0 | 58.50 | 30.14 | 8.80 | 1.40 | 0.56 | 0.20 | 6.00 | 1.96 | 1.10 | 17.50 | 7.52 | 1.70 |
| 58 | Juara | 0 | 0 | 0 | 60 | 18.67 | 18.21 | 0 | 0 | 0.04 | 1.00 | 0.74 | 0.45 | 50 | 22.37 | 16.80 |
| 59 | Juina | 0 | 0 | 0 | 25.00 | 24.80 | 43.20 | 0.90 | 1.16 | 0.76 | 0.40 | 0.83 | 2.97 | 15.00 | 10.60 | 15.96 |
| 60 | Juruena | 0 | 0 | 0 | 15.00 | 5.40 | 10.78 | 0 | 0 | 0.12 | 0 | 0.66 | 0.65 | 7.22 | 4.00 | 5.24 |
| 61 | Juscimeira | 80.80 | 73.54 | 125.53 | 12.00 | 23.60 | 40.40 | 21.80 | 25.98 | 23.64 | 3.60 | 6.70 | 1.81 | 8.00 | 14.15 | 9.24 |
| 62 | Lambari D’Oeste | 0 | 0 | 0.03 | 0 | 9.93 | 12.40 | 0 | 12.07 | 40.73 | 0 | 8.12 | 4.43 | 0 | 6.40 | 5.40 |
| 63 | Lucas do Rio Verde | 653.51 | 867.52 | 1315.08 | 20 | 150.49 | 545.24 | 0 | 0 | 0.12 | 1.30 | 2.60 | 50.56 | 50 | 165.57 | 179.15 |
| 64 | Luciara | 7.84 | 1.00 | 0 | 13.80 | 5.56 | 0.50 | 0 | 0 | 0 | 0 | 0 | 0 | 82.98 | 53.36 | 4.58 |
| 65 | Vila Bela da Santissima Trindade | 0 | 1.20 | 0 | 15.00 | 32.87 | 45.30 | 0.70 | 0.14 | 0 | 1.40 | 3.27 | 2.08 | 12.00 | 8.60 | 10.10 |
| 66 | Marcelandia | 0 | 0 | 0 | 3.00 | 4.30 | 7.76 | 0 | 0 | 0.28 | 1.00 | 0.81 | 0.10 | 3.00 | 2.63 | 13.50 |
| 67 | Matupa | 0 | 0 | 0.47 | 13.50 | 13.10 | 27.20 | 1.50 | 1.20 | 0 | 0 | 0.48 | 0.24 | 8.80 | 8.46 | 98.00 |
| 68 | Mirassol d’Oeste | 0 | 0 | 0 | 25.00 | 12.56 | 16.72 | 21.81 | 8.58 | 0.07 | 55.00 | 55.54 | 10.50 | 15.00 | 7.99 | 7.82 |
| 69 | Nobres | 290 | 118.03 | 33.42 | 22.00 | 23.40 | 14.62 | 0.47 | 0.47 | 0.08 | 0 | 2.16 | 1.38 | 40 | 33.98 | 21.27 |
| 70 | Nortelandia | 12.00 | 28.20 | 54.91 | 3.50 | 1.90 | 15.23 | 0.10 | 0.10 | 0 | 0 | 0.03 | 0 | 8.00 | 5.12 | 15.76 |
| 71 | Nossa Senhora do Livramento | 3.80 | 0.96 | 0.40 | 32.00 | 15.69 | 11.58 | 3.50 | 3.18 | 3.35 | 0 | 0.16 | 0.02 | 24.00 | 12.79 | 7.56 |
| 72 | Nova Bandeirantes | 0 | 0 | 0 | 0 | 3.50 | 12.26 | 0 | 0.03 | 0.12 | 0 | 1.56 | 0 | 0 | 8.15 | 19.00 |
| 73 | Nova Nazare | 0 | 0 | 0 | 0 | 0 | 0 | 0 | 0 | 0 | 0 | 0 | 0 | 0 | 0 | 0 |
| 74 | Nova Lacerda | 0 | 0 | 3.20 | 0 | 0 | 4.20 | 0 | 0 | 0 | 0 | 0 | 0.25 | 0 | 0 | 3.82 |
| 75 | Nova Santa Helena | 0 | 0 | 0 | 0 | 0 | 0 | 0 | 0 | 0 | 0 | 0 | 0 | 0 | 0 | 0 |
| 76 | Nova Brasilandia | 15.00 | 1.60 | 5.20 | 20 | 31.80 | 8.00 | 0.45 | 0.36 | 0.20 | 0 | 1.03 | 0.51 | 20 | 101.40 | 57.86 |
| 77 | Nova Canaã do Norte | 0 | 0 | 0.05 | 25.00 | 21.24 | 11.68 | 0 | 0 | 0.15 | 42.00 | 34.54 | 21.36 | 25.00 | 18.20 | 21.32 |
| 78 | Nova Mutum | 668.70 | 1132.12 | 1338.66 | 13.00 | 90.47 | 202.34 | 0.10 | 0.10 | 0.02 | 0 | 2.27 | 41.64 | 27.25 | 124.09 | 231.00 |
| 79 | Nova Olimpia | 0 | 0 | 5.66 | 5.00 | 7.60 | 7.62 | 72.84 | 87.03 | 168.22 | 0 | 0.42 | 0.10 | 20 | 5.32 | 8.48 |
| 80 | Nova Ubirata | 0 | 0 | 391.99 | 0 | 0 | 54.95 | 0 | 0 | 0 | 0 | 0 | 14.78 | 0 | 0 | 87.22 |
| 81 | Nova Xavantina | 250 | 128.07 | 134.14 | 15.00 | 14.64 | 13.47 | 1.00 | 0.39 | 1.14 | 0 | 0 | 0.50 | 75.00 | 79.41 | 20 |
| 82 | Novo Mundo | 0 | 0 | 0 | 0 | 0 | 12.10 | 0 | 0 | 0 | 0 | 0 | 0.86 | 0 | 0 | 56.73 |
| 83 | Novo Horizonte do Norte | 0 | 0 | 0 | 4.00 | 9.74 | 4.90 | 0 | 0 | 0.16 | 0.35 | 1.95 | 0.59 | 5.00 | 6.94 | 9.50 |
| 84 | Novo Sao Joaquim | 321.35 | 743.39 | 958.67 | 11.35 | 30.08 | 152.24 | 0.15 | 0.38 | 0.50 | 0 | 0.24 | 169.63 | 100 | 168.04 | 103.68 |
| 85 | Paranaita | 0 | 0 | 0.40 | 21.00 | 18.38 | 17.46 | 0 | 0 | 0.18 | 0.04 | 0.89 | 0.07 | 25.00 | 21.58 | 65.92 |
| 86 | Paranatinga | 60 | 30.61 | 46.73 | 32.20 | 29.40 | 9.40 | 0.30 | 2.00 | 1.28 | 0 | 0 | 0 | 180 | 280.08 | 279.18 |
| 87 | Novo Santo Antonio | 0 | 0 | 0 | 0 | 0 | 0 | 0 | 0 | 0 | 0 | 0 | 0 | 0 | 0 | 0 |
| 88 | Pedra Preta | 357.61 | 464.59 | 467.08 | 49.25 | 68.54 | 83.56 | 0 | 0.70 | 0.70 | 15.00 | 20.58 | 61.99 | 18.37 | 17.87 | 12.35 |
| 89 | Peixoto de Azevedo | 0 | 0 | 0.06 | 10 | 19.10 | 17.95 | 0 | 0 | 0.20 | 0 | 0 | 0.32 | 8.00 | 13.30 | 55.40 |
| 90 | Planalto da Serra | 0 | 8.40 | 5.30 | 0 | 12.00 | 11.10 | 0 | 0.24 | 0.28 | 0 | 0 | 0 | 0 | 72.00 | 131.54 |
| 91 | Pocone | 0 | 0.80 | 0 | 10 | 8.52 | 5.04 | 65.00 | 19.95 | 45.82 | 0 | 0.02 | 0 | 10.03 | 7.71 | 2.84 |
| 92 | Pontal do Araguaia | 0 | 0 | 0 | 0 | 1.62 | 0.69 | 0 | 0 | 0 | 0 | 0 | 0 | 0 | 5.13 | 1.16 |
| 93 | Ponte Branca | 36.00 | 3.40 | 0 | 2.00 | 2.54 | 0.96 | 0 | 0.02 | 0 | 0 | 0 | 0 | 5.20 | 7.79 | 1.48 |
| 94 | Pontes e Lacerda | 0 | 1.30 | 0 | 70 | 39.84 | 30.10 | 0.70 | 0.46 | 0.30 | 21.00 | 10.04 | 8.10 | 30 | 30.60 | 13.90 |
| 95 | Porto Alegre do Norte | 0.70 | 0 | 0.04 | 10 | 14.60 | 12.41 | 0 | 0 | 0.02 | 0 | 0 | 0 | 49.50 | 19.30 | 19.20 |
| 96 | Porto dos Gauchos | 1.50 | 0.16 | 4.68 | 5.00 | 10.76 | 7.70 | 0.10 | 0.10 | 0.06 | 0.35 | 0.15 | 0.29 | 6.13 | 10.70 | 21.44 |
| 97 | Porto Esperidiao | 1.00 | 5.00 | 0 | 32.50 | 30.51 | 20.50 | 0.15 | 0.23 | 0.15 | 26.00 | 31.71 | 9.56 | 30 | 23.99 | 8.40 |
| 98 | Porto Estrela | 0 | 0 | 0 | 0 | 3.00 | 3.50 | 0 | 0.22 | 0.50 | 0 | 5.26 | 1.78 | 0 | 3.34 | 4.56 |
| 99 | Poxoreo | 226.46 | 272.40 | 326.82 | 16.66 | 36.45 | 74.04 | 0 | 0 | 0.36 | 0 | 2.38 | 25.74 | 32.83 | 35.67 | 35.57 |
| 100 | Primavera do Leste | 1367.33 | 1458.03 | 1531.36 | 31.52 | 151.20 | 332.51 | 0 | 0 | 0 | 0 | 0.83 | 73.98 | 81.40 | 102.24 | 98.46 |
| 101 | Querencia | 0 | 35.58 | 107.71 | 0 | 3.22 | 8.00 | 0 | 0.20 | 0.23 | 0 | 0 | 1.14 | 0 | 13.99 | 74.00 |
| 102 | Sao Jose dos Quatro Marcos | 0.34 | 0 | 0 | 35.00 | 32.38 | 20.20 | 2.00 | 1.34 | 0.12 | 24.00 | 43.19 | 11.10 | 22.80 | 9.89 | 7.20 |
| 103 | Reserva do Cabacal | 0 | 0 | 0 | 16.40 | 2.47 | 2.68 | 0.70 | 0.34 | 0.10 | 0.30 | 0.07 | 0 | 8.75 | 1.23 | 1.59 |
| 104 | Ribeirao Cascalheira | 25.00 | 0 | 0.10 | 15.60 | 12.30 | 13.35 | 0 | 0.03 | 0.01 | 0 | 0 | 0 | 50 | 35.40 | 18.20 |
| 105 | Ribeiraozinho | 0 | 3.23 | 35.25 | 0 | 1.57 | 1.02 | 0 | 0 | 0.06 | 0 | 0 | 0 | 0 | 5.17 | 5.85 |
| 106 | Rio Branco | 0 | 0 | 0 | 21.00 | 11.74 | 4.00 | 27.21 | 11.18 | 0 | 7.50 | 4.22 | 0 | 18.00 | 7.27 | 2.10 |
| 107 | Santa Carmem | 0 | 6.88 | 29.50 | 0 | 3.96 | 13.03 | 0 | 0 | 0 | 0 | 0 | 0 | 0 | 6.39 | 39.91 |
| 108 | Santo Afonso | 0 | 5.70 | 3.80 | 0 | 2.45 | 5.58 | 0 | 0.80 | 27.24 | 0 | 1.12 | 0.54 | 0 | 1.56 | 25.67 |
| 109 | Sao Jose do Povo | 0 | 0 | 0 | 0 | 7.20 | 7.20 | 0 | 0 | 0.04 | 0 | 12.76 | 12.40 | 0 | 6.60 | 5.60 |
| 110 | Sao Jose do Rio Claro | 195.00 | 181.39 | 298.57 | 25.00 | 73.34 | 21.11 | 2.00 | 22.64 | 40.76 | 0.30 | 1.50 | 10.31 | 28.00 | 61.60 | 62.38 |
| 111 | Sao Jose do Xingu | 0 | 0 | 1.24 | 0 | 4.00 | 9.40 | 0 | 0 | 0 | 0 | 0 | 0 | 0 | 8.00 | 7.74 |
| 112 | Sao Pedro da Cipa | 0 | 0 | 0 | 0 | 2.00 | 2.04 | 0 | 12.42 | 20.89 | 0 | 0.21 | 0.10 | 0 | 1.14 | 1.50 |
| 113 | Rondolandia | 0 | 0 | 0 | 0 | 0 | 0 | 0 | 0 | 0 | 0 | 0 | 0 | 0 | 0 | 0 |
| 114 | Rondonopolis | 697.36 | 508.42 | 498.91 | 94.16 | 109.69 | 110.04 | 0.90 | 1.26 | 1.60 | 23.00 | 30.48 | 98.36 | 26.65 | 31.08 | 25.45 |
| 115 | Rosario Oeste | 50 | 15.57 | 6.60 | 15.00 | 18.63 | 16.70 | 0.47 | 0.47 | 0.47 | 0 | 4.10 | 0.03 | 21.50 | 24.10 | 14.46 |
| 116 | Santa Cruz do Xingu | 0 | 0 | 0 | 0 | 0 | 0 | 0 | 0 | 0 | 0 | 0 | 0 | 0 | 0 | 0 |
| 117 | Salto do Ceu | 0 | 0 | 0 | 26.00 | 20.30 | 14.55 | 1.00 | 0.49 | 0.13 | 0.50 | 0 | 0 | 24.50 | 16.00 | 5.46 |
| 118 | Santa Rita do Trivelato | 0 | 0 | 0 | 0 | 0 | 0 | 0 | 0 | 0 | 0 | 0 | 0 | 0 | 0 | 0 |
| 119 | Santa Terezinha | 0.80 | 0 | 0.14 | 8.00 | 7.51 | 8.66 | 47.08 | 12.28 | 0 | 0 | 0 | 0 | 32.00 | 16.23 | 8.96 |
| 120 | Santo Antonio do Leste | 0 | 0 | 0 | 0 | 0 | 0 | 0 | 0 | 0 | 0 | 0 | 0 | 0 | 0 | 0 |
| 121 | Santo Antonio do Leverger | 5.00 | 12.07 | 20.16 | 12.00 | 13.02 | 15.08 | 1.37 | 1.51 | 1.16 | 0 | 0.05 | 1.56 | 10 | 14.57 | 11.54 |
| 122 | Sao Felix do Araguaia | 3.70 | 0 | 0 | 20 | 6.00 | 13.60 | 0 | 0 | 0 | 0 | 0 | 0 | 48.50 | 37.40 | 19.80 |
| 123 | Sapezal | 0 | 0 | 1582.30 | 0 | 0 | 186.95 | 0 | 0 | 0 | 0 | 0 | 143.00 | 0 | 0 | 160.55 |
| 124 | Serra Nova Dourada | 0 | 0 | 0 | 0 | 0 | 0 | 0 | 0 | 0 | 0 | 0 | 0 | 0 | 0 | 0 |
| 125 | Sinop | 58.88 | 38.89 | 98.80 | 7.50 | 23.24 | 49.60 | 0 | 0 | 0.56 | 0 | 0 | 7.90 | 60 | 57.33 | 138.00 |
| 126 | Sorriso | 1400 | 1618.65 | 2742.56 | 33.00 | 170.48 | 528.06 | 0 | 0 | 0.21 | 0 | 1.10 | 48.95 | 100 | 312.78 | 461.91 |
| 127 | Tabapora | 0 | 0 | 6.20 | 0 | 2.05 | 6.29 | 0 | 0.09 | 0 | 0 | 0 | 0.15 | 0 | 2.36 | 24.84 |
| 128 | Tangara da Serra | 168.00 | 224.60 | 261.30 | 112.00 | 99.00 | 76.00 | 14.00 | 1.89 | 66.08 | 4.20 | 10.60 | 2.98 | 40 | 57.25 | 81.22 |
| 129 | Tapurah | 216.00 | 253.88 | 390 | 7.00 | 54.76 | 78.46 | 0 | 0 | 0 | 0 | 0 | 7.35 | 22.80 | 43.54 | 220.60 |
| 130 | Terra Nova do Norte | 0 | 0.02 | 0 | 120 | 105.65 | 29.97 | 0 | 0 | 0.36 | 22.50 | 18.96 | 4.72 | 80 | 69.22 | 38.34 |
| 131 | Tesouro | 47.42 | 68.30 | 108.40 | 3.00 | 2.56 | 8.28 | 0 | 0 | 0 | 0 | 0 | 0 | 5.00 | 13.10 | 4.78 |
| 132 | Torixoreu | 33.00 | 5.26 | 28.78 | 5.00 | 4.22 | 1.10 | 0.05 | 0.05 | 0.37 | 0 | 0 | 0.21 | 13.20 | 26.17 | 5.02 |
| 133 | Uniao do Sul | 0 | 0 | 0 | 0 | 0 | 0.94 | 0 | 0 | 0 | 0 | 0 | 0 | 0 | 0 | 1.68 |
| 134 | Vale de Sao Domingos | 0 | 0 | 0 | 0 | 0 | 0 | 0 | 0 | 0 | 0 | 0 | 0 | 0 | 0 | 0 |
| 135 | Varzea Grande | 0 | 0 | 0 | 1.53 | 1.11 | 0.63 | 0.16 | 0.79 | 0.52 | 0 | 0 | 0 | 1.60 | 1.85 | 0.20 |
| 136 | Vera | 54.97 | 31.65 | 64.98 | 13.70 | 9.74 | 16.09 | 0 | 0 | 0 | 0.12 | 2.40 | 2.69 | 50.84 | 21.67 | 80.34 |
| 137 | Vila Rica | 0 | 0 | 0 | 80 | 78.60 | 37.00 | 0 | 0.50 | 0.01 | 0 | 0.42 | 0 | 12.00 | 11.80 | 8.22 |
| 138 | Nova Guarita | 0 | 0.04 | 0 | 0 | 19.60 | 14.80 | 0 | 0 | 0 | 0 | 2.99 | 3.76 | 0 | 9.00 | 13.66 |
| 139 | Nova Marilandia | 0 | 59.08 | 85.92 | 0 | 0.46 | 16.30 | 0 | 0 | 0 | 0 | 0 | 0 | 0 | 2.79 | 12.96 |
| 140 | Nova Maringa | 0 | 11.00 | 69.00 | 0 | 0.63 | 15.09 | 0 | 0 | 0.02 | 0 | 0 | 0 | 0 | 7.14 | 23.45 |
| 141 | Nova Monte Verde | 0 | 0 | 0 | 0 | 8.72 | 16.40 | 0 | 0 | 0.12 | 0 | 0.80 | 0.07 | 0 | 9.94 | 8.20 |
Appendix B
| No | Name | Cattle | Soybean | Corn | Sugarcane | Cotton | Rice |
|---|---|---|---|---|---|---|---|
| (a) The municipal district associated with deforestation | |||||||
| 14 | Aripuana | 0 | - | 0 | - | - | 0 |
| 32 | Colier | - | 0 | - | 0 | - | - |
| 37 | Cotriguacu | - | - | 0 | - | - | - |
| 40 | Denise | 216,622 | - | - | - | - | - |
| 41 | Diamantino | - | - | - | - | - | 0 |
| 59 | Juina | 0 | - | - | - | - | - |
| 60 | Juruena | - | - | - | - | 0 | - |
| 63 | Lucas do Rio Verde | - | - | - | 0 | 417,360 | - |
| 67 | Matupa | - | - | - | - | 0 | - |
| 70 | Nortelandia | - | 0 | - | - | - | - |
| 74 | Nova Lacerda | - | 0 | - | - | - | - |
| 82 | Novo Mundo | - | - | 0 | - | - | 0 |
| 83 | Novo Horizonte do Norte | - | - | - | 0 | - | - |
| 85 | Paranaita | - | - | - | - | 0 | - |
| 88 | Pedra Preta | 0 | - | - | - | - | - |
| 101 | Querencia | - | - | - | - | 0 | - |
| 107 | Santa Carmem | - | - | - | - | - | 0 |
| 109 | Sao Jose do Povo | 0 | - | - | - | - | - |
| 114 | Rondonopolis | - | - | - | - | 17,326,795 | - |
| 123 | Sapezal | - | 0 | 2,536,657 | - | - | 30,000 |
| 126 | Sorriso | - | 76,210,646 | - | 0 | 288,923 | - |
| (b) The municipal district associated with increase in DAA | |||||||
| 19 | Brasnorte | - | 0 | - | 0 | 661,646 | - |
| 24 | Campos de Julio | 0 | 113,918,312 | 0 | 0 | 0 | 0 |
| 45 | Gaucha do Norte | - | - | 0 | 0 | - | 0 |
| 61 | Juscimeira | - | - | 0 | - | - | - |
| 84 | Novo Sao Joaquim | - | - | - | - | 0 | - |
| 94 | Pontes e Lacerda | - | - | 0 | - | 0 | - |
| 98 | Porto Estrela | - | - | 0 | - | - | - |
| 100 | Primavera do Leste | - | - | 0 | - | - | - |
| 131 | Tesouro | - | - | 0 | - | - | - |
| 139 | Nova Marilandia | - | - | 0 | - | - | - |
| 141 | Nova Monte Verde | - | - | - | - | - | 0 |
| No | Name | Cattle | Soybean | Corn | Sugarcane | Cotton | Rice |
|---|---|---|---|---|---|---|---|
| (a) The municipal district associated with deforestation | |||||||
| 14 | Aripuana | 0 | - | 0 | - | - | 0 |
| 32 | Colier | - | 0 | - | 0 | - | - |
| 37 | Cotriguacu | - | - | 0 | - | - | - |
| 40 | Denise | 216,622 | - | - | - | - | - |
| 41 | Diamantino | - | - | - | - | - | 0 |
| 59 | Juina | 0 | - | - | - | - | - |
| 60 | Juruena | - | - | - | - | 0 | - |
| 63 | Lucas do Rio Verde | - | - | - | 0 | 417,360 | - |
| 67 | Matupa | - | - | - | - | 0 | - |
| 70 | Nortelandia | - | 12,681,520 | - | - | - | - |
| 74 | Nova Lacerda | - | 0 | - | - | - | - |
| 82 | Novo Mundo | - | - | 0 | - | - | 0 |
| 83 | Novo Horizonte do Norte | - | - | - | 0 | - | - |
| 85 | Paranaita | - | - | - | - | 0 | - |
| 88 | Pedra Preta | 0 | - | - | - | - | - |
| 101 | Querencia | - | - | - | - | 0 | - |
| 107 | Santa Carmem | - | - | - | - | - | 0 |
| 109 | Sao Jose do Povo | 0 | - | - | - | - | - |
| 114 | Rondonopolis | - | - | - | - | 17,326,795 | - |
| 123 | Sapezal | - | 0 | 2,536,657 | - | - | 30,000 |
| 126 | Sorriso | - | 76,210,646 | - | 0 | 288,923 | - |
| (b) The municipal district associated with increase in DAA | |||||||
| 19 | Brasnorte | - | 2,358,929,385 | - | 0 | 14,123,373 | - |
| 24 | Campos de Julio | 0 | 5,002,378,807 | 3,454,018,932 | 0 | 28,235,846 | 0 |
| 45 | Gaucha do Norte | - | - | 54,691,618 | 0 | - | 0 |
| 61 | Juscimeira | - | - | 0 | - | - | - |
| 84 | Novo Sao Joaquim | - | - | - | - | 0 | - |
| 94 | Pontes e Lacerda | - | - | 0 | - | 0 | - |
| 98 | Porto Estrela | - | - | 0 | - | - | - |
| 100 | Primavera do Leste | - | - | 0 | - | - | - |
| 131 | Tesouro | - | - | 0 | - | - | - |
| 139 | Nova Marilandia | - | - | 0 | - | - | - |
| 141 | Nova Monte Verde | - | - | - | - | - | 0 |
References
- Park, C.C. Tropical Rainforests; Rutledge: New York, NY, USA, 1992; p. 204. [Google Scholar]
- Southworth, J.; Marsik, M.; Qiu, Y.; Perz, S.; Cumming, G.; Stevens, F.; Rocha, K.; Duchelle, A.; Barnes, G. Roads as drivers of changes: Trajectories across the Tri-national Frontier MAP, the Southwestern Amazon. Remote Sens. 2011, 3, 1047–1066. [Google Scholar] [CrossRef]
- Morton, D.C.; DeFries, R.S.; Shimabukuro, Y.E.; Anderson, L.O.; Arai, E.; Espírito-Santo, D.B.F.; Freitas, R.; Morisette, J. Cropland expansion changes deforestation dynamics in the southern Brazilian Amazon. Proc. Natl. Acad. Sci. USA 2006, 103, 14637–14641. [Google Scholar] [CrossRef]
- Asner, G.P.; Knapp, D.E.; Broadbent, E.N.; Oliveira, P.J.C. Selective Logging in the Brazil Amazon. Science 2005, 310, 21. [Google Scholar] [CrossRef]
- Bowman, M.S.; Soares-Filho, B.S.; Merry, F.D.; Nepstad, D.C.; Rodrigues, H.; Almeida, O.T. Persistence of cattle ranching in the Brazilian Amazon: A spatial analysis of the rationale for beef production. Land Use Policy 2012, 29, 558–568. [Google Scholar] [CrossRef]
- Alexandratos, N.; Bruinsma, J. World Agriculture towards 2030/2050 The 2012 Revision; Food and Agricultural Organisation: Rome, Italy, 2012. [Google Scholar]
- Rudorff, B.F.T.; Amdami, M.; Aguiar, D.A.; Moreira, M.A.; Mello, M.P.; Fabiani, L.; Amaral, D.F.; Pires, B.M. The Soy Moratorium in the Amazon biome monitored by remote sensing images. Remote Sens. 2011, 3, 185–202. [Google Scholar] [CrossRef]
- Geist, H.; Lambin, E. Proximate Causes and Underlying Driving Forces of Tropical Deforestation. BioScience 2002, 52, 143–150. [Google Scholar] [CrossRef]
- Nepstad, D.C.; Stickler, C.M.; Almeida, O.T. Globalization of the Amazon soy and beef industries: Opportunities for conservation. Conserv. Biol. 2006, 20, 1595–1603. [Google Scholar] [CrossRef]
- Gibbs, H.K.; Ruesch, A.S.; Achard, F.; Clayton, M.K.; Holmgren, P.; Ramankutty, N.; Foley, J.A. Tropical forests were the primary sources of new agricultural land in the 1980s and 1990s. Proc. Natl. Acad. Sci. USA 2010, 107, 16732–16737. [Google Scholar] [CrossRef] [PubMed]
- Lapola, D.M.; Martinelli, L.A.; Peres, C.A.; Ometto, J.P.H.B.; Ferreira, M.E.; Nobre, C.A.; Aguiar, A.P.D.; Bustamante, M.M.C.; Cardoso, M.F.; Costa, M.H.; et al. Pervasive transition of the Brazilian land-use system. Nat. Clim. Change 2014, 4, 27–35. [Google Scholar] [CrossRef]
- WWF-BRAZIL. Production and Exportation of Brazilian Soy and the Cerrado 2001–2010; WWF-Brazil: Brazilia, Brazil, 2012; p. 28. [Google Scholar]
- Malingreau, J.P.; Eva, H.D.; Miranda, E.E. Brazilian Amazon: A Significant Five Year Drop in Deforestation Rates but Figures are on the Rise Again. Ambio 2012, 41, 309–314. [Google Scholar] [CrossRef]
- Malhado, A.C.M.; Pires, G.F.; Costa, M.H. Cerrado conservation is essential to protect the Amazon rainforest. Ambio 2010, 39, 580–584. [Google Scholar] [CrossRef]
- Arai, E.; Shimabukuro, Y.E.; Pereira, G.; Vijaykumar, N.L. A multi-resolution multi-temporal technique for detecting and mapping deforestation in the Brazilian Amazon rainforest. Remote Sens. 2011, 3, 1943–1956. [Google Scholar] [CrossRef]
- Cardoso, F.S.; Shimabukuro, Y.E.; Pereira, G.; Silva, F.B. Using remote sensing products for environmental analysis in South America. Remote Sens. 2011, 3, 2110–2127. [Google Scholar] [CrossRef]
- Eva, H.D.; Achard, F.; Beuchle, R.; de Miranda, E.; Carboni, S.; Seliger, R.; Vollmar, M.; Holler, W.A.; Oshiro, O.T.; Arroyo, V.B.; et al. Forest cover changes in the tropical South and Central America from 1990 to 2005 and related Carbon emissions and removals. Remote Sens. 2012, 4, 1369–1391. [Google Scholar] [CrossRef]
- Mueller, C.C. Expansion and Modernization of Agriculture in the Cerrado—The Case of Soybeans in Brazil’s Center-West. University of Brasilia, Department of Economics: Brasilia, Brazil, 2003; p. 28. [Google Scholar]
- Nepstad, D.; McGrath, D.; Stickler, C.; Alencar, A.; Azevedo, A.; Swette, B.; Bezerra, T.; DiGiano, M.; Shimada, J.; Seroa da Motta, R.; et al. Slowing Amazon deforestation through public policy and interventions in beef and soy supply chains. Science 2014, 344, 1118–1123. [Google Scholar] [CrossRef]
- Fearnside, P.M. Soybean cultivation as a threat to the environment in Brazil. Environ. Conserv. 2001, 28, 23–28. [Google Scholar] [CrossRef]
- Brown, J.C.; Koeppe, M.; Coles, B.; Price, K.P. Soybean production and conversion of tropical forest in the Brazilian Amazon the case of Vilhena, Rondõnia. Ambio 2005, 34, 462–469. [Google Scholar] [CrossRef]
- Barona, E.; Ramankutty, N.; Hyman, G.; Coomes, O.T. The role of pasture and soybean in deforestation of the Brazilian Amazon. Environ. Res. Lett. 2010, 5, 024002. [Google Scholar] [CrossRef]
- Ferrante, L.; Fearnside, P.M. Fearnside Countries should boycott Brazil over export-driven deforestation. Nature 2022, 601, 318. [Google Scholar] [CrossRef]
- Kuschnig, N.; Cuaresma, J.C.; Krisztin, T.; Giljum, S. Spatial spillover effects from agriculture drive deforestation in Mato Grosso, Brazil. Sci. Rep. 2021, 11, 21804. [Google Scholar] [CrossRef]
- Lapola, D.M.; Schaldach, R.; Alcamo, J.; Bondeau, A.; Koch, J.; Koelking, C.; Priess, J.A. Indirect land-use changes can overcome carbon savings from biofuels in Brazil. Proc. Natl. Acad. Sci. USA 2010, 107, 3388–3393. [Google Scholar] [CrossRef]
- Arima, E.Y.; Richards, P.; Walker, R.; Caldas, M.M. Statistical confirmation of indirect land use change in the Brazilian Amazon. Environ. Res. Lett. 2011, 6, 024010. [Google Scholar] [CrossRef]
- Wagner, F.H.; Dalagnol, R.; Silva-Junior, C.H.; Carter, G.; Ritz, A.L.; Hirye, M.C.; Saatchi, S. Mapping tropical forest cover and deforestation with Planet NICFI satellite images and deep learning in Mato Grosso State (Brazil) from 2015 to 2021. Remote Sens. 2023, 15, 521. [Google Scholar] [CrossRef]
- Buonincontri, M.P.; Bosso, L.; Smeraldo, S.; Chiusano, M.L.; Pasta, S.; Di Pasquale, G. Shedding light on the effects of climate and anthropogenic pressures on the disappearance of Fagus sylvatica in the Italian lowlands: Evidence from archaeo-anthracology and spatial analyses. Sci. Total Environ. 2023, 877, 162893. [Google Scholar] [CrossRef]
- Leijten, F.; Baldos, U.L.C.; Johnson, J.A.; Sim, S.; Verburg, P.H. Projecting global oil palm expansion under zero-deforestation commitments: Direct and indirect land use change impacts. Iscience 2023, 26, 106971. [Google Scholar] [CrossRef]
- Guerra, A.; Reis, L.K.; Borges, F.L.G.; Ojeda, P.T.A.; Pineda, D.A.M.; Miranda, C.O.; Garcia, L.C. Ecological restoration in Brazilian biomes: Identifying advances and gaps. For. Ecol. Manag. 2020, 458, 117802. [Google Scholar] [CrossRef]
- da Cruz, D.C.; Benayas, J.M.R.; Ferreira, G.C.; Santos, S.R.; Schwartz, G. An overview of forest loss and restoration in the Brazilian Amazon. New For. 2021, 52, 1–16. [Google Scholar] [CrossRef]
- Arima, E.Y.; Barreto, P.; Araújo, E.; Soares-Filho, B. Public policies can reduce tropical deforestation: Lessons and challenges from Brazil. Land Use Policy 2014, 41, 465–473. [Google Scholar] [CrossRef]
- Soares-Filho, B.; Moutinho, P.; Nepstad, D.; Anderson, A.; Rodrigues, H.; Garcia, R.; Dietzsch, L.; Merry, F.; Bowman, M.; Hissa, L.; et al. Role of Brazilian Amazon protected areas in climate change mitigation. Proc. Natl. Acad. Sci. USA 2010, 107, 10821–10826. [Google Scholar] [CrossRef]
- Assunção, J.; Gandour, C.; Rocha, R.; Rocha, R. The effect of rural credit on deforestation: Evidence from the Brazilian Amazon. Econ. J. 2020, 130, 290–330. [Google Scholar] [CrossRef]
- Cisneros, E.; Zhou, S.L.; Börner, J. Naming and shaming for conservation: Evidence from the Brazilian Amazon. PLoS ONE 2015, 10, e0136402. [Google Scholar] [CrossRef]
- Assunção, J.; Rocha, R. Getting Greener by Going Black: The Priority Municipalities in Brazil; Climate Policy Initiative: Rio de Janeiro, Brazil, 2014. [Google Scholar]
- Heilmayr, R.; Rausch, L.L.; Munger, J.; Gibbs, H.K. Brazil’s Amazon soy moratorium reduced deforestation. Nat. Food 2020, 1, 801–810. [Google Scholar] [CrossRef]
- Gibbs, H.K.; Munger, J.; L’Roe, J.; Barreto, P.; Pereira, R.; Christie, M.; Amaral, T.; Walker, N.F. Did ranchers and slaughterhouses respond to zero-deforestation agreements in the Brazilian Amazon? Conserv. Lett. 2016, 9, 32–42. [Google Scholar] [CrossRef]
- Instituto Nacional de Pesquisas Espaciais (INPE) PROJETO PRODES Monitoramento da Floresta Amazônica Brasileira por Satélite 2022. Available online: http://www.obt.inpe.br/OBT/assuntos/programas/amazonia/prodes (accessed on 13 September 2023).
- Silvério, D.V.; Oliveira, R.S.; Flores, B.M.; Brando, P.M.; Almada, H.K.; Furtado, M.T.; Macedo, M.N. Intensification of fire regimes and forest loss in the Território Indígena do Xingu. Environ. Res. Lett. 2022, 17, 045012. [Google Scholar] [CrossRef]
- Fearnside, P.M. Deforestation control in Mato Grosso: A new model for slowing the loss of Brazil’s Amazon Forest. Ambio 2003, 32, 343–345. [Google Scholar] [CrossRef]
- Junk, W.J.; Da Cunha, C.N.; Wantzen, K.M.; Petermann, P.; Strüssmann, C.; Marques, M.I.; Adis, J. Biodiversity and its conservation in the Pantanal of Mato Grosso, Brazil. Aquat. Sci. 2006, 68, 278–309. [Google Scholar] [CrossRef]
- Souza, A.P.; Mota, L.L.; Zamadei, T.; Martin, C.C.; Almeida, F.T.; Paulino, J. Classificação Climática E Balanço Hídrico Climatológico No Estado De Mato Grosso. Nativa 2013, 1, 34–43. [Google Scholar] [CrossRef]
- IBGE (Brazilian Institute of Geography and Statistics). Mapas Interativos; IBGE: Rio de Janeiro, Brazil, 2005.
- Yoshikawa, S.; Sanga-Ngoie, K. Deforestation Dynamics in Mato Grosso in the Southern Brazilian Amazon using GIS and NOAA/ AVHRR data. Int. J. Remote Sens. 2011, 32, 523–544. [Google Scholar] [CrossRef]
- Sistem IBGE de Recuperação Automática (SIDRA) Municipal Livestock Survey Table 73—Herd Efficiency, by Type of Herd, IBGE. Available online: https://sidra.ibge.gov.br/tabela/73 (accessed on 13 September 2023).
- Sistem IBGE de Recuperação Automática (SIDRA) Municipal Agricultural Production Table 1612—Planted Area, Harvested Area, Quantity Produced, Average Yield and Production Value of Temporary Crops, IBGE. Available online: https://sidra.ibge.gov.br/Tabela/1612 (accessed on 13 September 2023).
- Ministério do Desenvolvimento, Indústria, e Comércio Exterior (MDIC), Exports and imports of Cities, COMEX STAT. Available online: http://comexstat.mdic.gov.br/en/municipio (accessed on 13 September 2023).
- Anselin, L.; Syabri, I.; Kho, Y. GeoDa: An Introduction to Spatial Data Analysis. Geogr. Anal. 2006, 38, 5–22. [Google Scholar] [CrossRef]
- Greenpeace. Eating up the Amazon; Greenpeace International: Amsterdam, The Netherlands, 2006; p. 62. [Google Scholar]
- US Department of Agriculture, Foreign Agriculture Service (FAS/USDA). Commodity Intelligence Report; US Department of Agriculture: Washington, DC, USA, 2007.
- Martinelli, L.A.; Filoso, S. Expansion of sugarcane ethanol production in Brazil: Environmental and social challenges. Ecol. Appl. 2008, 18, 885–898. [Google Scholar] [CrossRef]
- Yoshikawa, S.; Sanga-Ngoie, K. Deforestation and Expansion of the Agro-Pastoral Frontier in Mato Grosso, Brazil. J. Remote Sens. Soc. Jpn. 2011, 31, 27–35. [Google Scholar]
- Macedo, M.; DeFries, R.; Morton, D.; Stickler, C.; Galford, G.; Shimabukuro, Y. Decoupling of deforestation and soy production in the southern Amazon during the late 20s. Proc. Natl. Acad. Sci. USA 2012, 109, 1341–1346. [Google Scholar] [CrossRef]
- Greenpeace–Brazil. Amazon Cattle Footprint. Mato Grosso: State of Destruction; Greenpeace International: Amsterdam, The Netherlands, 2009; p. 15. [Google Scholar]
- Bonti-Ankomah, S.; Fox, G. Hamburgers and the Rainforest–a Review of Issues and Evidence. J. Agric. Environ. Ethics 1997, 10, 153–182. [Google Scholar] [CrossRef]
- Leite, C.C.; Costa, M.H.; Soares-Filho, B.S.; Barros Viana Hissa, L. Historical land use change and associated carbon emissions in Brazil from 1940 to 1995. Glob. Biogeochem. Cycles 2012, 26, GB2011. [Google Scholar] [CrossRef]
- Brandao, A.S.P.; Castro, R.G.; Da Costa Marques, R.W. Agricultural Growth in the Period 1999–2004, Outburst in Soybeans Area and Environmental Impacts in Brazil; IPEA, Institute for Applied Economic Research: Rio de Janeiro, Brazil, 2005; pp. 1–20. [Google Scholar]
- Fearnside, P.M. China’s carbon emissions in Brazil. Science 2021, 373, 1209–1210. [Google Scholar] [CrossRef]
- Richards, P.D.; Myers, R.J.; Swinton, S.M.; Walker, R.T. Exchange rates, soybean supply response, and deforestation in South America. Glob. Environ. Change 2012, 22, 454–462. [Google Scholar] [CrossRef]
- VanWey, L.K.; Spera, S.; de Sa, R.; Mahr, D.; Mustard, J.F. Socioeconomic development and agricultural intensification in Mato Grosso. Philos. Trans. R. Soc. B Biol. Sci. 2013, 368, 20120168. [Google Scholar] [CrossRef]
- Jusys, T.A. Confirmation of the indirect impact of sugarcane on deforestation in the Amazon. J. Land Use Sci. 2017, 12, 125–137. [Google Scholar] [CrossRef]
- Lima, M.; da Silva Junior, C.A.; Pelissari, T.D.; Lourençoni, T.; Luz, I.M.S.; Lopes, F.J.A. Sugarcane: Brazilian public policies threaten the Amazon and Pantanal biomes. Perspect. Ecol. Conserv. 2020, 18, 210–212. [Google Scholar] [CrossRef]
- G1 Maior Produtor de Etanol de Milho do País, MT Deve Ter 5 Novas Usinasaté 2021. 2019. Available online: https://g1.globo.com/mt/mato-grosso/maisagromt/noticia/2019/10/17/maior-produtor-de-etanol-de-milho-do-pais-mt-deve-ter-5-novas-usinas-ate-2021.ghtml (accessed on 13 September 2023).
- Carauta, M.; Parussis, J.; Hampf, A.; Libera, A.; Berger, T. No more double cropping in Mato Grosso, Brazil? Evaluating the potential impact of climate change on the profitability of farm systems. Agric. Syst. 2021, 190, 103104. [Google Scholar] [CrossRef]
- Ferrante, L.; Fearnside, P.M. Brazil’s new president and ‘ruralists’ threaten Amazonia’s environment, traditional peoples and the global climate. Environ. Conserv. 2019, 46, 261–263. [Google Scholar] [CrossRef]
- Reuters, Brazil Stops Tracking Savanna Deforestation Despite Rising Destruction. 2022. Available online: https://www.reuters.com/markets/us/brazil-stops-tracking-savanna-deforestation-despite-rising-destruction-2022-01-06/ (accessed on 13 September 2023).
- Mayaux, P.; Lambin, E.F. Estimation of tropical forest area from coarse spatial resolution data: A two-step correlation function for proportional errors due to spatial aggregation. Remote Sens. Environ. 1995, 53, 1–15. [Google Scholar] [CrossRef]
- Matricardi, E.A.T.; Skole, D.L.; Pedlowski, M.A.; Chomentowski, W. Assessment of forest disturbances by selective logging and forest fires in the Brazilian Amazon using Landsat data. Int. J. Remote Sens. 2013, 34, 1057–1086. [Google Scholar] [CrossRef]
- MapBiomas. Série Brasileira de Mapas de Cobertura e Uso da Terra: Coleções MapBiomas. Available online: https://brasil.mapbiomas.org/ (accessed on 13 September 2023).

| Data Set | Periods | Spatial Scale |
|---|---|---|
| 5-year DVM Maps (Phase I, II, III and IV) [45] | 1981–2001 | 0.1 degree × 0.1 degree |
| SIDRA, Municipal Livestock Survey, IBGE [46] | 1981–2001 | 144 municipal districts |
| SIDRA, Municipal Agricultural Production, IBGE [47] | 1990–2001 | 144 municipal districts |
| Comex Stat, Exports and imports of Cities, MDIC [48] | 1997–2001 | 144 municipal districts |
| State boundary, Malha Municipal Digital, IBGE (line) | 1997 | 1:5,000,000 |
| River, main road, park and area inhabited by indigenous people maps, Mapa da Série Brasil Geográfico, IBGE (line) | 2002 | 1:5,000,000 |
| Land Cover Types | Phase I (July 1981–June 1986) | Phase II (July 1986–June 1991) | Phase III (July 1991–June 1996) | Phase IV (July 1996–June 2001) |
|---|---|---|---|---|
| f1 | 345,000 | 167,000 | 149,000 | 125,000 |
| f2 | 387,000 | 529,000 | 495,000 | 391,000 |
| DAA | 136,000 | 166,000 | 153,000 | 187,000 |
| Sv | 35,000 | 44,000 | 109,000 | 203,000 |
| Total | 906,000 | 906,000 | 906,000 | 906,000 |
Disclaimer/Publisher’s Note: The statements, opinions and data contained in all publications are solely those of the individual author(s) and contributor(s) and not of MDPI and/or the editor(s). MDPI and/or the editor(s) disclaim responsibility for any injury to people or property resulting from any ideas, methods, instructions or products referred to in the content. |
© 2023 by the author. Licensee MDPI, Basel, Switzerland. This article is an open access article distributed under the terms and conditions of the Creative Commons Attribution (CC BY) license (https://creativecommons.org/licenses/by/4.0/).
Share and Cite
Yoshikawa, S. Agro-Pastoral Expansion and Land Use/Land Cover Change Dynamics in Mato Grosso, Brazil. Earth 2023, 4, 823-844. https://doi.org/10.3390/earth4040044
Yoshikawa S. Agro-Pastoral Expansion and Land Use/Land Cover Change Dynamics in Mato Grosso, Brazil. Earth. 2023; 4(4):823-844. https://doi.org/10.3390/earth4040044
Chicago/Turabian StyleYoshikawa, Sayaka. 2023. "Agro-Pastoral Expansion and Land Use/Land Cover Change Dynamics in Mato Grosso, Brazil" Earth 4, no. 4: 823-844. https://doi.org/10.3390/earth4040044
APA StyleYoshikawa, S. (2023). Agro-Pastoral Expansion and Land Use/Land Cover Change Dynamics in Mato Grosso, Brazil. Earth, 4(4), 823-844. https://doi.org/10.3390/earth4040044